Retirement income policies in Australia and New Zealand - Facing the fiscal challenge from an ageing population - NZIER
←
→
Page content transcription
If your browser does not render page correctly, please read the page content below

If I just change the title

Retirement income policies in Australia
and New Zealand
Facing the fiscal challenge from an ageing population

NZIER final report to Chartered Accountants Australia and New Zealand
March 2018

About NZIER
NZIER is a specialist consulting firm that uses applied economic research and analysis
to provide a wide range of strategic advice to clients in the public and private sectors,
throughout New Zealand and Australia, and further afield.
NZIER is also known for its long-established Quarterly Survey of Business Opinion and
Quarterly Predictions.
Our aim is to be the premier centre of applied economic research in New Zealand. We
pride ourselves on our reputation for independence and delivering quality analysis in
the right form, and at the right time, for our clients. We ensure quality through
teamwork on individual projects, critical review at internal seminars, and by peer
review at various stages through a project by a senior staff member otherwise not
involved in the project.
Each year NZIER devotes resources to undertake and make freely available economic
research and thinking aimed at promoting a better understanding of New Zealand’s
important economic challenges.
NZIER was established in 1958.

Authorship
This paper was prepared at NZIER by Derek Gill, Mike Hensen and Peter Wilson.
It was quality approved by John Ballingall.
The support from Tony Negline and the expert guidance from Ross Guest, Kirsten
MacDonald and Malcolm Menzies is gratefully acknowledged. Thanks also to Sarah
Woollett and George Glubb of ResearchNow for their cooperation with undertaking
the survey.

L13 Willeston House, 22-28 Willeston St | PO Box 3479, Wellington 6140
Tel +64 4 472 1880 | econ@nzier.org.nz
© NZ Institute of Economic Research (Inc). Cover image © Dreamstime.com
NZIER’s standard terms of engagement for contract research can be found at www.nzier.org.nz.
While NZIER will use all reasonable endeavours in undertaking contract research and producing reports to ensure the
information is as accurate as practicable, the Institute, its contributors, employees, and Board shall not be liable (whether in
contract, tort (including negligence), equity or on any other basis) for any loss or damage sustained by any person relying on
such work whatever the cause of such loss or damage.
Key points
Facing the fiscal challenge from an ageing population
Chartered Accountants Australia and New Zealand (CAANZ) commissioned NZIER to
investigate attitudes to retirement income policies in New Zealand and Australia in
light of the fiscal consequences of population ageing and both countries’ fraught
history of reforms in this space.
Both countries face an ageing population increasing the cost of their Pillar 1
superannuation/pension schemes. While the main focus of the work was looking
forward, we briefly surveyed the two countries’ experience with pension reform to
understand the starting point. We then explored the fiscal outlook in both
jurisdictions.
We worked with ResearchNow to produce the first survey that compares New
Zealanders’ and Australians’ attitudes to retirement income and their preferences on
how retirement incomes policies should be reformed.

Both countries have a long history of publicly-funded pensions: the only
constant is change
Public pension systems funded from general taxation have been in place in both
countries since the beginning of the 19th century. Public pension spending is relatively
low by OECD standards but so are poverty rates amongst the aged.
Where the two countries’ regimes differ is in the second-tier occupational
superannuation: Australia has compulsory private superannuation, New Zealand a
voluntary scheme with automatic enrolment and a limited opt-out opportunity. Both
private schemes have been the target of repeated reforms.

Despite similar population forecasts the fiscal outlook is quite different
Both New Zealand and Australia face similar ageing populations but the future settings
for retirement policy, and their fiscal outlooks, are different.
In New Zealand, the National Government under John Key and now the Labour
Government under Jacinda Ardern have pledged to retain the age of eligibility for New
Zealand Super at age 65. In Australia, an increase to 67 is underway with a planned
further increase to 70.
As a result, the medium term fiscal impact of population ageing is quite different, with
the pension cost to GDP ratio in New Zealand projected to rise by 60% in 40 years. In
Australia by contrast, the corresponding increase is around 25% under current policies
and a small decline if the announced entitlement age increase to 70 is enacted.

New Zealand and Australia have opted to take different approaches to
the fiscal challenge
Across the OECD around half the governments have undertaken major pension reform.
In Australia, it is widely accepted that older citizens suffer from reform fatigue and are
sick of constant change. There are strongly held views about increases in the minimum
pension age, protection of the family home from asset testing, and that the Age
Pension is an entitlement.

NZIER report – Retirement income policies in Australia and New Zealand                   i
In New Zealand, with the notable exception of the short-lived changes announced by
the Bill English administration, there have been no significant changes announced to
superannuation policy since the introduction of KiwiSaver and moving to part-funding
of the NZ Super Fund in the 2000s.

High awareness of New Zealand Super and the Australian Age Pension
but less of the detailed operation
Our survey shows around half of Australians and New Zealanders are ‘thinking
somewhat’ about retirement planning and awareness of the Age Pension and New
Zealand Super is high (92% in Australia, 87% in New Zealand). For example, in both
countries, four in five people know that almost anyone aged over 65 can receive the
Age Pension/New Zealand Super payments.
However, respondents are less familiar with the level of payment, how the schemes
were funded and in the case of Kiwis whether income and asset testing is applied.

Remarkable similarities in New Zealanders’ and Australians’ attitudes to
retirement incomes policies
Across a range of questions there were remarkable similarities between New
Zealanders’ and Australians’ attitudes. This was quite striking given how the two
regimes have diverged over time with very different approaches to Pillar 2 and income
and asset testing in Pillar 1. For example, at least two-thirds of Australians and almost
three-quarters of New Zealanders are aware that New Zealand Super/Age Pension will
cost more in the future.

Young people less likely to believe that the Age Pension/New Zealand
Super will exist in its current form when they retire
Unsurprisingly younger people’s responses differed from those of currently retired
regarding the continuity of the scheme. Thirty-three percent of younger Aussie survey
respondents and 39% of Kiwis said that the scheme will exist in its current form
compared to 77% and 89%, respectively for the over 65s. Nonetheless there is still a
significant minority of younger people who believe the scheme will continue.
Overall New Zealanders were more confident than Australians about policy stability,
which presumably reflects the frequency of changes to the policy regime in Australia
compared to New Zealand.

We will need more than public education to change the debate
The survey split respondents into a group that received supplementary information
before answering the questions on their policy preferences and those that didn’t. Yet
there was no real difference between the answers of the two groups.
The lack of daylight between information and non-information responses suggests
public education on population ageing is unlikely on its own to move the debate
forward.

NZIER report – Retirement income policies in Australia and New Zealand                 ii
Little consensus on preferred policy options to manage rising costs…
Faced with rising costs both New Zealanders and Australians were reluctant to
contemplate major changes to the Pillar 1 scheme and were divided about tax
increases.
The strongest opposition is to reductions in the amount paid across the board. There
is mixed support for increasing the age of entitlement, amending how adjustments
occur (by linking to prices rather than wages) or pre-funding through increased current
taxes.

… although means testing is the option with the highest support
The least unpopular option with New Zealanders and Australians was the use of
income and asset testing to determine how much government should pay to NZ
super/Age pension recipients. However, respondents were strongly against the family
home being used in means testing.
The depth of support for means testing is doubtful in New Zealand at least, as the
Treasury study (Au et al (2015)), which used a different approach, found limited
support for it.

The intergenerational compact is intact
We found little evidence of a distinct generational divide in the views on the policy
options for dealing with the increased costs of New Zealand Super and the Age
Pension. This is consistent with a range of studies which found weak effects or no
evidence of self-interested responses. Among the young there was strong support for
the continuation of the current policy settings even though the aged benefitted at their
expense. For example, support for increasing the age or lowering the amount paid was
lowest amongst 25-54 year olds and highest amongst those 65+.
Age did have some influence on policy preferences however. For example, amongst
Kiwis support for continuing New Zealand Super at a universal amount (with no income
or assets testing) increased very gradually with age: 25-34 years (39%), 45-55 (45%),
55-64 (64%), over 65 (78%).

Our survey indicates that politicians are between a rock and a hard
place: the public resists changes despite knowing it will cost
significantly more in the future
Politicians face the problem that there is no strong support for any one option for
reform. The public are resistant to changes and divided over the prospect of an
increase in taxes to fund the inevitable increase in costs. The public’s dominant
preference is that the status quo persists and that the government pension should be
provided universally, without a means-test in New Zealand and with continued means
testing in Australia. However, opposition to increasing the age and changing the basis
of indexation reduced significantly if the policy changes are phased in over 10-20 years.

Strong political and technocratic leadership crucial for pension reform
Key supporting conditions likely to sustain pension reform include an electoral
mandate, government leadership and cohesion, and persistence. These need to be
accompanied by research and analysis and effective communication. Both New

NZIER report – Retirement income policies in Australia and New Zealand                 iii
Zealand and Australian governments have demonstrated in the past the ability to drive
through successful reform.
We trust this study contributes supporting the momentum by providing the research
and analysis about what Australians and New Zealanders believe and want from the
public pension system.

NZIER report – Retirement income policies in Australia and New Zealand             iv
Contents
1.         Our approach .................................................................................................... 1
           1.1.          Attitudes to retirement income policies ........................................... 1
           1.2.          Phases of work .................................................................................. 1
2.         A history of pension policy ................................................................................ 2
           2.1.          The current systems .......................................................................... 2
           2.2.          Australia ............................................................................................ 3
           2.3.          New Zealand ...................................................................................... 6
           2.4.          Conclusion ....................................................................................... 11
3.         The common fiscal challenge .......................................................................... 12
           3.1.          Demographic change....................................................................... 12
           3.2.          On average, we are living a lot longer ............................................. 12
           3.3.          And families are having fewer children........................................... 13
           3.4.          Sizing up the challenge .................................................................... 15
           3.5.          Crisis, what crisis?............................................................................ 20
4.         Survey results .................................................................................................. 23
           4.1.          New survey comparing Kiwis’ attitudes across time with those of
                         Australians ....................................................................................... 23
           4.2.          Thinking and planning for retirement ............................................. 24
           4.3.          Public understanding of New Zealand Super or the Age Pension ... 25
           4.4.          Understanding of the increased cost of retirement incomeless
                         policies............................................................................................. 26
           4.5.          Policy options for dealing with the increased cost ......................... 26
5.         The political economy of pension reform ....................................................... 29
           5.1.          The policy window model................................................................ 31
6.         Reflections on trans-Tasman experiences with retirement income reform... 32
           6.1.          What are the similarities and differences between New Zealand and
                         Australia?......................................................................................... 32
           6.2.          What is blocking discussion? ........................................................... 33
           6.3.          What can clear the roadblocks? ...................................................... 33

Appendices
Appendix A Bibliography.............................................................................................. 35
Appendix B Literature scan .......................................................................................... 38

NZIER report – Retirement income policies in Australia and New Zealand                                                         v
Figures Figure 1 Australia: major superannuation policy developments ................................................. 4 Figure 2 Integration in the Australian system is incomplete ....................................................... 5 Figure 3 New Zealand: major superannuation policy developments .......................................... 6 Figure 4 Spending on social welfare peaked in the early 1990s .................................................. 7 Figure 5 Kiwisaver membership is growing ................................................................................. 9 Figure 6 Pension funds are expanding....................................................................................... 11 Figure 7 New Zealand men are living much longer ................................................................... 13 Figure 8 New Zealand women are having fewer children, later in life ...................................... 14 Figure 9 Australian women are also delaying child bearing ...................................................... 14 Figure 10 Forecast pension payments ....................................................................................... 17 Figure 11 Health care plus aged care spending ......................................................................... 19 Figure 12 Pension spending in Australasia compared to the OECD average ............................. 21 Figure 13 Pension spending in Australasia is low by OECD standards ....................................... 21 Figure 14 Most preferred option by age group ......................................................................... 27 Figure 15 Windows of opportunity............................................................................................ 31 Tables Table 1 Different approaches to retirement incomes ................................................................. 3 Table 2 Major changes to the NZ Pillar 1 scheme ....................................................................... 8 Table 3 Major KiwiSaver changes since inception ..................................................................... 10 Table 4 Effect of key assumptions on forecasts ........................................................................ 18 Table 5 Continuation of the Age Pension/NZ Super in current form ........................................ 25 Table 6 OECD’s pre-conditions for reform................................................................................. 30 NZIER report – Retirement income policies in Australia and New Zealand vi
1. Our approach
1.1. Attitudes to retirement income policies
Chartered Accountants Australia and New Zealand (CAANZ), as part of their Future Inc
series, commissioned research from NZIER that explored public attitudes to the future
of retirement income policies in Australasia. New Zealand and Australia are different
jurisdictions but with the same ‘retiree funding’ problem.
The countries are similar in that they both have a general tax funded Pillar 1
superannuation scheme. Both Pillar 1 schemes are reasonably generous (by OECD
standards at least). However, the overall cost of the scheme in New Zealand is 1% of
GDP higher after allowing for tax concessions etc.
This project compares the attitudes to retirement income policies in the two
jurisdictions and examines why it is difficult to get durable changes in retirement policy
onto the agenda in both countries.

1.2. Phases of work
The project involved four overlapping phases:
     •     Phase 1: The literature scan focused on the existing research on the attitudes
           of New Zealanders and Australians to retirement income policy and the
           results are presented in Appendix B. The literature scan identified an
           unpublished survey commissioned by the New Zealand Retirement
           Commissioner and undertaken by Colmar Brunton in 2014 that investigated
           New Zealanders’ attitudes in some detail. No corresponding information was
           available for Australia on the Age Pension. This phase also included a brief
           scan looking back to draw out the lessons learnt from previous retirement
           policy reform attempts in both jurisdictions and the findings are discussed in
           Section 2.
     •     Phase 2: The modelling stream focused on a comparison of existing
           modelling undertaken by the Australian Treasury and New Zealand Treasury
           discussed in Section 3.
     •     Phase 3: The attitudinal research phase involved undertaking a survey that
           compared the attitudes of Australians and New Zealanders (henceforth
           Aussies and Kiwis) to retirement income policies and their policy preferences.
           We used the 2014 Colmar Brunton survey as a base. We worked with
           ResearchNow to repeat this survey for New Zealand as well as undertake a
           similar survey in Australia. The headline results are discussed in Section 4 and
           the detailed survey questions and responses are available separately.
     •     Phase 4: Articulation of the research findings involved pulling together the
           modelling and the attitudinal research into this report.
At the conclusion of each key phase we discussed our initial findings with an experts
group consisting of Ross Guest, Kirsten MacDonald and Malcolm Menzies.

NZIER report – Retirement income policies in Australia and New Zealand                   1
2. A history of pension policy
Australian and New Zealand governments have both provided publicly-funded
pensions for retired people for over a century.
In 1898, New Zealand became one of the first countries in the world to introduce a
state-funded age pension. The initial modest pension was subject to a means, assets
and character test. It was non-contributory and paid for entirely out of current
revenues.
At the Federal level, a means-tested, flat-rate aged pension was introduced in Australia
in July 1909, superseding State age pension schemes which had been introduced in
New South Wales (1900), Victoria (1900) and Queensland (1908).
Almost uniquely within the OECD, New Zealand and Australia continue to fund their
state pension systems via general taxation, rather than use some form of separate tax
or contribution system. (OECD 2017b).1, 2
In parallel, private provision of retirement income via tax-preferred and increasingly
regulated employment-based superannuation has also been common, although in
both countries, coverage was largely restricted to higher-paid private sector
employees and public servants (Australian Prudential Regulation Authority (2007) and
Preston (2008)). Tax concessions have been progressively reduced and otherwise
reformed. Both countries operate a TTE tax system.3
2.1. The current systems
Using the World Bank’s “Three Pillar” classification system,4 Table 1 sets out a high-
level summary of the current retirement income systems in Australia and New
Zealand.
1
Denmark is the only other OECD member without a dedicated social security tax of some sort. Ireland operates a taxpayer-
funded, means-tested pension scheme as well as a scheme based on mandatory employee and employer contributions.
2
Both Australia and New Zealand at various times have had an earmarked tax to fund the Pillar 1 scheme which led to the
widespread belief in a separate ‘super fund’. In fact, Australia did have a notional super fund that was in practice merely an
accounting device until its abolition in 1985. ‘New Zealand’s Pillar 1 scheme never had a separate fund until the NZ Super
fund was established in 2001.
3
Under TTE or “income tax” treatment, retirement savings are taxed like other savings vehicles like a bank account. Under
TTE, contributions to schemes are made from taxed income (no deductions), the funds are taxed and withdrawals are
exempt from tax. The current New Zealand system is close to pure TTE, while Australia provides capped deductions for
contributions and superannuation funds are taxed at a concessional rate. Australia, New Zealand and Turkey are the only
OECD countries to operate a TTE system. While there is a wide variation, most OECD members operate an EET system,
under which both contributions and returns on investment are exempted from taxation while benefits are treated as
taxable income upon withdrawal. See OECD (2015).
4
In its 1994 report “Averting the Old Age Crisis”, the World Bank recommended that governments develop a national
retirement income system based on three “pillars”: a publicly managed system with mandatory participation and the limited
goal of reducing poverty among the old; a privately managed, mandatory savings system and voluntary saving. Subsequent
work by the Bank has seen their recommended system expand to include five pillars: a non-contributory “zero pillar”
targeted at poverty alleviation; a mandatory “first pillar” with contributions linked to earnings with the objective of
replacing some portion of lifetime pre-retirement income; a mandatory “second pillar” of individual savings accounts (i.e.
defined contribution plans); a voluntary, flexible and discretionary “third-pillar”; and a non-financial “fourth pillar” which
includes access to informal support (such as family support), other formal social programs (such as health care), and other
individual financial and non-financial assets (such as home ownership). See World Bank (2008).
NZIER report – Retirement income policies in Australia and New Zealand 2Table 1 Different approaches to retirement incomes
Feature Australia New Zealand
Pillar 1 Means-tested public age pension, Universal public age pension,
financed via general revenue. financed via general revenue.
Pension included in taxable income, Pension included in taxable income at
but may be eliminated by tax offsets the marginal rate (so with a
available to seniors. progressive tax system there is a very
mild form of income testing).
Pillar 2 Compulsory private superannuation, KiwiSaver (but the scheme is a hybrid
via the Superannuation Guarantee Pillar 2 and Pillar 3 scheme, because
system. membership is optional, but on an
opt-out basis).5
Pillar 3 Voluntary private superannuation. Voluntary private superannuation,
separate from KiwiSaver.
Source: Guest (2013)
These current systems are the result of considerable policy reform over the last thirty
to forty years on both sides of the Tasman, in both retirement incomes specifically, but
across all economic policy in general. In Australia, much reform has focused around
the Pillar 2 system of workplace-based occupational superannuation, although there
have been significant changes to the taxation of both Pillars 2 and 3. In New Zealand,
by comparison, there has been much more focus on Pillar 1.
2.2. Australia
Occupational superannuation has changed significantly since it first emerged in
Australia in the mid-nineteenth century as a way in which a select group of salaried
employees gained an independent retirement income. For more details, see
Commonwealth Treasury (2001) and Guest (2013).
Figure 1 highlights the main changes in policy settings from 1985 to 2017. It highlights
major developments in the second pillar and more recently an increase in age of
eligibility in the Pillar 1 pension. In the early 1980s, a series of separate but related
developments saw the start of a dramatic increase in both the coverage and quantum
of superannuation:
• the June 1986 decision of the then Conciliation and Arbitration Commission
to allow employers and unions to negotiate a superannuation arrangement
costing no more than 3% of wages. This arrangement was generally
referred to as the “3 per cent productivity benefit” or “award
superannuation”.6
5
All new employees are automatically enrolled with their preferred KiwiSaver provider or the provider of their employer (or
with a default provider allocated by Inland Revenue if their employer has not selected a provider), with minimum employee
contributions of 3% and employer contributions of 3%. Members can either opt-out of the scheme or elect to be a member
of any other registered provider’s scheme. A government subsidy, in the form of a tax credit paid to the fund, equal to 50
cents for every dollar of member contribution annually up to a maximum payment of $521.43, is paid into each fund.
Members can elect to contribute either 3%, 4% or 8% of their pay. Member and employer contributions are made via the
PAYE tax system.
6
This national system followed campaigns by individual unions in the late 1970s and early 1980s to secure employer
superannuation contributions to industry funds for their members.
NZIER report – Retirement income policies in Australia and New Zealand 3• reforms to the prudential regulation of occupational superannuation,
motivated in part by the expected increase in coverage stemming from
award superannuation, which cumulated with the introduction of the
Occupational Superannuation Standards Act in 1987
• successive reforms to the taxation of superannuation, firstly in 1983, to
address concerns about the inequity of tax treatment of superannuation
compared to wages and then more generally as part of reforms to improve
the efficiency of the tax system.
The award system was replaced in 1992 by the “Superannuation Guarantee”. The
Superannuation Guarantee was first introduced as a near-universal employee
entitlement in 1992 with a contribution rate of 3% of salaries, or 4% for employers
with payrolls above $1 million per annum. The contribution rate has been gradually
increasing over the past 20 years to its current level of 9.5%, and with further
increments is scheduled to reach 12% of salaries by the year 2025. Many players in
the superannuation industry have argued the rate should be 15% but neither party has
formally adopted this policy.
Major policy changes have been announced almost every year since 1992 (Murphy,
(2017)). Figure 1 shows these are mainly focused on the Pillar 2 superannuation regime
but also include recent changes to the Pillar 1 threshold for asset testing and an
increase in the age of eligibility for the Aged Pension.
Figure 1 Australia: major retirement policy developments
1985 1992 2002 2003 2004 2005 2006 2007 2008 2009 2010 2011 2012 2017
3% employer SG reaches 9%, Employees Super withdrawals New govt co- SG levy to rise from 9 to
super end of phase-in allowed to tax-free for over 60s. contribution for 12% over 7 years from 1
contribution, period. choose their Concessional low income July 2013.
via ACTU fund. contribution limits. earners, to apply Cap on concessional
Govt. co-
national wage ‘Transition to Employer from 2012, up to contributions for over
contribution for
case. retirement’ contributions $500 p.a. 50s reduced from $50k
low income
pensions permitted up to age to $25k from 2013/14.
earners.
introduced. 75 (from 70).
Superannuation Cap on concessional ‘Stronger super’ Age of eligibility for
Guarantee (SG) contributions halved reforms, esp. My age pension starts
commenced at to $25k for under 50s Super: a low cost to increase. Will
Reduction in 2003 and
3%, gradually and $50k for over 50s, default super reach 67 in 2023.
abolition in 2005 of 15%
rising to 9% by from 2012/13. product. Pensions paid from
tax surcharge on
2002. super restricted to
contributions of high
income earners. $1.6m Transfer
Balance Cap.
Source: Guest 2013 (Figure 1) and NZIER
Assessment
Chomik and Piggott (2012 p.350) provide a positive assessment of the current Australia
system:
The current picture looks positive. Australia’s retirement income
provision system, comprising the ‘three pillars’ of a means tested
Age Pension, mandatory occupational superannuation and other,
voluntary long term savings, compares well internationally. Total
spending on age-related pensions is about 3.6 per cent of GDP, one
of the lowest in the OECD. The aged dependency ratio is 20%, low
NZIER report – Retirement income policies in Australia and New Zealand 4by international standards. Old-age poverty stands at about 14%,
again low by most international standards. Older labour force
participation is climbing, notably among men, and overall
participation among those aged 55-64 in 2010 stands at 60.6%, the
sixth highest rate in the OECD, and up from 50.3% in 2003, which
was close to the OECD average. Superannuation assets are about
equal to GDP, one of the highest ratios in the world.
Murphy (2017) considers that the Australian superannuation system is yet to reach full
maturity. Mandatory employer contributions were only introduced 26 years ago, and
it took 20 years for those contributions to reach 9.5% of salaries. It will not be until the
mid-2030s that those at the point of retirement have spent their entire working lives
under the current system, and it will not be till 2075 that retirees will have been
accumulating superannuation at the 12% rate through their whole lives.
The Age Pension will therefore continue to be a major element of the Australian
system for many years to come.
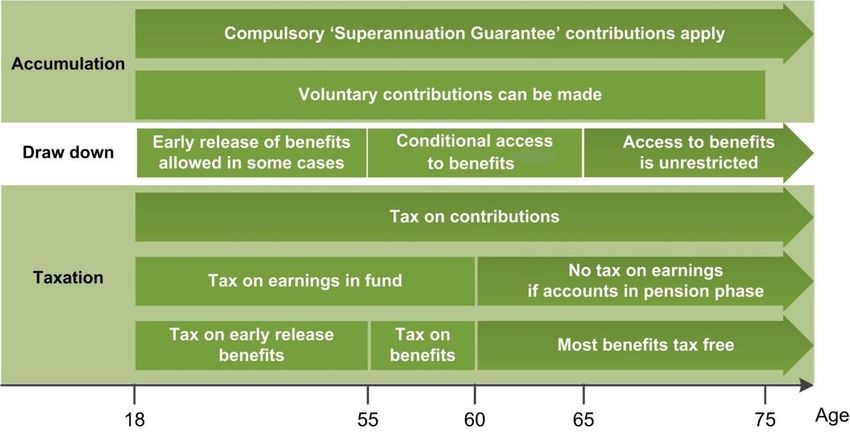
The integration challenge
Because Australian operates a targeted Pillar 1 scheme, one issue that it faces is how
to integrate its occupational superannuation system with both the Age Pension’s
means and assets tests and the tax systems applying to contributions, accumulations
and draw-downs.
As Figure 2 shows, the key issue is the period between age 55, where access to benefits
begins to the age of eligibility for the Age Pension, currently 65.5 years (it will be age
67 by July 2023).
Figure 2 Integration in the Australian system is incomplete
Source: Productivity Commission
Official projections in Australia have consistently pointed to a decreasing share of
pensioners receiving the full pension — suggesting that older Australians will
increasingly rely on other savings and income to supplement any Age Pension receipts.
NZIER report – Retirement income policies in Australia and New Zealand 5The Association of Superannuation Funds of Australia (ASFA) project that a person
retiring in 2016 with an average amount of occupational superannuation will receive
$14,770 a year from the Age Pension and $19,340 from superannuation (Clare (2014)).7
While average superannuation balances will grow, it is important to also consider the
distribution of balances. The Australian system continues to see an increasing disparity
in superannuation balances meaning that reduced pension reliance is likely to be
concentrated among those with higher wealth levels, a disparity the Productivity
Commission expects to continue through time. People who have low incomes during
their working years or have an interrupted work history (which often is the case for
women), are likely to exhaust any superannuation they may have managed to accrue,
and so will remain heavily reliant on the Age Pension as a source of retirement income
(Productivity Commission (2015)).
2.3. New Zealand
The New Zealand retirement income system has been relatively stable compared to
developments in Australia.
Figure 3 highlights the main changes in Pillar 1 and Pillar 2 policy settings since 1975.
It highlights that there were, however, substantial changes to both pillars. Space
precluded showing all the changes to the Pillar 1 scheme from 1976 till 2001, including
changes in the age of eligibility and a taxation surcharge (effectively an income testing
regime) that was introduced in 1985, amended and subsequently abolished in 1998.
Since 2001 changes mainly have been technical due to indexation. A new pre-funding
scheme (the NZ Super Fund) was introduced in 2001 and a new hybrid Pillar 2/3
scheme, KiwiSaver, was introduced in 2007.
Figure 3 New Zealand: major retirement policy developments
1975 1987 1993 1997 2001 2007 2008 2011 2013 2015
NZ Super NZ Super NZ Super Fund Kiwisaver introduced - Default contribution rate to Government
scheme linked to % established to in July. increase to 2% from 2013. kick-start on
launched. of AWOTE. partly prefund - Contribution rates - Employer contribution first entry
NZ Super. of 4% (default) or increased to 3% from 2013. removed.
8%. - Tax exempt status of
- Employer employer contributions
Removal of tax contribution of 1% removed.
incentives for rising to 4 % by
retirement 2011.
savings.
Referendum on Dec. 2008: Minimum
compulsory super - New default contribution rate of 2%, employee and
scheme defeated. other options being 4% and 8%. employer
- Employer contribution rate set at 2% contributions
with no ramp up. Employer tax credit increase from 2%
replaced by tax exemption for to 3%.
employer contributions up to 2%.
- Annual fee subsidy removed.
Source: Guest 2013 (Figure 2) and NZIER
A Royal Commission on Social Security in 1972 proposed that the state should "ensure
… that everyone is able to enjoy a standard of living much like that of the rest of the
7
Both figures are in 2015 dollars.
NZIER report – Retirement income policies in Australia and New Zealand 6community and thus is able to feel a sense of participation and belonging to the
community". This shifted the focus from meeting basic needs to ensuring that the
proceeds of economic growth were shared more evenly. A universal pension at age 60
at more than twice the previous level was introduced in 1976. The level of benefits for
a couple was set at 80% of the gross average wage.
The social welfare system strained under the increased cost of New Zealand Super
when coupled with the increased numbers of newly unemployed and the effects of the
post-Royal Commission increases in entitlements. Social welfare spending, as a
proportion of GDP, which had been falling since 1950, started to climb in 1972,
reaching a peak of 16.8% in 1993 (Figure 4).
Figure 4 Spending on social welfare peaked in the early 1990s
As a percentage of GDP
All social welfare benefits NZS Just welfare
18
16
14
12
10
8
6
4
2
0
1950 1955 1960 1965 1970 1975 1980 1985 1990 1995 2000 2005 2010 2015
Source: The Treasury and NZIER calculations
Unsurprisingly, successive governments introduced a series of reforms designed to
reduce the fiscal cost of the Pillar 1 scheme.
NZIER report – Retirement income policies in Australia and New Zealand 7Table 2 Major changes to the NZ Pillar 1 scheme
Year Feature
1976 Scheme introduced under name ‘National Superannuation’ by the new National Party government (the
naming was not a coincidence).
Universal, taxed pension payable from age 60.
Benefit for couples set at 80% of gross average ordinary time earnings. This means that pensions are
indexed to wages, not prices.
1979 Benefit for couples set at 80% of net (after tax) average ordinary time earnings.
1985 Superannuation surcharge introduced. Effectively a means-test, but implemented as an additional tax on
the other income of superannuants.
Pension rates indexed to prices, not wages
1987 Wage indexation restored: pension for couples set at 80% of net average ordinary time earnings.
1989 Superannuation renamed Guaranteed Retirement Income. Payments indexed to lower of price or wage
movements. Government signals that age of eligibility will increase, although changes would not take
place till the early 21st century.
1990 1991 and 1992 pension increases cancelled and from 1993 onwards, indexation would be to prices alone.
and The age of eligibility was increased to 61, effective from 1992 and thereafter to steadily increase until it
1991 reaches 65 in 2001.
Rate of superannuation surcharge increased from 20 to 25% and threshold for exemption lowered.
The scheme was again renamed ‘National Superannuation’ by the new National Party government.
1993 A “Superannuation Accord” signed by the main political parties, largely accepting the status quo.
The Accord also called for the establishment of a Retirement Commissioner, who would conduct periodic
reviews of retirement incomes and policy.
1996 Effect of the superannuation surcharge reduced.
1997 A referendum on a compulsory Retirement Savings Scheme provided for in the coalition agreement
between the National and New Zealand First Parties overwhelmingly rejects the proposed scheme.
1998 Surcharge abolished, returning New Zealand to a universal Pillar 1 scheme, albeit at a lower rate than
previously and applying from age 65. The pension was to be indexed to prices, but with a “wage floor” of
65% of net ordinary time earnings.
Later in the year, following the collapse of the coalition agreement, the wage floor was reduced to 60%.
1999 The wage floor was restored to 65%.
2001 The New Zealand Superannuation Act 2001 again renames the scheme, this time to New Zealand
Superannuation.
2004 Public Finance Act amended to require the Treasury to a statement on the long-term fiscal position at
least every four years. The first statement was published in 2006.
2005 Under a confidence and supply agreement between the Labour Party and New Zealand First, the wage
floor is increased to 66%.
2008 National Party leader John Key pledges to resign from Parliament if the age of eligibility for
superannuation is increased.
2017 New Prime Minister Bill English announces that the age of eligibility for New Zealand Superannuation will
rise to age 67.
During the subsequent election campaign, Labour Leader Jacinda Ardern repeats John Key’s pledges to
resign from Parliament if the age of eligibility for superannuation is increased. This commitment is
subsequently included in the Coalition Agreement between the Labour Party and New Zealand First.
Source: Based on Preston 2008 and NZIER
NZIER report – Retirement income policies in Australia and New Zealand 8Pillars 2 and 3
Since 2005, the major development in the New Zealand system has been the
introduction of a new hybrid Pillar 2/3 scheme, called KiwiSaver.
The scheme is voluntary, so it is really a Pillar 3 scheme, but enrolment is compulsory
when an employee changes jobs and there are minimum contribution rates from both
employees and employers, based on annual incomes. Employees must, however, take
conscious action not to join (opt-out) within a narrow window of two to eight weeks
of starting with a new employer. As Figure 5 shows, total Kiwisaver membership
continues to grow, while the number of potential members opting out each year as
stabilised at about 240,000 each year.
Figure 5 Kiwisaver membership is growing
Total membership and annual opt-outs, June years.
3,000,000
2,500,000
2,000,000
1,500,000
1,000,000
500,000
0
2008 2009 2010 2011 2012 2013 2014 2015 2016 2017
Total Opted Out
Source: Inland Revenue, http://www.kiwisaver.govt.nz/statistics/annual/
NZIER report – Retirement income policies in Australia and New Zealand 9Table 3 Major KiwiSaver changes since inception
Year Change
2005 Scheme announced in the 2005 Budget.
When first announced, the scheme involved member contributions, with the
government providing:
a $1,000 kickstart payment to each member upon joining
a fee subsidy, which the Government has since confirmed to be $40 per
member per annum, and
a housing deposit subsidy of up to $5,000, available after three years of saving
into KiwiSaver for eligible members (eligibility is governed by income caps and
regional house price caps).
2007 Before the scheme is to start on 1 July, the 2007 Budget announced additional features:
a Member Tax Credit to match member contributions into KiwiSaver at a rate of
100%, up to a cap of $20 per week (about $1,040 per year).
From 1 April 2008, the phasing-in of compulsory matching employer
contributions. The rate of compulsory employer contributions will increase by
1% each year until 2011/12, when the compulsory contribution reaches 4% (the
4% rate was never brought into effect).
A new Employer Tax Credit to reimburse employers for their contributions to
employees’ KiwiSaver accounts by providing a tax credit at a rate of 100% up to
a maximum of $20 per week per employee (about $1,040 per year).
2008 Announcement that $40 fee subsidy cancelled and mortgage diversion option removed.
Minimum contribution rate reduced from 4% to 2%.
2011 Maximum tax credit halved from $1,043 to $521 (contribution required to achieve tax
credit stayed the same).
2012 Tax credit for children removed (April 2012).
All employer contributions made subject to tax applied at the employee’s marginal tax
rate.
2013 Minimum employee and employer contribution rate increased from 2% to 3% of gross
income (April 2013).
Standardised Fund Management reporting introduced.
2015 $1,000 kick-start removed.
House price caps increased for first home buyer schemes and member tax credits now
eligible for withdrawal.
Source: Drew and Wilson (2015)
While the scheme has endured over three governments, the 2008-2017 National Party
government significantly reduced the extent of government contribution, arguing that
it was often poorly targeted (Drew and Wilson (2015)).
NZIER report – Retirement income policies in Australia and New Zealand 102.4. Conclusion The only constant in retirement income policy in Australia and New Zealand is change. For the past 40 years, governments of all political persuasions on both sides of the Tasman have adjusted policy settings across all the pillars of retirement incomes. In both countries, the level of pension fund assets as a share of GDP has been increasing, although it is impossible without much further analysis to attribute any of this to policy changes. Figure 6 Pension funds are expanding Pension fund assets as a percentage of GDP Source: OECD statistics The Australian Superannuation Guarantee system is yet to mature: it will be many years until all retirees will have been accumulating superannuation balances based on 12% of incomes. Even then, differences in pre-retirement earnings and employment patterns will persist, meaning that for many, the Age Pension will remain a significant source of post-retirement income. While extending the coverage of employment-based retirement savings, KiwiSaver will always be a supplement to New Zealand Super. The universal nature of New Zealand Super also means that, unlike in Australia, increasing savings through KiwiSaver will have little effect on the fiscal cost of retirement. In both countries, the Pillar 1 schemes will continue to be an important feature of retirement incomes, providing a basic safety net for large sections of the community. NZIER report – Retirement income policies in Australia and New Zealand 11
3. The common fiscal challenge
3.1. Demographic change
Demographic change is projected to increase future spending on retirement incomes
in Australia and New Zealand. That Australia, New Zealand and, indeed, most of the
western world, is going through a period of demographic change is clear to see.
Driving this change is a combination of:
       •       reductions in mortality rates across the whole age spectrum, but especially
               infant mortality and
       •       a reduction in fertility, which is the combined effect of both a fall in family
               size and a delay in the timing of child-bearing: women are having fewer
               children, later in life.

3.2. On average, we are living a lot longer
The reduction in mortality can be illustrated using data from life tables produced by
the Australian Bureau of Statistics and Statistics New Zealand. In Figure 7, we combine
the actual mortality experience of people born in 1876 (called a cohort life table) with
that occurring across the whole population in 2012 (called a period life table)8 to show
the pattern of survivorship over time: what proportion of a group of people (in this
case 100,000) live to a given age.
The 1876 data shows what happened to a cohort of 100,000 people born in 1876. The
2012 data shows what would happen to a similar cohort of 100,000 people if they
experienced the age-specific mortalities that applied across the whole population in
that year. This is not a prediction of what will happen to a cohort born in 2012, since
that group will most likely continue to experience improvement in mortality. It does
however, illustrate the effects of the current mortality rate compared to those in the
past.
In the context of this report, a key point is that the number of people living to the age
of eligibility for government-funded pensions, is set to increase significantly. For
people born in 1876, only 47.4% lived to age 65. For a cohort experiencing current
mortality, a staggering 87.5% will live to 65.
Living longer does not necessarily mean living with increased disability. Australian data
suggests increased life expectancy does not mean that rates or level of disability will
increase (Negline 2017). New Zealand data points to a ‘good news bad news’ story.

   8
           Cohort life tables have the advantage of showing the actual experience of a group of people. The disadvantage is that they
           require data over many years, theoretically until the death of the last survivor. Period life tables, on the other hand, are
           based on the experience of the population during a specific period of time. The data presented below for the 2012 period is
           a hypothetical survivorship assuming people experience the age-specific death rates of that period over their lifetime.

NZIER report – Retirement income policies in Australia and New Zealand                                                              12
“We may be living longer, and living longer in good health, but we are also living longer
in poor health” (Ministry of Health, 2016, p. ix).9
Figure 7 New Zealand men are living much longer
Number surviving to a given age
100,000
90,000
80,000
70,000
60,000
50,000
40,000
30,000
20,000
10,000
0
0 10 20 30 40 50 60 70 80 90 100
1876 2012
Source: Statistics New Zealand
3.3. And families are having fewer children
While more Kiwis and Aussies are living into old and very old age, at the other end of
the life-course, fewer children are being born.
There are two effects at work here: a delay in starting families and a fall in the size of
families.
These two effects are shown in Figure 8 (New Zealand) and Figure 9 (Australia), which
show the total fertility rate (the number of children a woman can be expected to have)
and age-specific rates, by five-year bands from 20-14 to 35-39.
In New Zealand, while the total has been reasonably stable, the age-specific rates for
30-34 and 35-39 women have increased, while those for younger groups have fallen.
9
To elaborate “New Zealanders are living longer, and are living longer in good health (i.e. both life expectancy and health
expectancy are increasing). Health loss, measured in DALYs, is declining by an estimated 1.2% per year, once adjusted for
changes in population size and age structure – a major achievement for the health and wider social sectors. Yet because the
population is growing and ageing, the absolute number of DALYs is still increasing. This finding suggests that improvements
in health do not necessarily reduce health care expenditure.” (2016 ibid).
NZIER report – Retirement income policies in Australia and New Zealand 13Figure 8 New Zealand women are having fewer children, later in life
Total (per capita) and age-specific (per 1,000) fertility rates, New Zealand
200 3
180
160
140
2
120
100
80
1
60
40
20
0 0
1975 1980 1985 1990 1995 2000 2005 2010 2015
20-24 25-29 30-34 35-39 Total (RHS)
Source: Statistics New Zealand
In Australia, although the fertility rates themselves are slightly different, the pattern is
the same.
Figure 9 Australian women are also delaying child bearing
Total (per capita) and age-specific (per 1,000) fertility rates, Australia
200 3
180
160
140
2
120
100
80
1
60
40
20
0 0
1975 1980 1985 1990 1995 2000 2005 2010 2015
20 - 24 25 - 29 30 - 34 35 - 39 Total (RHS)
Source: Australian Bureau of Statistics
NZIER report – Retirement income policies in Australia and New Zealand 143.4. Sizing up the challenge
An ageing population raises challenges to both fiscal sustainability and fiscal resilience.
Gill (2012, p7) defines fiscal sustainability as “the ability to predictably raise sufficient
revenue over time to meet financial commitments and sustain a certain level of
services”. Measuring sustainability requires making judgements about political
acceptability of raising taxes and cutting spending, and the public legitimacy of
government rather than making purely technical assessments. Fiscal resilience refers
to the ability to withstand shocks and avoid unnecessary risks.
Forecasts of how pension and health spending will change over the long term (40 to
50 years) provide a starting point for assessing fiscal sustainability and fiscal resilience.
The comparison in this section is based on the ‘2015 Intergenerational Report –
Australia in 2055’10 (IGR Australia) with the Long-Term Fiscal Model 22 November
2016’11 (LTFM New Zealand). Unless otherwise stated these are the data sources used
for comparison in this section.
The IGR Australia is a narrative report with supporting data for charts and tables.
Results are presented as ratios of spending to GDP with current and proposed policy
change for pension eligibility age. In contrast, the LTFM New Zealand is a detailed
spreadsheet model that projects current policy settings forward. An alternative fiscal
policy setting ‘Stabilise Net Debt’ is included but this does not alter the eligibility age
for New Zealand Super.
For our comparison, we have focused on the modelling of forecast pension and aged
care health spending and real Gross Domestic Product (GDP) as this is the approach
used in the IGR Australia and there is insufficient published data to construct other
measures. We begin with the model structure and then comment on the key model
results.
3.4.1. Model structure – retirement income
The Australian and New Zealand models have the following common features:
• the key inputs are population demographic forecasts by age cohort
• assumptions about economic growth, inflation and tax revenue as a
proportion of GDP
• recent historical spending is used as a baseline for forecasting spending by
age group
• government social welfare spending which is usually assumed to be a
combination of change in the population by age cohort, multiplied by a per
capita price (including inflation) plus a trend increase factor for some types
of social spending.
The demographic forecast and assumptions about costs are used to project forward
the effect of population changes on the tax revenues and government spending
assuming no change in policy settings.
10
Available at https://treasury.gov.au/publication/2015-intergenerational-report/
11
Available at http://www.treasury.govt.nz/government/longterm/fiscalmodel
NZIER report – Retirement income policies in Australia and New Zealand 153.4.2. Model structure – health spending
The IGR Australia and LTFM New Zealand use different approaches to forecast health
spending. The proportion of the increase in health spending that is attributable to
demographic factors is 80% for IGR Australia12 and 77% for New Zealand.13 Although
these numbers appear similar, the New Zealand health expenditure includes aged
residential care payments and Australian health spending excludes them.
The LTFM New Zealand forecasts of health expenditure are based on the historical
proportion of health spending for males and females by age group, multiplied by the
following:
• separate inflation rates for input expenses and health labour costs
• population growth by age and gender adjusted for ‘healthy ageing’.
The IGR Australia forecasts four major categories of health expenditure: PBS
(pharmaceuticals), Medicare Benefits, Hospitals and Private Health Insurance Rebates.
and includes a description of the key model features but does not provide the formulae
used.14 For Pharmaceutical and Medicare Benefits the initial modelling is based on
projected non-demographic growth in spending by age group and gender adjusted for
change in the size of the population group and the CPI. Hospital and private health
insurance rebate spending is increased by the product of population growth and the
CPI. These initial modelling approaches are transitioned to an aggregate model of
health expenditure from 2027-28:
by growing the projected real spend per person in each age and gender group
by an aggregate non-demographic growth rate.15
(The non-demographic growth rate is based on an exponential growth rate.)
3.4.3. Model results – retirement income
In addition to health spending as a share of GDP, the key challenge is to forecast public
pensions under a ‘no policy change’ assumption. The LTFM New Zealand estimate of
gross16 pension costs assume the eligibility age remains constant. The IGR Australia
report included two policy options for the Age Pension:17
• current policy to increase the eligibility age gradually from 65 (in 2017) to
67 by 1 July 2023
• proposed policy to increase the age gradually from 65 (in 2017) to 70 by 1
July 2035.
12
IGR Australia, Box 2.4 page 61.
13
Estimated as the difference between growth in Core Crown Health spending and ‘Bottom-up’ Spending growth from the
LTFM New Zealand for the period 2021 to 2055.
14
See 2015 Intergenerational Report – Australia in 2055, Survey results pages 116 to 128.
15
See 2015 Intergenerational Report – Australia in 2055, Survey results page 125.
16
The LTFM New Zealand includes assumptions includes ‘gross’ and ‘net’ per person payments but only the gross rate is used
to forecast total New Zealand Superannuation payments.
17
The Age Pension is a means-tested payment for people over 65. From 1 July 2017, the qualifying age for the Age Pension will
gradually increase to 67 by 1 July 2023.
NZIER report – Retirement income policies in Australia and New Zealand 16The proposed increase in eligibility age has not been implemented but is included in
the following chart to indicate the change in eligibility age required to stabilise pension
payments as a proportion of GDP.
On current Pillar 1 policy settings, gross New Zealand Super is forecast to increase from
4.8% of GDP in 2015 to 7.5% of GDP by 205518 – an increase in share of GDP of almost
60%.19 In contrast Australia’s Age Pension will increase from 2.9% of GDP in 2015 to
3.9% of GDP by 2055 – an increase in share of GDP of just under 25%.20
Figure 10 Forecast pension payments
NZ Super and Australian Age Pension (current and proposed21) as a proportion of GDP
10.0%
9.0%
8.0%
7.0%
6.0%
5.0%
4.0%
3.0%
2.0%
1.0%
0.0%
2015 2025 2035 2045 2055
NZ Super Age pension (current) Age pension (proposed)
Source: NZIER
Two key drivers of the difference between the forecast change in retirement pensions
as a percentage of GDP for Australia and New Zealand do not relate to differences in
retirement income policy. Rather they are assumptions about the forecast rate of
economic growth and the ageing of the population. The IGR Australia forecasts
assume:
• a faster rate of economic growth than the LTFM New Zealand so that by
2055 the ratio of Australia’s GDP to New Zealand’s GDP is forecast to
increase by 30%
18
Source: Long-Term Fiscal Model’ downloaded from http://www.treasury.govt.nz/government/longterm/fiscalmodel 17 Dec
2017.
19
The New Zealand Superannuation Fund Contribution Rate Model (14 Dec 2017) (available at
http://www.treasury.govt.nz/government/assets/nzsf/contributionratemodel) forecasts net New Zealand Superannuation
to 4.12% of GDP in 2018 and 6.4% by 2055 and increase of 55%.
20
Guest (2013 p27) comparison of the overall effect of Pillars 1 and 2 combined concluded “NZS is fiscally more expensive than
Australia’s Age Pension but KiwiSaver is cheaper. In net terms New Zealand’s retirement income system is currently more
expensive by about 1 per cent of GDP. The gap between the cost of NZS and Australia’s Age Pension will grow, but will be
offset by lower relative cost of KiwiSaver due to tax free super pay outs available at an earlier age in Australia (age 60).”
21
‘Age pension (current)' is based on the eligibility age increasing to 67 by 2023. ‘Age pension (proposed)' is based on the
eligibility age increasing to 70 by 2035. This ‘Age pension (proposed)' policy was proposed in the 2014-2015 Budget but was
not implemented.
NZIER report – Retirement income policies in Australia and New Zealand 17You can also read