Are we there yet? The NRMA roadmap for the visitor economy - Discovery series

Page created by Barry Russell
 
CONTINUE READING
Are we there yet? The NRMA roadmap for the visitor economy - Discovery series
Are we there yet?
The NRMA roadmap for the visitor economy

            Discovery series
Are we there yet? The NRMA roadmap for the visitor economy - Discovery series
About the NRMA
                                                                                                                                                             Better transport infrastructure has been a core focus of the NRMA since 1920
                                                                                                                                                             when our founders lobbied for improvements to the condition of Parramatta Road
                                                                                                                                                             in Sydney. Independent advocacy was the foundation activity of the organisation
                                                                                                                                                             and remains critical to who we are as we approach our first centenary.

                                                                                                                                                             The NRMA has grown to one of the largest tourism and transport companies
                                                                                                                                                             in Australia, representing over 2.6 million Australians principally from NSW and
                                                                                                                                                             the ACT. The NRMA provides motoring, transport and tourism services to our
                                                                                                                                                             Members and the community.

                                                                                                                                                             Today, the NRMA works with policy makers and industry leaders to advocate for
                                                                                                                                                             transport solutions that help solve key pain points such as congestion, access
                                                                                                                                                             and affordability and connect people and communities. The NRMA is passionate
                                                                                                                                                             about facilitating travel across Australia, recognising the vital role tourism plays in
                                                                                                                                                             supporting regional communities.

                                                                                                                                                             By working together with all levels of government to deliver integrated transport
                                                                                                                                                             and tourism options we can provide for the future growth of our communities and
                                                                                                                                                             continue to keep people moving for generations to come.

                                                                                                                                                             Discovery series
                                                                                                                                                             The NRMA is passionate about travel. We aim to
                                                                                                                                                             inspire people to connect, explore and discover
                                                                                                                                                             this great country through cost effective and
                                                                                                                                                             seamless tourism and transport services.
                                                                                                                                                             As the backbone of many regional communities
                                                                                                                                                             and an employer of over half a million
                                                                                                                                                             Australians, we need to ensure the tourism
                                                                                                                                                             industry continues to grow. Through our
                                                                                                                                                             Discovery Series, the NRMA will champion
                                                                                                                                                             investment in transport and visitor infrastructure,
                                                                                                                                                             partnerships that profile our regions, and
                                                                                                                                                             technology that links visitors with the most iconic
                                                                                                                                                             and best kept secrets this country has to offer.

    Images coutesy of: Front cover: Getty Images/Alexander Kesselaar/EyeEm Page 2: Tourism Port Douglas and Daintree/Peter Lik Page 5: Getty Images/
    Chris Williams Black Box Page 6-7: Tourism Australia/Hugh Stewart Page 15: Tourism Australia/Mike Newling Page 17: Tourism Australia/Hamilton Lund
    Page 18: NRMA Page 33: Sean Scott Photography Page 34:Tourism Port Douglas and Daintree/Darren Jew Page 39: North Star Cruises Australia
    Page 40: Getty Images/Ippei Nao Page 43: Kelvin Darmawang Page 47: Tourism Australia Page 48: Visit Victoria/Josie Withers Page 51: Tourism Australia/
    James Fisher Page 52: Tourism Australia/Time Out Australia/Robert Seba

2   Are we there yet?                                                                                                                                                                                                                           Are we there yet?   3
Are we there yet? The NRMA roadmap for the visitor economy - Discovery series
Introduction
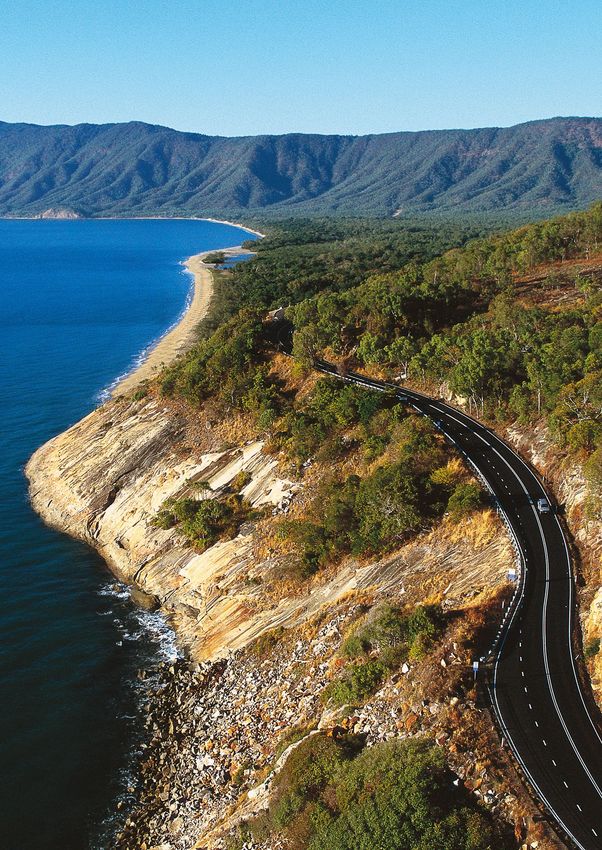
The great Aussie road trip is synonymous with tourism         discussions about the future of this great industry
and holidaying in Australia. The domestic holiday is          in Australia. The NRMA is calling on industry and
the way we connect, explore and recharge with family          government to come together to discuss the next
and friends. Whether it’s piling into the family car and      frontier of tourism development and targets, investment
heading to the coast, visiting a caravan park over the        in infrastructure and how technology will change the
school holidays, or heading to the mountains over a           way we plan, travel, connect and experience our holiday
long weekend, a domestic holiday is an Aussie tradition.      journey and destinations.

And for almost a century, domestic travel and tourism         We want to see more Australians enjoying more of this
has been a tradition at the NRMA.                             country by making it easier to travel, and giving them a
                                                              compelling reason to venture beyond capital cities. We
The NRMA has a long and proud history assisting our           want to see a future where tourism continues to grow,
Members when travelling around the country; whether           offering Australians employment opportunities, a chance
it be providing the first touring maps to navigate the        to reconnect and explore local communities, and greater
growing network of unmarked roads, to servicing the           amentity in both regional and metropolitan areas.
family car or assisting with a breakdown, we have kept
our Members moving on their holiday journey.                  There is great potential in this industry. Based on the
                                                              current trajectory of tourism growth in the country,
But the NRMA involvement in the tourism industry has          the NRMA believes overnight visitation could grow
grown to become much richer than this. The NRMA               to 1 billion nights by 2029-30, with overnight visitors
owns and operates Travelodge properties across                spending $150 billion in the Australian economy;
regional and metropolitan Australia as well as Hotel          $62 billion of which could be spent in regional
Kurrajong in Canberra. Our Thrifty car rental business        communities. With the right level of investment,
provides visitors with access to hire cars in 170 locations   planning and industry partnerships, this number
to explore the country or travel for business.                could be achievable.

Our expanded holiday parks portfolio means the NRMA With the industry approaching the cusp of the 2020
now has over 40 owned and managed family-friendly        Tourism Industry Potential target, now is the time to
caravan and camping sites providing value for money      review our performance and plan for the future.
experiences in the best regional locations.
                                                         Our Are We There Yet? report outlines the economic
Our investment in My Fast Ferries will see us transport  importance of tourism – including drive tourism and
up to 3.7 million passengers across another iconic       caravanning and camping – to many destinations in
thoroughfare, Sydney Harbour, each year.                 which the NRMA operates, and the areas of focus that
                                                         could make a difference now and in to the future for the
Whether it’s keeping you moving and safe in your own     sector.
car, providing alternative transportation, or providing
a range of accommodation options to rest your weary      The Discovery Series by the NRMA will see the
head at night, the NRMA has supported travellers on      organisation work with industry and local communities
their journey and at their destination.                  to realise its potential by identifying initiatives, programs
                                                         and infrastructure required to grow the sector in the
The NRMA is committed to the tourism industry and the future.
communities it supports. Tourists spent $110 billion in
local towns, cities and regional communities in 2016-17. The NRMA has set some ambitious targets in growing
Of this expenditure, nearly 75 per cent was generated    its own interests in the tourism industry and believes the
by domestic visitors. Domestic tourism is the backbone sector should do the same. The industry should be bold,
of many regional communities, with 86 per cent of        tackle the hard issues and work with the community
domestic travel being done by car.                       to lift the quality of experiences that Aussies and
                                                         international visitors enjoy when travelling in Australia.
That’s why the NRMA is lending its voice to industry

  4    Are we there yet?                                                                                                 Are we there yet?   5
Are we there yet? The NRMA roadmap for the visitor economy - Discovery series
Recommendations
What gets measured gets done                             • Develop state-based cruise and marine-tourism               • Establish an inter-government working group with         • Conduct a review of recent changes to skilled
                                                           strategies that identify opportunities for local              representatives from the Department of Planning,           migration visas and monitor the impact of the
• Establish a Tourism 2030 Industry Potential Target       cruising in regional communities, including                   Environment and Heritage, Industry (Tourism),              changes on the sector. Major reform must occur if
  with specific targets for both domestic and              infrastructure upgrades required to support the               Labour and Skills, and Regional Development to             the changes are proven to widen workforce gaps.
  international spend to guide the development and         growth of the sector                                          actively address barriers to tourism investment
  performance of the sector beyond 2020                                                                                  including planning and building controls, regulation     • Reform and expand employment programs that
                                                         • Establish a target to grow regional events in priority        and skills shortages                                       support regional tourism businesses including the
• Set regional growth targets in line with the Tourism     destinations, with funding support specifically for                                                                      Seasonal Worker program, Refugee Employment
  2030 Industry Potential to grow overnight visitation     running costs and event management in the initial             This group should develop an Action Plan to                Support Program and Working Holiday Maker
  and spend in the regions                                 years of establishment.                                       reduce red tape associated with tourism investment         program.
                                                                                                                         including zoning, development application
• Re-establish visitor economy taskforces to guide       Aid discovery                                                   processes, tax arrangements and adaptive re-use of       Live like a local – curated experiences
  the development of tourism strategies in each state,                                                                   heritage assets, with timelines for delivering reform.
  and monitor and evaluate the performance of the        • Develop tourism and transport strategies in each                                                                       • Establish programs that support technology-based
  sector against its targets                               state, addressing intermodal and connectivity issues        Create meaningful engagement                                 solutions that link domestic and international
                                                           between road, rail, aviation and cruising infrastructure.                                                                travellers with local communities and authentic
Inspire Journeys                                                                                                       • Reform vocational pathways to include greater              visitor experiences.
                                                         • Establish a timetable for transitioning all visitor           industry-led traineeships, apprenticeships and
• Support, facilitate and develop new innovative ways      signage to one consistent colour                              mentor programs, as well as greater career advice        • Support indigenous employment and business
  to bring nature-based tourism projects to market in                                                                    for school leavers on the value of a career in             mentoring programs that create jobs, empower
  partnership with the private sector and community,     • Develop an investment strategy for digital                    hospitality and tourism.                                   indigenous enterprise, and create authentic
  including alternative funding models for delivery        wayfinding signage with the capacity to                                                                                  experiences curated by Aboriginal and Torres Strait
                                                           communicate with in-car technology and smart                                                                             Islander peoples.
• Reform regional tourism development grant                infrastructure by 2030
  programs to provide greater consistency in
  funding and support to businesses in meeting           • Develop a national program to improve rest
  selection criteria. Priority should be given to          stop amenity across the country with the aim of
  projects that have been identified in destination        providing showers, toilets, power, and wifi at priority
  management plans as addressing product and               regional and remote rest areas for travellers and
  infrastructure gaps                                      long-haul drivers

  6    Are we there yet?                                                                                                                                                                                                             Are we there yet?   7
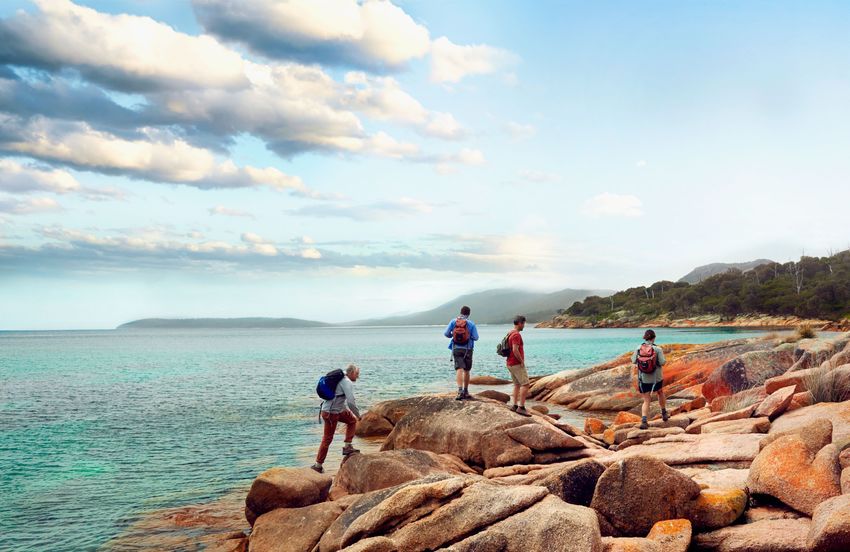
Are we there yet? The NRMA roadmap for the visitor economy - Discovery series
The NRMA and the
tourism industry
A trip down memory lane….                                                                            Our commitment to the industry                        To this end, the NRMA has set the following
                                                                                                                                                           objectives to 2030:
The NRMA has a long and proud history in the                                                         The NRMA has the goal of becoming Australia’s
travel industry. The NRMA produced its first
                                                         Did you know the NRMA                       largest tourism and transport operator and advocate   • Strengthen our voice as an advocate for tourism,
touring guide for motorists in 1925. As most major                                                   over the next decade. We will deliver real value to     based on our first-hand experience operating in
roads were not signposted during these times,            • Owns Travelodge properties                our Members and local communities by facilitating       the sector.
motorists relied on the descriptions provided by           operated by TFE Hotels as well as         the movement of Australians across the country and
the NRMA to guide them on their journey.                   Hotel Kurrajong.                          around the states, creating meaningful journeys and   • Grow the NRMA’s network of value-for-money
                                                                                                     allowing our members to discover the country.           accommodation in the best regional locations.
With the popularity of the motor car and touring         • Over 40 owned and managed holiday
came an interest in camping and NRMA made                  parks, based in regional destinations     We will continue to promote the best travel           • Deliver the largest network of electric vehicle
its first property acquisition in 1926, with a further     across six states, making the NRMA        experiences across the country, already spending        fast charging stations across NSW, the ACT and
expansion into skiing, golfing and caravanning             the second largest operator of holiday    $7 million annually promoting domestic road trips       beyond to prepare for Australia’s future fleet of
clubs and pamphlets in the 1930s. As automobile            park sites in Australia.                  and travel stories in our Open Road magazine and        vehicles and facilitate greater visitation to regional
technology improved, so too did the length of                                                        social media platforms annually.                        destinations.
trips taken, with the NRMA extending its touring         • Owns Thrifty car rentals in 170
maps to include Brisbane and Melbourne.                    locations nation-wide, supporting                                                               • Develop meaningful partnerships with the
                                                           465,000 trips by international and                                                                community, government and local councils to
For those involved in flying, the NRMA aviation            domestic tourists yearly.                                                                         deliver visitor infrastructure in the regions.
bureau provided information on all the landing
grounds in Australia. The NRMA even offered              • Invested in Manly Fast Ferry                                                                    Like every business, the NRMA is setting targets
an inspection service for aspiring purchasers of           (My Fast Ferry) that transports more                                                            and goals to guide its development and measure its
second-hand aircraft!                                      than 3.7 million passengers a year                                                              performance. The sector needs to do the same.
                                                           across Sydney’s iconic harbour.
As accommodation offerings expanded, the
NRMA in conjunction with the other motoring              • Provides roadside assistance to 270,100
clubs established the star ratings system for              travellers during the holiday period.
accommodation in the 1950s. This was one
of the first programs that set a standard for            • Committed $10 million to an electric
accommodation in Australia and provided quality            vehicle fast-charging network to
assurance to travellers when on their journey.             help the next generation of travellers
                                                           explore regional Australia.
The Australian community is probably unaware
of these long-standing roots in travel and the           • NRMA Travel assists domestic and
extent to which the NRMA is still embedded in              international visitors book their
tourism industry today.                                    holidays at home and abroad.

The NRMA today….

NRMA is one of Australia’s major tourism and
transport operators, with a gross asset value of
more than $800 million in hotels, holiday parks,
travel and car hire services.

The NRMA diversified portfolio of tourism and
travel assets means we have real skin in game
when it comes to tourism.

  8    Are we there yet?                                                                                                                                                                                        Are we there yet?   9
Are we there yet? The NRMA roadmap for the visitor economy - Discovery series
Are we there yet?
Achieving our 2020 targets
The value of the tourism industry                           airports, national parks, cultural institutions and          Setting targets                                                                            performance was wholeheartedly welcomed and
                                                            visitor attractions. This can often mean parts of the                                                                                                   supported by the sector.
Tourism has been identified as one of five super            sector operate at cross-purposes.                            In 2009, an aspirational growth target was set to
growth industries, growing faster than global GDP and                                                                    guide the performance and competitiveness of the                                           In 2009, overnight tourism spend totalled
outstripping the value of traditional resources sectors1.   The sector is also susceptible to external shocks            tourism sector to 2020.                                                                    $71.2 billion. The Tourism 2020 target was set to grow
                                                            outside the control of any government or operator                                                                                                       overnight visitor expenditure from $71.2 billion to
In 2016-17, direct tourism expenditure in local             including exchange rate movements, changing                  The establishment of the 2020 Tourism Industry                                             between $115 billion (lower limit) and $140 billion
communities totalled $110 billion, 75 per cent of           traveller preferences, global economic downturns,            Potential was the first time in history federal                                            (upper limit) by 2020.
which is generated by Australians travelling in             increased competition from overseas destinations, as         and state governments had come together with
Australia, whether it be interstate, within their own       well immigration policy both here and abroad.                industry to set a target to measure performance.                                           From this target, the states set their own targets,
state or completing day trips2.                                                                                          The partnership and transparency around tourism                                            aligned with the national industry potential target.
                                                            In the early 2000s, the sector realised Australia’s
The sector employs more than half a million people,         international competitiveness had not kept pace with
more people than agriculture, mining and the                global trends, resulting in a decline in international
finance sector. Of this employment, 1 in 20 jobs in         market share. Domestic visitation also slowed as
regional areas are directly tourism related3.               Australians chose to travel abroad rather than at            Table 1: State Tourism 2020 targets
                                                            home. The Tourism 2020 targets were established to
Tourism is rarely given the kudos it deserves as an         monitor our performance and lift our game in these
                                                                                                                                                                                                Tourism 2020 growth targets
economic powerhouse. This is perhaps because                areas.
the sector is essentially a supply chain of multiple                                                                                                  State                                                   Expenditure Target                           Overnight Visitor Target
fragmented and disjointed industries coming                 There is an economic imperative to ensure tourism
together to offer an experience, rather than a              as Australia’s major services export sector continues                                     NSW                                                           $36.6 billion
tangible output such as coal, grain or gas.                 to grow. We cannot become complacent or ride
                                                            on the coat tails of strong visitor growth from                                           ACT                                                            $2.5 billion
Ministerial responsibility for tourism rarely               Asia. Setting targets, monitoring performance,
encompasses responsibility for the major pieces of          forming partnerships and investing in product and                                                                                                        $24.7 billion
infrastructure and regulation that affects the sector's     infrastructure are critical in ensuring the sustainability                                 VIC                                                                                                   (320,700 jobs by 2025)
day-to-day operation including planning, roads,             of the sector.                                                                                                                                  ($36.5 billion by 2025)

                                                                                                                                                      QLD                                                            $30 billion

                                                                                                                                                        SA                                                            $8 billion

       Employment                                                                                                                                      WA                                                             $12 billion

        Tourism                                                                                                                                        TAS                                                           $2.5 billion                          1.5 million visitors by 2020

       598,200
                                                            4                                                                                          NT                                                            $2.2 billion

       Mining                              Agriculture                       Banking

       231,800 296,900 440,200
                                                                                                              5

                                                                                                                         1
                                                                                                                           Deloitte Access Economics (2013) Positioning for Prosperity, Catching the Next Wave
                                                                                                                         2
                                                                                                                           Tourism Research Australia -source data
                                                                                                                         3
                                                                                                                           https://www.mytravelresearch.com/five-challenges-facing-regional-tourism-in-australia/
                                                                                                                         4
                                                                                                                           Tourism Research Australia (2018) State tourism satellite accounts 2016-17
                                                                                                                         5
                                                                                                                           Department of Employment (2018) Industry projections
 10    Are we there yet?                                                                                                                                                                                                                                                   Are we there yet?   11
Are we there yet? The NRMA roadmap for the visitor economy - Discovery series
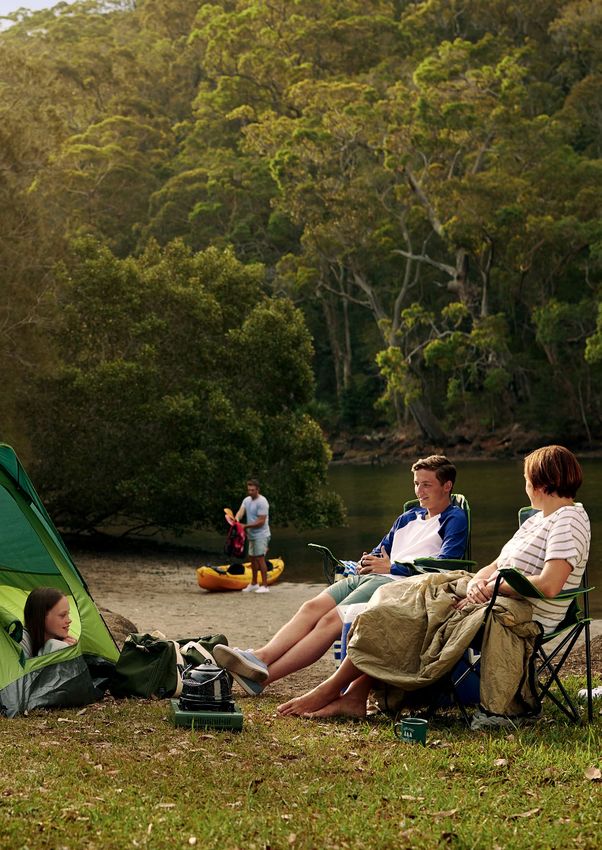
Are we achieving our targets?

     With a little over three years left until we reach 2020,
     it is important to consider whether the sector has
     done enough to meet our aspirational target. As
     Figure 1 depicts, we are only just tracking above the
     lower threshold of the stretch goal that was set6.

                                               Figure 1: Progress of total overnight visitor spend against Tourism 2020 target                                                                                                          Figure 2: Tourism Consumption Imports vs Exports $billion 2001/2 to 2016/17

                                                                                                                                                                                                        $140bn                 50.0
Overnight visitor expenditure ($ billions)

                                                                                                                                                                                                                               40.0

                                                                                                                                                                                                                               30.0

                                                                                                                                                                                                                 ($ Billion)
                                                                                                                                         97.1 at 30 June 2016          103.2 at 30 June 2017
                                                                                                                                                                                                        $115bn
                                                          71.8                                                                                                                                                                 20.0
                                             70.0
                                                                                                                                     94.5
                                                                       74.5                    77.2             80.4          85.5
                                                                                                                                                                                                                               10.0
                                                               2020           Tourism                 Setting the
                                                 NLTTS*                                                                              Seeing the results                    Looking beyond 2020
                                                             Potential         2020                   foundation
                                                                                                                                                                                                                               0
                                             2009         2010         2011             2012             2013          2014          2015         2016          2017          2018        2019   2020

                                                                                                                                                                                                                                      2001/02

                                                                                                                                                                                                                                                   2002/03

                                                                                                                                                                                                                                                             2003/04

                                                                                                                                                                                                                                                                       2004/05

                                                                                                                                                                                                                                                                                    2005/06

                                                                                                                                                                                                                                                                                              2006/07

                                                                                                                                                                                                                                                                                                        2007/08

                                                                                                                                                                                                                                                                                                                   2008/09

                                                                                                                                                                                                                                                                                                                             2009/10

                                                                                                                                                                                                                                                                                                                                       2010/11

                                                                                                                                                                                                                                                                                                                                                 2011/12

                                                                                                                                                                                                                                                                                                                                                           2012/13

                                                                                                                                                                                                                                                                                                                                                                     2013/14

                                                                                                                                                                                                                                                                                                                                                                                  2014/15

                                                                                                                                                                                                                                                                                                                                                                                            2015/16

                                                                                                                                                                                                                                                                                                                                                                                                       2016/17
                                              *National long-term tourism strategy

     National long-term tourism strategy © Tourism Australia                                                                                                                                                                                    Tourism exports                  Tourism imports

     While tourism remains one of the country’s largest                                                                our balance of trade, meaning more money is spent                                          It’s time to consider whether we’ve done enough as                                         The Chinese visitor market, for example, is the only
     services export, Australia is a net importer of tourism.                                                          overseas than is spent here in the local economy.                                          a sector to grow the industry to its full potential, and                                   market that has already exceeded its stretch target.
     In 2016-17, tourism exports totalled $37.2 billion. By                                                                                                                                                       provide a compelling reason for people to travel at                                        Table 2 outlines our current performance against
     comparison, tourism imports totalled $48.6 billion7.                                                              Since 2004-05, Australia has been a net importer                                           home. In addition, we need to consider whether our                                         targets set for each of the respective markets.
     This means more Australians travel abroad than                                                                    of tourism, with this trend continuing over the past                                       current performance has been a result of organic
     visitors travel to our shores. This has implications for                                                          decade (Figure 2).                                                                         growth and the buoyancy of the certain visitor
                                                                                                                                                                                                                  markets, namely China.

     6 Tourism Australia (2018) Tourism 2020 http://www.tourism.australia.com/en/about/our-organisation/our-performance-and-reporting/tourism-2020.html
     7 Australian Bureau of Statistics (2017) 5249.0 Australian National Accounts – Tourism Satellite Account 2016-17

                                    12         Are we there yet?                                                                                                                                                                                                                                                                                                               Are we there yet?      13
Are we there yet? The NRMA roadmap for the visitor economy - Discovery series
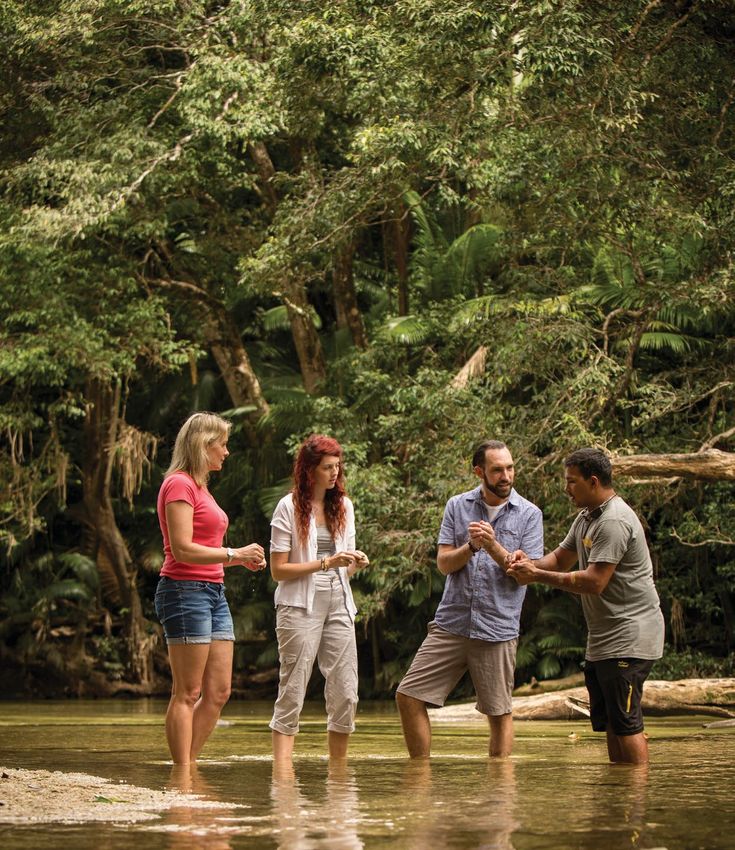
Table 2: Tourism industry performance against Tourism 2020 targets by market, 2016-17

                                                 2009            June 2017        Increase since                Current progress
        Market              2020 Target       Starting point   Current position        2009                    % Achieved/Remaining

      2020 Target               140                71.2             103.2                32                     47
                                                                                                                 47                53
                                                                                                                                   53    NSW Visitor Economy Taskforce
 Domestic Overnight            76.6               45.6              62.6                 17                     55
                                                                                                                55                 45
                                                                                                                                    45
                                                                                                                                         In 2011, the NSW Visitor Economy Taskforce was        inclusion in the Visitor Economy Industry Action
      International            63.4               25.5              40.6                 15.1                  4040               6060   established to develop an action plan to achieve      Plan (VEIAP). The industry whole-heartedly
                                                                                                                                         the Tourism 2020 target of doubling overnight         supported this process and the Government’s
         China                  9.0                2.6               9.8                 7.2                           112               visitor expenditure. The Taskforce brought together   approach to developing the Action Plan.
                                                                                                                                         government, regional tourism networks and the
         India                  2.3                0.7               1.4                 0.7                    48
                                                                                                                44                 52
                                                                                                                                   56    private sector to look at the areas critical to the   As we approach 2020, it’s time for NSW and
                                                                                                                                         sectors ongoing success, including labour and         the other states to review and set the next set
           US                   5.5                2.3               3.8                 1.5                    46
                                                                                                                46                 54
                                                                                                                                    54   skills, nature-based tourism, business events and     of targets and action items that will support the
                                                                                                                                         tourism marketing.                                    sectors future growth. The 2018 mid-term review
           NZ                   4.2                1.9               2.7                 0.8                  34 34            66 66                                                           of the NSW VEIAP is a proactive step in evaluating
                                                                                                                                         Chaired by industry leaders, the working groups       performance and the effectiveness of strategies
       Singapore                2.8                0.8               1.5                 0.8                 32 35             68 65     presented a range of recommendations for              implemented to grow the visitor economy.

       Malaysia                 2.5                0.9               1.3                 0.4                 27 25             73 75

 Other International           20.0                8.3               11.5                3.2                 27 27             73 73

         Japan                  3.3                1.5               1.8                 0.3             16      16          84     84

         France                 1.4                0.7               0.7                 0.1             9       9        91        91

      South Korea               3.4                1.4               1.5                 0.1             9       9        91        91

       Germany                  2.3                1.1               1.2                 0.1          8          8       92         92

          UK                    6.7                3.5               3.5                  0          1           1       99         99

Source: Tourism Research Australia

What’s been happening?
Since the Tourism 2020 targets were established, there         The industry is heavily taxed, raising $11 billion in
have been considerable developments which have                 revenue each year. Taxes on tourism businesses
impacted the sector’s performance.                             including company tax, land tax, stamp duty and
                                                               payroll tax can all affect the ability of businesses to
The composition of our major source markets has                invest in product refurbishment and employment.
changed, and while China has risen to be our second
largest source market growing at an annual rate of             When evaluating the performance of the industry, we
around 20 per cent, mature markets such as the                 need to consider what impact the above mentioned
United Kingdom, Germany and Japan have diminished              factors have had on our performance in order to
in size.                                                       determine the best way forward.

State and federal government resourcing around                 Now is the time to review and set targets to guide the
tourism marketing and supply-side infrastructure has           next decade of tourism growth. The NRMA believes
also changed, with responsibility for domestic tourism         regional targets must be set, including visitor nights
marketing now falling to the states.                           and expenditure targets for international and domestic
                                                               visitors to monitor and develop strategies that grow
Increases in departure taxes (Passenger Movement               visitor dispersal to the regions.
Charge) and changed visa and tax arrangements for
skilled and working holiday makers also affects the            There is a need to support grassroots initiatives and
cost of holidaying, working and traveling in Australia.        infrastructure investment that drives visitation, makes a
                                                               real difference to the community, and can be measured.

 14     Are we there yet?                                                                                                                                                                                                               Are we there yet?   15
Are we there yet? The NRMA roadmap for the visitor economy - Discovery series
The value of domestic tourism                                                                                                                                                       Why is drive tourism important?
Why focus on domestic tourism?                                                                     than international tourism. The dominance of this                                Drive tourism has been at the heart of Australian      As free and independent travel (FIT) among our
                                                                                                   contribution ranges from a 62 per cent and 63 per cent                           travel for almost a decade, and at the heart of the    key source markets increases and technology
International and domestic visitors are critical to                                                in Victoria and New South Wales, through to 76 per                               NRMA as a motoring organisation.                       improves, there is an exciting opportunity to
Australia’s visitor economy. Although domestic tourism                                             cent and 78 per cent in South Australia and Tasmania9.                                                                                  encourage greater visitation to our regions.
consumption outweighs international consumption by                                                                                                                                  Drive tourism is the largest facilitator of regional
almost three-to-one, the average international visitor                                             Tourism Research Australia reveals that the share of                             dispersal across the country, making it critical for   With fully automated vehicles predicted to be
spends $4,350 while in Australia, 12 times more than                                               GVA created by domestic travel varies from state to                              the economic prosperity of many regional towns.        on our roads as soon as 2025, there is a need
the average Australian8.                                                                           state10, but still represents the lion’s share of visitor                        Approximately 246 million self-drive trips occur       to consider how connected car technology and
                                                                                                   expenditure:                                                                     each year, of which 98 per cent are generated by       automated vehicles will change drive tourism and
This has meant in many instances luring international                                                                                                                               domestic day trip and overnight visitors.              what infrastructure needs to be in place to support
visitors to our shores has taken precedence over                                                   • interstate travel is highest for the Australian Capital                                                                               its ongoing development.
encouraging domestic travel by Australians.                                                          Territory (72 per cent), the Northern Territory                                Drive tourism generates $60 billion in the
                                                                                                     (61 per cent) and Tasmania (58 per cent);                                      Australian economy of which $37 billion or             What the NRMA wants
Yet domestic tourism is still the country’s major                                                                                                                                   63 per cent occurs in regional Australia. Self-drive
breadwinner. During 2016-17 travellers spent                                                       • intrastate travel is highest for Western Australia                             domestic overnight visitors generate almost double     • The development of inspirational self-drive
$110 billion in Australia, 75 per cent of which is                                                   (63 per cent), Queensland (47 per cent), and New                               what is spent by domestic day trip visitors, and         journeys aided by technology that encourage
generated by Australians travelling in Australia.                                                    South Wales (50 per cent)                                                      almost three times what is spent by international        greater length of stay in regional communities
Further, 89 per cent of expenditure in regional                                                                                                                                     overnight visitors.
Australia is generated by domestic visitors.                                                       • same-day travel is highest for New South Wales                                                                                        • Infrastructure that supports new types of vehicles
                                                                                                     (18 per cent), and Victoria (18 per cent).                                     As new emerging markets particularly from Asia           including electric vehicles to explore the country.
Domestic tourism makes a larger contribution to Gross                                                                                                                               become more comfortable travelling around
Value Added (GVA) of state and territory economies                                                                                                                                  Australia, their propensity to explore our country     • Investment in visitor facilities, attractions and
                                                                                                                                                                                    via car increases. While a much smaller market,          events that make the regions interesting places
                                                                                                                                                                                    international self-drive visitation has experienced      to visit.
                                                                                                                                                                                    an average annual growth rate of 9 per cent to
                                                                                                                                                                                    3.8 million visitors. By comparison, domestic          • A plan to address congestion in cities and
Figure 3: Value
                                                                                                                                                                                    overnight self-drive visitation has only grown at        major corridors that connect visitors to tourism
of domestic                                                                                                                                                                         an average of 5 per cent each year since 2011-12.        destinations and the regions.
component of
direct tourism GVA,                                                                             71%
and growth since                                                                              domestic
                                                                                               share
2015-16
                                                                                                                                      71%
                                                                                            NT                                      domestic
                                                                                        $0.8b ↑ 1.9%                                 share

                                              75%                                                                                  QLD
                                            domestic                                                                           $8.3b ↑ 4.7%
                                             share                                              76%
                                                                                              domestic
                                                                                               share
                                              WA
                                         $4.1b ↑ 0.8%                                                                             63%
                                                                                              SA                                domestic
                                                                                                                                 share
                                                                                         $2.1b ↑ 3.6%

                                                                                                                                   NSW
                                                                                                                              $10.0b ↑ 3.6%                 69%
                                                                                                                                                          domestic       ACT
                                                                                                                                                           share     $0.7b ↑ 5.7%
                                                                                                                           62%            VIC
                                                                                                                         domestic     $6.9b ↑ 9.0%
                                                                                                                          share

8
    Tourism Research Australia (2018) State Tourism Satellite Accounts, 2016-17, April 2018   9
                                                                                                  Ibid 8   10
                                                                                                                Ibid 8                           78%
                                                                                                                                               domestic         TAS
                                                                                                                                                share      $1.0b ↑ 21.0%
     16      Are we there yet?                                                                                                                                                                                                                                                                     Are we there yet?   17
Are we there yet? The NRMA roadmap for the visitor economy - Discovery series
Why is caravanning and                                                                                                                                                                Why focus on the regions?
camping important?                                                                                                                                                                    Regional holidays have an important role in                    people associating regional Australia with peaceful
                                                                                                                                                                                      fostering the wellbeing of Australians. Research               moments of quiet and reconnecting with family
Along with drive tourism, caravan and camping                                             Holiday parks also make a significant contribution                                          indicates Australians’ domestic holiday needs are              and friends15.
is going through a resurgence, led by a trend                                             to the local communities in which they operate.                                             best met through regional experiences, with 1 in 4
of people wanting to reconnect with nature and                                            For every dollar of caravan park income, $1.38
each other rather than ‘things’11. Caravanning and                                        of economic activity is generated in the local
camping has become the fastest growing domestic                                           economy14.
accommodation type in Australia, with a 5 per cent
annual growth rate year-on-year since 201112.                                             What the NRMA wants
                                                                                                                                                                                                    Top five experiences Australians want from their holidays
Contrary to popular belief, caravanning and                                               • A strategy to grow caravan and camping
camping is not just popular with grey nomads.                                               visitation among domestic and international
                                                                                                                                                                                                    delivered by regional Australia16
Nearly half of international holiday park visitors                                          visitors

                                                                                                                                                                                                    52                  %
                                                                                                                                                                                                                                                                48                %
in Australia are millennials. ‘Experiences’ trump                                                                                                                                                                               peaceful, a                                                leaving the cares of
‘things’ and these visitors will seek out experiences                                     • Identification of new and exciting locations                                                                                        moment of quiet                                            the world behind
that help shape their identity and create long term                                         for caravan parks, providing international and
memories13.                                                                                 domestic visitors with access to value-for-money
                                                                                            experiences in the best regional destinations.

                                                                                                                                                                                                    40                                                          37
In 2016-17, caravan and camping visitors spent
$4.4 billion, of which 90 per cent was injected
into regional Australia.                                                                                                                                                                               %                        re-connecting with
                                                                                                                                                                                                                                family and friends                 %                       enriching and
                                                                                                                                                                                                                                                                                           fulfilling experiences

                                                                                                                                                                                                    36 %                        indulging and
                                                                                                                                                                                                                                rewarding experiences.

                                                                                                                                                                                      But tourism isn’t only about the traveller, it’s about         Forty eight per cent of all visitor expenditure
                                                                                                                                                                                      the communities they visit. Tourism provides                   occurs in regional Australia. Not surprisingly,
                                                                                                                                                                                      opportunities to diversify the economies of local              89 per cent of expenditure in regional Australia
                                                                                                                                                                                      communities and create jobs, leading to a higher               is attributed to domestic visitors. In most of the
                                                                                                                                                                                      standard of living.                                            states, expenditure by domestic visitors can
                                                                                                                                                                                                                                                     account for at least 78 per cent of expenditure in
                                                                                                                                                                                      In order for the sector to be successful, the local            regional destinations (See Figure 4).
                                                                                                                                                                                      community must be at the heart of the experience.
                                                                                                                                                                                      Locals must be willing to engage in the industry               International visitors are generally less likely to
                                                                                                                                                                                      and with the visitors it attracts. In return, visitors         travel to regional destinations or spend as long
                                                                                                                                                                                      should acknowledge and respect the character of                once there, due to time, distance and Australia
                                                                                                                                                                                      these destinations and its people.                             being a relatively high-cost destination.

11
   Caravan Industry Association of Australia (2017) Towards 2030: A Connected Future 12 Ibid 11   13
                                                                                                       Ibid 11   14
                                                                                                                      BDO (2012) Caravan, RV & Accommodation Industry of Australia,
Economic Benefit Report – Commercial Caravan Park to a Local Community, October 2012
                                                                                                                                                                                      15
                                                                                                                                                                                           KANTAR TNS (2017) Domesticate 2017
                                                                                                                                                                                      16
                                                                                                                                                                                           Ibid 15

  18      Are we there yet?                                                                                                                                                                                                                                                                                Are we there yet?   19
Why focus on the regions?
                                                                                                                                                                        Looking through the rearview
During 2016-17, only 42 per cent of international                                       of Australia, with 69 per cent of those travelling                              The NRMA is committed to growing visitation to the        Based on current regional performance, the Tourism
visitors to capital cities went beyond the city gateway,                                in regional areas having three or more stopovers                                regions to 2020 and beyond. This means focusing on        2020 targets and projected visitation, the NRMA has
compared to 67 per cent of domestic overnight trips                                     while in Australia18.                                                           those parts of the visitor economy that generate stable   projected visitor nights and spend for both capital
that included a regional destination. International                                                                                                                     and consistent visitation year on year, including drive   cities and regional Australia overnight.
visitation to Australia’s capital cities continues to grow                              There is a need to continually improve and                                      tourism and caravanning and camping.
faster than that to regional Australia (up 8.9 per cent                                 facilitate the movement of people to our regions,                                                                                         The forecasts highlight the potential of the sector
compared to 6.2 per cent)17.                                                            provide authentic value-for-money experiences,                                  The following tables summarise the key trends in          beyond 2020, and should be used to start a
                                                                                        and support the economic development of                                         visitation, nights, and expenditure in each of the        conversation about the next set of industry growth
However, those international visitors travelling to                                     these areas.                                                                    states, including regional Australia. The NRMA has        targets to 2030.
regional areas are now more likely to take in more                                                                                                                      detailed the contribution of tourism to each regional
                                                                                                                                                                        tourism destination in state-based appendices
                                                                                                                                                                        accompanying this document.

Figure 4: Proportion of regional tourism expenditure within each state

                                                                       International                      Domestic overnight                        Domestic day                Summary of key results: visitation to Australia

                                                                                                                                                                                 188
                                                                                                                                                                                                        million day visitors representing                                 Domestic overnight
90%
                                                                                                                                                                                                        65 per cent of total visitors,                                    visitors

80%                                                                                       78%
                                                                                                                                                                                                        yet only 18 per cent of spend
                                                                                                                                                                                                                                                                          spend more

                                                                                                                                                                                                                                  1.6
                                                                                                                                                                                Northern Territory has experienced                                                        than double

                                                                                                                                                                                                                                                       million visitors
70%             68%                                                                                                            71%
                                                    66%                                                                                       66%               67%
                                  61%
                                                                       63%                                  62%
                                                                                                                                                                                the largest average annual growth                                                         international visitors and
60%                                                                                                                                                                             rate in domestic overnight visitation                                                     3 times more than day
                                                                                                                                                                                at 12 per cent since 2011-12 to                                                           trip visitors.
50%

                                                                                                                                                                                 $
                                                                                                                                                                                      62
40%
                                                                                                                                                                                                               billion spent by                       Average annual growth in
                                        33%                                 32%
30%                                                                                                                                                                                                            domestic overnight                     international expenditure is
                                                                                                                 27%
                    25%
                                                                                                                          22%               22%                   22%                                          visitors – 57 per                      2.2 times domestic overnight
20%
                                               18%
                                                                                                                                                                                                               cent to total spend                    expenditure - growing on

                                                                                                                                                                                                                                                                               28
                                                         17%                                   15%

                                                                                                                                                                                                                                                                           $
                                                                                                                                                    13%
                                                                                                        11%                                               11%                                                                                         average

                                                                                                                                                                                                                                                                                                 billion
 10%       7%                6%
                                                                                                                                                                                                                                                      11 per

                                                                                                                                                                                     110 29%
                                                                  5%                 7%                                                7%

     0%

              NSW                 VIC              QLD                 SA                WA                TAS                 NT             ACT         National
                                                                                                                                                                                $                                    Total spend has
                                                                                                                                                                                                                     increased
                                                                                                                                                                                                                                                      cent each
                                                                                                                                                                                                                                                      year to

                                                                                                                                                                                             48%
                                                                                                                                                                                 billion in spend                                                                            of total visitor
                                                                                                                                                                                 – 75 per cent by                                                                            expenditure occurs
                                                                                                                                                                                 domestic visitors                   since 2011-12                                           in regional Australia

                                                                                                                                                                                                                                                  253,000
                                                                                                                                                                                                Tasmania has had the largest average
                                                                                                                                                                                                annual growth rate in international
                                                                                                                                                                                                visits – 16 per cent since 2011-12 to
                                                                                                                                                                                                                                                                                international visitors
17
   Tourism Research Australia (2018) State of the Industry 2016-17 Summary – February 2018. Note: TRA figure includes the Gold Coast
18
   ibid 17

     20   Are we there yet?                                                                                                                                                                                                                                                             Are we there yet?   21
Summary of key results: drive tourism                                                                         Summary of key results: caravan and camping

                                        63 246               %
                                                                                                              6.7 93                                                        %             $
                                                                                                                                                                                              4.4
Drive tourism generates

                                                                                                                                         million
$
      60
billion in visitor expenditure
                                        of expenditure generated
                                        by road trips occurs in
                                        regional Australia
                                                                              million visitors took a
                                                                              road trip in 2016-17 – 98
                                                                              per cent of these trips
                                                                              completed by Aussies
                                                                                                              caravan and camping visitors
                                                                                                                                                      of visitor spend attributed to
                                                                                                                                                      domestic overnight visitors
                                                                                                                                                                                          billion in caravan
                                                                                                                                                                                          and camping
                                                                                                                                                                                          spend

                                                                                                                                                                                          For every $1 spent
                                                                                                                                                                                          in a caravan and
                                                                                                                                             International                                camping ground,

The Northern Territory                                                                                                                       caravan and                                  a further

                            experienced the largest average annual
                            growth rate in domestic overnight drive
                                                                                                                                             camping
                                                                                                                                             visitation has grown three times faster
                                                                                                                                             than domestic overnight visitation to
                                                                                                                                                                                          $
                                                                                                                                                                                             1.38
                                                                                                                                                                                          delivered to the
                            visitation at 14% - 781,000 visitors                                                                             263,000 visitors.                            economy

                                                                  19       %
                            Tasmania experienced the largest                     since 2011-12

85
                            average annual growth rate in                        to 91,000                    Summary of key results: the road ahead
                   %        international drive visitors at                      international visitors

                                                                                                              $
                                                                                                                  62
                                                                                                                                                                  545 million visitor nights generated by

                                                                                                                              billion
                            338 million                                                                                                                           road trips
of all trips involve
travel by car

                                                                                                              could be generated in
                            nights spent by self-drive visitors in Australia in 2016-17                       regional Australia                                  by 2029-30
54 per cent of drive
tourism expenditure
contributed by

                                                                                                                                                             150 billion
                            Self-drive trips represent            Tasmania has seen 25 per cent
domestic overnight
                                                                                                                                                            $

                            86
visitors                                                          average annual growth in

                                                     %
                                                                  international drive expenditure to

 32
                                                                                                              Overnight visitor expenditure could grow to                                              by 2029-30

                                                                        118
$
                                                                  $
                                                                                                    million

                                                                                                                                                                      389
                                                                                                              The country could                                                               million overnight

billion                     of all domestic trips.
                                                                                                              attract 1 billion
                                                                                                              visitor nights
                                                                                                              nationally by
                                                                                                                                  2029-30                                                     trips in regional
                                                                                                                                                                                              Australia by
                                                                                                                                                                                              2029-30

 22   Are we there yet?                                                                                                                                                                        Are we there yet?   23
Economic contribution of tourism
                                     Total tourism visitation                                        Total visitor nights                                                            Total tourism expenditure                                         Employment

                                                                Visitors (000)                           Nights (000)                                                                                   Regional expenditure ($M)
                                                           Dom.           Dom.                               Dom.
     Stopover region          Financial year     Int'l                               Total     Int'l                     Total        Stopover region               Financial year          Int'l    Dom. overnight   Dom. daytrips   Total                Total
                                                         overnight       daytrips                          overnight
                                 2011/12         570       17,178         34,397    52,145     10,931       60,655      71,585                                             2011/12          665          8,272             3,415      12,351
      Regional NSW               2016/17         812       21,179          37,022   59,013    14,806        70,081      84,887         Regional NSW                        2016/17          1,065        10,474            3,766      15,304              90,400
                            Av. Annual change    9%         5%              2%        3%        7%            3%          4%                                     Av. Annual change          12%           5%                2%         5%
                                 2011/12        2,753     24,251          53,828    80,832    66,743        82,698      149,441                                            2011/12          6,123        13,760            5,587      25,469
           NSW                   2016/17        4,008     29,981           56,707   90,696    92,512        96,296      188,808              NSW                           2016/17         10,099        17,158            5,922      33,178               171,100
                            Av. Annual change    9%         5%               1%       2%        8%            3%          5%                                     Av. Annual change          13%           5%                1%          6%
                                 2011/12         326       11,570         28,668    40,564     5,319        34,932      40,251                                             2011/12          367          4,326             2,590       7,285
     Regional Victoria           2016/17         526       15,110          32,715   48,351     8,161        42,544      50,705        Regional Victoria                    2016/17          541          5,467             2,968      8,976               64,700
                            Av. Annual change    12%        6%              3%        4%        11%           4%          5%                                     Av. Annual change           9%           5%                3%         5%
                                 2011/12        1,739     17,909           44,119   63,767    43,600        54,009      97,609                                             2011/12          4,221        10,021            4,415      18,659
         Victoria                2016/17        2,761     23,150          48,942    74,853    67,377        66,347      133,724            Victoria                        2016/17          7,496        12,916            4,780      25,191              143,800
                            Av. Annual change    12%        6%              2%        3%        11%           5%          7%                                     Av. Annual change          16%           6%                2%          7%
                                 2011/12        1,461     13,597          24,633    39,691    23,280        59,691      82,971                                             2011/12          2,301        10,516            2,734      15,550
Regional Queensland              2016/17        1,971     15,636          26,564    44,171    27,750        63,776      91,526     Regional Queensland                     2016/17         3,068         11,313            2,887      17,265               98,100
                            Av. Annual change    7%         3%              2%        2%        4%            1%          2%                                     Av. Annual change           7%           2%                1%          2%
                                 2011/12        1,935      17,951          37,293    57,179   42,118        74,966      117,084                                            2011/12          3,812        13,596           4,060       21,466
       Queensland                2016/17        2,618     21,342           39,918   63,878    53,910        82,753      136,663          Queensland                        2016/17         5,232         15,167            4,249      24,645              137,500
                            Av. Annual change    7%         4%              1%        2%        6%            2%          3%                                     Av. Annual change           7%           2%                1%          3%
                                 2011/12         122       3,210           7,694    11,026     1,701        11,756      13,457                                             2011/12           85           1,417             619        2,122
       Regional SA               2016/17         154       3,743           8,418    12,315     1,962        13,156       15,118          Regional SA                       2016/17          134          1,644             825        2,605                15,700
                            Av. Annual change    5%         3%              2%        2%        3%            2%          2%                                     Av. Annual change          12%           3%                7%          5%
                                 2011/12         328       5,081           11,705    17,114    9,223        18,667      27,890                                             2011/12          647          3,312             1,085      5,045
            SA                   2016/17         435       6,143           13,188   19,766    10,934        21,458      32,393                SA                           2016/17          1,061        3,812             1,367      6,242               36,000
                            Av. Annual change    7%         4%              3%        3%        4%            3%          3%                                     Av. Annual change          13%           3%                5%          5%
                                 2011/12         228       3,528           4,529    8,285      5,718        16,569      22,286                                             2011/12           313         2,597             548        3,459
      Regional WA                2016/17         289       6,039           6,346    12,674    5,540         28,553      34,093          Regional WA                        2016/17          370          3,930              756       5,054               32,000
                            Av. Annual change    5%        14%              8%        11%       -1%          14%          11%                                    Av. Annual change           4%           10%               8%          9%
                                 2011/12         731       6,082           14,154   20,967    25,740        26,960      52,700                                             2011/12          2,106         5,011            1,452      8,570
           WA                    2016/17         965       9,425           19,607   29,997    28,066        41,184      69,249                WA                           2016/17         2,505          7,101            2,245      11,849               71,100
                            Av. Annual change    6%         11%             8%        9%        2%           11%          6%                                     Av. Annual change           4%           8%                11%        8%
                                 2011/12         75        1,166           2,880     4,121     1,119         4,279      5,398                                              2011/12           102          796              283         1,179
 Regional Tasmania               2016/17         140       1,550           3,668    5,358      1,752        5,609        7,361       Regional Tasmania                     2016/17          189           1,017             441        1,645               9,700
                            Av. Annual change    17%        7%              5%        6%        11%           6%          7%                                     Av. Annual change          17%           6%                11%         8%
                                 2011/12         139       1,976           4,887     7,002     2,811        8,646       11,458                                             2011/12          238          1,584              470       2,289
        Tasmania                 2016/17         253       2,658           5,646     8,557    3,940         10,917      14,858            Tasmania                         2016/17          456          2,290             645        3,389                18,900
                            Av. Annual change    16%        7%              3%        4%        8%            5%          6%                                     Av. Annual change          18%           9%                7%         10%
                                 2011/12         211        611             597      1,419     1,806         3,136       4,942                                             2011/12          234           576               73         883
       Regional NT               2016/17         231       1,044            956      2,231     1,499         4,951      6,449            Regional NT                       2016/17          324          1,060              112        1,494               4,600
                            Av. Annual change    2%        14%              12%       11%      -3%           12%          6%                                     Av. Annual change           8%           17%               11%        14%
                                 2011/12         264       1,017            1,112   2,393     3,547         6,288        9,835                                             2011/12          352          1,307              182        1,841
            NT                   2016/17         302       1,607           1,599    3,508     3,909          9,273      13,183                NT                           2016/17          486           1,987             216       2,687                9,000
                            Av. Annual change    3%        12%              9%        9%        2%            9%          7%                                     Av. Annual change           8%           10%               4%          9%
                                 2011/12         162       1,879           1,715     3,757     4,180         5,041       9,221                                             2011/12          338          1,048              291        1,677
           ACT                   2016/17         221       2,649           2,093    4,964     4,584         6,703       11,287               ACT                           2016/17          535           1,621            309        2,466                10,600
                            Av. Annual change    7%         8%              4%        6%        2%            7%          4%                                     Av. Annual change          12%           11%               1%          9%
                                 2011/12        2,323     49,281          103,398   155,002   49,873        191,017     240,891                                            2011/12          4,067        28,500           10,262      42,829
 Regional Australia              2016/17        3,275     62,333          115,688   181,296   61,469        228,670     290,138      Regional Australia                    2016/17          5,691        34,905            11,755     52,343              315,200
                            Av. Annual change    8%         5%              2%        3%        5%            4%          4%                                     Av. Annual change           8%           4%                3%         4%
                                 2011/12        5,387     73,302          168,813   247,502   197,962       277,276     475,238                                            2011/12         17,837        49,639           17,542      85,016
         Australia               2016/17        7,769     93,420          187,702   288,891   265,232       334,932     600,164            Australia                       2016/17         27,870        62,052           19,733      109,647             598,200
                            Av. Annual change    9%         5%              2%        3%        7%            4%          5%                                     Av. Annual change          11%           5%                2%          6%

                                                                                                                                  Source: Tourism Research Australia
24      Are we there yet?                                                                                                         Notes: Based on financial year figures                                                                        Are we there yet?    25
Drive tourism
                                     Drive tourism visitation                                    Total visitor nights                                                             Drive tourism expenditure
                                                             Visitors (000)                           Nights (000)                                                                                    Regional expenditure ($M)
                                                           Dom.        Dom.                              Dom.                       Stopover region              Financial year     Int'l        Dom. overnight        Dom. daytrips            Total
     Stopover region          Financial year     Int'l                             Total     Int'l                    Total
                                                         overnight    daytrips                         overnight
                                                                                                                                                                        2011/12     307              6,521                 3,278               10,108
                                 2011/12         345      15,359       32,854     48,558    4,795        51,903      56,698
                                                                                                                                     Regional NSW                       2016/17     496              8,494                 3,636               12,624
      Regional NSW               2016/17         498      18,826       35,343     54,667    7,304        60,101      67,405
                                                                                                                                                              Av. Annual change     12%               6%                    2%                   5%
                            Av. Annual change    9%         5%           2%         3%       10%          3%           4%
                                                                                                                                                                        2011/12     1,874            8,132                 4,870               14,878
                                 2011/12         984      18,943        48,231    68,158    26,241       61,871      88,112
                                                                                                                                          NSW                           2016/17    2,880             10,535                5,193               18,607
           NSW                   2016/17        1,340     23,213       50,900     75,453    36,725       72,681      109,406
                                                                                                                                                              Av. Annual change     11%               6%                    1%                   5%
                            Av. Annual change    7%         5%            1%        2%       8%           3%           5%
                                                                                                                                                                        2011/12      197             3,441                 2,484                6,131
                                 2011/12         252      10,412        27,292    37,956    2,743        29,699      32,442
                                                                                                                                   Regional Victoria                    2016/17     326              4,791                 2,896               8,009
     Regional Victoria           2016/17         409      13,894        31,646    45,949    4,730        38,237      42,967
                                                                                                                                                              Av. Annual change     13%               8%                    3%                   6%
                            Av. Annual change    12%        7%           3%         4%       14%          6%           6%
                                                                                                                                                                        2011/12     1,516            4,753                 3,886               10,164
                                 2011/12         687      13,226       39,856     53,769    19,668       37,084      56,752
                                                                                                                                         Victoria                       2016/17     2,707            6,543                 4,224               13,469
         Victoria                2016/17        1,095     17,242       44,764     63,101    29,862       47,108      76,970
                                                                                                                                                              Av. Annual change     16%               8%                    2%                   7%
                            Av. Annual change    12%        6%           2%         3%       10%          5%           7%
                                                                                                                                                                        2011/12     684              5,260                 2,608               8,553
                                 2011/12         488       9,911       23,682     34,081    7,908       36,382       44,290
                                                                                                                                 Regional Queensland                    2016/17     933              5,843                 2,782                9,558
Regional Queensland              2016/17         647      11,538        25,819    38,004    11,109       40,511      51,620
                                                                                                                                                              Av. Annual change      7%               2%                    1%                   2%
                            Av. Annual change    7%         3%           2%         2%       8%           2%           3%
                                                                                                                                                                        2011/12     1,275            6,314                 3,700               11,290
                                 2011/12         715      12,391        34,561    47,667    16,462      44,097       60,559
                                                                                                                                      Queensland                        2016/17     1,861             7,134                3,931               12,925
       Queensland                2016/17        1,006     14,921        37,741    53,668    24,696      50,849       75,545
                                                                                                                                                              Av. Annual change      9%               3%                    1%                   3%
                            Av. Annual change    8%         4%           2%         3%       10%          3%           5%
                                                                                                                                                                        2011/12      43              1,009                 600                  1,653
                                 2011/12         79       2,800         7,455     10,334     813         9,496       10,309
                                                                                                                                      Regional SA                       2016/17      76              1,260                  794                 2,127
       Regional SA               2016/17         98       3,340         8,158     11,596     1056        10,914      11,969
                                                                                                                                                              Av. Annual change     15%               5%                    6%                   6%
                            Av. Annual change    5%         4%           2%         2%       6%           3%           3%
                                                                                                                                                                        2011/12      217              1,511                 999                 2,728
                                 2011/12         145       3,740        11,208    15,093    3,637        12,513      16,150
                                                                                                                                           SA                           2016/17      413             1,979                 1,255               3,644
            SA                   2016/17         201      4,550        12,484     17,235    4,746        14,637      19,383
                                                                                                                                                              Av. Annual change     18%               6%                    5%                   7%
                            Av. Annual change    8%         4%           2%         3%       6%           3%           4%
                                                                                                                                                                        2011/12      149              1,512                 498                 2,158
                                 2011/12         141       2,798        4,300      7,239    2,380        10,745      13,125
                                                                                                                                      Regional WA                       2016/17      241             2,400                  706                3,346
      Regional WA                2016/17         216       4,587        6,173     10,976    2,986        16,672      19,659
                                                                                                                                                              Av. Annual change     12%               12%                   8%                   11%
                            Av. Annual change    11%       13%           9%        10%       5%           11%         10%
                                                                                                                                                                        2011/12     1,075             2,116                1,301                4,491
                                 2011/12         384      4,386         13,109    17,879    13,815       15,200      29,015
                                                                                                                                           WA                           2016/17     1,470            3,636                 2,046                7,151
           WA                    2016/17         574       6,946        18,510    26,030    17,165       23,199      40,364
                                                                                                                                                              Av. Annual change      7%               14%                   11%                 12%
                            Av. Annual change   10%        12%           8%         9%       5%           11%          8%
                                                                                                                                                                        2011/12      36               419                   265                  719
                                 2011/12         39        903          2,786      3,728     284         2,653        2,938
                                                                                                                                  Regional Tasmania                     2016/17      71               479                   429                 979
 Regional Tasmania               2016/17         78        1,153        3,544      4,775     498         3,295        3,793
                                                                                                                                                              Av. Annual change     19%               3%                    12%                  7%
                            Av. Annual change   20%         6%           5%         6%       15%          5%           6%
                                                                                                                                                                        2011/12      53               645                  440                  1,137
                                 2011/12         46        1,355        4,681     6,082      529         4,384        4,913
                                                                                                                                       Tasmania                         2016/17      118              908                   625                 1,650
        Tasmania                 2016/17          91       1,751        5,435      7,277     853         5,452       6,305
                                                                                                                                                              Av. Annual change     25%               8%                    8%                   9%
                            Av. Annual change    19%        6%           3%         4%       12%          5%           6%
                                                                                                                                                                        2011/12      67               249                   59                  385
                                 2011/12         56        381           552       989       421         1,652        2,072
                                                                                                                                      Regional NT                       2016/17      92               504                   103                  701
       Regional NT               2016/17         67        668           914       1,649     621         2,703        3,324
                                                                                                                                                              Av. Annual change      7%               20%                   15%                 16%
                            Av. Annual change    4%        15%           13%       13%       10%          13%         12%
                                                                                                                                                                        2011/12      88               357                   159                  614
                                 2011/12         67        460           1,011     1,538     778         2,292        3,070
                                                                                                                                           NT                           2016/17      151              650                   204                 1,008
            NT                   2016/17         87         781         1,529      2,397    1,658        3,374        5,032
                                                                                                                                                              Av. Annual change     14%               16%                   6%                  13%
                            Av. Annual change    6%        14%           10%       11%       23%          9%          13%
                                                                                                                                                                        2011/12      68               520                   248                 837
                                 2011/12         70        1,312        1,553      2,936    1,086        3,112        4,198
                                                                                                                                           ACT                          2016/17      90               872                   260                 1,223
           ACT                   2016/17         99        1,814        1,885     3,798      1,019       4,429       5,448
                                                                                                                                                              Av. Annual change      6%               14%                   1%                   9%
                            Av. Annual change    8%         8%           4%         6%       -1%          8%           6%
                                                                                                                                                                        2011/12     1,483            18,411                9,733               29,707
                                 2011/12        1,105     41,330       98,920     141,355   19,344      142,531      161,875
                                                                                                                                  Regional Australia                    2016/17     2,235            23,771                11,243              37,344
 Regional Australia              2016/17        1,609     52,340        111,597   165,546   28,304      172,433      200,737
                                                                                                                                                              Av. Annual change     10%               6%                    3%                   5%
                            Av. Annual change    9%         5%           3%         3%       9%           4%           5%
                                                                                                                                                                        2011/12     6,166            24,348               15,544               46,139
                                 2011/12        2,596     54,097       154,211    210,904   82,215      180,553      262,768
                                                                                                                                        Australia                       2016/17     9,690            32,257                17,635              59,677
         Australia               2016/17        3,759     68,853       173,250    245,862   116,724     221,729      338,453
                                                                                                                                                              Av. Annual change     11%               6%                    3%                   6%
                            Av. Annual change    9%         5%           2%         3%       8%           5%           6%

                                                                                                                               Source: Tourism Research Australia
26      Are we there yet?                                                                                                      Notes: Based on financial year figures                                                                  Are we there yet?   27
Caravan and camping
                                  Caravan and camping                                    Total visitor nights                                                                    Caravan and camping expenditure
                                                        Visitors (000)                       Nights (000)                                                                                                 Regional Expenditure ($m)
                                                            Dom.                                 Dom.                           Stopover region                     Financial year             Int'l           Dom. overnight               Total
     Stopover region         Financial year     Int'l                    Total   Int'l                          Total
                                                          overnight                            overnight
                                 2011/12        62          1,974        2,036   384            10,154          10,538                                                 2011/12                 28                   1,016                   1,044
      Regional NSW                                                                                                               Regional NSW                          2016/17                 39                   1,267                   1,306
                                 2016/17        90          2,259        2,349   580             9,972          10,552
                            Av. Annual change   9%           3%           3%     10%              0%             0%                                               Av. Annual change            8%                    5%                      5%
                                 2011/12        65          2,050        2,115   504            10,497          11,001                                                 2011/12                 38                   1,075                    1,113
           NSW                   2016/17        96          2,359        2,455   675            10,554          11,230                NSW                              2016/17                 50                   1,369                   1,419
                            Av. Annual change   9%           3%           3%      7%              0%             0%                                               Av. Annual change            6%                    5%                      5%
                                 2011/12        44          1,422        1,466   323             5,637          5,960                                                  2011/12                 25                   640                      665
     Regional Victoria           2016/17        55          1,604        1,659   327             5,735          6,062           Regional Victoria                      2016/17                 20                   752                      772
                            Av. Annual change   5%           3%           3%     0%               0%             0%                                               Av. Annual change            -4%                   4%                      3%
                                 2011/12        49          1,458        1,507   395            5,804           6,199                                                  2011/12                 33                   669                      702
         Victoria                2016/17         62         1,639        1,701   408             5,916          6,324                Victoria                          2016/17                 30                   789                      819
                            Av. Annual change   5%           2%           3%      1%              0%             0%                                               Av. Annual change            -2%                   4%                      3%
                                 2011/12         78          913          991    1,108           5,213          6,321                                                  2011/12                  87                  663                      750
Regional Queensland              2016/17         87          969         1,056   919             5,669          6,589        Regional Queensland                       2016/17                  81                   712                     793
                            Av. Annual change   2%           1%           1%     -3%              2%             1%                                               Av. Annual change            -1%                   1%                      1%
                                 2011/12        82          1,034        1,116   1,233           5,745          6,978                                                  2011/12                 98                    731                     829
       Queensland                2016/17        95          1,073        1,168   1,082           6,147          7,229             Queensland                           2016/17                 93                   756                      849
                            Av. Annual change   3%           1%           1%     -2%              1%             1%                                               Av. Annual change            -1%                   1%                      0%
                                 2011/12         22          584         606      112            2,368          2,480                                                  2011/12                  7                   252                      259
       Regional SA               2016/17        28           609         637     134             2,511          2,644             Regional SA                          2016/17                  11                  283                      294
                            Av. Annual change   5%           1%           1%      4%              1%             1%                                               Av. Annual change            11%                   2%                      3%
                                 2011/12         27          643         670      162            2,672          2,834                                                  2011/12                  12                  329                      341
            SA                   2016/17        35           684          719     211            2,980          3,191                   SA                             2016/17                  18                  338                      356
                            Av. Annual change   6%           1%           1%      6%              2%             3%                                               Av. Annual change            10%                   1%                      1%
                                 2011/12        38           526         564     520             2,948          3,468                                                  2011/12                  37                  306                      343
       Regional WA               2016/17        50           679         729     552             4,194          4,746             Regional WA                          2016/17                  51                  483                      534
                            Av. Annual change   6%           6%           6%      1%              8%             7%                                               Av. Annual change            8%                   12%                      11%
                                 2011/12         41          575          616    583             3,171          3754                                                   2011/12                 45                   334                      379
           WA                    2016/17         55          774         829     629             4,535          5,163                  WA                              2016/17                 60                   533                      593
                            Av. Annual change   7%           7%           7%      2%              9%             8%                                               Av. Annual change            7%                   12%                      11%
                                 2011/12         7           87           94      55             338             394                                                   2011/12                  5                    37                      42
 Regional Tasmania               2016/17         16          148          164     61             585             646          Regional Tasmania                        2016/17                  8                    74                      82
                            Av. Annual change   24%          14%         15%      2%             15%             13%                                              Av. Annual change            12%                  20%                      19%
                                 2011/12         9           116          125     90              481            572                                                   2011/12                  8                    48                      56
        Tasmania                 2016/17         18          187         205      113             851            964                Tasmania                           2016/17                  13                   133                     146
                            Av. Annual change   21%          12%         13%      5%             15%             14%                                              Av. Annual change            13%                  35%                     32%
                                 2011/12         41          126          167     215            763             979                                                   2011/12                  41                   96                      137
       Regional NT               2016/17         42          166         208      197            920             1,118            Regional NT                          2016/17                 45                    141                     186
                            Av. Annual change   0%           6%           5%     -2%              4%             3%                                               Av. Annual change            2%                    9%                      7%
                                 2011/12        44           135          179    298             950            1,248                                                  2011/12                 45                    130                     175
            NT                   2016/17        45           171          216    259             1,151          1,410                   NT                             2016/17                 50                    162                     212
                            Av. Annual change   1%           5%           4%     -3%              4%             3%                                               Av. Annual change            2%                    5%                      4%
                                 2011/12         7           50           57      14              137            151                                                   2011/12                  2                    16                       18

           ACT                   2016/17         6           42           49      17              185            202                   ACT                             2016/17                  3                    21                      24

                            Av. Annual change   -2%          -3%         -3%      4%              7%             7%                                               Av. Annual change            10%                   6%                      7%
                                 2011/12        191         5,322        5,513   2,717          27,422          30,139                                                 2011/12                 231                 3,009                    3,240
 Regional Australia              2016/17        242         5,965        6,207   2,770          29,587          32,357         Regional Australia                      2016/17                 255                  3,713                   3,968
                            Av. Annual change   5%           2%           3%      0%              2%             1%                                               Av. Annual change            2%                    5%                      4%
                                 2011/12        204         5,731        5,935   3,278          29,459          32,737                                                 2011/12                 281                  3,333                   3,614
         Australia               2016/17        263         6,438        6,701   3,394          32,320          35,714              Australia                          2016/17                 318                  4,101                   4,419
                            Av. Annual change   6%           2%           3%      1%              2%             2%                                               Av. Annual change            3%                    5%                      4%

                                                                                                                         Source: Tourism Research Australia
28      Are we there yet?                                                                                                Notes: Based on financial year figures                                                                       Are we there yet?   29
2029 -30 Industry potential:
Projections

                                                                               All Tourism Nights (000)                                                                                                                             Overnight Visitor Expenditure ($m)
                                                                                                                                                                     Australia
         Australia                               Capital City                                           Regional Australia                                                                                    Capital City                            Regional Australia                                Total

                                  International           Domestic Overnight               International           Domestic Overnight    Total                          2017-18                                   50,829                                      42,331                                    93,160

          2017-18                     232,098                     122,993                      55,585                      220,176      630,851                         2018-19                                   53,551                                      43,786                                    97,337

          2018-19                     247,403                     126,578                      58,795                     226,406       659,183                         2019-20                                   56,220                                      45,124                                   101,344

          2019-20                     262,634                     129,788                      61,867                      231,979      686,269                         2020-21                                   58,869                                      46,448                                    105,318

          2020-21                     277,773                     132,943                      64,919                     237,465        713,100                        2021-22                                    61,613                                     47,791                                   109,404

          2021-22                     293,592                     136,076                      68,158                     242,863       740,689                      2022-23                                      64,429                                      49,145                                    113,574

         2022-23                      309,946                     139,183                      71,550                      248,167      768,846                      2023-24                                      67,374                                      50,520                                    117,893

         2023-24                      327,166                      142,311                     75,047                     253,495       798,019                      2024-25                                      70,432                                      51,924                                   122,357

         2024-25                      345,161                     145,460                      78,711                     258,846       828,177                      2025-26                                      73,641                                      53,361                                   127,003

         2025-26                      364,177                     148,628                      82,552                      264,217      859,574                      2026-27                                       77,012                                     54,828                                   131,840

         2026-27                      384,279                      151,815                     86,563                      269,609      892,266                      2027-28                                      80,531                                      57,022                                    137,552

         2027-28                      407,336                     155,327                      91,238                     275,547       929,448                      2028-29                                       84,211                                     59,302                                   143,514

         2028-29                      431,776                     158,920                      96,165                      281,617      968,477                      2029-30                                      88,060                                      61,674                                   149,734

         2029-30                      457,683                     162,596                     101,358                      287,819      1,009,457

                                                                                                                                                    Data notes:
                                                                            Self Drive Tourism Nights (000)
                                                                                                                                                    Source
         Australia                               Capital City                                           Regional Australia                          • Tourism Research Australia (TRA)

                                                                                                                                                    Employment
                                  International           Domestic Overnight               International           Domestic Overnight    Total      • Estimates for each tourism region have been sourced from TRA’s 2016-17 Regional Tourism Satellite Accounts.

                                                                                                                                                    Visitor Estimates
          2017-18                     100,455                     56,399                       26,716                      160,941      344,511
                                                                                                                                                    • Components may not add to totals as visitors may visit more than one tourism region on a trip.
          2018-19                     102,512                      58,019                      27,776                      183,782      370,124     Expenditure Estimates

          2019-20                     108,796                      59,469                      29,234                     188,235       383,729     • Expenditure excludes all motor vehicle, capital and major equipment purchases and for international visitors any pre-purchased international
                                                                                                                                                      airfares and 70 per cent of pre-purchased packages assumed to be spent outside Australia.
          2020-21                     115,047                     60,893                       30,685                      192,613       397,194    • For self-drive, expenditure for each tourism region refers to total expenditure in that region by visitors who arrived by self-drive vehicle.
                                                                                                                                                    • For caravan and camping, expenditure for each tourism region refers to total expenditure in that region by visitors who stayed in a commercial
          2021-22                     121,572                      62,307                      32,222                      196,916      410,936       caravan park or camping ground during their visit.

         2022-23                      128,318                     63,709                       33,833                      201,140      424,881     Tourism Region Estimates
                                                                                                                                                    • Tourism regions estimates for nearly all metrics are based on the region boundaries which applied in 2017. The caravan and camping expenditure
         2023-24                      135,417                      65,120                      35,495                     205,381       439,256       estimates are based on 2018 region boundaries. The differences between 2017 and 2018 region boundaries are negligible.
                                                                                                                                                    • Where a tourism region is asterisked (*) one or more of the estimates is subject to high sampling variability. In these instances, the estimates and
         2024-25                      142,833                      66,541                      37,236                     209,637       454,052       growth rates reported should be treated with caution.
                                                                                                                                                    • The Gold Coast tourism region is included in Regional Queensland estimates.
         2025-26                      150,669                      67,970                      39,063                      213,907      469,377
                                                                                                                                                    Inclusions and Exclusions
         2026-27                      158,951                     69,408                       40,971                      218,191      485,250
                                                                                                                                                    • Regional, State and National totals include relevant estimates from tourism regions where data has been confidentialised and not published (i.e. np
                                                                                                                                                      cells).
         2027-28                      156,348                      71,923                      41,906                     235,692       505,869
                                                                                                                                                    • Regional, State and National totals exclude stopovers by visitors to unspecified, offshore and/or transit locations.
         2028-29                      166,007                      73,587                      44,764                     240,883       525,241     Projections
                                                                                                                                                    • Visitor overnight forecasts derived from TRA data
         2029-30                      176,262                      75,289                      47,181                     246,189       544,922
                                                                                                                                                    • Self-drive visits and visitor nights have been calculated using a five-year average of the percentage self-drive represents of all tourism
                                                                                                                                                    • Expenditure forecasts have been calculated using visitor nights as a pro rata proxy
Source: Tourism Research Australia
                                                                                                                                                    • Care should be used when using forecasted numbers. Domestic and international geopolitical and economic events outside the scope of this
Notes: Calculated based on TRA visitor figures and projections and five year average of Self Drive as a percentage of All Tourism
                                                                                                                                                      report can impact both domestic and international visitor numbers, travel patterns and expenditure.
Based on calendar year (some variation against Financial year figures)

 30     Are we there yet?                                                                                                                                                                                                                                                                             Are we there yet?   31
The road ahead
The visitor economy is now at a cross-roads.                                             How do we attract the next generation of travellers       Ahead of the game                                        What the NRMA wants
                                                                                         to Australia? How do we remain competitive? How do
The sector has the potential to grow visitor nights                                      we encourage more Australians to experience their         Some states have already begun the task of               • Establish a Tourism 2030 Industry Potential Target
to 1 billion by 2029-30, contributing $150 billion in                                    island continent? These questions, and the investment     evaluating their performance and setting targets           with specific targets for both domestic and
overnight expenditure to the economy, $62 billion                                        required to make our targets a reality, need to be        beyond 2020. Visit Victoria has set the stretch target     international spend to guide the development and
of which could be generated in the regions.                                              decided by the sector.                                    of growing overnight expenditure (consumption) to          performance of the sector beyond 2020
                                                                                                                                                   $36.5 billion by 2025, generating 320,700 jobs in the
The industry must come together to determine the                                         Federal, state and local governments must come            sector.                                                  • Set regional growth targets in line with the Tourism
best possible strategy to realise this potential.                                        together with industry to discuss the industry’s next                                                                2030 Industry Potential to grow overnight visitation
                                                                                         set of stretch targets. This should start at a federal    By encouraging international and interstate visitors       and spend in the regions
Many of the challenges facing the sector                                                 level, with targets set by Austrade and Tourism           to stay one night longer, and converting 10 per cent
10-15 years ago still affect the sector today.                                           Australia, and be complimented by state and territory     of Victorian outbound trips to a holiday within the      • Re-establish visitor economy taskforces to guide
Encouraging visitors to travel to the regions,                                           targets for both international and domestic overnight     state, an additional $2 billion per annum could be         the development of tourism strategies in each state,
increasing the level of product investment and                                           expenditure.                                              generated to Victoria’s economy19.                         and monitor and evaluate the performance of the
refurbishment, and addressing transport connectivity                                                                                                                                                          sector against its targets.
and skills shortages are all issues the sector has                                       The targets should have a particular focus on growing     The mid-term review of the NSW Visitor Economy
struggled with for decades.                                                              overnight visitation and expenditure in the regions,      Industry Action Plan (VEIAP) is also a welcome
                                                                                         recognising the contribution tourism makes to these       initiative in determining whether the strategies put
These issues will not be fixed overnight, but the                                        communities.                                              in place have been effective in achieving the state’s
NRMA believes there is enough goodwill within                                                                                                      tourism 2020 growth targets.
the sector to make real change. We want Australia                                        Industry working groups have already been re-
to remain an aspirational destination, with regional                                     established to inform the next reiteration of Tourism
attractions featuring on every travellers bucket list,                                   2020 and state-based targets. These groups should
international and domestic.                                                              ensure the next set of targets:

The following section outlines five priority areas                                       • include overnight expenditure stretch targets for the
the NRMA will champion on behalf of it Members                                             regions, recognising the growth of the sector could
and regional communities including setting targets,                                        contribute $62 billion to the regions by 2029-30;
inspiring journeys, aiding discovery and creating
meaningful experiences. The NRMA believes these                                          • identify ways to grow the length of stay and
areas have the potential to make a real difference to                                      regional dispersal of both domestic and
the future growth of the visitor economy.                                                  international visitors;

                                                                                         • identify the investment in infrastructure and tourism
What gets measured                                                                         marketing required to achieve the industry’s

gets done                                                                                  potential; and

                                                                                         • seek a commitment to grow the number of home-
A plan for the future                                                                      grown regional events.

As we approach the Tourism 2020 target, the industry                                     The development of tourism action plans to achieve
needs to decide where it wants to head beyond 2020.                                      these targets should be overseen by an independent
                                                                                         Visitor Economy Taskforce chaired by an eminent
Having an industry stretch target allows the sector                                      industry leader. The taskforce(s) would monitor and
to monitor performance, decide the best strategy to                                      evaluate the performance of the sector against
achieve our potential, and have an honest conversation                                   the action plan – holding the industry and the
about whether or not we are reaching our goal.                                           government accountable.

19
     Victorian Government Department of Economic Development, Jobs, Transport and Resources (2016) Victorian Visitor Economy Strategy, p.8.

     32      Are we there yet?                                                                                                                                                                                                                                  Are we there yet?   33
You can also read