AGROFOOD - Flanders Investment & Trade
←
→
Page content transcription
If your browser does not render page correctly, please read the page content below

AGROFOOD

RESEARCH REPORT
           This project is funded
           by the European Union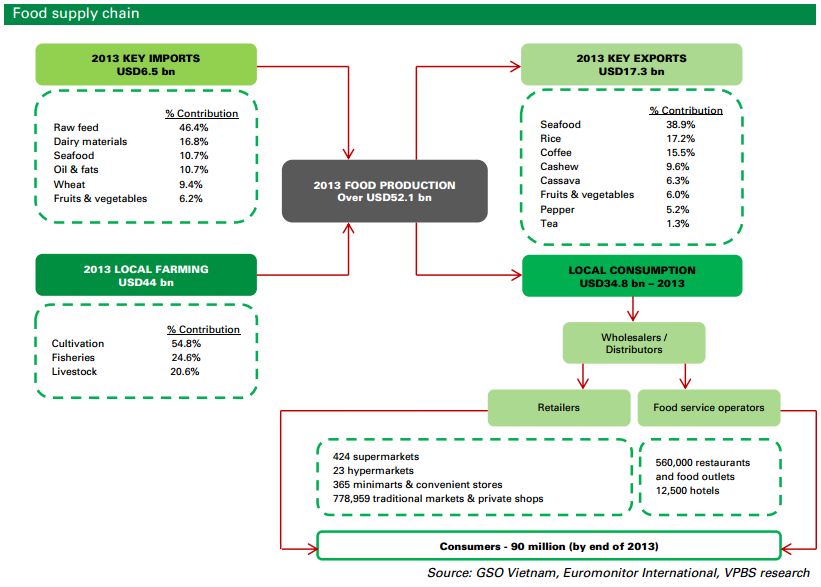
Useful contacts
   EU-Vietnam Business Network (EVBN)                                                          More information
   15th Floor, 5B Ton Duc Thang, District 1
   Ho Chi Minh City, Vietnam
   T : +84 (0) 8 38 23 95 15 (Ext:105)
    Useful contacts
   www.evbn.org

       Further reading:
   Vietnam Ministry of Planning and Investment:                                                                        www.mpi.gov.vn

   United Nations Population Fund Vietnam (UNFPA-VN):                                                                  www.vietnam.unfpa.org

   Ministry of Industry and Trade Viet Nam:                                                                            www.moit.gov.vn

   United Nations Conference on Trade and Development (UNCTAD):                                                        www.unctad.org

   International Trade Center (ITC):                                                                                   www.intracen.org

   Trade Map - Trade statistics for international business development:                                                www.trademap.org

   Saigon Times Weekly:                                                                                                www.thesaigontimes.vn

   Vietnam News:                                                                                                       www.vietnamnews.vn

   General Statistics Office of Vietnam:                                                                               www.gso.gov.vn

   Trading Economics:                                                                                                  www.tradingeconomics.com/vietnam/

   VGP News. Online Newspaper of the Government, Vietnam:                                                              www.news.chinhphu.vn

   Vietnam Briefing:                                                                                                   www.vietnam-briefing.com

   Vietnam Customs Statistics:                                                                                         www.customs.gov.vn

   Vietnam Trade Promotion Agency (Vietrade):                                                                          www.vietradeportal.vn

   VietnamPlus, Vietnam News Agency (VNA):                                                                             www.en.vietnamplus.vn

   World Bank Vietnam:                                                                                                 www.worldbank.org/en/country/vietnam

   Investment promotion Portal for South Vietnam                                                                       www.ipcs.vn/en/

   Ministry of Justice of Vietnam                                                                                      www.moj.gov.vn/

   National Institute for Food Control (NIFC)                                                                          http://nifc.gov.vn/

The Landmark, 15th floor, 5B Ton Duc Thang St., District 1, Ho Chi Minh City, Vietnam   This publication has been produced with the assistance of the European Union.

Tel. +84 (0)8 3823 9515     Fax +84 (0)8 3823 9514                                      The content of this publication are the sole responsibility of EVBN and can in no way be

www.evbn.org                                                                            taken to reflect the views of the European Union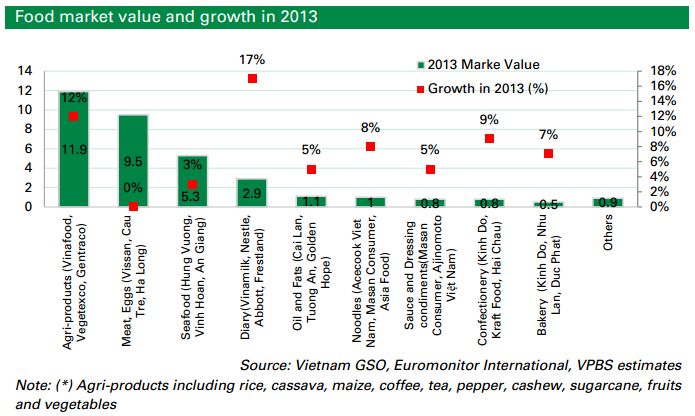
TABLE OF CONTENT
1.     IMPORTS MARKET / DOMESTIC CONSUMPTION            5

1.1. Bakery & Confectionery                             8

1.2. Beverage                                          14

1.3. Seafood                                           19

1.4. Dairy                                             21

1.5. Noodles                                           26

1.6. Ingredients                                       28

2.     EXPORTS MARKET/ DOMESTIC PRODUCTION             29

2.1. Seafood                                           30

2.2. Rice                                              32

2.3. Coffee                                            33

3.     KEY GROWTH DRIVERS                              34

4.     COMPETITOR ANALYSIS AND DISTRIBUTION CHANNELS   36

4.1. Competitor Analysis                               36

4.2. Key foreign players in the market                 41

4.3. Distribution Channels                             43

5.     CHALLENGES AND OPPORTUNITIES FOR EU SMES        47

6.     REGULATORY AND LEGAL FRAMEWORK                  49

       APPENDIX. FAIRS AND EXHIBITIONS                 52

3    EVBN SECTOR STUDY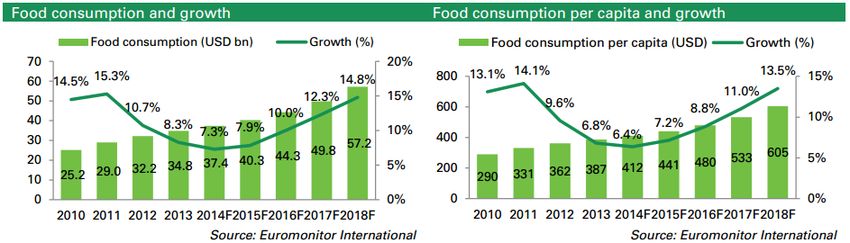
INTRODUCTION
Domestic consumption in Vietnam is growing slowly and Vietnamese consumers are still cautious
in spending as the economy has yet to recover from its trough in 2008 as a result of worldwide
economic downturn. However, the emergence of retail systems together with changing
consumption habits shows a promising market for the retail industry in general and Agrofood in
particular.

In 2013, Vietnam’s Agro-food market was worth over USD 60.1 billion, accounting for 40.5% of
the total consumption of the country. In the same year, Vietnam’s F&B consumption was USD42.8
billion, representing an increase of 8.2% against 2012 and a compound annual growth rate of
11% during the period of 2010-2013. Domestic consumption in the country reached 42.8 billion,
accounting for 71.2% of the total industry production value, and the remaining 29% contributes to
exports (seafood, rice, coffee, cashew nuts…).

                                                                                     Source: VPBS research
Imports of agro-food have been an additional source, besides the local production, to supply the
expanding domestic consumption. These imports, however, were always exceeded by exports
since 1997, resulting in Vietnam’s trade surplus, which has increased at a faster pace over the
years (Shown in the chart below). Details of imports and exports market will be in the following
sections.
                         Figure 6. Evolution of the agro-food trade in Vietnam

                                                                                 Source: UN Comtrade, 2010
 4   EVBN SECTOR STUDY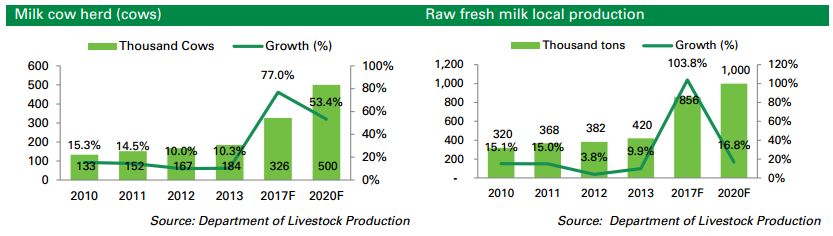
01           IMPORTS MARKET / DOMESTIC
             CONSUMPTION

Vietnam has a high domestic food consumption, with a double-digit growth. In 2013, food
consumption was USD34.8 billion, posting a remarkable CAGR of 11.4% over the period of 2010
to 2013. Despite recent slow growth in FMCG purchases, the combination effects of continuous
economic growth, golden demographic structure, rapid urbanization, emergence of middle income
earners and a mass grocery retail network, will fuel the growth of overall food consumption in the
medium- and long-term. Also, due to its nature as a defensive sector that is essential for living,
food is considered a key component of a balanced investment portfolio over investment horizon.
Vietnam food consumption is projected to retain its double-digit growth of 11.4% over the period of
2014 to 2018, according to Euromonitor International.

In 2013, agro-products, meats & eggs and seafood continued to be the three biggest categories
with USD26.7 billion or 76.8% value contribution to total local food consumption. Agri-products,
including rice, maize, coffee, tea, pepper, cashew, sugarcane, cassava, fruits and vegetables,
posted double-digit growth of 11.8% since 2012, the highest market value of all categories.

This $11.9 billion market couldn’t be fulfilled if without foreign imports. In 2008, Vietnam imported
$7.3 billion worth of agricultural food. Vietnam's primary agricultural import suppliers include
China, Australia, Thailand, New Zealand, ASEAN countries, Argentina, the European Union (EU)
and the US.

 5   EVBN SECTOR STUDY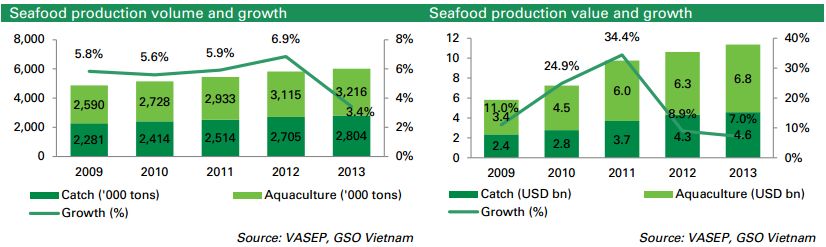
The key staples of the Vietnamese diet (fish and rice) are produced in abundance domestically
and have naturally limited agricultural imports in the past. However, the makeup of agricultural
imports is changing as more affluent urban consumers seek more variety and convenience
options. In turn, the processing sector is looking to imports to supply this rapidly expanding
industry.
Vietnam's top five agricultural imports in 2008 along with their corresponding supplier in brackets
were:
Residues and waste from the food industries (used as animal feed) $1,329 million (India)
Meat and edible meat offal $900 million (India and US)
Animal or vegetable fats and oils $647 million, (Malaysia and Indonesia)
Beverages, spirits and vinegar $507 million (Singapore and Hong Kong)
Cereals $443 million (Australia)
6 EVBN SECTOR STUDY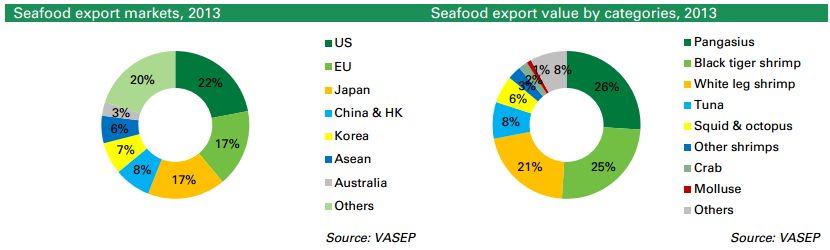
Major food categories imported the most by Vietnamese market were raw feed, dairy materials,
seafood, oil and fats, wheat, and fruits and vegetables, with respective market shares listed in the
below table. Among these, three categories (raw feed, wheat, fruits and vegetables) are agri-food.

                                 Key imports categories in 2013

 Key imports categories in 2013 (US 6.5 bn)

 Category                                                                          Contribution

 Raw feed                                                                                   46.4%

 Dairy materials                                                                            16.8%

 Seafood                                                                                    10.7%

 Oil and fats                                                                               10.7%

 Wheat                                                                                       9.4%

 Fruits and vegetables                                                                       6.2%
                                                                                 Source: GSO Viet Nam

Key findings on each import category will be elaborated in more details in the following sections.

 7   EVBN SECTOR STUDY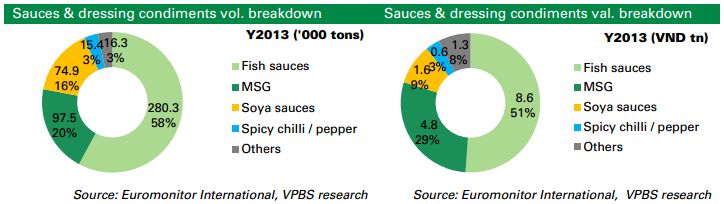
1.1           Bakery & Confectionery
According to the Center for Information Industry and Commerce - Ministry of Industry and Trade
(VITIC) showed that Vietnam imported 107.1 million confectionery and cereal products, down
42,28% compared to import value over the same period last year.

In particular, products from Indonesia and Thailand accounted for over 50% of the import value.
Specifically, items of confectionery and cereals imported from Indonesia accounted for 30.3%,
equivalent to 32.4 million, up 23% from the same period last year. Followed is Thailand with 22.8
million in import value, accounting for 21.37% and increasing by 26.99% compared to the
previous year.

Besides, Vietnam also imported large amounts of candies, $12.5 million, from Malaysia. At the
same time, Vietnam also imported candies from other markets such as the Philippines (10.7
million), China (5.7 million), and South Korea ($ 4.3 million). These numbers have slightly
increased compared to the same period last year.

Meanwhile, the value of imports from the United States, Singapore, and the Netherlands have
declined dramatically from 80% to 96%, reaching just over $ 5 million in all 3 markets.

Bakery. Market size and growth rates
Growth in the expansion of modern style bakery outlets

The bakery market enjoyed a CAGR of 7.6% over the period of 2010 to 2013, reaching VND10.4
trillion (USD0.5 billion) by the end of 2013. This was due in part to a new style of bakery outlet
expanding quickly across Vietnam since 2010 and becoming more and more popular as a place
for people to gather, similar to coffee shops. Kido’s Bakery, Onoré Bakery, Tous Le Jour, Paris
Baguette, Bread Talk and Brodard Bakery are some examples of this new style of bakery in
Vietnam.

8   EVBN SECTOR STUDY
Bread retained the biggest sales among other bakery products

As one of the popular alternatives to rice and noodles, bread retained its status as a primary
consumption bakery product compared to other sub-categories (such as cakes and pastries) with
VND8 trillion (USD378.7 million) sales in 2013, equivalent to 76.8% of total bakery market
revenue.

Unpackaged baked goods growing presence

Thanks to the rising number of bakery outlets, sales value of unpackaged or artisanal products
has grown gradually, reaching VND4.1 trillion (USD195.2 million) and accounting for 39.6% of
total bakery sales. In 2013, packaged baked goods sales wereVND6.3 trillion (USD297 million).
However, there is a low probability that unpackaged products will have a strong impact on the
revenue of packaged goods, as each category serves different benefits. While packaged baked
goods offers great convenience for busier lifestyles, consumers can enjoy more delicious taste of
unpackaged or artisanal products served in the modern bakery outlets.

 9   EVBN SECTOR STUDY
Bakery. Trends.

Sugar price climbing downward, wheat price bouncing back

Sugar and wheat flour significantly account for about 35 to 40% of material costs of confectionery
and bakery production. Thus, any change in world production could cause price volatility and
shortages which in turn negatively affect local production. In 2013, the favorable trend of world
sugar and wheat price strongly supported the gross margin of local players. 2013 was a third
consecutive year world sugar prices dropped due to production exceeding consumption demand.
The USDA forecasts sugar production will reach 175 million MT worldwide and the oversupply
situation will continue in 2014, a prospect for a fourth year of price descent. Relative to the
beginning of 2013, Sao Paolo refined sugar’s spot price decreased by 16.9% to USD640 per MT
as of May 20, 2014.

Vietnam was not an exception; its refined sugar wholesale price was down by 18.7% y-o-y to
VND13,000 per kg in the third week of May 2014. In contrast to sugar, wheat prices depended on
the weather conditions in main areas of world wheat production, such as North America and
Canada, Brazil, Australia and were affected by political turmoil in the Ukraine. Wheat prices were
USD334 per MT as of May 20, 2014, which was an increase of 15.2% compared to the beginning
of the year. In 2014, the confectionery business may not have a gross profit margin as high as in
2013, but we expect it will not be too low as long as sugar’s price downtrend persists.

 10   EVBN SECTOR STUDY
Confectionery. Market size & growth rate

Despite slower growth, Vietnam’s confectionery market still outpaced its regional peers

In 2013, Vietnam’s confectionery market grew at a slower pace, given its nature of being a
discretionary item in the context of slowing purchasing power. In 2013, the category sales were
VND16.6 trillion (USD0.79 billion), a rise of 9.4% from the 2012 sales. Despite this, Vietnam’s
confectionery market still remains attractive in the SEA region as it substantially outperforms the
average growth of 3% in the region and that of 1.5% in the world.

The category is appealing in the long run thanks to the increasing awareness of Western culture
and lifestyle among Vietnamese consumers and the much lower confectionery consumption per
capita of 1.8kg per annum relative to the global average of 2.8kg. Euromonitor International
expects the slow growth of the confectionery market to continue in 2014 and 2015, however, the
CAGR for the period of 2013 to 2017 is projected to hover between 10% and 11%.

 11   EVBN SECTOR STUDY
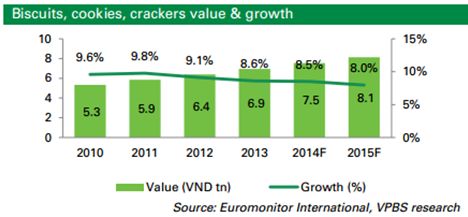
Biscuits, cookies, and crackers

Savory biscuits / crackers and plain biscuits as the most consumed thanks to less sugar and more
vitamin content

Accounting for 42% of the confectionery
market value, biscuits, cookies and
crackers     recorded     VND6.9    trillion
(USD0.33 billion) sales in 2013, posting a
CAGR of 9.2% during 2010 to 2013. Since
savory and plain biscuits and crackers
contained less sugar and more vitamins,
these two segments are considered
healthier products among other sub-
categories. They remained the most
consumed with reported sales of VND5.3
trillion (USD0.25 billion) or 76% of total
category value in 2013.

Savory snacks

Demand remaining strong despite increase in unit price

                                                         With a 33% share contributed to the
                                                         confectionery market value, savory snacks
                                                         reported VND5.5 trillion (USD0.26 billion)
                                                         sales in 2013, recording a higher CAGR of
                                                         9.5% during 2010 to 2013 than biscuits,
                                                         cookies and crackers. Despite increases
                                                         of unit price over the period, the sales
                                                         posted a higher and flat growth rate,
                                                         suggesting that the demand for savory
                                                         snacks will remain strong. Extruded
                                                         snacks and nuts accounted for 58% of the
                                                         sub-category sales, equivalent to VND3.3
                                                         trillion (USD156.2 million) in 2013.

 12   EVBN SECTOR STUDY
Sugar confectionery Sugar confectioneries facing intense competition from savory snacks Revenue growth of the sugar confectionery segment was 9.5% in 2013, which was much slower than the levels recorded in 2011. This was attributed to rising consumer awareness of health issues related to the level of sugar intake, such as high blood pressure, obesity and diabetes. Thus, it led sugar confectioneries to confront strong competition from savory snacks which are considered to have lower sugar content. Pastilles, gums, jellies and chews continue to be the most popular sugar confectionery category in Vietnam, accounting for 58% of the value or VND1.6 trillion (USD75.7 million). 13 EVBN SECTOR STUDY
1.2           Beverage

Market size & growth rates
In the beverage market, alcoholic drinks are the largest sector with 70% contribution to the total
market value. Revenue from this sector increased by 6.3% to USD 5.6 bil, the lowest growth rate
compared to other drinks. Beer accounts for the largest share of alcohol consumption: Sabeco
and Habeco are domestic companies that dominate Vietnam beer market.

Soft drinks saw the highest growth of 12.4% and reached $ 1.7bn sales in 2013, while hot drinks
were the smallest segment carries about 0.7 billion in sales. In the soft drinks market, Coca-Cola
and PepsiCo dominate the carbonated soft drinks market, whereas Tan Hiep Phat array occupies
none-gas soft drinks. Hot drinks are the smallest segment which brought only USD 0.7 billion in
revenue. Hot drinks market is currently under the control of Nestle and VinaCafe.

In 2013, retail sales of the beverage sector in Vietnam reached USD8 billion, a 7.6% rise
compared with the 2012 number. According to forecasts of the key players, in the period 2014 and
2015, beverage market value is expected to increase by 7.5%. So as consumers switch to
beverage products with higher value, expected profits in this sector would increase by 10.5% in
2016.

 14   EVBN SECTOR STUDY
Alcoholic drinks (Wine, spirits and beer)

As increasing Vietnamese’s exposure to drinking cultures around the world couples with their
popular perception of drinking to socialize, Vietnam alcoholic drinks consumption continues
growing year over year and has gained the biggest retail sales among other beverage categories.
Further, rising numbers of tourists and expatriates living in big cities also incentivize alcohol-
serving retailers to expand, which in turn stimulates local consumption as rising adoption of
western lifestyle becomes more prevalent.

In 2013, Vietnamese people drank a remarkable 3.15 billion liters of alcohol, equivalent to
VND119.5 trillion (USD5.6 billion), representing a double-digit CAGR of 10.1% and 10.6% during
2010 to 2013. Despite their slowing growth since 2012 due to reaching maturity, alcoholic drinks
remain one of the potentially lucrative markets in Vietnam. It is expected to reach USD6.3 billion
in 2015 by Euromonitor International.

 15   EVBN SECTOR STUDY
Beer

Alcoholic beverage consumption is largely driven by the beer category which accounted for 98%
of production volume and 91% of sales value in 2013. Spirits and wine accounted for only 2.3%
volume share (74 million liters) and 8.8% value share (VND10.4 trillion or USD492 million). In
2013, beer consumption recorded more than 3 billion liters, equivalent to VND109.1 trillion
(USD5.2 billion).

Vietnam ranked fourth for beer consumption per capita in Asia

While Vietnam was leading in the SEA region with 29 liters of beer consumption per capita in
2012, the country captured the 4th position for the entire Asia region, only after Japan (64 liters),
South Korea (45 liters) and China (37 liters). According to Vietnam Breweries Associations (VBA),
beer consumption per capita rose approximately 10% up to 32 liters in 2013. As such, Vietnam is
considered one of the beer loving countries and is among the most attractive destinations for
international breweries.

 16   EVBN SECTOR STUDY
The Vietnam beer market had a CAGR of over 10% in volume and value during the period from 2010 to2013. However, as the market becomes saturated, growth cannot be as fast as it was prior to 2011. Beer is forecasted to grow at a slower pace with an average 5.3% per annum and the sales will be USD5.7 billion by 2015. Lager dominating other types of beer Lager is the main type of beer in Vietnam since Vietnamese consumers are already familiar with the taste of lager and are reticent to try new tastes. Thus, other types of beer such as dark beer, stout and low-alcohols have only a limited presence in the market. Standard lager holds the biggest share of 67% of total lager, thanks to its price affordable for Vietnamese consumers who still lived with low disposal-income per capita. Also, there was a large gap of at least 43% higher in unit price range of each segment including premium, standard and economy. Wine and spirits In 2010, approximately 50 percent of imports of wine and spirits came from France, 14 percent from Australia, 6 percent from the USA, 5 percent from Chile, 4 percent from Italy, and 2 percent from Spain. Cabernet was the premier red variety of grape-based wine consumed, with 1.2 million liters consumed in 2009, a 33 percent increase from 2006. Chardonnay was the leading variety among the white wines, with consumption rising from 0.7 million liters in 2006 to 0.9 million liters in 2009—a 29 percent increase. Demand for wine is seasonal. The highest demand occurs around the year-end festive season; during the Tet festival (Lunar New Year) around February every year, Christmas holiday, and New Year celebration. Some retailers state that between 60 and 70 percent of the wine sales occur during this period. Demand was generally low during other periods of the year. 17 EVBN SECTOR STUDY
Imported wine is perceived as a luxury product in Vietnam (accounted for 73%), and demand for it
largely comes from expatriates and tourists. Only a small number of Vietnamese from the middle
to high income groups drink imported wines. This is because these groups of consumers
generally prefer spirits such as vodka, cognac, brandy and whiskey to wine. However,
Vietnamese that have acquired a taste for wine generally prefer old world wines, particularly red
wines. The most popular wine in Vietnam is Bordeaux, which is synonymous with wine.
Vietnamese consumers who have acquired a taste for wines consume imported wine while they
are out socializing/entertaining or dining during the week. In line with growth in incomes, rising
affluence in urban centers, the larger expatriate business community and emerging tourist cities,
demand for wine is expected to increase over the next five years. This trend reflects the prestige
associated with drinking wine compared with beer and spirits, in addition to the perception that
wine is healthier.

The presence of more and more highly-regarded brands of wine from Old World countries like
France and Italy as well as from New World ones, like Chile, Australia, United States of America,
South Africa, Argentina and New Zealand has demonstrated how much wine producers are
interested in this promising market.

 18   EVBN SECTOR STUDY
1.3           Seafood

Market size & growth rates

Vietnam possesses an interlacing system of rivers and a 3,260 km long coastline. It is ranked
third in 2013 among the largest countries for fishery and aquaculture activities, preceded only by
China and India. Fishery volume (mainly from tuna) has recently grown every year thanks to
favorable weather conditions and a new fishing technique of using high pressure lamps, which
helps double productivity and saves 15 to 30% of the fishing time. The decline in growth of
production value during 2012 and 2013 was due to approximately 100,000 hectares of shrimp
farms, which account for 15% of the country’s total shrimp farms, suffering from the Early
Mortality Syndrome (EMS). The disease, however, has been controlled since Q4 2013 and is no
longer a threat. In 2013, seafood production rose 3.4% to reach 6 million tons in volume and grew
7% to reach USD11.4 billion in value.

 19   EVBN SECTOR STUDY
Domestic seafood consumption reaching USD5.3 billion in 2013

The domestic market made a minor contribution of less than 5% share to the revenue of local
seafood producers. This was attributable to lower selling prices relative to export prices, while
cost of production, logistics and promotion advertising were still high. Further, Vietnamese
consumers are acquainted with purchasing fresh seafood from traditional wet markets while the
local producers concentrate on frozen, processed seafood. In 2013, domestic consumption of
seafood reached USD5.3 billion, accounting for 43.9% of total local production and import value,
which was USD12.1 billion. According to the Center of Planning and Development of Aquatic
Products, domestic consumption will increase annually at an average rate of 5.4% from 2011 to
2020.

 20   EVBN SECTOR STUDY
1.4           Dairy

Market size & growth rates
According to Nielsen’s research, per capita milk consumption in Vietnam was just 15 liters per
annum, far behind Thailand (34 liters / year), China (25 liters / year) and the UK (112 liters / year)
in 2012, an indication of colossal market growth opportunity for dairy products. The Vietnam
Department of Livestock Production estimates Vietnamese people will consume 28 liters of milk
per year by 2020. Moreover, the customer base for dairy products has broadened thanks to the
manufacturers’ continued efforts to target different demographic segments, such as female
professionals and seniors. Thanks to low per capita milk consumption, rising health
consciousness, new habits of drinking milk, and a growing customer base, we believe this
category possesses the strongest momentum to enter a growth phase.

The dairy sector, valued at VND62.2 trillion (USD2.9 billion) in 2013, is among the fastest-growing
in Vietnam’s non-discretionary consumer sector, with an increase of 16.5% in 2013 and a CAGR
of 14% over the period from 2010 to 2013. Vietnam dairy revenue comes mainly from two
segments: powdered milk and drinking milk. These two segments’ revenue accounts for 74% of
the total market value which is USD 2.2 billion (VND 45,900 billion). According to Euromonitor
International, Vietnam’s dairy market value will have increases of 20% and 23% for the year 2014
and 2015. Yogurt is reckoned to be the segment that will bring high profit thanks to the
underdeveloped market either in demand or supply.

 21   EVBN SECTOR STUDY
Local raw fresh milk supply only meets less than one-third of production demand

The sector faces a supply and demand imbalance in raw fresh milk as domestic herds (184,216
cows) were able to provide only 420,000 tons of raw milk, meeting only 28% of total domestic
demand in 2013. Vietnam is ranked in the top 20 countries worldwide importing input materials for
dairy production. In 2013, the country imported around 1.2 million tons of raw milk powder valued
at USD841 million. Thus, heavy dependence on imported materials brings the attendant risk of
profit margins being squeezed out due to global price fluctuations. However, this risk is mitigated
by strong consumer loyalty for prominent brands and because milk products are exposed to low
price elasticity of demand relative to other categories. The Department of Livestock Production
estimates local milk production will surge to 856,000 tons in 2017 (326,000 cows herd) and
1,000,000 tons (500,000 cows herd) by 2020, yet the supply will only meet 30% of local demand.

 22   EVBN SECTOR STUDY
Powdered milk and drinking milk

A robust consumption in powdered milk and drinking milk over the period of 2010 to 2013 is worth
to be mentioned. Powdered milk, which made up 45% of Vietnam’s dairy market, posted a CAGR
of 10.1% and VND27.9 trillion (USD1.32 billion) worth in 2013. Drinking milk accounts for 29% of
the dairy market’s value, or VND18 trillion (USD851.6 million), in 2013. The sub-category
recorded a remarkable CAGR of 18.9% during the same period. As the majority of input materials
for powdered milk and drinking milk are sourced from overseas, local producers will benefit from
the capability to pass on incremental costs to end users when import prices rise.

  Yogurt
  Yogurt registering the fastest growth among other dairy categories

  Yogurt is traditionally perceived by
  Vietnamese consumers to be a healthy
  food that provides digestion benefits
  after meals. Hence, yogurt registered
  the fastest value growth rate of 34.3% to
  VND7.7 trillion (USD364.7 million) in
  2013, producing an impressive CAGR of
  32.7% during 2010-2013. In this market,
  consumers have strong preference for
  branded yogurt to unbranded ones
  because of growing attention to food
  safety and hygiene.

 23   EVBN SECTOR STUDY
Condensed milk

Remaining a key dairy of low-income earners

In spite of low nutritional content,
condensed milk held 8.3% value share
within the dairy market thanks to its long
prevalence        among         Vietnamese
consumers,      especially      low-income
earners. However, as the performance
of drinking milk and powdered milk
posted robust growth, demand for
condensed milk is confronting the
maturity stage. The category’s growth
slowed to 2.5-3% y-o-y in value during
2010-2013 as consumers’ disposable
income has increased and they began a
shift to more nutrient rich dairy products.

Ice-cream
Steady growth in demand

                                              Thanks to the escalating number of
                                              youth who perceive ice cream to be a
                                              tasty dessert or snack and the
                                              growing number of modern style
                                              coffee shops that serve a variety of ice
                                              cream flavors and sizes, demand for
                                              ice cream has grown steadily to
                                              VND3.2 trillion (USD152.8 million) and
                                              reported a CAGR of 12.8% over the
                                              2010-2013 period.

 24   EVBN SECTOR STUDY
Dairy. Main Trends Downtrend in world price of raw milk powder benefiting local producers Milk production in Vietnam comes from two sources: from local cow farms and imports. Imported dairy ingredients include milk powder and raw milk products. Raw milk products are imported not only to produce milk but also to produce confectionery, functional foods, and nutritional foods, etc. Vietnam imports raw milk products mainly from New Zealand, America, Australia and Europe. Costs of raw milk account for approximately 65 to 70% of total input costs. Thus, any change in world production could cause price volatility and shortages that would negatively affect local production. After a hike in Q2 2013, the prices of skim milk powder (1.25% butterfat) and whole milk powder (26% butterfat) have decreased significantly to this date. The skim milk powder spot price was down 19.6% y-o-y from USD 5,225 per metric ton (MT) to USD4,200 per MT as of the end of May 20, 2014. Also, the whole milk powder spot price dropped 22.5% y-o-y from USD5,600 per MT to USD4,337.5 per MT as of May 20, 2014. USDA expects the downward trend to be on-going through the end of 2014 due to an increase in world production as a result of herd expansion and higher yield outputs per cow. Therefore, we believe the favorable trend in world prices of raw milk powder will positively benefit the gross margin of local producers in 2014. 25 EVBN SECTOR STUDY
1.5           Noodles

Despite slow growth, noodles hit USD1 billion sales in 2013

According to the Word Instant Noodle Association (WINA) Vietnam ranks number four in instant
noodles consumption with a demand of 5 billion units each year (56.2 instant noodles
units/person/year) behind China, Indonesia and India. Currently Vietnam has about 600 noodles
brands which are distributed in a system of supermarkets such as Co.opmart, Maximark, and
Lotte Mart. Domestic production accounts for 95% of market share. In 2013, noodles recorded a
slower increase in both volume and value, but the sales value surpassed USD1 billion (VND21.7
trillion), with a volume of 432 thousand tons. The growth for noodles was attributable to its
convenience as an alternative to rice, variety of flavors, diverse packaging size, prices as well as
marketing communication efforts of market players.

New launch of Kokomi of Masan Food, a brand targeting the low-income segment, was one of the
most successful combinations of running effective commercial advertising, boosting store displays
and competitive pricing. Both international and local producers retained their positive perception
of the noodle market’s potentiality.

 26   EVBN SECTOR STUDY
Instant noodles occupy almost all of the total noodle consumption, of which pouch instant noodles
was the major packaging with 92% contribution to the sales value. However, high convenience in
daily usage led cups or bowls of instant noodles to stay popular among Vietnamese consumers,
especially youngsters, workers and busy officers. This type of packaging reported a volume
growth of 8.4% in 2013.

According to our analysis, Vietnam consumes a great amount of noodles partly due to the desire
to save money in unstable economic situations and also because noodles meet the local people’s
taste: spicy and sour. However, we reckon that the noodle market will see a slowdown in growth
because of trends towards healthier nutrition while instant noodles are not considered to be
healthy food.

 27   EVBN SECTOR STUDY
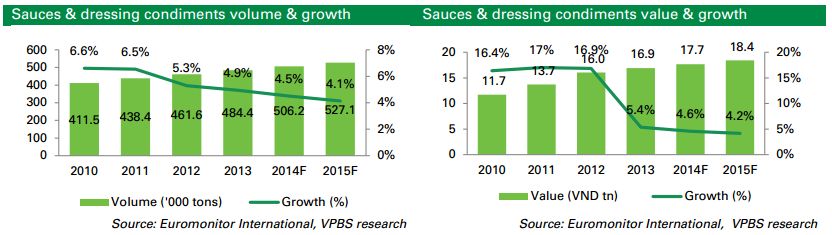
1.6           Ingredients

Most condiments have reached maturity

Fish sauce, Mono Sodium Glutamate (MSG) and soya sauce remain very popular and
irreplaceable condiments in the daily meals of Vietnamese people. Together, these accounted for
nearly 89% of the category sales valued at VND16.9 trillion (USD800.6 million). However, the
value growth rate of sauces and dressing condiments in Vietnam has dramatically dropped from
16.9% (2012) to 5.4% (2013). These categories have reached maturity as consumers are fully
aware of and have already used them for a long time. While fish sauces, MSG and soya sauces
are mature nationwide, bouillon cubes and powder, as modern alternatives, are poised to become
mature in urban areas.

Accelerating use of bouillon cubes as an alternative to MSG in rural areas

There was rising consumer usage of bouillon cubes for cooking as an alternative to MSG in rural
areas. By successfully delivering the ‘natural taste’ message, bouillon cube producers have led
rural people to enjoy meals with the natural sweetness of stock meat instead of consuming pure
MSG. The ‘Maggie 3 Ngot’ bouillon cube (Maggie 3 sweets) of Masan Food has gained significant
market presence.

 28   EVBN SECTOR STUDY
02              EXPORTS MARKET/ DOMESTIC PRODUCTION

Vietnam's agricultural success mirrors the overall economic success of the country. Only 15 years
ago Vietnam was a net importer of food, while today the country has become the world's second
most important exporter of rice, and the world's largest coffee exporter and producer of cashew
nuts. Tea exports continue to rise while pepper, nuts and spices are all major international exports.
Despite impressive developments, the value of Vietnam's agricultural exports continues to be very
susceptible to international price fluctuations due to the fact that exports are largely commodity
based. Rice and coffee account for about half of agricultural export revenues.

Major food categories exported by Vietnamese producers were seafood, rice, coffee, cashew,
cassava, fruits and vegetables, pepper, and tea, with respective market shares listed in the below
table. Seven out of these eight categories are agri-food.

                                  Key exports categories in 2013

 Key exports categories in 2013 (US 6.5 bln)

 Category                                                                     Contribution

 Seafood                                                                          38.9%

 Rice                                                                             17.3%

 Coffee                                                                           15.5%

 Cashew                                                                           9.6%

 Cassava                                                                          6.3%

 Fruits and vegetables                                                            6.0%

 Pepper                                                                           5.2%

 Tea                                                                              1.3%

                                                                                 Source: GSO Viet Nam

Key findings on some export category will be elaborated in more details in the following sections.

29   EVBN SECTOR STUDY
2.1 Seafood Export Volume According to General Department of Vietnam Customs, in 2013, export of aquatic products recorded USD6.7 billion, rising by 9.8% from the 2012 benchmark. The US, EU, Japan, China, Hong Kong and Korea were primary export markets of the sector, together occupying 71% of the export values. However, exports to the US and China were at the fastest growth pace of more than 25% last year. In terms of aqua-product categories, the country exported USD3.11 billion of shrimp, which accounted for 46% of total export value, followed by USD1.76 billion of pangasius (26%) and USD526.7 million of tuna (8%). 30 EVBN SECTOR STUDY
Trends

High anti-dumping tax resulting in a slowdown in the country’s export of pangasius in the
foreseeable future

According to VASEP, the US Department of Commerce has recently announced the final results
of the ninth anti-dumping duty administration review between August 1, 2011 and July 31, 2012
towards frozen, processed pangasius imported from Vietnam. Therein, Vinh Hoan was entitled to
the most favorable rate of USD0 per kg instead of USD0.03 per kg previously. Hung Vuong
retained the last levy of USD1.2 per kg. The tax rate significantly increased from USD0.42 per kg
since the end of March 2014 to USD1.2 per kg at the present. The general rate of USD2.11 per kg
is applied for other Vietnam exporters. The representative of VASEP asserted that this was an
unreasonable, inconsistent and protective judgment that caused disadvantage to Vietnam’s
pangasius. We project that the country’s export of pangasius will slowdown in the foreseeable
future.

Export price of pangasius declined while that of shrimp hiked

The export price of pangasius in 2013 was USD2.2 per kg, a decrease of 9.1% due to a fierce
competition among 230 local exporters while it was expected to increase by 1.8% to USD1.7 per
kg because of reduction in output volume in the year. The export price of shrimp rose 20% in
2013, which was attributed to the outbreak of EMS worldwide. EMS spreaded through the major
shrimp producing countries of China, India, Vietnam and Thailand, causing global shrimp output
to drop precipitously 23% in the year. However, as mentioned earlier, the disease has been
brought under control and a gradual reduction in price is expected as production recovers.

 31   EVBN SECTOR STUDY
2.2           Rice

Vietnam is one of the most important rice producers and exporters in the world. Rice is cultivated
on 82% of the arable land of Vietnam and provides 80% of carbohydrate and 40% of the protein
intake of an average Vietnamese. The two rich deltas of the north and south - The Mekong River
delta and Red River delta - accounts for 52% and 18% of Vietnam’s rice productions, respectively.

                          Vietnam’s export of rice, 2009 – 2012 (million USD)

                           4,000                               3,657           3,673
                           3,500                 3,248

                           3,000      2,664
                           2,500

                           2,000                                                                Export revenue

                           1,500

                           1,000

                            500

                               0
                                       2009       2010          2011           2012
                                                                          Source: General Department of Vietnam Customs

Vietnam Food Association (VFA) data shows that rice exports from Vietnam in 2012 reached a
record high of 7.7 million tons, thereby maintaining its place as the world’s second largest rice
exporter, following only India
                                   2011                2012                   Jan-Jun/2013             Compared
                           Value        %         Value          %            Value        %              with
No.        Markets
                          (million   (of total   (million     (of total      (million   (of total     Jan-Jun 2012
                           USD)       export)     USD)        export)         USD)      export)            (%)
           TOTAL           3,657      100        3,673         100            1,582     100.00            -9.90
1          China            161        4          898           24             536        34                17
2     The Philippines       476        13         475           13             132         8               -42
3         Malaysia          292        8          403           11             103         7               -41
4       Ivory Coast         139        4          203            6              89         6                -2
5        Singapore          198        5          131            4              77         5                37
6          Ghana             77        2          150            4              77         5                12
7       Hong Kong            89        2          121            3              58         4                23
8        Indonesia         1,019       28         458           12              45         3               -71
9          Angola            28        1           55            1              38         2                31
10         Algeria           20        1           36            1              24         1                -6
           Others           992        27         714           19             403        25                -3
                                                                          Source: General Department of Vietnam Customs.
 32   EVBN SECTOR STUDY
2.3 Coffee
Over the past decade, coffee has been Vietnam’s largest hard-currency earner after rice and
seafood. The International Coffee Organization documents that Vietnam has become the world’s
largest coffee exporter, surpassing Brazil. As one of the world’s top coffee exporters, Vietnam
now has more than 525,000 hectares under coffee trees, 90% of which are in the Central
Highlands.
Vietnam’s coffee export revenue in 2005
Vietnam has released a
First 6 months of 2013 (billion US$)
master plan for coffee
production up to the year 4.0 3.7
2020 and a vision up to 3.5
2030, under which the total 3.0 2.8
area for coffee growing will 2.5
1.9 2.0 1.9
be maintained at 500,000 2.0 1.7 1.7
hectares by 2020, with an 1.5 1.2
output of 2.4 tons a hectare, 1.0 0.7
and 479,000 hectares with 0.5
an output of 2.5 tons a 0.0
2005 2006 2007 2008 2009 2010 2011 2012 Jan-Jun
hectare by 2030. 2013
Source: General Department of Vietnam Customs
According to the Vietnam’s General Department of Customs, the country exported 140,9 tons of
coffee in June, 2013, earning US$304 million, and pushing the 6-month coffee export to 1.1
million tons, worth US$2.2 billion. During this period, “made-in-Vietnam” coffee was exported to
30 countries. Germany and the United States are currently the two biggest importers of
Vietnamese coffee with market shares of 13.1 percent and 11.4 percent, respectively.
Vietnam’s coffee products export structure by market in first 6 months of 2013
The Phillipines
The U.K China 2.68%
Russia
3.00% 2.73% 2.64%
Belgium
3.48%
Japan Germany
5.48% 13.09%
Italy
6.10%
Spain The US
7.34% 11.40%
Source: General Department of Vietnam Customs
33 EVBN SECTOR STUDY03 KEY GROWTH DRIVERS Recently released macroeconomic data indicates a steady growth of GDP, a curbed inflation, a strong inflow of overseas remittances and FDI, as well as prospects for Vietnam dong to stay stable. Along with the economic recovery, the country’s golden demographic structure, rapid urbanization, rising disposable income, as well as growing retail network, present the impetus for rising domestic consumption power and continued economic growth. In 2012, Nielsen ranked Vietnam as the most rapidly growing fast-moving consumer goods consumption country in Asia with a rate of 24.3%, followed by India (18.3%) and China (14.6%). Despite the lull in consumption during 2013-2014, it is believed that agro-food sector will continue to deliver double-digit annual growth during the period of 2014-2018. Given the growing appetite for emerging market-based assets of global investors such as Kohlberg Kravis Roberts (KKR) and Texas Pacific Group (TPG) and the consolidation tendency among local players, it is predicted that a bloom of M&A activities in the agro-food sector will be on-going in the medium to long-term perspective. Trade. With Vietnam’s export partly affected by WTO membership’s barriers and trade restriction, Vietnam tend to import more goods from abroad. Various diets with a wider range of products are in the increasing trend among Vietnamese consumers. Urbanization. Currently, the wealthy metropolitan centers like Ha Noi, Ho Chi Minh City and Da Nang City shape a big base of receptive and open minded consumers of Vietnam. However, along with the urbanization of the country, rural regions remain significantly potential market especially for agro-food products. Rising population. Approximately half of Vietnam’s population consists of consumers under the age of 30. This group is experiencing a substantial rise in living standards accompanied by an increase in disposable income, rising demand for foreign goods, and a willingness to experiment with new products. For example, while wine has not been a traditional aspect of the Vietnamese culture, this market segment (ages 20-35), which accounts for around 25 million people, will likely form the core consumer group for wine. 34 EVBN SECTOR STUDY
Distribution channels. Vietnam possesses a dense retail network, widely spread throughout the
country, including 424 supermarkets, 23 hypermarkets, 365 mini-marts and almost 779,000 of
traditional markets and small private shops. While supermarkets and hypermarkets account for
the majority, the convenience store model is still in its infancy. The continuous growth and
expansion of mass retail outlets strongly encourages consumer purchasing and increases
consumption value.

Westernization. According to BMI, Vietnam consumers are brand aware, specifically, the young
and affluent. In addition, a report from New Zealand Trade & Enterprise claimed that there is a
huge number of Vietnamese who have migrated overseas to such countries such as Australia,
Canada and US and which are now influencing the lifestyle of the local Vietnamese. Hence, these
factors have resulted in demand of well-known westernized food and beverage products.

Health consciousness. Recent health problems related to food poisoning, the avian flu crisis
along with intensification of health education led Vietnamese to be more aware of using healthy
products. As a consequence, the growth of demand for healthy products, advanced packaging
and some modern retail channels is expected in the near future.

Dairy category expects rapid growth. Amongst F&B categories, the dairy possesses the
strongest momentum to enter into a growth phase while other categories including seafood,
noodles, sauces and dressing condiments, confectionery and bakery, alcoholic drinks, soft drinks
and hot drinks are reaching maturity with a slower growth pace.

 35   EVBN SECTOR STUDY
04            COMPETITOR ANALYSIS AND
              DISTRIBUTION CHANNELS

4.1           Competitor Analysis
The Agrofood sector in Vietnam is highly fragmented, while only a few large firms are presented.
It is primarily driven by non-organizational retailers, including traditional retailers and independent
grocers.

There are few players dominating Vietnam’s Agrofood market, including large domestic
enterprises such as: Vinamilk (dairy), Kinh Do (bakery), Masan Consumer (diversified products),
Minh Phu (seafood), Vinafood, Halico (beverage), Bibica (confectionery), and Sabeco (beer).
Foreign companies are presented by: Nestle (coffee), Nabati Indonesia (confectionery), Diageo
(alcohol beverages), Heineken, Carlsberg, SABMiller (alcoholic drinks), Kirin Beverage (soft
drinks), and a few others. In addition, large multinational companies are setting up independent
units and joint ventures to invest in such categories as coffee, candies, spirits, soft drinks, and
retail distribution system.

Example of a key player - Masan Group Corporation (MSN)
Masan Group is one of Vietnam’s largest private sector companies focused on building market-
leading businesses that capitalize on Vietnam’s structural consumption and banking.
Commenced operation in 2000, Masan Consumer, a part of Masan Group, is one of Vietnam's
largest local diversified FMCG companies with 30% of market share. The Company manufactures
and distributes a range of Agrofood products, including soya sauce (Chinsu), fish sauce (Nam
Ngu), chili sauce (Tam Thai Tu), instant coffee (Vinacafe), instant cereals (Kachi) and bottled
beverages (Vinh Hao). Receiving some significant investments from Kohlberg Kravis Roberts
(KKR) and Texas Pacific Group (TPG), Masan Consumer achieved a revenue of VND 11,943
billion (USD565.3 million) in 2013.

 36   EVBN SECTOR STUDY
Alcoholic drinks With a minimal presence in Vietnam’s beer market, foreign players mainly focused on the premium segment, with brands introduced including San Miguel, Corona, Carlsberg, Budweiser and Asahi. Vietnam anticipates foreign players to continue fueling the local beer market dynamics as they continue to exhibit interest in the market potentiality and actively seek entry opportunities. Sabeco continues to lead the beer market with 47.5% value share in 2013. Its prominent brands such as Saigon Export, 333’ export and Saigon Lager accounted for 46.8% market shares by brands. Vietnam Brewery and Habeco hold the second and third positions with market shares of 18.2% and 17.3% respectively. While Hanoi beer brand of Habeco took 15.8% of brands share, Heineken and Tiger of Vietnam Brewery occupied 11.5% of the pie. The top three players Sabeco, Vietnam Brewery and Habeco, together, hold 83% of value sales of beer in 2013. Example of a key player - Saigon Beer Alcohol Beverage JSC (Sabeco) Year of establishment: 1977 Sabeco continues to lead the beer market with 47.5% value share as of the year 2013. Its prominent brands such as Saigon Export, 333’ Export and Saigon Lager accounted for 46.8% market shares by brands. In 2013, Sabeco’s net avenue reached VND 24,006 billion (US$ 1.127 billion) and net profit accounted of VND 2,495 billion (US$ 117 million). Example of a key player - Lam Dong Foodstuffs Joint-Stock Company (Ladofoods) Lam Dong Foodstuffs Joint-Stock Company (LADOFOODS) is one of the largest producers (distributors) of wine in Vietnam. It steps produces Dalat wine, Dalat red wine, strong alcohol, juice and exported grain of nut. In 2013, Ladofoods reported net revenue of VND 284 billion (USD 13.3 million), and net profit of VND 23 billion (USD 1.1 million. In the alcoholic drinks category, Ladofoods concentrates mostly on wine. The company has a presence in both grape wine and local non-grape wine sectors, although its share of non-grape wine is very small. The wine processing technology employed by Ladofoods comes from Italy and Germany, thus its wine products meet international standards. All products from Ladofoods, including wine and non-alcoholic products such as soft drinks and spreads, are manufactured at its factory located in Dalat city. 37 EVBN SECTOR STUDY
Dairy
Vinamilk is currently the largest fresh milk collector, purchasing more than 60% of fresh milk from
farmers across the country, while the second largest fresh milk collector is Friesland Campina
Vietnam (Dutch Lady Brand milk). The company has purchased nearly 82,000 tons of fresh milk
from local farms in 2013, accounting for about 20% of total domestic fresh milk production. These
two companies dominate the local market with 46% and 20% of market share respectively.

With the advantages of worldwide large-scale farming of cow herds, big production capacity and
modern technologies, foreign players firmly control the local powdered milk market with 53.1% of
market share in 2013. Conversely, local players dominate the drinking milk market which is led by
Vinamilk with 45.5% of market share in 2013.

In 2013, Vinamilk continued to lead the yogurt market with 73% value share, as well as to
dominate the condensed milk market (approximately 80% of the total sale value).

Example of a key player - Vietnam Dairy Products Joint Stock Company (VNM)
Established in 1976, the Company currently operates five model cow farms with over 8,000 heads
of cattle which were imported from Australia, and provided 90 tons of milk per day. VNM also has
an extensive distribution network with over 224,000 points of sale throughout the country and
accounts for 46% of dairy market share in 2013.
Vinamilk was honored by Forbes Asia for its “Top 200 Best under a Billion” in Asia 2012. This was
the first and uniquely Vietnamese company to be honored in the Forbes Asia list. In 2013, VNM
reached net consolidated revenue of VND 30,949 billion (USD1.46 billion), a 16.5% increase, and
net consolidated profit of VND 6,534 billion (USD309.3 million), and a growth of 12.3%.

 38   EVBN SECTOR STUDY
Confectionery
Kinh Do maintains the leading position in the sub-category with 30% market share in 2013. Kinh
Do plain biscuit is the most popular brand in Vietnam through its tasty flavor and reasonable price.

Perfetti Van Melle is still leading the sugar confectionery segment in Vietnam through its Mentos,
Alpenliebe and Golia brands, accounting for 20.1% of market share in 2012. Bibica and Hai Ha
closely follow the leader, taking second and third places with market shares of 19% and 18.2%,
respectively. While local companies target low and middle-income segments, international peers
confine focusing mostly on the high-end segment.

Example of a key player - Kinh Do Corporation (KDC)
Established in 1993, Kinh Do Corporation is now a leading confectionery company in Vietnam
with about 200 SKUs: biscuits (Cosy) cookies (Korento), crackers (AFC), cakes (Solite), moon
cakes, bread (Aloha), bun (Scotti), etc. It also produces ice cream (Celano, Melano) and yogurt
(Well Yo). As the leading player in the confectionery field, the company has gained significant
market share (2013) in cookies (30%), crackers (56%), and especially in the seasonal moon cake
(76%) segment. Strong brand equity helps the company to maintain its market leadership in sales
and facilitates stronger market penetration for any new product launches.

 39   EVBN SECTOR STUDY
Bakery
The bakery market is highly fragmented, in which Kinh Do notably retained its first place with
13.4% market shares in 2013 while other typical competitors such as NhuLan, Duc Phat, Orion
Food Vina and Bibica presented an average of 5.1% market share each.

 40   EVBN SECTOR STUDY
4.2            Key Foreign Players in the Market

The companies described below represent an example of western F&B chains, successfully
taking over Vietnamese market despite strong competition from local enterprises as well as
necessity to change local consumption habits and tastes.

McDonald’s

A recently entered Vietnamese market, McDonald’s is looking forward expanding its operations in
Vietnam. It has announced plans to open a total of 4-5 restaurants in Ho Chi Minh City this year,
as a part of an ambitious goal for opening around 100 restaurants in Vietnam in the next decade.

McDonald’s is currently forced to import much of its ingredients due to the lack of quality and
consistency of Vietnamese products. In particular, McDonald’s only uses two ingredients that are
grown locally in Vietnam: lettuce and tomatoes from Da Lat. All of the restaurant’s beef is
imported from Australia, while pork and potatoes are from the U.S., paper boxes and cups are
imported from China and Malaysia.

The long-term plan for McDonald’s in Vietnam is to use mainly Vietnamese resources. The
company is already working with local providers, who are to be trained in managing product
quality according to McDonald’s global standards.

Starbucks

Despite the fact that Vietnamese coffee market is highly competitive, there are opportunities for
foreign companies to enter the market and succeed, what is proved by Starbucks performance in
Vietnam. There are a several segments of coffee drinkers in Vietnam and Starbucks targets
mostly business people, well-to-do families and young consumers who prefer an “international
atmosphere” in a café.

The US’ famous café chain has certainly made a good impression on Vietnamese. All shops in
HCMC are located at the most advantageous positions, called the “golden land”. Starbucks
decorated the downtown store with local art and artifacts to create a distinctly Vietnamese flavor.
It also came up with a drink, the Asian Dolce Latte, to appeal to local palates.

41   EVBN SECTOR STUDY
Nevertheless, some experts note, that Vietnamese consumers flocked to Starbucks just to taste
the coffee, but after that, they have returned to their familiar habits, such as drinking of traditional
Vietnamese coffee, which is much stronger and usually accompanied with a sweet condensed
milk..

Thus the main threats, faced by Starbucks in Vietnam are: intense competition coming from
strong domestic players and international companies providing the same type of coffee; inability to
significantly change traditional coffee consumption habits; barriers of complex legal system and its
“dark side”.

Caffé Bene

Caffé Bene is a famous Korean company with a system of shops providing beverages such as
coffee, fast food, milk and milk products, ice-cream and ice-cream products. Being aware that
Vietnam is a potential market, in 2012 Caffé Bene decided to open shops in Hanoi and Ho Chi
Minh City through franchising.

Unlike most coffee chains that seek fast customer turnover, Caffé Bene strives to create a
comfortable environment for visitors who not only drink coffee but also spend time reading books,
listening to music and chatting with friends. Caffe Bene’s aggressive marketing, backed by a
strategic partnership with Sidus iHQ, a major entertainment agency under SK Group, has also
helped the brand gain recognition in a short time span.

One of the main threats for such companies as Caffé Bene in addition to the mentioned before is
a significant number of cafes from the similar segment, which are located in advantageous
positions and “selling” the ambience rather than the coffee.

42   EVBN SECTOR STUDY
4.3 Distribution Channels Domestically, food is consumed mainly through commercial and traditional trade channels. According to 2013 data, traditional channels include around 780,000 of traditional markets and small private shops around the country which are suitable for small quantity and high-frequency food purchases. Traditional channels account for about 75% of food retail value, while the remaining 25% belongs to commercial channels including 447 supermarkets, hypermarkets, convenience stores and food service operators with significant presence of 560,000 restaurants and food outlets, and 12,500 hotels. In general, the distribution system has 2 main channels: 1. Direct distribution channel Sales of products at exhibitions or fairs Sales at importing companies’ showrooms and branches 2. Indirect distribution channel (through agents of level 1, 2 and 3) Agent level 1: A company which directly provides agents with goods of the same price (agents have to make a payment before delivery). Agents have a right to ask for discount negotiated in the contract by its end. Agent level 2: These agents are in charge of importing goods from agent level 1 and their main customers are often retail stores, shop, showrooms or supermarkets. Agent level 3: This is the channel which is similar to agent level 2, but carrying a wider network of small retail spots in big cities or regions having a large population. 43 EVBN SECTOR STUDY
A number of retailers covered by a distributor in each area depends directly on its capability.
Usually the distributor with a wide presence in big cities has around 200-300 stores including
showrooms in supermarkets and restaurants. In Ha Noi and Ho Chi Minh City, a regular big
distributor has at least 7 key accounts (such as hotels, restaurants, hypermarkets, etc.), that are
considered as the main source of its income. From that point, the distributor expands and go
deeper to the market.

44   EVBN SECTOR STUDY
Example of main distributors in Vietnam:

 VINCORP JSC              TAN BINH MINH           VIET-ITALY CO.,      MTV IMPORT               ADT CO., LTD
                          CO., LTD                LTD                  EXPORT TRADING
                                                                       JSC

 Website:                 Website:                Website:             Website:                 Website:
 http://vincorp.vn        http://ruoutanbinhmi    http://monteverdi.   http://www.ruouvangh     http://www.adtwine.c
                          nh.com                  vn/                  p.com/                   om.vn

 Address:                 Address:                Address:             Address:                 Address:
 21 Ngo Hue, Ngo Thi      47 Hau Giang, Ward      167 Xuan Thuy,       109/8 Nguyen Binh        73 Ton Duc Thang,
 Nham Ward, Hai Ba        4, Tan Binh District,   Cau Giay, Hanoi      Khiem Street, Dakao      Dong Da District,
 Trung District, Hanoi    HCMC                                         ward, District 1,        Hanoi
                                                                       HCMC
                                                                       Show room :
                                                                       VINTAGE - 01 Thao
                                                                       Dien Street, Thao
                                                                       Dien Ward, District 2,
                                                                       HCMC, VN

 Phone number:            Phone number:           Phone number:        Phone number:            Phone number:
 (04) 39766167            (08) 39480626           84-437681543         (0313) 566 607           (04) 37321638

 ANH HUY CO., LTD         MAI ANH TRADING         MALTHOP              VIET TRADE JSC           WINE
                          CO., LTD                VIETNAM                                       SUPERMARKET
                                                  CO.,LTD                                       CO., LTD

 Website:                 Website:                Website:             Website:                 Website:
 http://ruousojuhanqu     http://mai-anh.vn       http://malthop.co    http://phanphoibiaruo    www.sieuthiruoungo
 oc.com                                           m.vn                 u.vn/                    ai.com

 Address:                 Address:                Address:             Address:
 01 Song Da, Ward 2,      334-336 Kham            508 M2, Lang         199 Tran Binh, Tu
 Tan Binh District,       Thien, Đong Đa, Hà      Trung, Lang Ha,      Liem, Ha noi
 HCMC                     Nội                     Dong Da, Ha Noi

 Phone number:            Phone number:           Phone number:        Phone number:
 (08) 66819916            (04) 35381323           (04) 37833147        04.22151506

 45   EVBN SECTOR STUDY
You can also read