2Q18 New York - NAI Queens
←
→
Page content transcription
If your browser does not render page correctly, please read the page content below
2Q18 New York
Commercial Real Estate Market Report

2Q18
Table of Contents
New York Economic Overview					Page 03
     Southern Queens Spotlight						page 06

Office Market   							Page 09
     Overview								page 10
     Leasing								page 11
     Rent									page 13
     Construction								page 14
     Sales									page 16
     Submarkets								page 19

Retail Market								Page 20
     Overview								page 21
     Leasing								page 22
     Rent									page 23
     Construction								page 24
     Sales									page 26
     Submarkets								page 29

Industrial Market							Page 30
     Overview								page 31
     Leasing								page 32
     Rent									page 33
     Construction								page 34
     Sales									page 36
     Submarkets								page 39

Multi-Family Market							Page 40
     Overview								page 41
     Vacancy								page 42
     Rent									page 44
     Construction								page 45
     Sales									page 47
     Submarkets								page 50

                    175 Broadhollow Road, Suite 150 | Melville NY 11747 | +1 718 215 1400
                     www.naiqueens.com | www.nailongisland.com | www.nailiqnews.com
New York
Economic Overview 2Q18

2Q18                                                                                                                      Economy

Overview
Welcome to the new New York. Based on information from the U.S.          Media and technology should stand out as New York’s long-term
Census, the Office of Management and Budget changed the metro’s          growth drivers. This market’s employment base has been gradually
definition to include Middlesex, Monmouth, and Ocean counties in         shifting from finance toward TAMI (tech, advertising, media, and
New Jersey (formerly of Edison) and Orange County in New York            information) sectors for almost three decades. Tech industry
                              ThePutnam
(formerly of Poughkeepsie), while     LongCounty
                                             Islandwas
                                                    office   market
                                                        removed  from    heavyweights such as Bloomberg and Google have accounted for
the geography. The New York metro now includes an additional 2.3         some of the largest payroll expansions so far in this recovery, and
                              ended
million people, and the economy     nowthe  1sttoward
                                        skews    quarter
                                                       the 2015
                                                           blue-collar   firms like DraftKings and BuzzFeed contributed to more than $7.3
                              with areas
industries more prevalent in outlying an increased    vacancy
                                            and away from  highvalue-    billion of venture capital investment in 2015, raising $300 million and
                              rate of 8.4%. The vacancy
add industries, like finance, and   high-growth  ones such        rate
                                                             as tech,    $200 million respectively. Venture capital investment in the New York
more often found in Manhattan and closein sections of the boroughs.      metro area rose to its highest level on record in 17Q3 surpassing
                              was 8.2% at the end of the 4th             Silicon Valley. The bulk of the funding was Softbank’s $3.0
The past year has been a mixedquarter
                                  bag for2014,   8.0%financial
                                           New York’s   at thesector.
                                                                end      billion direct investment in WeWork. Tech’s recent popularity has
Thanks largely to expansions  of the 3rd quarter, and 7.7%
                                  by privateequity  investors, hedge     encouraged studies like that by the Federal Reserve Bank of New
funds, and merger and acquisition boutique shops, the metro’s most       York, which found that the city’s workforce in industries that use
                              at the end of the 2nd quarter
prominent economic driver added more jobs than historic averages         technology in their core business has grown by more than 60%
                              2014.
and national average. Profits of the six largest U.S. banks also has     since 2007, compared with 12% nationally. Of the nation’s top tech
been substantially increasing and with deregulation could see a larger   employment centers, only Seattle has a greater concentration of tech
jump. And according to the Office of the New York State Comptroller,     jobs within the urban core. The majority of New York’s tech jobs are
average annual Wall Street compensation topped $400,000 for only         based in Manhattan, though more and more firms are pushing out
the second time ever. Yet financial firms such as Barclays, Bank         into Brooklyn and even Queens. Tech still accounts for only slightly
of America, Morgan Stanley, and Goldman Sachs continue to                more than 5% of total metro employment, but it is growing quickly.
announce layoffs and slash bonuses, fueled by a yearlong slump           And adding creative industries to the tech total produces a subset
in fixed income and rising business and litigation costs. Legal          that makes up about 15% of metro employment, compared with 10%
settlements and new regulations have helped keep the number of           in financial activities. As these industries continue to grow, the metro’s
jobs in the sector just at the prerecession peak. However, as long       appeal to highly educated workers should remain a key advantage
as financial-sector employees account for more than one-quarter of       as the U.S. economy shifts toward professional/high tech services
total wages paid, finance will be a driving force behind New York’s      over the long term. Near term, however, the sector is not without its
economy.                                                                 challenges.

Low-paying sectors continue driving steady employment growth,
although growth in middle-wage sectors picked up in recent years,
according to the office of the city comptroller. The Bureau of Labor
                                                                                                   Vacancy Rate
Statistics reported in August 2018, the New York metro had the
largest year-over-year employment increases (+117,400) when
compared to other national metros. On another positive side, average
hourly private-sector earnings continues to rise.

Overall job additions in both the city and the metro as a whole
have been heavily concentrated in lower value-add sectors in this
expansion. Over the past year, sectors such as education and health
services and leisure and hospitality accounted for a disproportionate
share of employment gains in both the city and the metro. With the
metro’s population over the age of 65 expected to increase by an
average of more than 58,000 residents annually over the coming
years, the healthservices sector should continue growing relatively
rapidly. Unfortunately, jobs associated with eldercare tend to pay
much less than others in the industry.

                                                                    Page 04
2Q18                                                                                                  Economy

     Overview
                                   New York Employment by Industry in Thousands:
                                          Current Jobs           Current Growth      10 Yr. Historical         5 Yr. Forecast
NAICS Industry                         Jobs           LQ        Market      US      Market        US         Market        US

Manufacturing                           205           0.4       -1.58%     -0.41%   -2.05%       -0.98%      -1.24%       -1.26%

Trade, Transportation & Utilites       1,211          0.9       1.36%      1.30%    0.72%        0.52%       0.01%        0.27%

  Retail Trade                          667           0.9       1.48%      0.70%    1.15%        0.41%       0.12%        0.28%

Financial Activities                    627           1.5       0.73%      0.54%    -0.01%       0.31%       0.05%        0.78%

Government                              901           0.8       -0.12%     0.09%    -0.39%       -0.08%      0.39%        0.51%

Natural Resources, Mining &
                                        269           0.7       3.08%      4.08%    0.93%        -0.09%      0.60%        1.52%
Construction

Education & Health Services            1,475          1.3       3.02%      1.50%    2.81%        2.01%       0.57%        1.25%

Professional & Business Services       1,150          1.1       1.91%      2.56%    1.77%        1.65%       1.03%        1.34%

Information                             245           1.9       -0.54%     0.58%    0.64%        -0.88%      0.17%        0.29%

Leisure & Hospitality                   686           0.9       1.39%      1.64%    3.22%        1.86%       0.60%        1.28%

Other Services                          303           1.1       1.00%      0.62%    1.44%        0.46%       -0.09%       0.41%

Total Employment                       7,074          1.0       1.44%      1.26%    1.22%        0.75%       0.39%        0.75%

                                                      Demographic Trends
                                         Current Level           Current Change       10 Yr. Change          Forecast Change
Demographic Category                   Metro          US        Metro       US      Metro         US         Metro         US

Population                           14,584,478   328,212,555   0.3%        0.7%    0.6%          0.8%       0.3%         0.7%

Households                            5,498,168   126,281,516   0.5%        1.0%    0.7%          0.8%       0.8%         1.1%

Median Household Income               $68,407      $60,991      1.3%        3.6%    1.2%          1.6%       2.7%         2.9%

Labor Force                           7,158,421   161,862,122   -0.5%       1.0%    0.5%          0.5%       0.6%         0.8%

Unemployment                            4.2%         3.9%       -0.3%      -0.4%    -0.1%        -0.2%         -            -

      Population Growth                                  Labor Force Growth                              Income Growth

                                                                Page 05
Southern Queens
2Q18 Sales Report
First Half 2018
Sales Report
Southern Queens Spotlight
Southern Queens First Half 2018 Sales Report
Sales Dollar Volume
(Q2 2017 vs. Q2 2018)
Sales Dollar Volume (2Q 2017 vs. 2Q 2018)
$140
$120
$100
$80
(In Millions)
$60
$40
Demographic Trends
$20
(In Millions)
$0
Multifamily Industrial Garage Retail Office Mixed Use Development
Sales volume
Sales volumeininSouthern
Southern Queens
Queens in the
in the firstfirst half
half of of 2018
2018 dropped
dropped 6% overall,
6% overall, from approx.
from approx. $280to
$280 million
million
$263 to $263 million.
million.
Multifamily properties saw the most significant decrease in sales volume, down 92%, from almost
$110 million
Multifamily to just $8
properties sawmillion
the mostin the first halfdecrease
significant of 2018. in sales volume, down 92%, from almost $110
million to just $8sales
Development millionvolume
in the first
more half than
of 2018.
doubled, increasing 257% in the same period from $34
million to almost $120 million, encompassing 14% of all southern Queens sales volume in dollars.
Industrial sales
Development fellvolume
sales over 50%,
morefrom than$58 millionincreasing
doubled, to $27 million,
257% in capturing
the samejust 9% of
period sales
from $34volume
millioninto
the first
almost halfmillion,
$120 of 2018. Mixed use trades
encompassing 14% ofnearly doubled
all southern in sales
Queens volume
sales compared
volume in dollars.toIndustrial
the firstsales
half of
fell
2017,
over from
50%, $28
from $58million
million to $27
$50 million,
millioncapturing
in the first halfofof
just 9% 2018,
sales representing
volume in the first 48%
half ofof2018.
all dollar
Mixed
volume
use in nearly
trades Southern Queens.
doubled in sales volume compared to the first half of 2017, from $28 million to $50 million
in the
NAI first half of
Queens 1752018, representing
Broadhollow Road,48%
Suiteof150,
all dollar volume
Melville, in Southern
NY 11747 718Queens.
215 1500 www.naiqueens.com
Page 06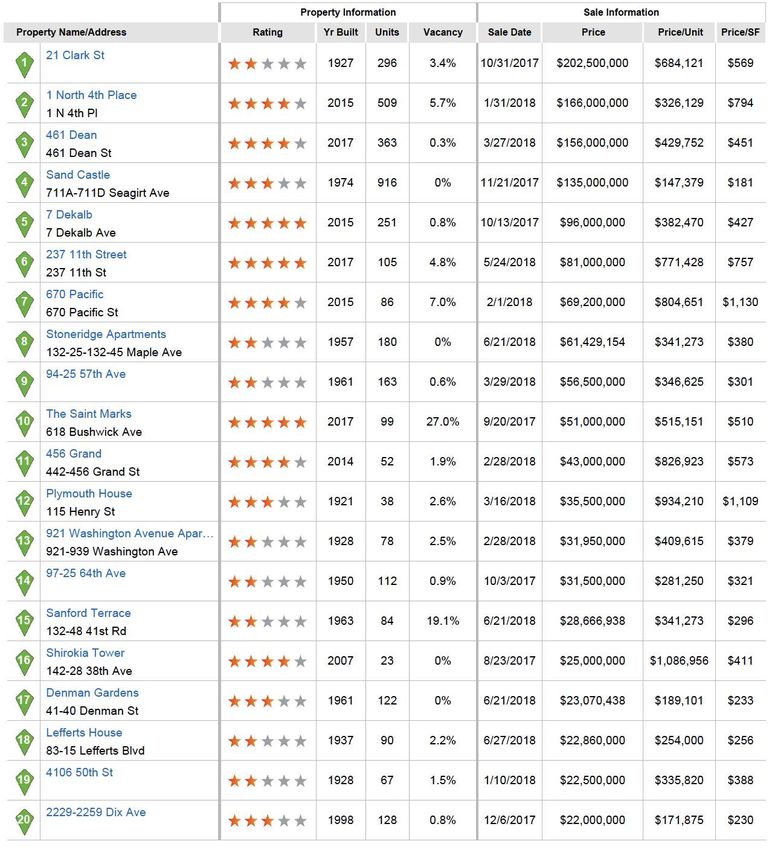
First Half 2018
       2Q18                                                                  Sales Report
                                                                                          Sales Report

       Southern Queens Spotlight
Southern Queens First Half 2018 Sales Report

                                      Transaction Volume By Building Class
                    Transaction Volume(Q2
                                       by2017
                                          Building    Class (2Q 2017 vs. 2Q 2018)
                                              vs. Q2 2018)

                                                 Garage
                                                  7.5%                         Retail
                         Industrial
                                                                               10%
                           10.5%
                                                                                                Office
                                                                                                4.5%
          Multi-
          Family
           3%

                                                                                                            Mixed
                                                                                                             Use
                                                                                                            19%

                                                 Demographic Trends

       Southern Queens had slightly more transaction activity through the first half of 2018 than the
       first half
  Southern        of 2017,
             Queens        with 132
                      had slightly   transactions
                                   more transactionso far thisthrough
                                                    activity    year up
                                                                      thefrom
                                                                           first115,  representing
                                                                                 half of 2018 than a
                                                                                                   thenearly
                                                                                                       first
       15%    increase.
  half of 2017, with 132 transactions so far this year up from 115, representing a nearly 15%
  increase.
        The most notable increase in trades was in Mixed Use properties, with 63 in the first half of
  The most
        2018,notable
               up fromincrease   in trades
                         43 in the   first halfwas in Mixed
                                                of the        Use properties,
                                                       year prior, representing with  63 inincrease.
                                                                                   a 46%       the first half of 2018,
  up from 43 in the first half of the year prior, representing a 46% increase.
  GarageGarage
           tradestrades  moredoubled,
                   more than    than doubled,
                                           from 4 from   4 transactions
                                                    transactions         to 9first
                                                                 to 9 in the   in the
                                                                                    halffirst half of 2018.
                                                                                           of 2018.
  Office trades fell by half from 8 to 4 office buildings traded during this period.
       Office trades fell by half from 8 to 4 office buildings traded during this period.

 NAI Queens        175 Broadhollow Road, Suite 150, Melville, NY 11747        718 215 1500        www.naiqueens.com
                                                           Page 07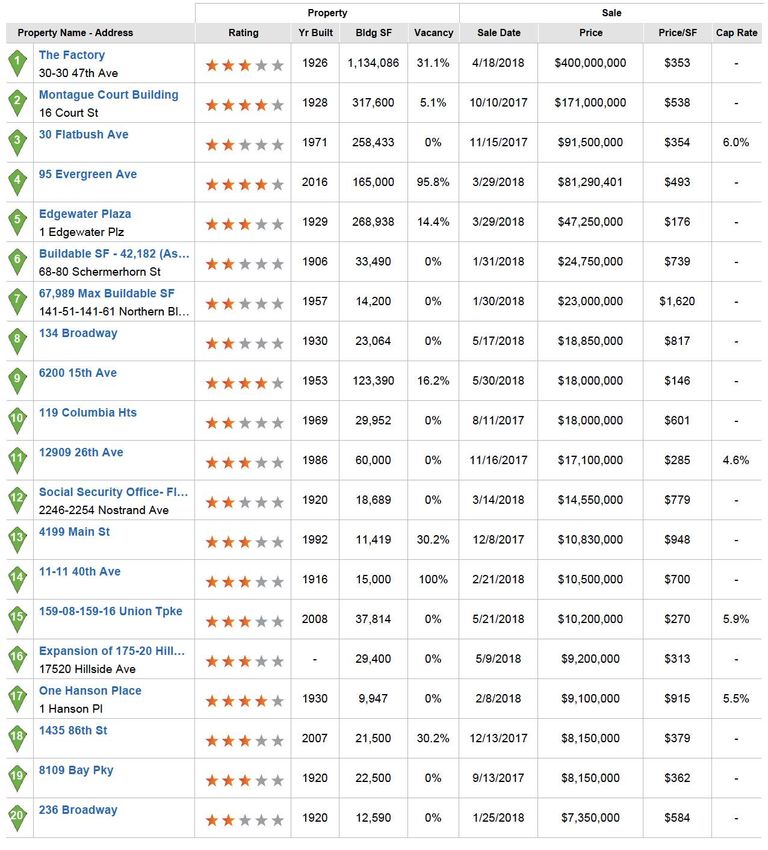
Southern Queens

  2Q18                                                                                     First Half 2017Sales Report

                                                                                           Sales Report
  Southern Queens Spotlight
Southern Queens First Half 2018 Sales Report
                                P.P.S.F.
          P.P.S.F. Values (Q2 2017 vs. Q2 Values
                                          2018):                  (2Q 2017 vs. 2Q 2018)
      $450

      $400

      $350

      $300

      $250

      $200

      $150

      $100

                                                        Demographic Trends
        $50

         $0
                 Multifamily        Industrial         Garage             Retail            Office           Mixed Use       Development

   Sales volume in Southern Queens in the first half of 2018 dropped 6% overall, from approx.
   $280
 The averagemillion
             price perto $263
                       square foot million.
                                   (P.P.S.F.) of all commercial properties sold in Southern Queens in the first half of 2018 was $288 per
 sq. ft., up from $2015 at the same time in 2017.
 Multifamily properties dropped slightly in price per square foot value, from $314 per square foot to $264 per square foot in the first half
   Multifamily properties saw the most significant decrease in sales volume, down 92%, from
 of 2018, due to larger properties trading.

   almost $110 million to just $8 million in the first half of 2018.
 Retail price per square foot values jumped 14% from $359 per square foot to $411 per square foot in the first half of 2018.
 Office properties dramatically increased in price per square foot, from $192 per square foot in the first half of 2017 to $425 per square
 foot in the first half of 2018, primarily due to a reduction in transactions.
   Development sales volume more than doubled, increasing 257% in the same period from
 Industrial properties continue to appreciate significantly in price per square foot value, from $236 to $298 per square foot.
 Mixed use property price per square foot values surged similarly, from $241 per square foot to $298 per square foot in the first half of
   $34 million to almost $120 million, encompassing 14% of all southern Queens sales volume
 2018.
   in dollars. Industrial sales fell over 50%, from $58 million to $27 million, capturing just 9%
 Development price per square foot values saw a remarkable surge from $104 to $117 per buildable square foot, a nearly 13% increase.
 Retail Price per square foot values gained 14%, up to $411 per square foot from $360 per square foot, driven by high priced trades in
   of sales volume in the first half of 2018. Mixed use trades nearly doubled in sales volume
 Briarwood & Downtown Jamaica.
   compared     to the
       Contact Brian     first half
                     J. Sarath  for aofcomplimentary,
                                        2017, from $28      million no
                                                      confidential,  tocost
                                                                        $50or million in Opinion
                                                                              obligation the firstofhalf of 2018,
                                                                                                     Value.
   representing 48% of all dollar volume in Southern Queens.

                                                                    Page 08
New York
Office Market 2Q18
2Q18                                                                                                    Office

    Overview

     916M                          22.5M                                 6.6M                            5.0%
    Inventory SF             Under Construction SF                 12 Mo. Net Absorp. SF             Market Cap Rate
                        The Long Island office market
                        ended the 1st quarter 2015
                        with an increased vacancy
                  8.8%                        $55.11
                        rate of 8.4%. The vacancy rate                                $659
                        was 8.2% at the end
             Vacancy Rate                     of theRent/SF
                                          Market     4th                 Market Sale Price/SF
                        quarter 2014, 8.0% at the end
                        of the 3rd quarter, and 7.7%
    The New York office at themarket
                               end of the 2ndreach
                                      could   quarter
                                                    an inflection point over the coming years as major projects
                        2014.
    such as World Trade Center and Hudson Yards deliver. Although many planned tenant moves will be pure
    relocations, a fair share of tenants will be downsizing on net. Coupled with new deliveries, this could take a toll
    on occupancies and rent gains. The fate of Sixth Avenue in particular remains a point to watch, with Time and
    McGraw-Hill both defecting to Lower Manhattan, though News Corp and 21st Century Fox decided to stay
    put after mulling leases there. Nonetheless, the removal of older office buildings from inventory for residential
    (primarily luxury condo) conversions should help protect fundamentals.

    Institutional-grade Midtown towers are selling at well above 2007 prices, which has pushed average cap
    rates lower. An influx of foreign capital has bolstered pricing, although the prospect of more interest-rate
    hikes in 2018 appears to leave limited room for further cap rate compression. Rent growth has decelerated
    appreciably relative to gains posted in 2014–15. That said, there is no doubt that New York offers superior
    liquidity, supply constraints, and an educated workforce to satisfy longterm, conservative investors. Moreover,
    global capital distortions coupled with weaknesses abroad continue to propel a flight to quality assets, while
    near-zero (in some cases, negative) rates on government-issued bonds in countries like Germany and Japan
    are sending investors elsewhere in search of yield. Both trends should continue to have a positive impact on
    property valuations.

Key Indicators:
                                                       Gross Asking   Availability   Net Absorption Deliveries       Under
Current Quarter              RBA        Vacancy Rate
                                                           Rent         Rate               SF          SF        Construction SF
4 & 5 Star                448,135,587      10.5%          $66.26        14.8%           143,029      244,000       19,368,630
3 Star                    347,200,322      8.0%           $47.80        11.2%          1,160,697      23,019        3,093,472

1 & 2 Star                120,648,689      4.7%           $33.14         6.5%          (139,124)        0            73,333
Market                    915,984,598      8.8%           $55.11        12.4%          1,164,602     267,019       22,535,435

                                                          Page 10
2Q18 Office
Leasing
With lukewarm demand apparently the new norm, only gradual & 5 Star properties over the past year is among the highest
improvement in fundamentals should be expected as the cycle in the country. That leaves many buildings constructed in the
progresses. Following the recession, New York vacancies 1970s and ’80s—disproportionately falling into Manhattan’s
peaked much lower than those of the National Index, but the Midtown submarkets—scrambling to replace tenants that
recovery, and subsequent expansion, has left much to be have committed to space in recently delivered or under-
desired. As market conditions have improved nationally, the construction properties across the city.
metro’s net absorption has remained inconsistent—without
positive demand continuing for more than three consecutive Vacancy Rate
quarters since 2007—causing New York’s vacancy spread to
the National Index to fall noticeably below its historical average.
Finance, long the market’s most important economic driver,
is partially responsible—high business costs and increasing
use of technology in the industry have made it easier for
firms to move nonessential personnel out of the city, capping
financial services employment below prerecession levels.
Beyond the financial sector, many industries have adopted
more collaborative office layouts, which, combined with the
digitization of documentation, have decreased the square
footage required per employee over the last couple of cycles.
And the increasing popularity of coworking and alternative work
arrangements (i.e., freelancers, contractors, etc.) appears to
be reducing the space needs among traditional office users as
well. In fact, WeWork leases about 4 million square feet in the
New York metro.
Ten Hudson Yards recently opened its doors, and several
Net Absorption, Net Deliveries & Vacancy other large towers are expected to deliver over the coming
years. This is likely to cause pain for less competitive
properties that continue to charge relatively high rents. Minimal
availability exists at 10 Hudson Yards, while 30 Hudson Yards
and 50 Hudson Yards has already been fully spoken for—an
unprecedented leasing pace—but relocations to the mixed-
use complex will leave behind blocks greater than 500,000 SF
in both the Columbus Circle and Times Square submarkets.
Although UBS bucked the trend toward Midtown defections
by opting to renew its lease at 1285 Avenue of the Americas
through 2033, leasing velocity on the Far West Side coupled
with forthcoming deliveries would appear to presage challenges
for Midtown’s submarkets in the coming years. While owners
of newer properties are likely to emerge as winners in this high-
stakes game of musical chairs, prewar buildings have also
been buoyed by a preference for exposed brick and ducts
among technology, advertising, marketing, and information
The burden of historically low demand growth is unlikely to (TAMI) tenants, as well as by others targeting a Millennial-
be shared equally across the market. Average quarterly heavy workforce. Investors with exposure to “middle-aged”
demand of less than 500,000 SF since the end of 2010 pales properties may not be as lucky, because the prospects for
in comparison to the average of nearly 1.5 million between backfilling newly vacated space appear increasingly bleak
1985 and 2007, yet occupancies in properties built since given the lack of pure tenant expansion this cycle, and with
2000 continue to hold up well. In comparison, average the economy likely closer to the end of the expansion than
occupancies among offices built between 1970 and 1989 to the beginning. Several high-profile landlords have already
are roughly eight percentage points lower than the rate among undertaken significant renovation projects in an attempt to
the newest stock. Tenant preferences for newer, nicer office make outdated product more competitive, a trend that is
space is nothing new, but the share of net absorption by 4 expected to continue.
Page 112Q18 Office
Leasing
Despite an improvement in the financial sector, storm clouds million SF over the next three years, with more likely to come.
continue to gather on the horizon. Throughout the recovery, net Regus didn’t get shut out of the boom in coworking spaces,
absorption has lagged behind that of the last cycle—an average either—it’s opened nine locations since 2015, and smaller
of about two million SF since 2011 compared with more than providers have opened as well. Traditional office tenants are
10 million annually between 2004 and 2007. Pointing a finger incorporating many of the same concepts into their own office
at finance has been easy—traditionally, it’s the office market’s designs, though several studies contest the limits of productivity
strongest driver. Increased regulation and higher legal costs, in communal work spaces. Increasingly efficient office space
legacies of the financial crisis, have helped spur nonessential has not kept other TAMI tenants from continuing their cycle-
personnel to move to lower-cost markets, keeping total long growth, especially in Midtown South, though some have
financial-services employment below prerecession peaks. The required the inclusion of options for future expansions. Certain
sector has grown consistently over the past year and a half, landlords have been willing to make such commitments in
and subsequently leasing to financial tenants has picked up— hopes of landing the next unicorn as a future anchor tenant,
JPMorgan Chase moved into 344,000 SF on the Jersey City but the trend is only the latest indication that catering to
waterfront and Morgan Stanley added 261,000 SF at 1633 startups and smaller tech companies can be more capital
Broadway. However, a large percentage of financial leasing has intensive than traditional tenants would be. Among larger tech
come from smaller hedge funds and private equity firms, and tenants, Facebook leased another 80,000 SF, bringing its total
while they tend to lease expensive office space they do not fill footprint at 770 Broadway to 355,000 SF, and also recently
office buildings as quickly as their investmentbanker brethren. took around 200,000 SF on Park Avenue South in Gramercy.
A number of tenants, both inside of finance and out, are in the Meanwhile, the social networking behemoth is believed to be
market for big blocks of office space. Leasing at Hudson Yards seeking at least 500,000 SF in a newly built tower to create
has been extremely rapid: With the addition of Sidewalk Labs an urban campus on a par with Google’s in Chelsea. As part
and Intercept Pharmaceuticals, little space remains available at of a plan to aggressively expand in the city, Salesforce.com
10 Hudson Yards, and the office condos at 30 Hudson Yards signed for 300,000 SF at 3 Bryant Park, including signage
have already been fully spoken for. Moreover, Blackrock has atop the tower. However, the news has not all been good for
an LOI to take 850,000 SF, or 29%, of 50 Hudson Yards when the sector. The New York State Attorney General’s fight against
the currently proposed project completes in 2022. But don’t daily fantasysports wagering caused DraftKings to sublease
expect a dramatic increase in net absorption over the coming its 23,000 SF NoHo office after only a few months. Ad firm
years. Many of the tenants signing these leases will be moving Rocket Fuel left 90,000 SF at 100 W. 33rd St. in Herald
to their new homes from elsewhere in the market—Time Square for 42,000 SF at 195 Broadway in June, and adtech
Warner is leaving Columbus Circle for 30 Hudson Yards, and startup Collective is looking to break its 57,000 SF, 10-year
law firm Skadden, Arps, Slate, Meagher & Flom is vacating 4 lease at the former New York Times building after only two
Times Square for 1 Manhattan West, decreasing its footprint years. The market may be showing early signs of a pullback by
in the process. As the use of footprint in the process. As the venture capital investors who have voiced concerns over lofty
use of office space continues to become increasingly efficient, valuations in the industry, causing VC investment to fall from
other tenants will likely require less space as well. Coupled with 16Q1 peaks.
slowing growth in the working-age population these factors
should put downward pressure on future demand.
Availability Rate
The growing prominence of TAMI and WeWork’s rapid growth
are having a significant impact on leasing trends in New
York. Coworking is not a new concept. Shared office-space
providers like Regus had their day during the last cycle, but
none has been as successful as WeWork. As the company’s
valuation has skyrocketed to more than $15 billion, its number of
locations has grown to 23 in Manhattan, three in Brooklyn, and
one each in Queens and Jersey City. During 2015, WeWork
opened locations totaling nearly 792,000 SF, accounting for
more than 20% of the metro’s net absorption, an astronomical
percentage. In 2016 that number grew to 1.1 million SF, or four
times the metro’s net absorption for the year. In 2017, WeWork
currently leases more than 3 million square feet in the metro.
The company has already signed leases to open close to one
Page 122Q18 Office
Rent
New deliveries could precipitate a slowdown in rent growth popularity of both areas with New York’s rapidly expanding
over the coming years. Rent growth slowed significantly in TAMI tenants. The prices for prime addresses in Midtown are
2016 and continued to decline in 2017. The best gains of the still lofty enough to rank among the highest in the metro, as
cycle appear to have already been made, despite remaining evidenced by Citadel’s record-breaking lease at 425 Park.
well shy of the peaks of last cycle. And while New York ranks in However, average asking rents in Midtown South are rapidly
the top five metros in the nation for cumulative rent growth since converging with those in Midtown, with rents in both Hudson
2010, large deliveries are expected to erode the bargaining Square and Gramercy having already surpassed those in
power of landlords. Owners of older, less competitive buildings Times Square. Both Downtown and Brooklyn could see rent
will almost certainly have to reassess their rent expectations growth to outperform Midtown’s rate over the coming years,
or come to terms with the reality of lower occupancies when albeit to a lesser extent. Brooklyn in particular is an interesting
many newer properties are aided by public incentive programs case, because it has become a much more viable office
and the cycle gets a little old. market during this cycle; rents in Downtown Brooklyn have
grown more than 40% cumulatively since 2010. But that pace
As tenant preferences and expectations continue to change, is not likely to continue. More square footage is expected to
Midtown’s rent premium is likely to decrease further. Midtown deliver in the next several years than in any such stretch in
is the only one of Manhattan’s three main office submarket recent history. Hence, competition will increase, mostly among
groups where asking rents are still below 2008 levels. Aided companies with a substantial portion of their labor force coming
by a surge of leasing among communications and marketing from Brooklyn or Lower Manhattan, due to transportation
companies, rents in both Lower Manhattan and Midtown constraints.
South have eclipsed last cycle’s peaks, thanks largely to the
Market Rent Growth (YOY) Market Rent Per Square Foot
4 & 5 Star Expenses Per Square Foot (Annual):
Market / Cluster Utilities Cleaning Insurance Taxes Other Total
New York $1.35 $1.38 $0.46 $8.89 $9.97 $22.05
Midtown $2.20 $1.43 $0.57 $15.18 $13.86 $33.24
Queens $0.91 $1.23 $0.38 $5.58 $7.21 $15.31
Expenses are estimated using NCREIF, Trepp, IREM, and CoStar data using the narrowest possible geographical definition from Zip Code to region.
1 & 2 Star Expenses Per Square Foot (Annual):
Market / Cluster Utilities Cleaning Insurance Taxes Other Total
New York $0.52 $0.95 $0.27 $5.87 $3.01 $10.62
Midtown $0.54 $1.16 $0.40 $13.13 $6.96 $22.19
Queens $0.37 $1.11 $0.33 $5.24 $2.65 $9.70
Expenses are estimated using NCREIF, Trepp, IREM, and CoStar data using the narrowest possible geographical definition from Zip Code to region.
Page 132Q18 Office
Construction
Projects on the Far West Side continue to drive the Manhattan year for deliveries in Brooklyn since MetroTech opened in 2004.
construction boom. During much of the recovery, deliveries have And these numbers do not account for the abundant renovations
fallen shy of the metro’s historical annual average of 3.2 million SF, but underway and planned throughout Kings County. In preparation for
construction is quickly ramping up thanks to Related’s Hudson Yards. these additions to the market’s outdated office stock and in reaction to
In fact, metrowide deliveries over the coming years are expected to renewed interest in Brooklyn among various types of tenants, several
be the heaviest since 2002–04, and nearly half of that supply growth of Manhattan’s bestknown brokerages have opened offices on the
will occur in Midtown. With a tenant roster including Coach, L’Oréal, other side of the East River. Some of the largest projects include
and SAP, among others, the 1.7 million SF 10 Hudson Yards opened Kushner and RFR’s recently opened 950,000 SF Dumbo Heights
in 2017. Soon 55 and 30 Hudson Yards are expected to deliver in complex, which is home to Etsy and WeWork; Boston Properties
2018 and 2019, respectively. And Related is not the only developer and Rudin Management partnering on the 670,000 SF Dock 72,
targeting the Far West Side—Brookfield’s 2.3 million SF 1 Manhattan also anchored by WeWork; and Greenland Forest City Ratner’s
West is also targeting 2019 for delivery, anchored by Skadden and proposal of two offices, totaling more than one million SF, as part
Ernst & Young. Only slightly farther east, Vornado is investing hundreds of its Pacific Park project, adjacent to the Barclays Center. As these
of millions of dollars to update its eight million SF portfolio around projects come to fruition, more tenant relocations from Manhattan will
Penn Station, including connecting One and Two Penn Plaza so that almost certainly have to take place to keep fundamentals as healthy
tenants can easily shift from one to the other. Once the governor’s as they are today. Although tenants have yet to defect en masse, the
proposed overhaul of Penn Station and the Farley Post Office across Downtown Brooklyn Submarket has managed to attract the likes of
the street gets underway, expect more renovation and redevelopment Frog Design and Wipro Digital, and other tech/creative tenants may
as landlords try to capitalize on the area’s revitalization and increase well follow.
their rent rolls. The only other office projects under construction larger
than one million SF outside of the Penn Plaza/Garment Submarket are Deliveries & Demolitions
3 World Trade Center (2018) and One Vanderbilt (2021). In the Plaza
District, the 675,000 SF 425 Park Avenue (2018) is also underway.
Hedge fund Citadel will anchor the building, leasing 200,000 SF
and paying approximately $300/SF for the 15,000 SF top floor or a
blended $175/SF across all the leased space.
Unknown timelines for several large projects could cloud this outlook.
Several developers are waiting on anchor tenants to start construction
on large office towers at and around Hudson Yards, including three
from Tishman Speyer totaling more than six million SF. Once large
tenants are secured, construction should increase further on the Far
West Side. Twenty-First Century Fox/News Corp.’s decision to remain
on Sixth Avenue in Midtown left Silverstein Properties scrambling to
find an anchor for 2 World Trade Center. The developer plans to find a
replacement by the end of the year, pushing the tower’s delivery date
back to at least 2021. Despite the pricing advantage associated with
the World Trade Center site, as well as momentum with TAMI tenants,
not every tenant is well suited to Lower Manhattan. The location makes Commercial real estate’s version of less is more, boutique office
most sense for companies with a majority of their non-Manhattan- construction is increasing following the attainment of triple-digit rents
based workforce coming from Brooklyn and New Jersey, both areas in several of Manhattan’s smaller offerings. New York’s boom in office
with booming residential development, which should only increase development hasn’t been limited to large towers, and while 200,000
World Trade Center’s desirability. Two large projects, 390 Madison SF may be considered an average-sized office building in most
(862,000 SF) and One Vanderbilt (1.7 million SF), could be the start markets, it’s boutique in Manhattan. Romanoff Equities and Property
of massive office redevelopment in the Grand Central Submarket. Group Partners’ 120,000 SF 860 Washington St. in the Meatpacking
The Midtown East rezoning recently passed, allowing for owners of District kick-started a push into the niche market segment after
landmarked buildings to sell up to four million SF of unused air rights to announcing that the first tenant, Delos Living, agreed to rents north
other developers in the district, a number of the submarket’s outdated of $140/SF. Vornado, Rockpoint Group, Aurora Capital, and Savanna
buildings will become candidates for redevelopment, especially given have projects in the works, catering to deep-pocketed tenants
the stark occupancy premium associated with newly built properties looking for new high-end spaces, and all seem to be asking for rents
throughout Midtown. in excess of $150/SF. Many of these boutique properties could be
Major New York office developers are looking to take advantage of delivering at the right time, as hedge funds have been particularly
Brooklyn’s resurgence. Following the borough’s residential boom, active in leasing of late.
Brooklyn’s population now includes a large number of very well-
educated residents, many of whom want to work close to where they
live, or so developers are hoping. Over two million more SF is expected
to deliver over the coming years. In fact, 2017 marked the heaviest
Page 142Q18 Office
Construction
Properties Square Feet Inventory Preleased
53 6,638,882 0.7% 46.2%
Under Construction:
Property Name/Address Rating Bldg. SF Stories Start Complete Developer/Owner
1 Dock 72 670,000 17 May-2016 Sep-2018 Rudin Management
63 Flushing Ave.
2 The Wheeler 623,771 14 Jun-2016 Jan-2019 Tishman Speyer
181 Livingston St.
Three Jackson Tishman Speyer/
3 550,000 26 Jun-2017 Jan-2019
28-10 Queens Plz. S. H&R REIT
One Jackson Tishman Speyer/
4 550,000 26 Jun-2017 Jan-2019
28-01 Jackson Ave. Chris McCartin
Heritage Equity Ptrs.
5 25 Kent Ave. 507,611 8 Sep-2016 Sep-2018
Rubenstein Ptrs. L.P.
6 One Willoughby Square 500,000 40 Jul-2018 Apr-2021 JEMB Realty Corp.
420 Albee Sq.
Corporate Commons 3 The Nicotra Group,
7 391,223 8 Sep-2017 Sep-2019
1441 South Ave. LLC
Page 152Q18 Office
Sales
Global investors continue to increase their allocations to U.S. paid for the property. Jamestown purchased partial interest
commercial real estate (CRE), and as the most liquid national in the asset in 2003 and again in 2011. What was once the
office market, New York is benefiting immensely. Pricing for building for the National Biscuit Company selling in 1999 for
many institutional deals rebounded quickly after the downturn, $27.6 million is now one of the priciest sales in New York’s
and with prices now well exceeding those of the last cycle’s history. Another great example of Midtown South pricing is
peak, cap rates are running below 4.5%. Ivanhoé Cambridge, exemplified by the August 2015 sale of 11 Madison Ave. to
the Canadian asset manager that made waves with its SL Green for $2.3 billion ($2.6 billion including lease-stipulated
purchase of Stuyvesant Town–Peter Cooper Village (with improvements), at a 4.6% cap rate (3.5% pro forma). At the
the Blackstone Group), also made headlines in 2015 with its time that price was the second-highest ever commanded by
joint acquisition (with Callahan Capital Properties) of 3 Bryant a New York office tower, surpassed only by the GM Building,
Park for $2.2 billion. Ivanhoé Cambridge is among a crowd of which traded for $2.8 billion in 2008. In June 2015, another
foreign buyers plowing capital into Manhattan CRE in search of example of soaring asset valuations in Midtown South was
longterm safety coupled with relatively healthy yields. the 50% interest sale of the Starrett-Lehigh Building, which
valued the building at 115% more than RXR paid for it in 2011
In May 2017, the Chinese conglomerate HNA purchased (the property was around 90% occupied at the time of both
245 Park Avenue for $2.21 billion ($1,236/SF) at a 4.6% cap transactions).
rate. Although, less than a year later, HNA is selling most of it’s
trophy assets and 245 Park Avenue is currently on the market. Pricing gains haven’t been as dramatic Downtown, due to
In August 2016, German insurer and asset manager Allianz relatively high vacancies in the Financial District and World
purchased a 44% partial interest in 10 Hudson Yards, with Trade Center submarkets, the age of its inventory, and the risk
the deal valuing the property at $2.15 billion ($1,250/SF). In associated with ongoing and planned construction. However,
May 2015, the Bank of China purchased 7 Bryant Park for valuations still have been boosted by properties being sold for
nearly $600 million ($1,260/SF). That same month, Anbang conversions. For instance, in August 2016 China Oceanwide
Insurance picked up 717 Fifth Ave. for $414 million ($1,170/ Holdings picked up the adjacent buildings at 80 South St. and
SF)—nearly triple its 2004 price. 163 Front St. for allocated prices of $3,200/SF and $4,500/
SF, respectively, intending to convert them into an 800,000
Perhaps most emblematic of the global rush to invest in SF development with both residential and commercial
Manhattan office space is the buying spree of Norges Bank, components.
manager of the $830 billion Norwegian pension fund and the
largest sovereign wealth fund in the world. In October 2014, Investors are still willing to pay up for Midtown assets. For
Norges purchased a 45% interest in 601 Lexington Ave. for example in 2016, CalPERS and CommonWealth Partners
close to $1 billion ($1,320/SF), at a pro forma cap rate of 3.8%. purchased the Equitable Building for $1.95 billion gross
In February 2015, Norges acquired a 45% stake in 11 Times ($1,143/SF) or $1.89 billion ($1,109/SF) net seller credits and
Square for $630 million ($1,260/SF). And then in December a 4.1% cap rate. The 1.7 million SF trophy asset was 98.4%
2015 it acquired a 44% stake in Trinity Church’s five million SF, leased at the time of sale.
11-building office portfolio in Hudson Square, for $1.56 billion
and a 3.3% cap rate. Sales Volume & Market Sale Price PSF
In one of the largest deals of 2016, RXR Realty acquired
1285 Avenue of the Americas for $1.65 billion, at a 4.7%
cap rate, with China Life Insurance Co. as a partner. With few
markets globally offering the safety and growth prospects of
the U.S. economy, and fallout from Britain’s Brexit vote further
incentivizing global asset allocators to deploy capital here
rather than in London, international investors are likely to keep
coming to New York.
Prices for many Midtown South properties are also well
above those of the last cycle’s peak. In March 2018, Google
purchased the 1.2 million SF Chelsea Market for almost $2.4
billion, well above the $800 million valuation Jamestown
Page 162Q18 Office
Sales
Sale Comparables Avg. Cap Rate Avg. Price/SF Avg. Vacancy at Sale
218 6.6% $362 15.3%
Sale Comparables Summary Statistics:
Sales Attributes Low Average Median High
Sale Price $45,000 $10,724,064 $1,500,000 $400,000,000
Price Per SF $2.95 $362 $469 $1,812
Cap Rate 3.0% 6.6% 5.8% 14.3%
Time Since Sale in Months 0.2 6.7 6.8 12.0
Property Attributes Low Average Median High
Building SF 400 29,880 3,802 1,134,086
Stories 1 3 2 36
Typical Floor SF 90 6,923 2,211 150,000
Vacancy Rate at Sale 0% 15.3% 0% 100%
Year Built 1901 1951 1935 2016
Page 172Q18 Office
Sales
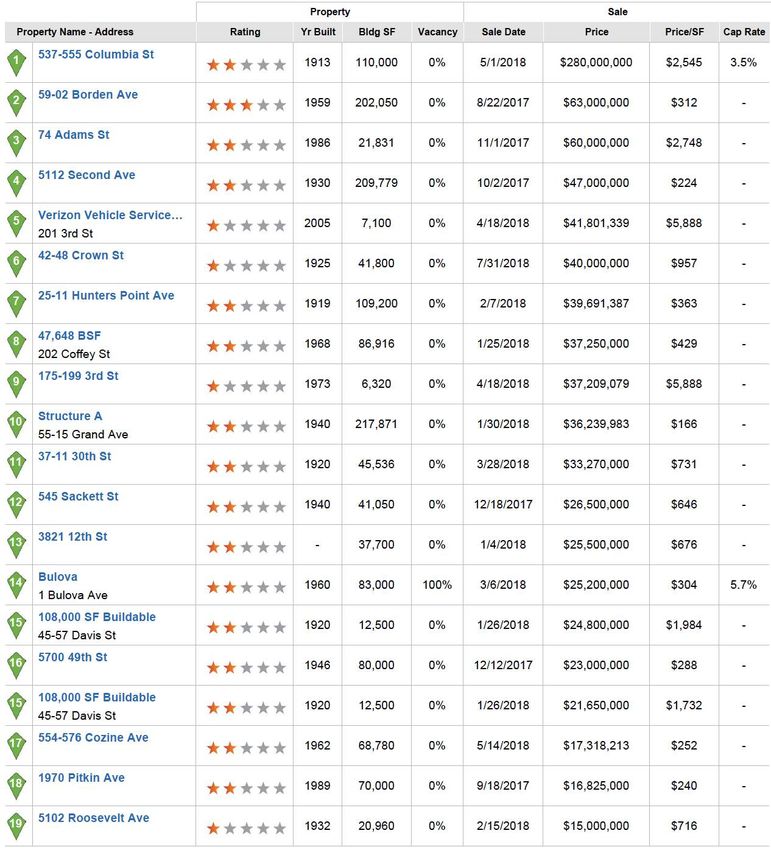
Recent Significant Sales
Page 182Q18 Office
Submarkets
Inventory Inventory 12 Month Deliveries Under Construction
No. Submarket Bldgs. SF (000) % Market Rank Bldgs. SF (000) Precent Rank Bldgs. SF(000) Percent Rank
1 Bronx 558 12,328 1.3% 21 1 51 0.4% 14 2 386 3.1% 10
2 Central Queens 286 4,824 0.5% 46 1 2 0% 25 1 111 2.3% 18
3 Chelsea 513 44,458 4.9% 5 2 253 0.6% 5 4 762 1.7% 7
4 Downtown Brooklyn 202 24,227 2.6% 11 4 348 1.4% 3 3 1,254 5.2% 5
5 Northeast Queens 714 11,255 1.2% 23 7 63 0.6% 11 3 338 3.0% 13
6 Northwest Queens 444 16,161 1.8% 15 2 193 1.2% 7 6 1,316 8.1% 4
7 South Brooklyn 1,045 18,284 2.0% 13 9 439 2.4% 2 9 276 1.5% 14
8 South Queens 400 6,405 0.7% 39 0 0 0% - 3 19 0.3% 28
9 Staten Island 913 6,864 0.7% 37 1 2 0% 26 4 755 11.0% 8
10 World Trade Center 48 38,560 4.2% 7 1 2,861 7.4% 1 0 - - -
Rent Gross Asking Rent 12 Month Asking Rent Annualized Quarterly Rent
No. Submarket Per SF Rank Growth Rank Growth Rank
1 Bronx $34.30 29 0% 24 -0.3% 40
2 Central Queens $39.15 26 -0.8% 61 -0.3% 38
3 Chelsea $64.75 11 -0.8% 58 0.5% 15
4 Downtown Brooklyn $48.87 20 -0.8% 57 0.9% 7
5 Northeast Queens $42.18 23 -0.9% 66 -0.7% 49
6 Northwest Queens $42.60 22 -0.2% 29 1.0% 5
7 South Brooklyn $35.26 28 -0.8% 63 -0.3% 37
8 South Queens $40.21 24 -0.7% 56 -1.0% 55
9 Staten Island $30.19 36 -0.3% 37 -0.7% 51
10 World Trade Center $61.77 14 -0.8% 60 0.5% 16
Vacancy & Net Absorp. Vacancy 12 Month Net Absorption
No. Submarket SF Percent Rank SF % of Inv. Rank Construct. Ratio
1 Bronx 723,631 5.9% 19 285,135 2.3% 12 0.2
2 Central Queens 229,785 4.8% 14 (130,901) -2.7% 59 -
3 Chelsea 2,848,104 6.4% 24 451,556 1.0% 8 0.4
4 Downtown Brooklyn 2,022,408 8.3% 38 131,491 0.5% 20 0.7
5 Northeast Queens 376,615 3.3% 6 58,995 0.5% 28 0.7
6 Northwest Queens 2,565,251 15.9% 65 (555,481) -3.4% 68 -
7 South Brooklyn 1,796,359 9.8% 46 478,695 2.6% 7 0.5
8 South Queens 366,137 5.7% 17 (41,716) -0.7% 55 -
9 Staten Island 292,241 4.3% 11 (18,658) -0.3% 53 -
10 World Trade Center 5,755,559 14.9% 62 1,632,197 4.2% 1 1.8
Page 19New York Retail Market 2Q18
2Q18                                                                                                       Retail

    Overview

        579M                             8.6M                                  2M                           5.9%
    Inventory SF               Under Construction SF                  12 Mo. Net Absorp. SF             Market Cap Rate
                           The Long Island office market
                           ended the 1st quarter 2015
                      3.8%                        $38.66
                           with an increased vacancy
                           rate of 8.4%. The vacancy rate
                                                                                          $405
                 Vacancy Rate                    Market Rent/SF                 Market Sale Price/SF
                           was 8.2% at the end of the 4th
                           quarter 2014, 8.0% at the end
                           of the 3rd quarter, and 7.7%
    The New York retail    at themarket’s recovery
                                  end of the         continues with vacancies expected to remain below their historical
                                               2nd quarter
    average over the coming years, though it is important to understand what retail means here. The data reflected in these
                           2014.
    rent, vacancy, and performance statistics is for buildings whose primary use is retail, not necessarily the ground-floor
    space in office towers. The market’s extremely healthy fundamentals shouldn’t be surprising given its unmatched density
    and concentration of wealth, both which have continued to grow as New York benefits from a reurbanization of the
    country’s population and a general lack of new construction thanks to local supply constraints. Construction has picked
    up, with several high-profile projects expected to deliver over the next few years, but even these large developments
    constitute only a small percentage of total stock, and preleasing has been strong despite observable weaknesses
    elsewhere. Vacancies and rental concessions have climbed in several of Manhattan’s prime retail corridors because
    tenants have been unable to justify the skyhigh asking rents. New York was the first market where investors swooped
    back in and bid pricing back up to prerecession levels. With much of the pricing recovery in the rearview mirror and
    cap rates among the lowest in the U.S., this isn’t a market for investors seeking to beat the national major-markets
    average in total returns. However, New York is still a strong choice for core investors given its relatively low vacancies,
    unparalleled density, liquidity, and history of above-average income growth.

Key Indicators:
                                                          Gross Asking   Availability   Net Absorption Deliveries       Under
Current Quarter                RBA        Vacancy Rate
                                                              Rent         Rate               SF          SF        Construction SF
Malls                       38,203,922        1.6%           $42.17         3.1%           (43,165)        0           2,069,000
Power Center                24,298,372        2.8%           $28.43         6.7%           85,468          0              0

Neighborhood Center         78,746,656        6.3%           $29.08         9.0%           56,477          0           347,615

Strip Center                15,720,944        5.8%           $26.16         7.6%            9,185          0           108,913

General Retail              419,216,952       3.5%           $41.22         5.5%           411,681      156,920        6,139,750
Other                        3,250,940        2.3%           $29.38         4.0%              0            0              0
Market                      579,437,786       3.8%           $38.65         5.9%           519,646      156,920        8,665,278

                                                             Page 21
2Q18 Retail
Leasing
Vacancies appear to have finally stabilized following a than 3.5 million SF of new supply on line. Still, this
slow but steady five year decline. With expectations is a mere drop in the bucket as a percentage of the
for strong income growth and limited supply growth market’s total retail inventory. Furthermore, American
as a percentage of overall inventory, New York should Dream Meadowlands has struggled to secure
maintain its position as one of the preeminent retail financing for over a decade, hitting roadblocks
markets in the country. A few large projects are on that could push off completion for several years.
the docket, the most notable being Northern New Extremely high population density and iron-fisted
Jersey’s American Dream Meadowlands project in zoning boards also help to keep supply growth and
East Rutherford and the retail component of Hudson vacancies well below the national major markets’
Yards. Cumulatively, these projects will bring more average here over the long term.
Net Absorption, Net Deliveries & Vacancy Vacancy Rate
Availability Rate
Page 222Q18 Retail
Rent
With rent growth slowing in some of the city’s premier rents bordering on exorbitant in many of these
retail corridors, up-and-coming neighborhoods Manhattan neighborhoods, retailers appear to be
appear ready to pick up some of the slack. After reaching a limit for what they are willing to pay. Even
a slow start to the recovery, metrowide rents finally in SoHo, where per-SF rent records have been set
picked up in 2013, led by some of New York’s repeatedly during this cycle, sporadic vacancies
most desirable shopping corridors. The Upper have appeared with increasing frequency, because
East Side, Times Square, and Chelsea—which tenants have been unable to justify rental expense
has become increasingly popular from both a as a percentage of sales. Even in quickly emerging
residential and commercial standpoint, providing a neighborhoods of Brooklyn, rent growth seems to
large pool of shoppers both during the week and have stalled after reaching new heights.
on weekends—all outperformed. But with asking
Market Rent Growth (YOY)
Market Rent Per Square Foot
Page 232Q18 Retail
Construction
Despite high-profile deliveries, supply risk is minimal in New aforementioned center on the corner of Malcolm X Boulevard.
York, both in the near term and beyond. The metro has by far Victoria Secret and Bath & Body Works have both signed
the highest population density in the U.S. Moreover, thanks leases to occupy a combined 36,000 SF.
to stingy zoning boards (even in New York’s suburbs) and the
lack of developable land, supply growth on a percentage basis Across the East River, Downtown Brooklyn is welcoming the
has ranked among the lowest of all major U.S. markets over 675,000 SF City Point, where Century 21 recently opened. The
the long term—a major advantage for investors. In fact, the project should do much to accommodate the relatively well-off
projects underway are a drop in the bucket for a market this apartment dwellers likely to fill the thousands of units expected
size, and most have significant preleasing. to deliver over the coming years. This particular project is
between two subway stations serving Downtown Brooklyn,
Westfield’s sprawling 365,000 SF World Trade Center and features Target and Trader Joe’s as tenants, as well as a
shopping complex, below Calatrava’s Oculus, opened in food hall featuring local purveyors—not uncommon for newly
August 2016 with around 60 stores and restaurants already built urban retail in New York. Williamsburg recently got its first
operating, and an additional 40 joined them by the holidays. Whole Foods Market, while Apple opened its new outpost at
Consumer demand should be robust, thanks to commuters the corner of Bedford and North Third. Prime retail corridors like
using the adjacent transit station and tourists flocking to the North Bedford Avenue have among the highest asking rents
area. Meanwhile, Lower Manhattan’s burgeoning residential outside of Manhattan. The wildcard for parts of Williamsburg
population isn’t likely to shy away from the center’s impressive and Bushwick is the looming 18-month shutdown of the L
roster of shops, which includes the city’s second Eataly. train for repairs, scheduled to begin in 2019. Some retailers
Neiman Marcus has chosen the Shops at Hudson Yards are already concerned that foot traffic will suffer dramatically.
for its only Manhattan location and will be joined by other In New Jersey, the American Dream—a two million SF mall/
luxury retailers, as well as by restaurants featuring some of entertainment center alongside MetLife Stadium—is back
the city’s best-known celebrity chefs. By the time the mall under construction. Despite significant preleasing, retailers’
opens, the first of the three large office towers at the mixed- success (or lack thereof) in this location remains to be seen.
use complex will be complete. The other two, as well as luxury Most New Yorkers will be unlikely to make the trek from the
condominiums and a hotel, expected shortly after, will provide city, while the depth of demand among tourists may fall short
a built-in consumer base as the Far West Side continues to of expectations.
develop. Also underway is Extell’s supertall Central Park Tower
project off of Columbus Circle, which is slated for delivery in
early 2019. The luxury condo building will feature a 100,000
SF Nordstrom at its base—another first for the city. Deliveries & Demolitions
Two sizable retail projects have recently delivered on the rapidly
transforming 125th Street in Harlem. A 161,000 SF center
outside of the 125 Street Station on the corner of Malcolm X
Boulevard was completed in late 2016. Although the project is
anchored by Burlington Coat Factory and Raymour & Flanigan,
perhaps more noteworthy is the addition of the first Whole
Foods Market in the area. Just four months later, the 101,000
SF 5 West 125 Street opened less than one block away.
Major retail tenants include TJ Maxx, Bed Bath & Beyond, and
New York & Company, though the building is also home to a
27,000 SF WeWork office. And more is underway: Rockfeld
Group will add an additional 97,000 SF directly adjacent to the
Page 242Q18 Retail
Construction
Properties Square Feet Inventory Preleased
75 2,988,302 0.5% 55.8%
Selection of Under Construction Properties:
Property Name/Address Rating Bldg. SF Stories Start Complete Developer/Owner
1 2655 Richomnd Ave. 418,000 - Jun-2015 Oct-2018 GGP, Inc.
2 Empire Outlets 350,000 1 Sep-2015 Nov-2018 BFC Partners LP
55 Richmond Ter.
3 1504 Coney Island Ave. 250,000 8 Jan-2016 May-2019 Triangle Management
SCG America/
4 3709 College Point Blvd. 225,000 2 May-2015 Oct-2018 Two Fulton Square LLC
5 Hyland Blvd. 224,391 2 Mar-2018 Oct-2019 Kimco Realty Corporation
Sun Equity Partners/
6 40-31 82nd St. 160,000 3 Jul-2017 Jun-2019 304 GC LLC
7 Retail Portion of The Cro. 100,000 3 May-2018 May-2020 BRP Development Corp.
93-01 Sutphin Blvd.
Page 252Q18 Retail
Sales
New York’s retail investment has slowed. Capital Demand for more traditional retail opportunities has
markets have been volatile, and national retail been quite strong among domestic buyers as well,
investment volume ultimately failed to reach the especially in established retail corridors, and with
highs of 2015. And although 16Q1 was the metro’s interest rates rising and risk tolerance diminishing,
strongest quarter on record since 2012, the year’s core retail assets will continue to attract investor
total sales volume was over a billion dollars short interest. The Vanbarton Group acquired the ground-
of 2015 levels. The number of total transactions floor retail unit at the Astor—a multifamily building on
fell, and pricing growth has stalled, three years the Upper West Side—for $103.5 million ($5,475/
after the metro surpassed prerecession highs. SF) in July 2016, and Invesco paid $112 million
Both volume and pricing may continue to benefit (an eye-popping $25,000/SF) for 139 Spring St. in
from international investors looking for access to SoHo, a property leased to luxury retailer Chanel.
the relative safety and strong growth prospects Just the year prior, Invesco paid $222 million
of New York real estate. Following several sizable for an 80% stake in neighboring 131 Spring St.
deals that included international buyers in 2015, While Invesco seems prepared to double down
the Qatari Investment Authority partnered to acquire on SoHo, Thor Equities seems ready to cash out
the retail condo at the base of 432 Park for $411.1 its portfolio there—Joe Sitt’s outfit sold at least
million ($3,750/SF). That said, 2017 continued the one SoHo property last year and is rumored to be
lackluster performance of 2016, with just a handful marketing several others in the submarket. Some
of deals valued at over $50 million. of the available assets are not fully leased, leading
to speculation that the investor has been unable to
Recent strength can also be attributed to find tenants willing to meet his lofty rent expectations
redevelopment opportunities. As 2015 came to and that the market is approaching, if not already
a close, the Related Companies purchased 427 past, its peak. With New York’s pricing premium to
10th Ave. for $152.3 million. The parcel was the the National Index easily exceeding prerecession
last piece the developer needed to get started on levels, it is hard to argue that prices can continue to
50 Hudson Yards, a 62-story office tower. In early grow at the pace of recent years.
2016, Tishman Speyer reached an agreement to
pay $170 million for a portion of the existing Macy’s Sales Volume & Market Sale Price Per SF
in Downtown Brooklyn, with plans to convert the
space to high-end office. A joint venture between
three Brooklynbased real estate firms purchased
a 36,000 SF storefront in Downtown Brooklyn for
$68 million ($1,889/SF) in May 2017. Based on
the property’s FAR the buyers may be able to build
over 750,000 SF on the site. If office construction
continues to pick up and the multifamily market
remains healthy, similar transactions are likely to
occur.
Page 262Q18 Retail
Sales
Sale Comparables Avg. Cap Rate Avg. Price/SF Avg. Vacancy at Sale
1,158 5.4% $450 4.2%
Sale Comparables Summary Statistics:
Sales Attributes Low Average Median High
Sale Price $25,418 $2,630,901 $1,376,000 $115,000,000
Price Per SF $19 $450 $438 $10,171
Cap Rate 2.3% 5.4% 5.3% 14.3%
Time Since Sale in Months 0.2 6.2 6.2 12.0
Property Attributes Low Average Median High
Building SF 135 6,860 3,300 250,000
Stories 1 2 2 8
Typical Floor SF 3 4,141 1,582 219,109
Vacancy Rate at Sale 0% 4.2% 0% 100%
Year Built 1848 1938 1931 2019
Page 272Q18 Retail
Sales
Recent Significant Sales
Page 282Q18 Retail
Submarkets
Inventory Inventory 12 Month Deliveries Under Construction
No. Submarket Bldgs. SF (000) % Market Rank Bldgs. SF (000) Precent Rank Bldgs. SF(000) Percent Rank
1 Bronx 3,803 31,937 5.5% 3 6 82 0.3% 12 8 54 0.2% 25
2 Central Queens 2,036 14,914 2.6% 10 2 11 0.1% 30 4 66 0.4% 21
3 Chelsea 493 5,678 1.0% 32 4 17 0.3% 26 4 234 4.1% 10
4 Downtown Brooklyn 520 6,796 1.2% 28 0 0 0% - 1 22 0.1% 30
5 Northeast Queens 3,046 23,344 4.0% 6 8 128 0.5% 4 14 417 1.8% 6
6 Northwest Queens 1,656 12,741 2.2% 15 3 57 0.4% 18 7 235 1.8% 9
7 South Brooklyn 7,427 40,988 7.1% 2 3 62 0.2% 17 9 471 1.1% 5
8 South Queens 2,928 19,099 3.3% 8 2 18 0.1% 24 8 279 1.5% 8
9 Staten Island 2,436 17,632 3.0% 9 4 65 0.4% 15 9 1,105 6.3% 3
10 World Trade Center 16 886 0.2% 63 0 0 9% - 0 - - -
Rent Gross Asking Rent 12 Month Asking Rent Annualized Quarterly Rent
No. Submarket Per SF Rank Growth Rank Growth Rank
1 Bronx $41.30 27 -2.0% 53 -1.5% 18
2 Central Queens $45.27 23 -2.1% 59 -1.4% 14
3 Chelsea $87.93 13 -2.0% 51 -1.8% 33
4 Downtown Brooklyn $77.26 18 -2.0% 49 -1.9% 41
5 Northeast Queens $45.82 22 -1.9% 44 -1.6% 27
6 Northwest Queens $43.49 25 -2.1% 57 -1.5% 20
7 South Brooklyn $41.70 26 -2.0% 46 -1.2% 7
8 South Queens $37.28 30 -1.9% 42 -1.5% 21
9 Staten Island $31.84 39 -1.6% 25 -1.3% 11
10 World Trade Center $77.82 17 -2.1% 61 -3.0% 61
Vacancy & Net Absorp. Vacancy 12 Month Net Absorption
No. Submarket SF Percent Rank SF % of Inv. Rank Construct. Ratio
1 Bronx 1,341,807 4.2% 40 234,694 0.7% 5 0.3
2 Central Queens 442,721 3.0% 21 (105,642) -0.7% 65 -
3 Chelsea 250,349 4.4% 47 24,504 0.4% 30 0.6
4 Downtown Brooklyn 306,568 4.5% 50 (93,135) -1.4% 64 -
5 Northeast Queens 646,334 2.8% 18 (58,458) -0.3% 59 -
6 Northwest Queens 448,834 3.5% 28 (119,887) -0.9% 66 -
7 South Brooklyn 1,069,852 2.6% 12 (70,548) -0.2% 60 -
8 South Queens 826,060 4.3% 45 (48,763) -0.3% 58 -
9 Staten Island 608,851 3.5% 27 (83,740) -0.5% 63 -
10 World Trade Center 29,296 3.3% 23 1,487 0.2% 40 -
Page 29You can also read