How Users Drive Value in Two-sided Markets: Platform Designs That Matter - MIT Initiative ...
←
→
Page content transcription
If your browser does not render page correctly, please read the page content below
How Users Drive Value in Two-sided Markets:
                Platform Designs That Matter

         Zhou Zhou⇤ Lingling Zhang† Marshall Van Alstyne‡

                                  June 3, 2021

                                      Abstract
    One of the deepest platform challenges is understanding how users create net-
    work value for each other and which investments provide leverage. Is more
    value created by advertising to attract users, discounting to subsidize users,
    or investing in architecture to connect and retain users? Having grown a user
    network, which promotes “winner-take-all” dominance, why do platforms with
    large user bases fail? To address these challenges, we build a theoretical and
    empirical model to simultaneously measure within and across period network
    e↵ects for two-sided markets. This yields three main results. First, we extend
    the customer lifetime value (CLV) literature to network markets, allowing us
    to measure how di↵erent interventions drive CLV on both sides of two-sided
    markets. Second, we apply our model to the case of Groupon and empirically
    estimate the strength of within period and across period attraction. We find
    significant within period attraction between merchants and consumers that
    does not persist through time. This o↵ers one explanation for the puzzle that
    even strong network e↵ects might not yield market dominance. Third, we find
    that users attract users more strongly in experience than search goods mar-
    kets, as user input drives CLV more than price does. Together these results
    provide numerous points of leverage for understanding and boosting CLV in
    order to increase platform value.
⇤
  Boston University. Email: zhouzhou@bu.edu.
†
  University of Maryland. Email: lzhang28@umd.edu.
‡
  Boston University. Email: mva@bu.edu.

                                          1
1 Introduction
If the world’s first trillion-dollar businesses are platforms based on network e↵ects
(Cusumano et al., 2020), why might firms with strong networks falter? Stronger
network e↵ects drive platforms toward greater market dominance (Katz and Shapiro,
1985, 1986; Shapiro and Varian, 1998; Schilling, 1999; Park, 2004; Dubé et al., 2010).
This encourages platforms to invest in user growth, hoping that jump-starting a user
base leads to self-propagating growth. Empirically, however, platforms with large
user bases have both succeeded and failed (McIntyre and Srinivasan, 2017; Hagiu
and Rothman, 2016). Firms such as Apple, Amazon, Google, and Facebook have
grown large user bases, and with high margins and market shares, their valuations
have followed. On the other hand, platforms such as Uber, DiDi, Lending Club,
and Groupon have grown large user bases yet their valuations have fallen. Venture
capitalists have subsidized such firms, despite an absence of profits, under the belief
that investing in user growth until network e↵ects achieve critical mass can lead
to market dominance. Success simply takes patient capital. Central questions for
both platform investors and managers are: When is a large user base insufficient
for a “winner-take-all” market, and which user investments create the most value?
Answering these questions informs both investment and strategy.
Focusing on platforms, this research explores the role network e↵ects play in
creating long term customer value. Current models of customer lifetime value (CLV),
however, omit network e↵ects (Gupta et al., 2004; Pfeifer and Farris, 2004; Zhang
et al., 2012; McCarthy and Fader, 2018), missing the positive externalities they
create for each other. Standard models of network e↵ects are static (Rochet and
2Tirole, 2003; Parker and Van Alstyne, 2005; Armstrong, 2006), missing the chain
of value creation over time. The main contribution of this research is to build a
dynamic within and across period model of two-sided network e↵ects, from which
we develop a two-sided model of customer lifetime value, CLV2. We validate this
empirically, then show how it applies across di↵erent users, goods, and locations. Our
theoretical question is how to properly measure network e↵ects over time in order
to understand CLV2. Using this model, our empirical question is to measure the
strength of attraction in a two-sided market, accounting for time and transacting
across various goods and services. Our point of leverage is to use time, within
and across periods, to see if we can observe attraction, spillovers, and stickiness.
Observing these factors, we also identify precursors that moderate CLV2. Answers
thus provide not only investment advice but also insight into odd market behaviors
such as low market values despite strong network e↵ects. In the case of Groupon, for
example, we find significant cross-side attraction but not stickiness suggesting that
better platform design and investment strategies are warranted.
We take “network e↵ect” to mean that a product or service has the property
of rising in value as more parties consume it (Katz and Shapiro, 1985; Liebowitz
and Margolis, 1994; Shapiro and Varian, 1998). This rise in value naturally attracts
consumers whose usage then naturally creates value. Interaction of these properties
creates the flywheel investors hope lead to market dominance. This conventional
definition of a network e↵ect, however, has several nuances worth clarifying. One is
that how users create value can be intentional or unintentional (Parker et al., 2016).
The explicit case is represented by reviews, user generated content, and users actively
3linking to other users. The implicit case arises when machine learning algorithms
observe users’ behavior and improve the experience of other users or o↵er value
adding recommendations. The latter requires no intentional act to create value for
other users. Network e↵ects can also exhibit strength or weakness based on whether
they are local or non-local (Sundararajan, 2008; Parker et al., 2016). Rideshare,
home services, and food delivery, for example, give rise to stronger local than non-
local attraction as it makes no sense to match a rider in New York to a driver in Paris.
By contrast, e-commerce, operating systems, and social networks have stronger non-
local network e↵ects because a match need not be location specific.
Further, network e↵ects can be classified based on whether they are “same-side”
versus “cross-side” (Eisenmann et al., 2006; Rochet and Tirole, 2006) meaning that
the e↵ect operates within group or across groups respectively.1 In our context, a
same-side network e↵ect is represented by the value that consumers create for other
consumers or the value that merchants create for other merchants. A cross-side
e↵ect is represented by the value that consumers create for merchants and vice versa.
Thus a two-sided market can exhibit up to four network e↵ects – two same-side and
two cross-side – with no requirement that these necessarily exist or have equivalent
strengths. For example, competition among online merchants or among rideshare
drivers could eliminate positive spillovers and attraction among them. Adding the
time dimension, representing within and across periods, doubles this count to eight
possible factors. We will find it convenient to simplify this complexity in the analysis
that follows.
1
Certain literature also uses the terms “direct” and “indirect” for same-side and cross-side
network e↵ects respectively (Clements, 2004; Church et al., 2008).
4To give precision to these eight factors, we introduce the following conventions.
Let “IJt ” designate network attraction from the class of user i to the class of user j
with the subscript representing time from t to the present. Thus, CM0 represents a
cross-side network attraction from consumers to merchants within the current period
and CC 1 represents a same-side network attraction from consumers to consumers
from the prior period to the present. This also generalizes. We can use SS0 to
represent a Same-Side within period network e↵ect for both consumers CC0 and
merchants M M0 or use CS 1 to represent a Cross-Side network e↵ect from prior
period for both consumers to merchants CM 1 and vice versa M C 1 collectively. We
summarize nomenclature in Table 1, which also illustrates how attraction occurs.
Table 1: Di↵erent Dimensions of Network E↵ects
Within-period Across Period
Same-side Within-period same-side network e↵ect (SS0 : CC0 , M M0 ) Inter-temporal same-side e↵ect (SS 1 : CC 1 , M M 1 )
E.g., Gamers interacting with gamers E.g., Customers learning from prior customer reviews
Cross-side Within-period cross-side network e↵ect (CS0 : CM0 , M C0 ) Inter-temporal cross-side e↵ect (CS 1 : CM 1 , M C 1 )
E.g., Customers transacting with current period merchants E.g., Merchants learning from prior customer reviews
Measuring network e↵ects faces special challenges due to the well-known “re-
flection problem” (Manski, 1993, 1999; Rysman, 2019) and represents one reason
empirical research is underdeveloped (Jullien et al., 2021). The adoption choice of
an individual depends on the adoption choice by the group yet the group’s choice de-
pends on the collective choices of the individuals that comprise it. This simultaneity
of decisions has led much of the theoretical literature to embrace fulfilled expectations
equilibria where group members correctly anticipate the behavior of other members
(Katz and Shapiro, 1985; Cabral, 1990; Krugman, 1991; Economides, 1996). The
fact that internal expectations within period are not externally observable confounds
5empirical measurement because even use of instruments treats all members of that
group the same. Much of this work, however, predates development of two-sided
network models (Parker and Van Alstyne, 2000; Rochet and Tirole, 2003; Caillaud
and Jullien, 2003) that allow choices of one group to depend on those of a matched
but di↵erent group. We therefore follow Rysman (2019) and identify instrumental
variables that treat only one side of our two-sided network. Further, by introduc-
ing the time dimension, choices within group may depend on group choice in the
prior period, which is externally verifiable (Zhang et al., 2012; Chu and Manchanda,
2016).2 Careful measurement thus motivates our focus on same-side prior-period
network e↵ects and on cross-side within-period network e↵ects. Using our notation,
these are SS 1 and CS0 respectively. This focus not only reduces complexity but
also avoids the reflection problem.
Di↵erent factors modulate product attraction. User generated content (UGC),
for example, is more valuable for products with higher uncertainty (Li et al., 2011).
Prior sales information also has a greater impact on a customer’s choice of an experi-
ence good than of a search good (Li and Wu, 2018). In the same vein, we hypothesize
that same-side attraction for experience goods is stronger than that for search goods
based on peer to peer learning e↵ects (Hagiu and Wright, 2020). Greater information
asymmetry renders accumulated information more valuable for goods that must be
tried in order to know their value than for goods whose price is the deciding factor.
Distance might also matter (Sundararajan, 2008). Since Groupon customers trans-
2
Another way to resolve the reflection problem is to shrink the time interval of the observation
window. This can shift observation of a specific behavior from the current to a prior period, avoiding
a simultaneous choice. We thank an anonymous referee for this insight, which also motivates a focus
on SS 1 rather than SS0 .
6act with Groupon merchants in their local markets, we expect local network e↵ects
to prove stronger than non-local network e↵ects. Using our model of inter-temporal
attraction, we explore both factors and find that both matter. Among customers,
same side attraction CC 1 is estimated to be positive and significant for experience
goods but insignificant for search goods. For both experience and search goods, how-
ever, the cross side e↵ect of merchants on customers M C0 is estimated to be positive
and significant. Among merchants, same side M M 1 and cross side CM0 e↵ects are
estimated to be positive and significant for both experience goods and search goods,
but M M 1 for experience goods is approximately 2.5 times as large as that for search
goods while CM0 is qualitatively similar across these categories.
Using model coefficients, we can also account for two-sided market spillovers and
explore marketing and information systems interventions to boost customer and mer-
chant lifetime value CLV2 and MLV2. For example, does CLV2 rise more based on
adding another customer, another merchant, increasing consumption, or increasing
retention? Marketing interventions might add same or cross side market participants.
Information systems interventions might capture and present user data or use data
to boost stickiness. Interestingly, in the extreme where same side e↵ects SS 1 are
absent on the platform, strong cross-side e↵ects CS0 only create value in one period,
and CLV2 is equal to the value created in the current period. However, when SS 1
is significant and positve, users continue creating value in future periods.
In practical terms, these tools allow investment analysis of di↵erent options such
as methods to enhance user participation (Huang et al., 2019; Chen et al., 2019) or to
alter user behaviors that drive di↵erences in platform value (McIntyre and Srinivasan,
72017). Amazon was among the first platforms to invest in recommender systems and
UGC to make their undi↵erentiated books more valuable (Dellarocas, 2003). Using
information systems data to present consumers with their own “best value” ranking
can drive adoption (Ghose et al., 2012). In SAP’s enterprise software ecosystem,
independent software vendors (ISVs) compete for contracts and initially hid their
expertise from one another. The launch of SAP’s developer network, however, re-
warded partners for sharing ideas and answering each other’s questions in a public
forum, which also boosted adoption and retention. ISVs have increased each other’s
sales, and thus customer value, at statistically significant levels (Ceccagnoli et al.,
2012). Airbnb’s host forum, likewise, helps hosts solve problems, deal with unruly
guests, and share tips for improved ratings (Hardy and Dolnicar, 2017). Platforms
can also design information systems to simplify user adoption and avoid disinterme-
diation (Zhu and Iansiti, 2012; Halaburda et al., 2016). For example, platforms can
schedule bookings, process payments, and handle logistics to drive platform adop-
tion and retention. As platform users and merchants become stickier due to these
value-added services, customer and merchant lifetime value increase, such that user
(and/or merchant) acquisition strategies become cost-e↵ective. Parameter estimates
for strengths of these relationships help target investments.
This research o↵ers theoretical and practical insights. First, we develop a model
of inter-temporal network e↵ects and within-period network e↵ects to complement
the static models of two-sided markets in extant literature. Strong within-period
attraction does not necessarily imply strong inter-temporal attraction across periods.
When the inter-temporal network e↵ect is weak, the within-period network e↵ect
8may not persist, and a user growth strategy is not e↵ective. Given this model, we
further propose a framework to estimate the customer and merchant lifetime values,
CLV2 and MLV2, in two-sided markets. Existing CLV models do not capture the
value created through network e↵ects and underestimate that of platforms such as
Amazon and eBay (Gupta and Mela, 2008; Zhang et al., 2012). Our innovation
extends this literature to a pair of joint calculations accounting for spillovers across
time and across sides of two-sided markets. To the best of our knowledge, this is the
first study that proposes a theory-driven customer and merchant value calculation
that can be adopted easily by practice.
Second, this paper empirically distinguishes and estimates di↵erent network ef-
fects based on time, location, and type of good. In our context, the inter-temporal
network e↵ect is weak overall, yielding poor user stickiness. A user growth strategy
is less e↵ective for such platforms. All else equal, CLV 2 and M LV 2 are higher in
markets with higher same side inter-temporal attraction SS 1 . For markets with
weak SS 1 , we show that platform design interventions that enhance stickiness and
spillovers can increase lifetime value, whereby acquisition strategies through mar-
keting interventions become cost-e↵ective. Overall, these findings remind platform
managers not to overemphasize user growth when user or merchant stickiness and
spillovers are poor and, instead, to focus on platform designs that enhance stickiness
and spillovers as well as attraction.
Our paper proceeds as follows. Section 2 reviews related literature. Section 3
introduces our theoretical and empirical models. Section 4 then describes our data
set and identification strategies. We present empirical findings in Section 5. Follow-
9ing coefficient estimation, Section 6 analyses strategic responses when a platform’s
user stickiness is poor. Section 7 o↵ers commentary on limitations and directions for
future research. Finally, Section 8 concludes with managerial and investor implica-
tions, and highlights research contributions.
2 Related Literature
Our research builds on contributions from four research streams including two-sided
markets, market dynamics, customer lifetime value, and platform design. Research
extensions and contrasts for each stream appear below.
2.1 Static Models of Two-sided Markets
Static models have developed to study the price structure of two-sided markets, how
they lead to free goods markets, and which side merits a subsidy (Rochet and Ti-
role, 2003; Caillaud and Jullien, 2003; Parker and Van Alstyne, 2005; Armstrong,
2006). These theoretical models highlight how one side of a market attracts the
other side, requiring use of a coordination mechanism, such as free pricing or a price
stimulus to one side, in order to get both sides on board. Empirical works in this
context have focused on estimating network e↵ect size and discussing implications
for platform competition (Rysman, 2004). Due to the intrinsicly dynamic nature
of platform growth, however, static models are insufficient for understanding time
dependent aspects of user adoption on a platform’s net present value. Our paper
extends the static two-sided market framework by adding time. Although the per-
10sistence of network e↵ects plays a critical role in platforms’ user growth strategies,
little empirical work has investigated their inter-temporal durability (McIntyre and
Srinivasan, 2017). Considering market entry, Biglaiser et al. (2019) discuss how in-
cumbents maintain a profit advantage via network e↵ects even as entrants match
or exceed price and quality. In this research, we control for factors such as plat-
form quality, the presence of a competitor, and how users themselves contribute to
persistent network e↵ects.
2.2 Dynamic Models of Network E↵ect Markets
Network e↵ects have attracted a long-standing interest in market coordination and
evolution. The adoption decision is often modeled as a function of users’ expecta-
tions of network size (Katz and Shapiro, 1994; Shapiro and Varian, 1998; Cabral,
2011; Krugman, 1991; Farrell and Klemperer, 2007). Empirical contributions in this
domain have estimated the magnitude of di↵erent cross-side network e↵ects. For ex-
ample, Chu and Manchanda (2016) quantified the extent to which current consumers
attract future suppliers (and vice versa) in online retail. Zhang et al. (2012) exam-
ined how UGC contributors created value for UGC consumers. Importantly, these
models use only lagged prior period terms, and not within period terms, omitting
measures of current period attraction. We include current period attraction and use
an instrumental variables approach to address the reflection problem.
Li et al. (2020) further studied user growth across multiple categories of goods
and across di↵erent time periods in a two-sided market. Insights from these studies
show how to optimize investments in user growth conditional on the e↵ectiveness of
11di↵erent cross-side network e↵ects.
The assumption that cross-side network e↵ects depend on user beliefs of network
size is reasonable when user switching costs are high. Platform research has shown
that switching cost is an important determinant of user value (Farrell and Klemperer,
2007; Metcalfe, 2013; Katz and Shapiro, 1985). At present, however, user switching
costs are low on many digital platforms. In search, rideshare, group-buying, and
e-commerce, for example, users can easily observe competing platform o↵ers and
switch without lock-in. The possibility of platform switching can dissipate rents and
intensify competition (Rysman, 2009). A large supplier base in one period does not
necessarily guarantee consumer adoption in the next period. Cross-side attraction in
existing papers, often cast as an inter-temporal e↵ect (Chu and Manchanda, 2016),
corresponds to the mixture of SS 1 and CS0 in our model. Since di↵erent types
of user e↵ects correspond to di↵erent mechanisms and imply a need for di↵erent
platform strategies, we distinguish them and estimate them separately. Our model
shows that platform user stickiness plays a critical role: when user stickiness is poor,
no user growth strategies can generate high returns on investment (ROI) because the
network is just a “leaky bucket.” In contrast to conventional wisdom, investing in
either side or in di↵erent categories of goods might not be cost e↵ective. Rather, we
suggest that a platform should improve its design so as to enhance user stickiness.
Our user-value strategy is particularly relevant when switching costs are low, as is
the case for many digital platforms.
122.3 Network E↵ect Design
The importance of network e↵ects is such that they imply changes in the structure of
the firm. Parker et al. (2017) show that product firms transition to platform firms as
the strength of network e↵ects increase. Because network e↵ects scale faster among
external users than among internal employees, the firm “inverts” in the sense that
value creation shifts from inside to outside. Network e↵ects, however, are not simply
exogenous environmental factors but might instead be the consequence of conscious
design (Schrage, 2012).
Platforms can enhance network e↵ects through investments in connecting users
to one another, enabling file sharing, creating complements, and hacking compat-
ibility (McIntyre and Subramaniam, 2009). Piggybacking on social media to pro-
mote word-of-mouth (WOM) can generate social influence. Capturing and present-
ing user-generated-content (UGC) builds engagement. Extant research has shown
that reviews, ratings, and other UGC a↵ect the attractiveness of a platform over
time (Dellarocas, 2003; Forman et al., 2008; Li et al., 2011). Several recent stud-
ies also model network e↵ects as a learning mechanism because UGC sheds light on
product/service quality, which reduces uncertainty as customers make their purchase
decisions (Hagiu and Wright, 2018; Wu et al., 2015). Firms also give away reference
designs and system developer toolkits (Boudreau, 2010), or open application pro-
gramming interfaces (Benzell et al., 2017). These design choices attract developers
who improve platform quality, which attracts users, creating platform value (Tellis
et al., 2009; Zhu and Iansiti, 2012). Of particular importance for our paper, network
size alone might not be the best predictor of value, which might instead depend more
13on network density or topology (Suarez, 2005).
Complementing these works, our paper proposes a framework to manage user
stickiness modeled as di↵erent categories of same-side and cross-side network ties
. We show that investments in network designs can make current users more valu-
able for future users, magnifying each user’s lifetime value, and raising the value
of the platform. This is consistent with investing for the purpose of “making cus-
tomers better to make better customers” (Schrage, 2012). As a further illustration,
Airbnb trained hosts to take more attractive photos of their homes, which increased
guest bookings, which inn turn increased guest listings. Network e↵ects need not be
assumed, they may be designed.
2.4 Customer Lifetime Value
An important stream of research that is closely related to firm value is the concept
of CLV in marketing (Gupta et al., 2004; McCarthy and Fader, 2018). This line of
research emphasizes user stickiness and explicitly incorporates user retention in CLV
calculation (Gupta et al., 2004; Pfeifer and Farris, 2004; Gupta, 2005). However,
extant literature is largely restricted to businesses without network externalities.
Despite its popularity, the extant CLV calculation is insufficient to estimate the
true value of users on digital platforms. One primary objective of our research is
to explicitly model how network externalities create value across groups and across
time. We thus extend the CLV framework to two-sided markets. Furthermore,
extant CLV research does not distinguish how di↵erent factors contribute to user
value. Following Zhang et al. (2012) and Li et al. (2020), we control for factors such
14as platform quality and focus on analyzing how di↵erent types of network e↵ects
a↵ect value creation.
Our study is distinct from extant studies that also addressed network e↵ects
(Tucker and Zhang, 2011; Chu and Manchanda, 2016; Li et al., 2020). Whereas those
studies focus on choosing a preferred investment side or within versus cross-category
investment, our research explicitly provides a framework that not only quantifies
CLV2 for both sides in a two-sided markets but also sheds light on the relative
contributions of network e↵ects and net margin in boosting user value. This makes a
comparison of advertising, discounting, and architectural design investments feasible.
3 Modeling Approach
This section presents our model specification. First, we explain how di↵erent types of
network e↵ects influence the dynamics of two-sided markets and specify an aggregate-
data discrete-choice model to study users’ participation choices (Berry et al., 1995).
Second, based on the estimates of network e↵ect sizes, we develop a model to calculate
consumer and merchant lifetime values, CLV 2 and M LV 2 , in two-sided markets.
We discuss platform heterogeneity and demonstrate how the strength of SS 1 a↵ects
the e↵ectiveness of the user growth strategy.
3.1 Demand Dynamics in Two-sided Markets
Built upon the static model of Parker and Van Alstyne (2005) and the dynamic
model of Chu and Manchanda (2016), we incorporate the time dimension and study
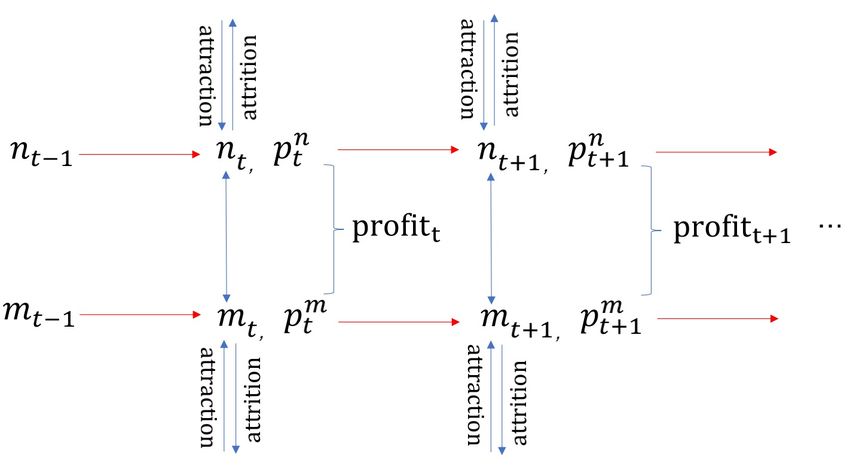
15demand dynamics in two-sided markets. Figure 1 describes the demand evolution on
the two sides of a online market, which allows consumers (merchants) in the pervious
period to influence consumers (merchants) in the current period. To illustrate market
evolution, consider a shock to consumer base at t 1 and its dynamic e↵ect, as shown
in Figure 1. First, the shock to consumer base at t 1 a↵ects the consumer base at
t via SS 1 . Second, an increase in the current consumer base would lead to growth
in the current merchant base via the CS0 . The prices and sizes of each user group
combinedly determine the profit during each period in the dynamic system. Here
nt , mt , pnt , pm
t correspond to the consumer base, merchant base, price for consumers,
and price for merchants, respectively, in period t. The same logic applies to a shock to
the merchant base. Next, we present how these di↵erent network e↵ects are modeled
empirically. For exposition, we refer to the two sides as the “consumer side” and the
“merchant side”, although our modeling framework can be applied to a two-sided
market beyond the retailing setting.
3.1.1 Consumer Side
On the consumer side, several factors jointly determine the utility that a represen-
tative buyer i derives from using the platform in market j week t. First, the utility
is related to the platform’s attractiveness, which is further decomposed into four
components: (1) consumer i0 s intrinsic preference for the focal platform ↵jn (in sub-
sequent analysis, superscript ‘n’ denotes the consumer side), which is assumed to
be varying by market but constant over time; (2) the number of consumers in the
previous period nj,t 1 , to capture CC 1 that is attributable to word-of-mouth and
16Figure 1: Each period shows dynamic participation of consumers (nt ) and merchants
(mt ). Link nt 1 ! nt represents CC 1 while link nt ! mt represents CM0 . Links
anchored at mt 1 and mt are symmetric in network e↵ects M M 1 and M C0 respectively.
UGC; (3) the number of merchants mjt , to capture M C0 that is due to the amount
of supply;3 and (4) average price pjt and other product characteristics Xjt . Further-
more, the utility depends on (i) the attractiveness of the rival platform Rjt (Rochet
and Tirole, 2003; Armstrong, 2006), which includes rivals’ user base in market j at t,
ii) the macro-economic trends of the industry and seasonalities that are common to
all markets and unobserved to researchers Ttn , (iii) the unobserved market and time
n
specific shocks to the demand ⇠jt , and (iv) the idiosyncratic error "nijt . Formally, the
net indirect utility is specified as follows:
n
Uijt = f (↵jn , nj,t 1 , mjt , pjt , Xjt )f (Rjt )f (Ttn , ⇠jt
n n
, ✏ijt ). (1)
3
The lags of merchant base are excluded from Equation 2 because we model a setting with
trivial switching cost. In such a context, consumers make decisions after observing current supply
on competing platforms, and thus, they do not need to form expectations about current supply
based on past supply.
17We assume that the utility takes the Cobb-Douglas form (Chu and Manchanda,
2016) and rewrite the indirect net utility as:
unijt = ↵jn + 1 ln nj,t 1 + 1 ln mjt + ⇢1 ln pjt + ⌘1 Xjt
(2)
n n
+ ✓1 ln Rjt + 1 Tt + ⇠jt + "nijt .
The inter-temporal and within-period network e↵ect parameters are our pri-
n
mary interest in Equation 2. There are also market-specific demand shocks ⇠jt that
make the platform more or less attractive across di↵erent markets over time. These
shocks are observed by platforms and users but unobserved to researchers, causing
an endogeneity concern. All other factors are absorbed in the idiosyncratic errors
"nijt .
We now denote the utility as unijt = n
jt + "nijt and normalize the utility of the
outside option as zero, which corresponds to consumers choosing the rivals or not
participating in the market. Assuming that "nijt follows independent and identically
distributed (i.i.d.) Type-I extreme value distribution, we derive the market share of
the focal platform as:
n
e jt
snjt = n . (3)
1+e jt
Thus, the platform’s relative market share is:
snjt njt /Njt
ln n = ln
s0jt Njt njt /Njt
= ↵jn + ln nj,t + ln mjt + ⇢1 ln pjt + ⌘1 Xjt (4)
1 1 1
n n
+ ✓1 ln Rjt + 1 Tt + ⇠jt ,
18where sn0jt is the market share of the outside option and Njt is the market size for
buyers in market j time t. Estimating the parameters of interest based on Equation
4 poses challenges due to endogeneity and market heterogeneity. We discuss our
identification strategy in detail in Section 6.
3.1.2 Merchant Side
The utility specification for the merchants is similar to that of the consumer side.
For a representative merchant (seller) l in market j at time t, its utility of working
with the platform is related to the following factors: (1) merchants l0 s preference for
the focal platform ↵jm (in subsequent analysis, superscript ‘m’ denotes the merchant
side), which is assumed to be varying by market but constant over time; (2) the
number of existing merchants mj,t 1 to capture M M 1 ; (3) the number of current
consumers njt to capture CM0 ; (4) product price Pljt ; and (5) whether the merchant
has experiences with the platform Xljt , which captures the switching cost on the
platform.
Note that the merchant base in the past, the M M 1 , can a↵ect the participation
decision for a current merchant for several reasons. Existing merchants could create a
word-of-mouth e↵ect, which helps the platform to attract new merchants. Too many
merchants, however, could increase competition and deter future entry, causing a
negative same-side network e↵ect. Thus, the M M 1 on the merchant side could be
positive or negative, depending on which e↵ect dominates. The CM0 from consumers
to merchants is expected to be positive, because more consumers would bring higher
19sales and profits, increasing the attractiveness of the platform to merchants 4 . For
specific platforms such as Groupon, the consumer base helps increase the consumer
reach and awareness for the merchant’s brand, creating a marketing e↵ect (Dholakia,
2011; Edelman et al., 2016). Nevertheless, the CM0 term in our model captures the
cross-side e↵ect of consumers on both the current profits and future profits.
The merchant’s utility further depends on (i) the attractiveness of the rival
platform Rjt , (ii) the macro-economic trends of the industry that are common to
all markets and unobserved to researchers Ttm , (iii) the unobserved market and time
m
specific shocks to the demand ⇠jt , and (iv) the idiosyncratic error "m
ljt . Formally, the
net indirect utility for a merchant is specified as follows:
um m
ljt = ↵j + 2 ln mj,t 1 + 2 ln njt + ⇢2 ln pljt + ⌘2 Xljt
(5)
m m
+ ✓2 ln Rjt + 2 Tt + ⇠jt + "m
ljt .
Following a similar step as for the consumer side, we denote the utility as um
ljt =
m m
jt +"ljt and normalize the utility of outside option as zero. Assuming that "m
ijt is i.i.d.
Type-I extreme value distributed, we derive the relative market share of merchants
choosing the platform as follows:
sm
jt mjt /Mjt
ln m = ln
s0jt Mjt mjt /Mjt
= ↵jm + ln mj,t + ln njt + ⇢2 ln pjt + ⌘2 Xjt (6)
2 1 2
m m
+ ✓2 ln Rjt + 2 Tt + ⇠jt ,
4
Following Li et al. (2017), the lags of the consumer base are excluded from Equation 5 because
merchants have correct expectations about future demand.
20where sm
0jt is the market share for merchants choosing the outside option and Mjt
is the market size for potential merchants. Variables pjt and Xjt are the average
deal price and characteristics in market j week t. Our estimation and identification
strategy is discussed in Section 6.
Table 2 provides a summary of all variable and parameter definitions used in
our model.
Table 2: Variable and Parameter Definitions
Notation Definition Notation Definition
n consumer base 1, 2 CC 1 , M M 1
m merchant base 1, 2 M C0 , CM0
N consumer market size ↵j , ↵jm
n
user preference
M merchant market size snjt , sm
jt market share
R rival user base and price ✓1 , ✓2 competitive e↵ect
p price ⇢1 , ⇢2 price elasticity
X product features ⌘1 , ⌘ 2 product attractiveness
T industry-level common trend 1, 2 time e↵ects
n m
⇠jt , ⇠jt unobserved shocks
3.2 Customer Lifetime Value in Two-sided Markets
In their classic work, Gupta et al. (2004) define the CLV as the expected sum of
discounted future earnings generated by a customer. Following their definition, we
develop a model to estimate the CLV 2. Take the consumer’s CLV 2 as an example.
We assume a one-unit increase in the consumer base and quantify the increase of
user bases on both sides of the market. To compute the CLV 2, we transform the
estimated elasticity of the market share into a marginal e↵ect of the user base using
21the standard relationship: Y / X = Ȳ /X̄ ⇥ ln Y / ln X ⇥ (1 s̄Y ), where sY is the
average market share of Y (Berry et al., 1995; Trusov et al., 2009). Thus, the marginal
e↵ects of inter-temporal user attraction are ˜1 = 1 ⇥ (1 s̄n ) and ˜2 = 2 ⇥ (1 s̄m ),
n̄
and the marginal e↵ects of within-period user attraction are ˜1 = m̄
⇥ 1 ⇥ (1 s̄n )
m̄
and ˜2 = n̄
⇥ 2 ⇥ (1 s̄m ). The marginal e↵ects of deal price on the consumer and
n̄ m̄
merchant bases are ⇢˜1 = p̄
⇥ ⇢1 ⇥ (1 s̄n ) and ⇢˜2 = p̄
⇥ ⇢2 ⇥ (1 s̄m ), respectively.
1
In the long term, a one-unit increase in the consumer base leads to 1 ˜1
addi-
˜2
tional consumers via CC 1 , and 1 ˜1
additional merchants via the CM0 of consumers
˜2 ˜2
on merchants. Furthermore, 1 ˜1
merchants lead to 1 ˜1
⇥ 1 1˜ total merchants via
2
the M M 1 of merchants. For each consumer and merchant, we use ⇡ n and ⇡ m , re-
spectively, to denote the value they generate in one period. We use the discounted
cash flow approach to compute value perpetuity (Brealey et al., 2012). Thus, the
consumer value is represented by the total increased profits associated with a one-
unit increase in the consumer base.5 Formally, the consumer’s CLV 2 is computed
as follows:
1 ˜2 1
CLV 2 = ⇥ ⇡n + ⇥ ⇥ ⇡m . (7)
1 ˜1 1 ˜1 1 ˜2
| {z } | {z }
consumer side value merchant side value
Based on the same logic, the merchant’s M LV 2 is:
1 ˜1 1
M LV 2 = ⇥ ⇡m + ⇥ ⇥ ⇡n . (8)
1 ˜2 1 ˜2 1 ˜
| {z } | {z 1 }
merchant side value consumer side value
We can then examine the e↵ectiveness of a user growth strategy by comparing
5
To simplify the calculation, we assume there is no discount of profits across periods.
22the CLV 2 and the consumer acquisition cost, and the M LV 2 and the merchant
acquisition cost, respectively. We denote the consumer acquisition cost and merchant
acquisition cost as AC n and AC m , respectively. A user growth strategy is e↵ective
only when CLV 2 > AC n or M LV 2 > AC m .
Importantly, Equations 7 and 8 can also be used to answer the question: what
is a free customer worth (Gupta and Mela, 2008). The direct e↵ect of ⇡ n in the first
equation or of ⇡ m in the second equation could be zero and yet both CLV 2 and
M LV 2 could be positive due to non-zero cross-side value.
3.3 Platform Heterogeneity in User Growth Strategy
An interesting question to consider is why the e↵ectiveness of a user growth strategy
varies by platforms with strong CS0 . According to Equation 7 and 8, the CLV 2 and
M LV 2 are jointly determined by the strength of both SS 1 and CS0 . The existence
of SS 1 makes the influence of CS0 persist over time and thus amplifies the impact
of CS0 on CLV 2 and M LV 2.
Table 3: How SS 1 Amplifies The Impact of CS0 on CLV 2.
ASn 1 2 3 4 5 6 7 8 9 10
1 0 0.5 0.667 0.75 0.8 0.833 0.857 0.875 0.889 0.9
To illustrate the impact of SS 1 on CLV 2, we vary the value of 1 while keep
other parameters unchanged, then compute the changes in CLV 2. We use ASn to
denote the amplification size of the consumer’s SS 1 on CLV 2. According to our
23Figure 2: Cash Flow in Each Period When SS 1 Changes.
ASn = 1, 1 =0 ASn = 2, 1 = 0.5
ASn = 4, 1 = 0.75 ASn = 8, 1 = 0.875
1
model, ASn = 1 ˜1
. Table 3 shows the correspoding relationship between ASn and
1: not only does ASn increase with 1, but also the increase in ASn accelerates
when 1 becomes larger. Figure 2 depicts the impact of various SS 1 on cash flow
in future periods. In an extreme case when the SS 1 is absent on the platform, the
CS0 only creates value in one period, and the CLV 2 is equal to the value created in
the current period. However, when the SS 1 exists, users continue creating value in
future periods, leading to amplified CLV 2.
Therefore, a weak SS 1 could explain why platforms with strong CS0 may fail in
using a user growth strategy. We theorize that one reason for the heterogeneous SS 1
is because of the “product learning” mechanism: product with higher uncertainty
would expect a higher SS 1 . Using Groupon data, Li and Wu (2018) show that
24previous sales information has a greater impact on consumer choices in the category
of experience goods than search goods because experienced goods are associated with
higher uncertainty. In the same vein, we hypothesize that the SS 1 of experienced
goods is stronger than that of search goods. In the following sections, we discuss our
identification strategies and test this hypothesis.
4 Data and Estimation
This section presents the empirical setting and our identification strategy.
4.1 Empirical Setting and Data
We estimate our model and discuss the analysis of the user growth strategy using data
from the daily deal market. Daily deal platforms such as Groupon emerged around
2008 as two-sided markets connecting merchants and consumers with discounted
deals. Figure 3 shows the growth of Groupon’s consumer base, profit, revenue, and
market value over the past ten years. Groupon experienced rapid convex growth in
its first several years, before reaching 2013 revenues of $2.6 billion, but then it almost
stopped growing. As a forecast of future growth, its market value experienced a sharp
decline in 2012. Analysts observed that the consumer base and revenues had a highly
correlated trend. For years, a central question for Groupon senior management was:
Should Groupon further promote the growth of its user base? This question makes
Groupon a valuable setting for our research.
The daily deal market is ideal to answer our research questions for several rea-
25sons. The market was largely dominated by two leading platforms: Groupon and
LivingSocial, making it easier to control for the competition e↵ects. Around our
data collection period, Groupon and LivingSocial made up roughly 59% and 17% of
the total revenue in the U.S. daily deal market, respectively.6 In our estimation, we
use Groupon as the focal platform to estimate the parameters of interest and use
LivingSocial to control for competition. Perhaps more importantly, it is critical for
us to examine how SS 1 and CS0 vary by product categories (especially between
experience goods and search goods) after the overall quality and brand name of the
platform are controlled for. Comparing di↵erent platforms would face tremendous
identification challenges, because the nature of products o↵ered by di↵erent platforms
would be indistinguishable from the intrinsic quality of the platforms. Fortunately,
Groupon o↵ers products from both experience and search categories. By leveraging
the panel data structure across categories and markets, we can estimate the e↵ects
of users after eliminating the e↵ects attributable to platform quality or brand name.
Our sample includes Groupon’s largest 108 markets from January 2012 to De-
cember 2012. Table 4 provides summary statistics by market and week. Note that
the platform’s consumer base is not directly observed in this study. In the estima-
tion, it is represented using the transaction volume. Using transaction volume has
an advantage of capturing the number of active users rather than dormant users
who did not make a purchase. Compared with the number of registered accounts,
transaction volume is better aligned with the decision-making process underlying
Equations 2 and 5, because consumers and merchants can observe the transaction
6
Statistica 2013, http://www.statista.com/statistics/322293/groupon-market-share-us/.
26Figure 3: Groupon Growth from 2010-2019. Bars Show Observation Period
volume but not the number of inactive consumers.
Table 4: Descriptive Statistics by Market and Week
Variable Obs Mean SD Min Max
Consumer base 5,707 4,685.12 6,085.98 4 111,820
Merchant base 5,707 22.4 17.19 1 130
Average deal price ($) 5,707 78.06 53.94 11 770
Rival’s consumer base 5,707 2,828.47 8,935.2 0 425,030
Rival’s merchant base 5,707 10.9 9.16 0 57
Returning merchant indicator 5,707 0.59 0.2 0 1
Deal duration (days) 5,707 4.15 0.97 0 13.54
4.2 Estimation and Identification
In this section, we present the estimation and identification strategy for the inter-
temporal and within-period network e↵ects.
274.2.1 Identification for the Inter-temporal Network E↵ect
We begin by discussing the estimation for the SS 1 . As shown in Equations 2 and
5, the SS 1 is captured by the lag(s) of the consumer base and merchant base. As
the dependent variable, i.e., the logarithm of relative market share, is also a function
of the user base, our specification is a variant of the dynamic panel linear model.
This specification has the advantage of controlling for heterogeneity and allowing
the distinction between the short-run and long-run dynamics, but calls for special
attention on estimation.
It is well known that the ordinary least square (OLS) estimator for the lagged
user base (i.e., 1 and 2) is biased in dynamic panel linear models. By construction,
ln nj,t 1 in Equation 2 and ln mj,t 1 in Equation 5 are correlated with the market
fixed e↵ects. To eliminate the unobserved market e↵ects, we apply the first-di↵erence
approach proposed by Anderson and Hsiao (1981) and Arellano and Bond (1991).
Take Equation 2 as an example. After the first-di↵erence transformation, it becomes
n
ln Yj,t = 1 ln nj,t 1+ 1 ln mjt +⇢1 ln pjt +✓1 ln Rjt +⌘1 Xjt + 1 Ttn + ⇠jt
n
,
n
where Yj,t = snjt /sn0jt , n
ln Yj,t n
= ln Yj,t n
ln Yj,t 1, ln nj,t 1 = ln nj,t 1 ln nj,t 2
and so on. The error terms are assumed to have zero serial correlations for the same
n n
cross-sectional unit, i.e., E(⇠jt ⇠jt0 ) = 0 for all t 6= t0 7 .
Furthermore, the levels of the dependent variable lagged two periods or more
are valid instruments in the equation of first-di↵erences (Arellano and Bond, 1991).
7
The test results for the auto-correlation assumption is presented in the results section.
28The identification restriction is specified as
n
E(ln nj,t p ⇠jt ) = 0, where p 2 {2, 3, .., t 1}; t 2 {3, 4, ..., T }.
The instruments are used to form the objective function for the generalized
method of moments (GMM) (Hansen, 1982; Wooldridge, 2010), forming the Di↵er-
ence GMM (DGMM) estimator (Arellano and Bover, 1995).
4.2.2 Identification for the Within-period Network E↵ect
The identification challenge underlying the parameters for the classic network ef-
fect is that the consumer base and merchant base are simultaneously determined in
Equations 2 and 5, causing an endogeneity concern. We address this problem by
providing instrumental variables for ln njt and ln mjt , respectively.
We first present the instrumental variables for the merchant base ln mjt in Equa-
tion 2. A valid instrument should be correlated with the number of merchants but
n
orthogonal to the demand shock ⇠jt . We used two sets of instruments here. First,
following the pre-determined variable in Arellano and Bond (1991), we use the lag of
merchant size (after logarithm transformation) as the instrument. The argument is
that the demand shock to consumer base in period t should not be correlated with
the merchant size in period t 2, after controlling for all the other variables in the
model. Second, we also leverage political advertising as an exogenous variation for
identification. Our data collection year, 2012, happened to be a presidential election
year in the U.S.. During an election year, political candidates and interest groups
(including party committees and outside political action groups known as PACs and
29superPACs) invest heavily in television advertising, leading to an increase in ad prices
(Moshary et al., 2021). The increased cost of advertising leads merchants to look for
alternative marketing avenues such as participating in daily deals (Dholakia, 2011;
Edelman et al., 2016). Thus, the number of merchants on deal platforms should be
correlated with the amount of political election advertising in the market.8
We collect data on political advertisements across four types of elections that
year (presidential, gubernatorial, House, and Senate elections) (Fowler and Ridout,
2015), and compute the total amount of air time and ad spending across all can-
didates and parties in each market j during week t.9 In this empirical setting, it
often takes some time for the merchants to negotiate with the platform to determine
the terms (Li et al., 2017). Thus, we use the political advertising in period t 1
as the instrument because such a specification captures the time lag associated with
the merchant base in t. The lagged advertising variable also helps the exogenous
assumption in that past political advertising should not directly a↵ect the current
n
deal demand ⇠jt .
We follow a similar identification strategy for the consumer base ln njt in Equa-
tion 5. We use two sets of instruments: (1) the lag of consumer base with a degree
8
In our data, we find positive correlations between merchant base and political advertising (the
Pearson correlation coefficient was 0.19 (pof 2, and (2) the precipitation and temperature in each market. The identification
argument for precipitation and temperature is based on the finding that consumers’
online shopping behaviors are shown to be influenced by weather conditions. Using
data from large-scale field experiments, Li et al. (2017) provided robust evidence that
consumer online shopping behaviors deviate significantly on rainy days from sunny
days, because of the impacts of weather on the mood and psychological states of
consumers. Based on these, we argue that the local weekly temperature and precip-
itation should correlate with consumers’ intention to shop Groupon deals, providing
the first-stage variation for identification. However, precipitation and temperature at
m
time t should not be correlated with the supply-side error ⇠j,t , because the merchant
base has been determined prior to t due to the processing and negotiation time gap
required for merchants to show up on the platform. Thus, the exogenous requirement
for using precipitation and temperature as the instrumental variable is met.
4.2.3 Other Variables
Market size. Our specification requires the “size” for each market. On the con-
sumer side, the market size is defined as the total number of users who could partic-
ipate in the daily deal market. Because anyone with Internet access could use a deal
site, we use the number of Internet users as the measure of market size. The data
are retrieved from the “October 2012 School Enrollment and Internet Use Survey,”
a supplement to the Current Population Survey (CPS) by the U.S. Census Bureau.
On the merchant size, we measure the market size using the number of businesses
in each local market in 2012, which is extracted from the County Business Patterns
3110
(CBP) database from the the U.S. Census Bureau . This data source tracks the
number of businesses in each market along with the NAICS industry code and a
short description. We matched the NAICS with the merchant types in Groupon and
LivingSocial and selected the business categories that have participated in the daily
deal industry.
Experience versus Search Goods. We code product categories on Groupon into
experience goods and search goods based on the nature of the product and services.
Following Li and Wu (2018), we administered an online survey to classify whether
a good or service possesses more experience attributes or search attributes. A total
of 818 respondents were asked to imagine that “user reviews are not available” on a
platform and then asked to assess for each category, “to what extent it is easy (hard)
to evaluate the quality without seeing or trying it.”11 The score closer to “easy”
(coded as 1) corresponds to more of a search good, and vice versa for experience
goods if the score is closer to “hard” (coded as 7) (Nelson, 1974). To ensure that
respondents can finish the survey within 5 minutes, each respondent answered a
random selection of 15 categories (on average, each category was rated by 136.3
respondents).
Table 5 presents the summary statistics from the survey. Across the total of 78
categories, the mean score is 4.72 (Standard Deviation = 1.02) and the median is
4.97. We used the median split and code each category into two groups: experience
10
https://www.census.gov/programs-surveys/cbp/data/datasets.html. Accessed Feb 2021.
11
A total of 1,112 respondents were recruited on Amazon MTurk to participate the survey. 294
(26%) respondents failed the attention filler questions and hence were removed from the analysis.
The detailed survey design and summary statistics are included in the Appendix.
32goods if the average score of that category is greater than the median and vice versa
for search goods. Among our categories, the highest i.e. experience goods scores
were “hair salons,” “facials,” and “makeup services,” while those with the lowest, i.e.
search goods, scores were “holiday decor,” “gifts: candles, phone cases, stationary,”
and “office supplies.” Note that the mean split yielded very similar results since only
two categories in the middle would switch groups. In subsequent analysis, we used
the MTurk responses to classify the categories.
Table 5: Summary Description of Amazon MTurk Online Survey
N Mean SD Median Min Max
All categories 78 4.72 1.02 4.97 1.98 6.39
Experience Goods 39 5.59 0.36 5.51 5.01 6.39
Search Goods 39 3.85 0.65 3.97 1.98 4.94
To cross-check our experience-versus-search goods classification, we conducted
an o✏ine survey using a di↵erent design. Twenty-eight business-school graduate
students at a major U.S. university participated in the survey. Each student was
asked to code the product/service categories on Groupon using a binary response:
the “search” type (denoted as Ei = 0) or the “experience” type (denoted as Ei = 1).
Across all respondents, the Fleiss’ Kappa is 0.603, indicating a moderate level of av-
erage inter-coder reliability (Fleiss, 1971). For each category, we used the majority
voting: a category was classified as the experience type if more than half of the re-
spondents coded Ei = 1. Out of the categories, 8 (10.3%) were coded as search goods
by MTurk respondents but switched to experience type in the validation survey; 5
(6.4%) switched from experience to search type; and the rest 65 (83.3%) were consis-
33tent between the two surveys. We estimated the main models based on the validation
survey and obtained qualitatively similar results. The detailed model estimates are
presented in the appendix.
Price. Lastly, deal price in Equations 2 and 5 could also be endogenous. A rational
platform would strategically adjust the deal price in response to an expected shock
in demand and supply. For example, if the demand is expected to be low, a platform
would be incentivized to reduce the price. In the same vein, if the supply is expected
to be strong, the platform would also be incentivized to adjust prices to increase
profits. To address this issue, we use the lagged deal prices as the instrument for
pjt , as proposed and tested in Villas-Boas and Winer (1999). The identification
assumption is that, the prices from the previous periods should be correlated with
the current price due to the common cost factors. But after controlling for the
market fixed e↵ects and other variables, they should be exogenous to the demand
and supply shock in the current period. We consider this assumption reasonable in
the Groupon setting, because many merchants on the platform provide services to
local customers and thus the cost of service within the market should be correlated
over time. However, Groupon typically feature di↵erent merchants in consecutive
weeks and thus the lagged prices should be uncorrelated with the current demand or
supply shock.
345 Empirical Findings
5.1 Parameter Estimates
In this section, we present the parameter estimates. As aforementioned, we lever-
age the fact that Groupon o↵ers products and services of di↵erent categories in
di↵erent markets, which allows us to estimate di↵erent types of network e↵ects in
a quasi multi-platform context. We estimate the consumer-side model (Equation
2) for search and experience goods, respectively, and present the results in Table
6. Similarly, the estimates for the merchant-side model (Equation 5) for search
and experience goods are presented in Table 7. For each table, we present the
fixed e↵ect estimator and the results based on the DGMM estimator after applying
first-di↵erencing and the instruments. In the subsequent section, we interpret the
coefficients based on the DGMM results.
On the consumer side, the SS 1 is estimated to heterogeneous between expe-
rience and search goods. While the SS 1 is positive and significant for experience
goods (0.096, p < 0.05), it is insignificant for search goods (-0.034, p>0.10). As
hypothesized, because of the higher uncertainty prior to consumption, more existing
consumers can shed light on the quality of goods on the platform and attract more
future consumers, yielding a positive SS 1 . However, the quality uncertainty for
search goods can be reduced through information search (for example, doing online
searches or reading consumer reports), the size of existing consumer base is no longer
found important for attracting future consumers.
The pattern is di↵erent for the CS0 . The e↵ect of merchants on consumers is
35You can also read