Pathway to the future - Scandria2Act Clean Fuel Deployment Strategy - Dena
←
→
Page content transcription
If your browser does not render page correctly, please read the page content below
Scandria®2Act Clean Fuel Deployment Strategy
Interreg Baltic Sea Region Project

Pathway to the future
– Scandria®2Act Clean Fuel Deployment Strategy
Scandria®2Act Clean Fuel Deployment Strategy
 Interreg Baltic Sea Region Project

Imprint
Publisher
Deutsche Energie-Agentur GmbH (dena)
German Energy Agency
Chausseestrasse 128 a
10115 Berlin, Germany
Tel: +49 (0)30 66 777 - 0
Fax: +49 (0)30 66 777 - 699
E-mail: info@dena.de
Internet: www.dena.de

Authors
Crone, Kilian, German Energy Agency (dena)
Siegemund, Stefan, German Energy Agency (dena)
Zinnecker, Valentin, German Energy Agency (dena)
Contact information for this document: siegemund@dena.de
Illustrations by Karina Knihinicka / Akershus County Council (front page), and Formbruch
Kreativagentur

Acknowledgements
This project is co-funded by Interreg Baltic Sea Region Programme 2014–2020, www.interreg-
baltic.eu
We wish to acknowledge the generous assistance of all project partners and stakeholders, and the
time and information that they kindly contributed to this project. In particular, we appreciate the
contributions of the following fellow partners of Work Package 2 of Scandria®2Act:
• Anna Tibbelin, Desirée Grahn and Marcus Larsson, Skåne Association of Local Authorities
• Jan Carsten Gjerløw, Akershus County Council (ACC)
• Teréz Palffy, Region Skåne
• Philip Michalk, Technical University of Applied Science, Wildau
• Stig Hvoslef and Ingrid Falkflaug Misund, Akershus County Council
• Sven Friedrich, INFRASTRUKTUR & UMWELT

Disclaimer
Despite the care that was taken while preparing this document, the following disclaimer applies: The
information in this document is provided as it stands and no guarantee or warranty is given that the
information is fit for any particular purpose. Persons using this information do so at their own risk and
liability alone.

The project Scandria®2Act is co-funded by Interreg Baltic Sea Region Programme 2014–2020,
www.interreg-baltic.eu. Further information about the project and its results can be found at:
https://scandria-corridor.eu/index.php/en/projects/scandria2-act.

                                      Date of this document:
                                         November 2018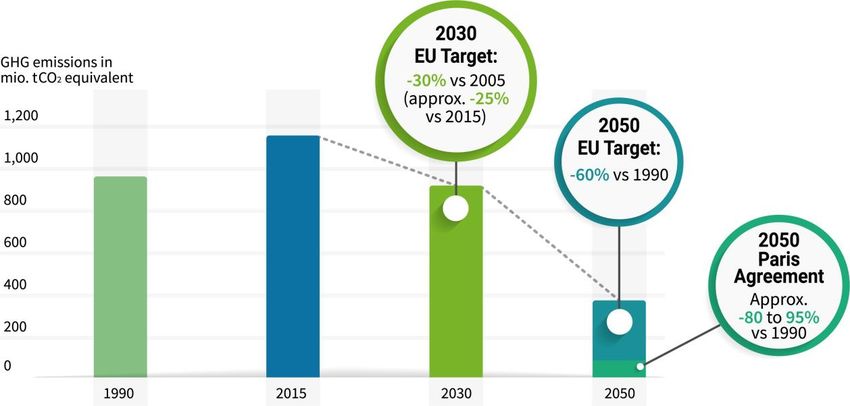
Scandria®2Act Clean Fuel Deployment Strategy
Interreg Baltic Sea Region Project

Clean Fuel Deployment Strategy
1      Introduction .................................................................................................................................... 3

2      Alternative fuels market in the Scandria countries .................................................................... 6

3      Policy instruments in the Scandria Corridor to stimulate clean fuel deployment .................. 8
    Typology of policy instruments ............................................................................................................. 8
    National policy and policy instruments for alternative fuels in Scandria countries .................. 10
       Denmark ............................................................................................................................................... 10
       Finland.................................................................................................................................................. 13
       Germany ............................................................................................................................................... 16
       Norway ................................................................................................................................................. 19
       Sweden ................................................................................................................................................. 22

4      Assessment of selected policy instruments to stimulate Clean Fuels .................................. 26
    Definition of criteria ............................................................................................................................... 26
    Assessment of selected instruments on national level .................................................................. 27
    Key messages from national instrument assessment .................................................................... 31
    Assessment of selected instruments on regional level .................................................................. 32
    Key messages from regional instrument assessment .................................................................... 33
    Excursus – Regional actions that reinforce clean fuel deployment ............................................. 34

5      Instruments and framework conditions – Development of national markets over time ....... 36
    Denmark ................................................................................................................................................... 37
    Finland ..................................................................................................................................................... 38
    Germany .................................................................................................................................................. 39
    Norway ..................................................................................................................................................... 40
    Sweden..................................................................................................................................................... 41

6      Summary – results of the policy instrument assessment and literature ............................... 43
    Local and corridor infrastructure perspective .................................................................................. 46
    Status quo and next steps in alternative fuel market development .............................................. 47

7      Recommendations – catalogue of strategic measures ............................................................ 49
    General recommendations for promoting alternative vehicles in commercial transport ......... 52
    Scandria corridor recommendations .................................................................................................. 52
    The role of different policy levels in supporting alternative vehicles........................................... 53

                                                                                 1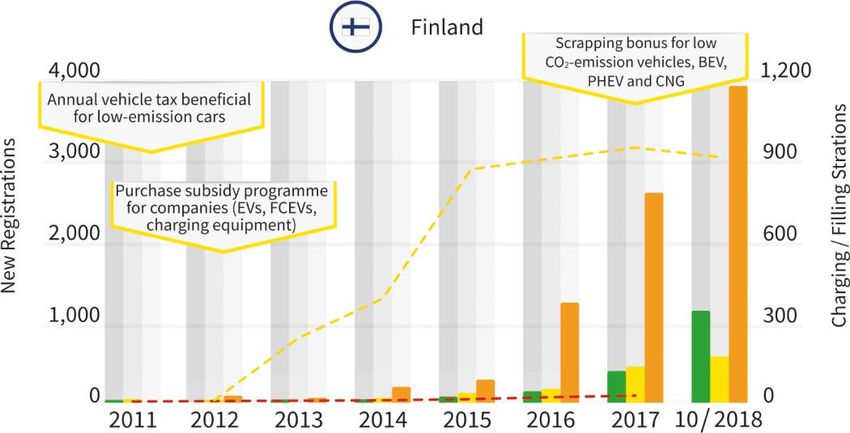
Scandria®2Act Clean Fuel Deployment Strategy
 Interreg Baltic Sea Region Project

Annex .................................................................................................................................................... 55

Acronyms and abbreviations ............................................................................................................. 56

Figures .................................................................................................................................................. 57

Tables ................................................................................................................................................... 58

Literature .............................................................................................................................................. 59

                                                                             2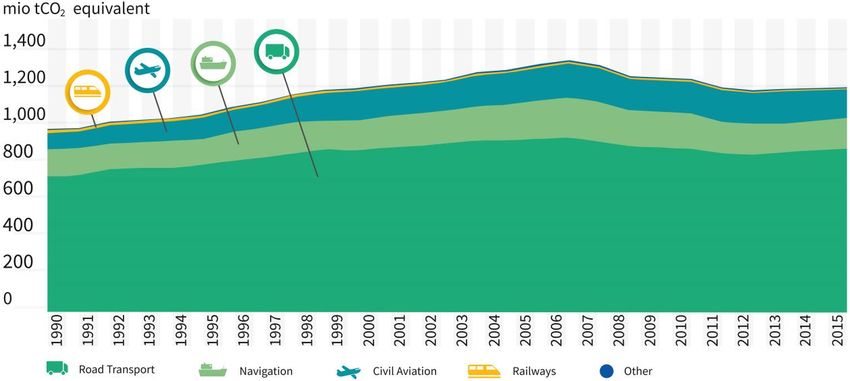
Scandria®2Act Clean Fuel Deployment Strategy
 Interreg Baltic Sea Region Project

1      Introduction
For decades, transport has been an area of EU common policy, including the harmonisation of
national laws, regulations and administrative provisions. As a result, the technological, social and tax
environments in which transport services are provided has also steadily gained importance. Besides
changes in manufacturing and stock management systems, the abolition of internal borders and a
consequent fall in transport prices have also led to an increase in goods and passenger volumes. The
transport sector accounts for almost a quarter of all greenhouse gas (GHG) emissions in the EU. In
contrast to other sectors, it has not seen the same gradual decline in emissions. Here road transport is
the largest emitter, accounting for more than 70% of all GHG emissions from transport in 2014
(European Parliament 2017).
In order to meet its climate goals, the EU has to speed up its efforts to replace conventional fuels for
road vehicles and ships with cleaner alternatives. At present, the markets for these fuels across
Europe are at differing stages of development. In January 2013, the European Commission
announced a package of measures to ensure the development of alternative fuel stations across
Europe. In 2014, the new EU rules were officially adopted. As part of this package, Directive
2014/94/EU on the deployment of alternative fuels infrastructure (AFID) seeks to establish a common
framework of measures for the deployment of alternative fuels infrastructure. The Directive aims at
establishing a “common framework of measures for the deployment of alternative fuels infrastructure
in the Union in order to minimise dependence on oil and to mitigate the environmental impact of
transport” (European Union, 2014, p. 9). It outlines an agreed and consistent approach to alternative
fuels infrastructure and technical standards across EU Member States. In this way, the Directive
facilitates the physical interoperability of public infrastructure across countries. Member States were
obliged to submit so-called National Policy Frameworks (NPF) to the Commission by 18 November
2016, summarising the status quo as well as targets and measures for developing infrastructure for
the alternative fuels electricity, hydrogen and natural gas (cf. European Union, 2014, p. 10f.)

Aim and scope of the report
Road transport in particular has resulted in growing challenges to the climate and environment. The
transport sector accounted for 23% of the EU’s greenhouse gas emissions in 2015 and is a source of
environmental and health problems in urban areas. It therefore requires appropriate policy instruments
that boost mobility by using energy-efficient and environmentally friendly means of transport, and
promote innovative mobility solutions with alternative propulsion systems and fuels. These should lead
to reductions in emissions, while simultaneously facilitating market access for innovative and energy-
efficient mobility products with multiplier potential. The “Clean Fuel Deployment Strategy” (CFDS) is a
white paper that includes a list of strategic measures derived from a strategic diagnosis of clean fuel
deployment in the Scandria®-Corridor. Addressing fields of action of strategic relevance, it illustrates
the development of the clean fuel market, clean fuel technology and clean fuel infrastructure. It
identifies relevant measures needed to enable clean fuel deployment from a corridor perspective. It
therefore addresses the issues of political coordination, financial incentives, standardisation and
information, as well as the financing models of clean fuel infrastructure. The goal is to enable regional
and national decision-makers to identify effective and efficient actions in order to support clean fuel
deployment. The CFDS therefore strives to promote knowledge acquisition and improve the decision-
making process. It includes a list of strategic measures, which can be efficient levers to facilitate clean
fuel deployment on different levels.
The CFDS briefly discusses the EU’s climate and energy goals as well as the Union’s transport policy
and the role of alternative fuels. Following this, the strategy outlines the present state of alternative
fuels and vehicles in relation to targets. Since the main goal of the paper is to evaluate which policy
instruments and measures have been shown to facilitate the market uptake of alternative fuels, it

                                                     3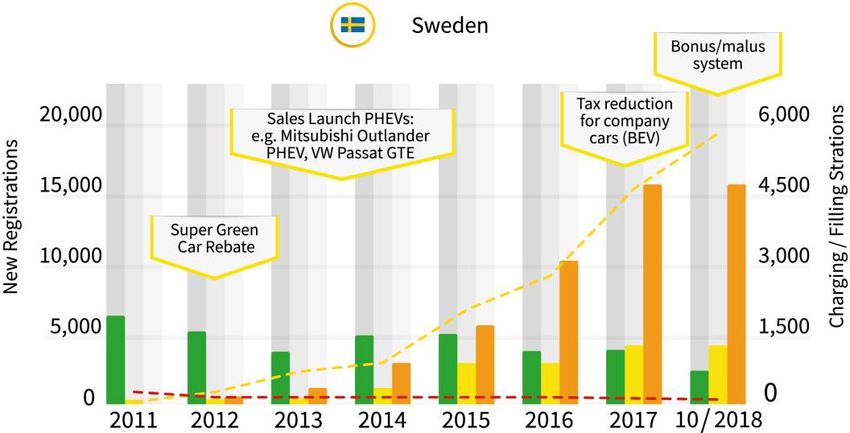
Scandria®2Act Clean Fuel Deployment Strategy
Interreg Baltic Sea Region Project
outlines the supporting schemes and incentives that have been or are currently in place within the
countries selected. To provide the reader with an overview, a selection of these instruments is
illustrated in a table and rated according to certain criteria. In the next section an ex-post assessment
is carried out, which discusses the measures taken within country-specific policy frameworks. This
chapter serves as the basis for the catalogue of strategic measures, which is directed at policy-makers
and reflects on the success factors of policy instruments and their transferability to other countries and
regions.
The CFDS covers Germany, Denmark, Sweden, Finland and Norway. Just as in the AFID alternative
infrastructure deployment is pursued for electricity, hydrogen, natural gas and biomethane. These are
defined as ”alternative fuels” in this report as well. ”Electric vehicles” include both battery electric
vehicles (BEV) and plug-in hybrid electric vehicles (PHEV), combining electricity with conventional
fuels. ”Fuel cell vehicles” are those which run on hydrogen (FCEV), and ”natural gas vehicles” cover
both natural gas and biomethane, either as compressed natural gas (CNG) or as liquefied natural gas
(LNG). Although policies for trucks and buses are also discussed, the report focuses mainly on
passenger cars.
EU’s climate & energy policy
At the Paris Climate Conference (COP21) in December 2015, the EU Member States were part of the
195 countries that adopted the global climate agreement (European Commission, 2016a).
Governments agreed on a long-term goal of keeping the increase in global temperature below 2°C.
Prior to this, the European Union had already long been committed to international efforts to tackle
climate change, and aims to pursue robust policy-making in this area. In 2007 the European Council
agreed on European climate and energy targets to be achieved by 2020: (1) cut EU greenhouse gas
emissions to at least 20% below 1990 levels, (2) increase the share of EU energy consumption
coming from renewable sources to 20% and (3) improve energy efficiency to reduce the amount of
primary energy used by 20% compared with projected levels (European Commission, 2017a). In 2011,
as a long term goal, the European Council confirmed the EU objective of reducing greenhouse gas
emissions by 80–95% by 2050 compared to 1990 (European Commission, 2017a). To set clear
targets beyond 2020, in October 2014 the Council agreed on the 2030 climate and energy framework.
Among other things, the agreement includes continuing with three targets in the areas of reducing
greenhouse gas emissions, increasing the share of renewable energies, and energy efficiency:
(1) 40% cut in greenhouse gas emissions compared with 1990 levels;
(2) 27% of total energy consumption from renewable energy;
(3) 27% increase in energy efficiency (European Commission, 2017b).
In the light of the Paris Agreement, the target of a 40 percent reduction in greenhouse gas emissions
is seen as a minimum, and can be increased accordingly. The renewable energy target is only legally
binding at EU level, and not for the individual member states. The same applies for the indicative
target to reduce energy consumption by at least 27 percent compared to the projected use of energy.
It will be reviewed before 2020 with a view to increasing it to 30 percent (Federal Ministry for the
Environment, Nature Conservation, Building and Nuclear Safety, 2017).
4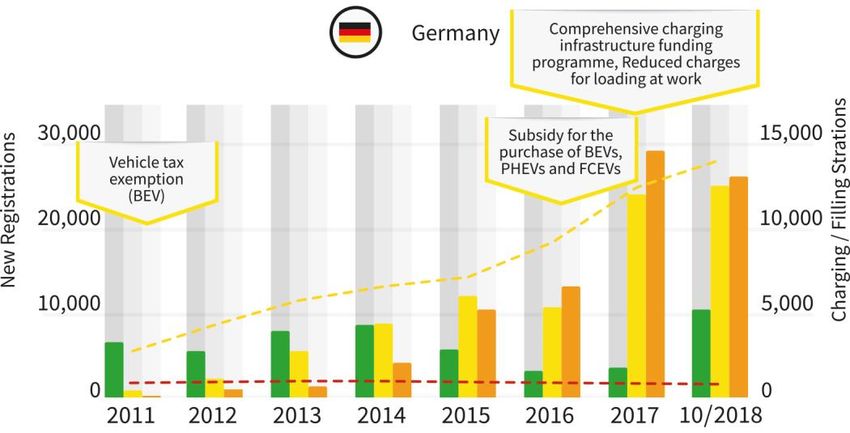
Scandria®2Act Clean Fuel Deployment Strategy
 Interreg Baltic Sea Region Project

Figure 1: GHG emissions from the transport sector (EU28) and EU climate targets (authors’ own
representation based on European Union, 2017)

In addition to the AFID, the mandatory emission reductions targets for new cars and light commercial
vehicles (LCV) can also be regarded as an instrument to promote alternative fuels in the EU. Whereas
in 2015 the target to be reached by the average car fleet was 130g CO2/km, this will be reduced to 95g
CO2/km from 2021, and after that on the basis of the New European Driving Cycle. Compared with the
2007 fleet average of 158.7g CO2/km, the 2015 and 2021 targets represent reductions of 18% and
40% respectively. Penalties apply if the average carbon emissions of a manufacturer’s fleet exceed
the limits. An “excess emissions premium” has to be paid for each car registered: €5 for the first
gCO2/km above the limit, €15 for the second, €25 for the third, and €95 for each subsequent gramme
of CO2/km. From 2019 onwards, the cost will be €95 for every gramme above the limit. So-called
“supercredits” have been introduced in order to encourage industry to invest in vehicles with very low
emissions (below 50gCO2/km) (European Commission, 2016b).

GHG emissions from transport sector in the EU
About 20% of the EU’s total emissions of GHG can be traced back to road transport. Between 1990
and 2007, GHG emissions grew from 855 to 1,131 million tonnes. The decline subsequently observed
was only due to decreasing freight transport volumes and efficiency enhancement. In 2015, emissions
were more than 20% above 1990 level, and transport is the only major sector where GHG emissions
are still rising.

                                                  5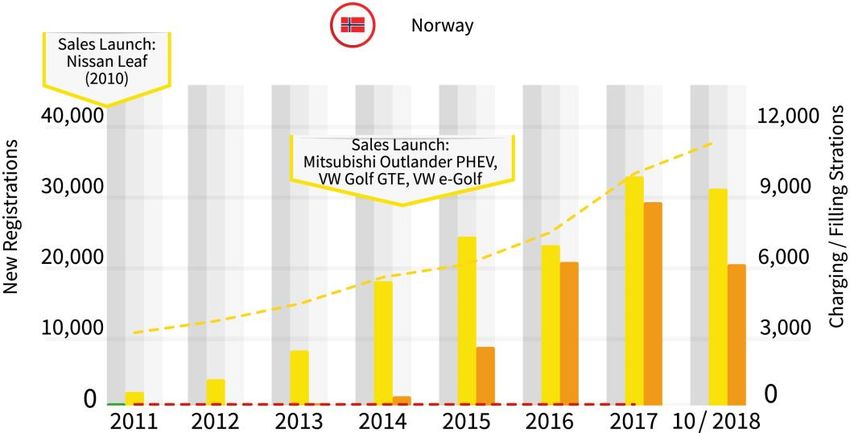
Scandria®2Act Clean Fuel Deployment Strategy
Interreg Baltic Sea Region Project
Figure 2: GHG emissions from transport sector by mode (EU28) (authors’ own representation based on
European Union, 2017)
The main source of emissions in Europe is Germany with a share of 17.9 %, followed by France
(14.3%), the United Kingdom (13.3 %), Italy (11.2 %) and Spain (9.2 %). These five countries
accounted for two-thirds of the transport sector’s GHG emissions in the EU28 (plus Norway) in 2016.
Given their smaller populations, the percentages for Sweden (1.8 %), Denmark and Norway (both
1.4%) and Finland (1.3%) were less significant (European Environment Agency, 2018).
Figure 3: Share of GHG emissions from the transport sector 2016 by country (EU28 plus Norway)
(authors’ own representation based on European Environment Agency, 2018)
2 Alternative fuels market in the Scandria countries
This report focuses on the countries that constitute the Northern Scandria Corridor: Denmark, Finland,
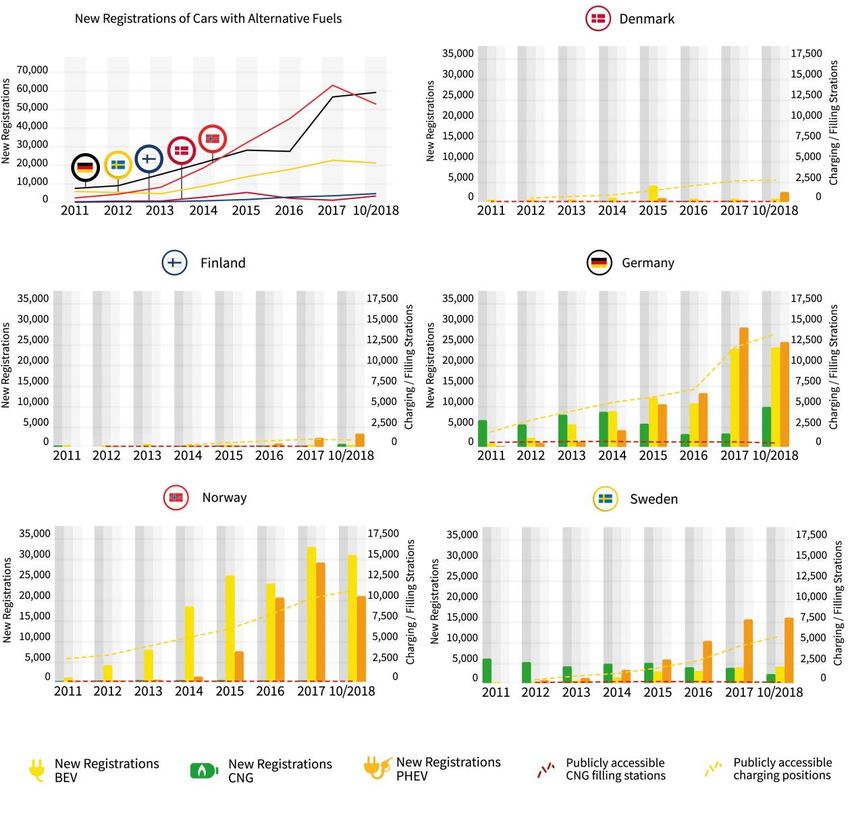
Germany, Norway and Sweden. As Figure 4 shows, new registrations of alternative passenger
vehicles show different trends in these countries. While in Norway the market launch of BEVs and
PHEVs was very successful, in all other countries it is far behind. In Germany, the market for BEVs
6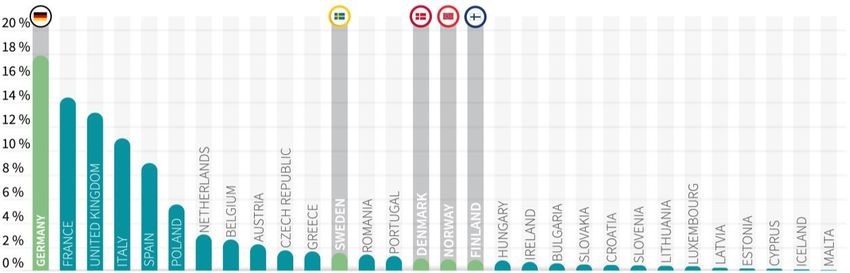
Scandria®2Act Clean Fuel Deployment Strategy
 Interreg Baltic Sea Region Project

and PHEVs grew slowly until 2016, and then by over 100 % in 2017 and around 45 % for BEVs and
23 % for PHEVs in 2018. In Sweden, PHEV new registrations in 2018 are five times higher than 2015,
while BEVs show a positive trend too, but play a smaller role. It is interesting to note that new
registrations of CNG vehicles are declining until 2017, but show a positive trend since then in
Germany and Finland (eafo, 2018a, 2018b, 2018c, 2018d, 2018e). In Sweden there was a strong
positive trend in late 2017, albeit from a low starting point, and the bonus/malus system introduced in
Sweden on 1 July 2018 is expected to fuel a further increase.

Figure 4: Growth in new registrations of alternative vehicles (passenger cars) and infrastructure (authors’
own representation based on eafo, 2017a; bdew, 2017; gibgas, 2018; gas24, 2018; Statistics Denmark,
2018a)

                                                     7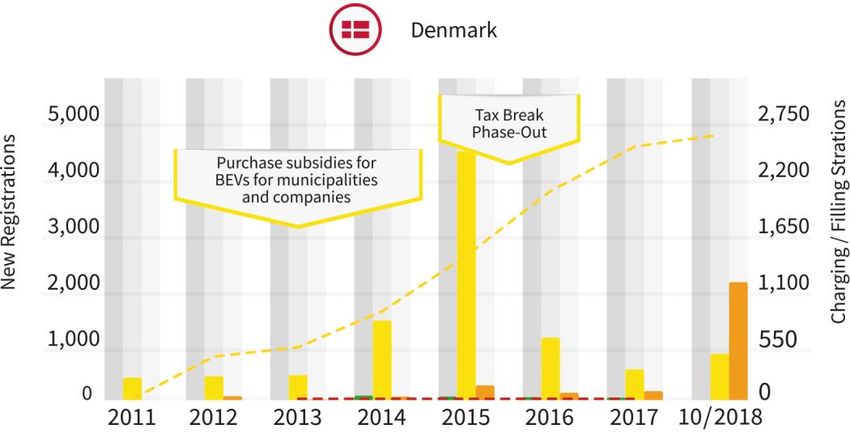
Scandria®2Act Clean Fuel Deployment Strategy
    Interreg Baltic Sea Region Project

The expansion of refuelling and charging infrastructure developed in a similar way. The greatest
progress with regard to publicly accessible charging points was made in Norway and Germany1 with
about 10,000–12,000 charging points per country. Sweden comes next with 4,733 charging points,
then Denmark with 2,581, while the fewest charging points are located in Finland (947). The refuelling
infrastructure for CNG is declining or stagnating, except with Finland where there is a continued
increase.

3         Policy instruments in the Scandria Corridor to stimulate clean fuel
          deployment

Typology of policy instruments
The implementation of alternative fuels in road transport is still lagging behind political expectations.
Existing market structures constitute the existing vehicle and fuel market, which is common to many
new technologies and can be overcome through adequate policy measures. In the early stages of
market deployment for alternative fuels, policy support is indispensable to enable market growth.
Policy instruments can encourage uptake by making alternative fuel vehicles more appealing for
consumers, reducing risks for investors, and encouraging manufacturers to scale up production. To
varying degrees, Scandria member states have started to speed up their efforts to increase the
percentage of alternative fuels in their respective markets. The following chapter provides an outline
overview of different instruments that are currently in place within the five selected countries. These
instruments can be open to all technologies or specifically designed to support a certain kind. The
instruments can take different forms. In the following, they are assigned to three different categories:
(1) financial, (2) regulatory, (3) soft instruments.

(1) Financial instruments
Frequently, and particularly in the short term, innovative technologies imply higher costs. Often such a
“price premium” can be traced back to low economies of scale and a lack of a critical mass. Financial
supporting schemes often aim to overcome barriers for consumers such as the extra cost of vehicle
purchase, extra vehicle operating costs and additional fuel costs. Direct financial support measures
are often required to accelerate the uptake of alternative fuels. The instruments are often time-limited
until the technologies are market-ready. Complementary policies are frequently required to phase out
the financial incentives when technologies become cost-competitive. Consequently, financial
instruments also include increased taxes for conventional vehicles and fuels, as well as tax
exemptions, bonus/malus systems, grants or subsidies.

(2) Regulatory instruments
Through regulatory instruments, policy-makers aim to reach certain environmental quality targets and
induce market participants to adjust their behaviour. This can be achieved by means of restrictions or
by establishing suitable incentives. Regulatory instruments to control environmental externalities in the
transport sector are often classified into different categories. In the process, the instruments often
target vehicle engines (e.g. fuel economy or emission standards), fuel quality (content or blending
quotas) or transport demand (traffic management through encouraging or discouraging the use of

1The higher numbers in 2016 and 2017 were extracted from (eafo, 2017b)for purposes of data comparability.
However, the authors assume that the lower numbers from (bdew, 2017)are more realistic.

                                                     8
Scandria®2Act Clean Fuel Deployment Strategy
Interreg Baltic Sea Region Project
certain vehicles/technologies). Regulatory instruments aim to incentivise a shift to alternative fuels by
means of a positive or negative discrimination for certain technologies.
(3) Soft instruments
Another option that policy might choose is to introduce rather soft instruments, which include better
communication, coordination and research and development. Informing the consumer about the
advantages of alternative fuels is regarded as a rather soft approach compared to regulating the
markets by means of restrictions or incentives. Communication and information e.g. take the form of
new vehicle efficiency labelling. This is regarded as an instrument that addresses market failure
arising from the lack of information. Increasing consumer acceptance requires knowledge about the
existence of alternative fuels and their properties (e.g. fuel quality, vehicle compatibility, availability of
recharging/refuelling points, environmental impact as well as financial and safety aspects). Due to
problems such as market barriers and small market shares for alternative fuels, cooperation and
coordination between the different players is also seen as being beneficial. By means of better
coordination, the use of alternative fuels is expected to become more efficient. The coordination can
be carried out by public players, but can also take the form of private initiatives. In order to encourage
the deployment of alternative fuels technologies, most countries also allocate a specific annual budget
to support research into, technological development of, and demonstration of alternative fuels in the
transport sector. Similarly, private investors have also formed coalitions to promote technological
research and participate in financing the research, demonstration and deployment activities related to
alternative fuels.
9Scandria®2Act Clean Fuel Deployment Strategy
Interreg Baltic Sea Region Project
National policy and policy instruments for alternative fuels in Scandria countries
Denmark
In terms of area, Denmark constitutes the smallest country in the northern Scandria corridor.
Transport in Denmark is modern and highly developed. In particular, the Great Belt Fixed Link that
connects the islands of Zealand and Funen, and the New Little Belt Bridge connecting Funen and
Jutland guarantee smooth traffic flow across the country on both motorways and rail. The
government’s ambition is that by 2050, Denmark should satisfy its total energy consumption with
renewable energy.
Population: 5,781,190
Area: 42,934 km²
Population density: 131.5 people per km²
Gross domestic product: €277,489 million
Length of road network: 74,558 km
Motorways: 1,255 km
Main or national roads: 2,598 km
Secondary or regional roads/other roads: 70,713 km
Total vehicles (2015): 2,850,025
Total commercial vehicles: 445,934
Passenger Cars: 2,404,091
Light commercial Vehicles: 395,645
Medium and heavy commercial vehicles: 41,457
Buses: 8,832
10Scandria®2Act Clean Fuel Deployment Strategy
Interreg Baltic Sea Region Project
By fuel type:
Petrol Diesel Electric Hybrids LPG/CNG Other
(incl. plug-
in)
Passenger
68.4% 30.5% 0.3% 0.2% 0.00% 0.6%
Cars
LCV 11.3% 88.1% 0.23% 0.2% 0.02% 0.2%
MCV &
0.1% 98.2% 0.03% 0.03% 0.3% 1.3%
HCV
Targets according to the Danish national policy framework:
Denmark has set itself the target of being independent of fossil fuels by
2050, including in the transport sector. Denmark has three official policy
papers paving the way for the development of alternative fuels:
o Agreement on a Green Transport Policy, the Energy Strategy 2050,
and the Danish Policy Framework for the Implementation of the
AFID.
o One of the government’s targets is that there should be 10% of
renewable energy in the transport sector by 2030.
o In addition to promoting electric cars, the government also aims to
have a 10% percentage of biofuels in the transport sector by 2020.
BEV vehicle target: introduce electric vehicles by implementing various
policy measures, such as establishing a fund and a tax exemption scheme.
Hydrogen vehicle target: Denmark is a leading EU player in this field. The
Danish industry has developed a “Hydrogen Strategy 2008-2025”.
CNG/LNG vehicle target: CNG/LNG is identified as a promising fuel for
freight transport to reach national 2030 targets for CO 2 emissions.
Infrastructure targets
o Charging points
o Hydrogen fuel stations
o CNG/LNG stations
Sources: (Statistics Denmark, 2018b, 2018c, 2018d; Eurostat, 2015, 2017a; ACEA, 2017a;
BMVI, 2016)
11Scandria®2Act Clean Fuel Deployment Strategy
Interreg Baltic Sea Region Project
Battery electric vehicles Hydrogen fuel cell Natural gas/biogas
vehicles
Financial Green owner tax No registration tax for
instruments incentivising the use FCEVs until 2019
of BEVs
Financial support is
(since 1997)
provided for build-up
Reduced registration hydrogen
tax for BEVs infrastructure
(since 2007)
The Danish Energy
Agency has provided
a national funding
programme for
projects related to
electric vehicles (EV)
(2008-2015) CPH-
Electric has obtained
funding for several
projects. One of these
is purchase subsidies
for municipalities and
companies buying
BEVs
Electricity tax
reductions for
businesses
The government has
decided that
municipalities can
exempt EVs from
parking fees up to
€671/year.
Regulatory No “hard” regulatory instruments forcing market of clean vehicles
instruments
Soft No central coordinated soft instruments regarding clean vehicles.
instruments
Table 1: Policy instruments for alternative fuels in Denmark
12Scandria®2Act Clean Fuel Deployment Strategy
Interreg Baltic Sea Region Project
Finland
Finland has land borders with Sweden to the northwest, Norway to the north, and Russia to the
east. The transport system is well-developed, and owes its character to the sparse population and
long distance between towns and cities, as well as the cold climate. In 2015, the National Climate
Change Act began implementing a long-term target of reducing greenhouse gas emissions by at
least 80% by 2050, compared to the 1990 levels. Finland has been hit particularly hard by the
financial crisis of 2008 and faced a recession for much of 2011–15. The problems can be mainly
traced back to the decline of Nokia and the forestry industry as well as to sanctions against
neighbouring Russia.
Population: 5,503,297
Area: 338,400 km²
Population density: 18.0 people per km²
Gross domestic product: €215,773 million
Length of road network: 78,110 km
Motorways: 810 km
Main or national roads: 12,522 km
Secondary or regional roads/other roads: 13,565 km / 51,213 km
Total vehicles: 3,028,316
Total commercial vehicles: 415,394
Passenger Cars: 2,612,922
Light commercial vehicles: 307,706
Medium and heavy commercial vehicles: 95,233
Buses: 12,455
13Scandria®2Act Clean Fuel Deployment Strategy
Interreg Baltic Sea Region Project
By fuel type:
Petrol Diesel Electric Hybrids LPG/CNG Other
(incl. plug-
in)
Passenger
74.3% 23.6% 0.03% 0.4% 0.02% 1.7%
Cars
LCV 10.0% 89.6% 0.03% 0.00% 0.03% 0.3%
MCV &
1.2% 94.3% 0.02% 0.02% 2.5% 1.9%
HCV
Targets according to the Finnish national policy framework:
The entire car fleet should consist of near-zero emission vehicles by 2050.
Finland’s National Energy and Climate Strategy declares that Finland aims
at 50,000 gas-fuelled vehicles by 2030 and 250,000 electric vehicles.
All new cars and vans should be compatible with alternative fuels by 2030.
The same applies to new trucks and buses.
By 2025, 50% of new cars and vans should be powered by an alternative
fuel, and the goal for 2020 is a 20% share.
By 2025, 60% of new trucks and buses should be compatible with an
alternative fuel, and the goal for 2020 is a 40 % share.
With regard to infrastructure, Finland’s target is
o a minimum of 2,000 publicly accessible recharging points by 2020.
The goal for 2030 is a minimum of 25,000 public recharging points.
o around 20 hydrogen refuelling stations by 2030.
o some 50 natural gas and biogas stations in total by 2020.
Sources: (Eurostat, 2017b; European Union, 2016; Eurostat, 2015, 2017a; ERF, 2016; ACEA,
2017a)
14Scandria®2Act Clean Fuel Deployment Strategy
Interreg Baltic Sea Region Project
Battery electric vehicles Hydrogen fuel cell Natural gas/biogas
vehicles
Financial Registration tax linked Registration tax linked €1,000 subsidy for
instruments to vehicle-specific to vehicle-specific converting a normal
emissions of emissions of vehicle to a gas
passenger cars passenger cars (since vehicle (2018–2021).
(since 2008) 2008)
There is a low tax on
Annual vehicle tax Annual vehicle tax natural gas and no tax
beneficial for low- beneficial for low- for biogas.
emission cars emission cars
Scrapping bonus for
(since 2011) (since 2011)
low CO2-emission
9 million euro subsidy 9 million euro subsidy vehicles
programme for programme for (≤110 gCO2/km;
companies purchasing companies purchasing €1,500) and for BEV,
EVs, FCEVs and EVs, FCEVs and PHEV and CNG
charging equipment charging equipment (€2,500)
(2012–2017). (2012–2017).
€4.8 million charging 6 million euros for
infrastructure purchase subsidies of
investment subsidy €2000 for electric and
(30–35%) for fuel cell electric
operators installing vehicles. Maximum
smart public charging price per vehicle must
stations (2017–2019) not exceed €50,000
(2018–2021)
6 million euros for
purchase subsidies of
€2,000 for electric and
fuel cell electric
vehicles. Maximum
price per vehicle must
not exceed €50,000
(2018–2021)
Scrapping bonus for
low CO2-emission
vehicles
(≤110 gCO2/km;
€1,500) and for BEV,
PHEV and CNG
(€2,500)
Regulatory No “hard” regulatory instruments. Goals set in Finland’s National Energy and
Climate Strategy are intended to be met with the help of financial instruments
instruments
and natural technological developments, which lead to a market where clean
vehicles are the first choice.
15Scandria®2Act Clean Fuel Deployment Strategy
Interreg Baltic Sea Region Project
Soft No central coordinated soft instruments regarding clean vehicles.
instruments
Table 2: Policy instruments for alternative fuels in Finland
Germany
Germany is Europe’s most populous country and highly industrialised, with a particular focus on
the automotive industry. In contrast to other sectors, emissions trends in transport have been
stagnating or even increasing in the last few years. According to the Federal Government’s
Climate Action Plan 2050, the transport sector as a whole will be obliged to reduce its CO2
emissions by at least 40% by 2030 (compared with 1990).
Population: 82,800,000
Area: 357,300 km²
Population density: 228.6 people per km²
Gross domestic product: €3,144,050 million
Length of road network: 591,034 km
Motorways: 12,879 km
Main or national roads: 39,604 km
Secondary or regional roads/other roads: 178,034 km/413,000 km
Total vehicles (2015): 48,427,094
Total commercial vehicles: 3,355,885
Passenger cars: 45,071,209
Light commercial vehicles: 2,374,822
Medium and heavy commercial vehicles: 902,718
Buses: 78,345
16Scandria®2Act Clean Fuel Deployment Strategy
Interreg Baltic Sea Region Project
By fuel type:
Petrol Diesel Electric Hybrids LPG/CNG Other
(incl. plug-
in)
Passenger
66.2% 32.3% 0.1% 0.3% 1.1% 0.02%
Cars
LCV 5.5% 93.2% 0.2% 0.00% 1.1% 0.01%
MCV &
0.5% 98.9% 0.1% 0.1% 0.4% 0.03%
HCV
Targets according to the German national policy framework:
By 2020, Germany plans to have one million electric vehicles on the roads.
This objective includes battery electric vehicles, plug-in hybrids, and fuel
cell vehicles.
The Federal Government supports the goal of achieving a natural gas
share of about 4% in the energy mix of German road traffic by 2020. This
would translate roughly to 1 million vehicles.
With regard to infrastructure, Germany’s target is to
o establish 36,000 publicly accessible recharging points by 2020.
o create a basic network of 100 hydrogen refuelling stations by 2018
and increase it to 400 stations by 2023.
o consolidate the current network of CNG stations, which is sufficient
for the AFID’s requirements. Based on a maximum network
distance of 400 km, there would be a need for 6 additional filling
stations for LNG.
Sources: (Eurostat, 2017a; European Union, 2016; Eurostat, 2015, 2017b; ERF, 2016; Pro
Mobilität, 2014; ACEA, 2017b; BMVI, 2016)
17Scandria®2Act Clean Fuel Deployment Strategy
Interreg Baltic Sea Region Project
Battery electric vehicles Hydrogen fuel cell Natural gas/biogas
vehicles
Financial Subsidy for the Subsidy for the Financial support by
instruments purchase of BEVs purchase of HFCVs federal ministries for
(2016–2019) (2016–2019) pilot projects in the
area of LNG (since
BEV owners are Programme to provide
2016)
exempted from paying financial support for
vehicle tax for ten infrastructure and Financial support
years (since 2011) production of programme for trucks
hydrogen and its with alternative fuels –
Employees charging
application in the BEVs; H2, CNG/LNG
their BEV at work pay
transport sector (2018–2020)
a reduced rate of 25%
(1st phase: 2006–
on this non-cash (Regressive) tax
2016, 2nd phase
benefit reduction for natural
2016–2026)
(since 2017) gas until 2026
Financial support (since 2006)
Comprehensive
programme for trucks
programme for
with alternative fuels –
funding charging
BEVs; H2, CNG/LNG
infrastructure
(2018-2020)
(since 2017)
Financial support
programme for trucks
with alternative fuels –
BEV; H2, CNG/LNG
(2018-2020)
Regulatory Toll charge exemption for electric and natural gas trucks until 2020 respective
2020
instruments
Soft “Nationale Plattform Public and private Private initiative
instruments Elektromobilität” initiatives supported supported by federal
(NPE) by federal ministries ministries (Initiative
government/industry/s (NOW, H2-Mobility) Erdgasmobilität, LNG-
cience dialogue (until Taskforce)
2018)
“Nationale Plattform Zukunft der Mobilität” - government/industry/science
dialogue (since 2018)
“Mobilitäts- und Kraftstoffstrategie” - government/industry/science dialogue (since
2011)
Table 3: Policy instruments for alternative fuels in Germany
18Scandria®2Act Clean Fuel Deployment Strategy
Interreg Baltic Sea Region Project
Norway
Norway’s low population density, narrow shape and long coastline have an impact on the transport
sector. The system is less developed in rural areas but well developed in and around cities. The
country has the world's largest registered stock of plug-in electric vehicles per capita. In 2016, the
Norwegian parliament approved the goal of achieving climate neutrality by 2030, two decades
earlier than originally planned.
Population: 5,258,317
Area: 365,123 km²
Population density: 16.9 people per km²
Gross domestic product: €335,503 million
Length of road network: 94,260 km
Motorways: 392 km
Main or national roads: 10,581 km
Secondary or regional roads/other roads: 44,317 km / 38,970 km
Total vehicles: 3,180,159
Total commercial vehicles:
Passenger cars: 2,592,390
Light commercial vehicles: 487,674
Medium and heavy commercial vehicles: 100,095
Buses: n.a.
By fuel type:
Petrol Diesel Electric Hybrids LPG/CNG Other
(incl. plug-
in)
Passenger
41.94% 47.62% 5.12% 0.01% 5.32%
Cars
LCV 5.69% 93.46% 0.74% 0.09% 0.02%
MCV &
4.09% 95.37% 0.00% 0.00% 0.44% 0.09%
HCV
19Scandria®2Act Clean Fuel Deployment Strategy
Interreg Baltic Sea Region Project
Targets according to the Norwegian national policy framework – the National
Transport Plan 2018-2029
All new passenger and light duty vehicles should be zero emission from 2025
New buses should be zero emission or biogas from 2025
75% of long-distance buses and 50% of heavy duty vehicles should be zero
emission from 2030
By 2030, the distribution of goods in the largest city centres will be almost
zero emission
Infrastructure target: no specific targets
Sources: (Eurostat, 2017a; Statistics Norway, 2017; Eurostat, 2015, 2017b; ERF, 2016; ACEA,
2017)
Battery electric vehicles Hydrogen fuel cell Natural gas/biogas
vehicles
Financial No purchase/import No purchase/import Road tax exemption
instruments
taxes on BEVs taxes on FCEVs for biomethane
(since 1990) (since 1990)
Programme for
25% VAT exemption 25% VAT exemption funding professional
on purchases of BEVs on purchases of biomethane light and
(since 2001) FCEVs heavy duty vehicles
(since 2001) (Enova, since 2017)
Reduced annual road
tax for BEVs Reduced annual road
(since 1996) tax for FCEVs
(since 1996)
No fees on toll roads
or ferries for BEVs No fees on toll roads
(1997 and 2009) * or ferries for FCEVs *
(1997 and 2009)
Free municipal
parking for BEVs* Free municipal
(since 1999) parking for FCEVs*
(since 1999)
50% reduced
company car tax 50% reduced
(2000) company car tax
(2000)
25% VAT exemption
on leasing (2015)
20Scandria®2Act Clean Fuel Deployment Strategy
Interreg Baltic Sea Region Project
Funding of charging 25% VAT exemption
infrastructure on leasing (2015)
(various programmes
Programme for
over several years)
funding professional
Programme for fuel cell vehicles
funding professional (Enova, since 2017)
electric light and
Financial support for
heavy duty vehicles
the expansion of
(Enova, 2017)
hydrogen refuelling
Increased scrap stations
refund of up to ca. (2017)
€1,500 (up to 13,000
Increased scrap
NOK) when replacing
refund of up to ca.
an LDV using fossil
€1,500 when replacing
fuels with a zero-
an LDV using fossil
emission vehicle
fuels with a zero-
(2018)
emission vehicle
(2018)
Regulatory Access to bus lanes Access to bus lanes
instruments for BEVs.* for FCEVs
(since 2005) (since 2005)
Soft No central coordinated soft instruments regarding clean vehicles
instruments
Table 4: Policy instruments for alternative fuels in Norway
* Some instruments are being reduced. Municipalities can decide whether BEVs and FCEVs should pay for
parking; counties can decide the same with regard to ferries. In some cities, BEVs are allowed access to bus
lanes in rush hours only and with two or more persons in the vehicle.
21Scandria®2Act Clean Fuel Deployment Strategy
Interreg Baltic Sea Region Project
Sweden
In terms of population, Sweden is the biggest country in Scandinavia. The population density is
substantially higher in the south than in the north, and about 85% of the population live in urban
areas. The government plans to achieve a 70% reduction of emissions from the transport sector
by 2030 compared to 2010, and 0% net emissions of greenhouse gas by 2045.
Population: 10,128,320
Area: 438,600 km²
Population density: 23.8 people per km²
Gross domestic product: 465,186 Mio. €
Length of road network: 216,482 km
Motorways: 2,013 km
Main or national roads: 13,507 km
Secondary or regional roads/other roads: 82,988 / 117,974 km
Total vehicles (2015): 5,279,391
Total commercial vehicles: 610,328
Passenger cars: 4,669,063
Light commercial vehicles: 516,168
Medium and heavy commercial vehicles: 80,046
Buses: 14,114
By fuel type:
Petrol Diesel Electric Hybrids LPG/CNG Other
(incl. plug-
in)
Passenger
68.7% 29.8% 0.1% 0.3 % 0.3% 0.8%
Cars
LCV 11.2% 86.9% 0.2% 0.00% 0.8% 0.8%
MCV &
1.2% 94.3% 0.02% 0.02% 2.5% 1.9%
HCV
22Scandria®2Act Clean Fuel Deployment Strategy
Interreg Baltic Sea Region Project
Targets according to the Swedish national policy framework:
The overall target is the Climate Law adopted by the Parliament in 2017. It
defines a climate reduction pathway, with no net contribution of CO 2 by
2045. The only sector target is for transport, 70% CO2 reduction by 2030
compared to 2010.
Two different long-term policies were put in place on 1 July 2018 that will
have a strong impact on cars and on fuels on the market:
Sweden introduced a bonus/malus system, providing a bonus for vehicles
with registred emissions below 60 grammes CO2/km (BEV, PHEV and
CNG cars), and a penalty for vehicles emitting more than 120 grammes.
A reduction mandate for all fuels was introduced on the same date,
mandating fuel providers to blend in biofuels so as to lead to a
predetermined CO2 reduction. The target is set according to the CO2
reduction, not specific blending levels. The targets start at 19.3% for diesel
fuels, and 2.6%. for gasoline. By 2030, the CO2 reduction mandate will be
40%.
In 2018 the Swedish Government decided that by 2020 all fuel pumps must
have a label detailing the origin, climate impact and raw material base for
all fuels.
Vehicle tax is calculated based on CO2. As more electric and biofuel cars
enter the market, it will have to change to a distance-based tax. This is
being investigated.
There are no specific targets for BEV, PHEV, hydrogen or methane cars.
For heavy trucks and goods movement, a road tax is being discussed that
will incentivise trucks with alternative fuels, used outside densely populated
areas, and that will also target and incentivise modal shifts to rail and ship.
Sources: (Eurostat, 2017b; European Union, 2016; Eurostat, 2015, 2017a; ERF, 2016; ACEA,
2017a)
23Scandria®2Act Clean Fuel Deployment Strategy
Interreg Baltic Sea Region Project
Battery electric vehicles Hydrogen fuel cell Natural gas/biogas
vehicles
Financial Super-green car Super-green car Super-green car
instruments rebate as a subsidy rebate as a subsidy rebate as a subsidy
for the purchase of for the purchase of for the purchase of
vehicles with vehicles with vehicles with
maximum 120g CO2 maximum 120g CO2 maximum 120g CO2
emissions (2012–June emissions (2012–June emissions (2012–June
2018, replaced by 2018, replaced by 2018, replaced by
bonus/malus system) bonus/malus system) bonus/malus system)
The vehicle tax is The vehicle tax is The vehicle tax is
calculated on the calculated on the calculated on the
basis of the amount of basis of the amount of basis of the amount of
CO2 emissions. Until CO2 emissions. Until CO2 emissions
2018 alternative- 2018 alternative- (different components
fuelled vehicles, or fuelled vehicles, or of this tax have
BEVs or PHEVs, were BEVs or PHEVs, were different start and end
exempt from vehicle exempt from vehicle dates). Until 2018
tax for five years. This tax for five years. alternative-fuelled
measure was vehicles, or BEVs or
A bonus/malus system
abolished when PHEVs, were exempt
where vehicles
bonus/ malus was from vehicle tax for
emitting more than
introduced on 1 July five years.
90g CO2/km or more
2018.
than 140g CO2/km A bonus/malus system
The taxable value of a must pay a higher tax, where vehicles
company car is while vehicles emitting emitting more than
reduced by 40% less than 60g CO2/km 90g CO2/km or more
compared with the pay a lower tax. July than 140g CO2/km
nearest comparable 2018 – no end date. must pay a higher tax,
conventional car, up to while vehicles emitting
Action program
a maximum of 10,000 less than 60g CO2/km
(Klimatklivet) that
SEK (ca. €1,000) per pay a lower tax.
supports reduced
year Vehicles running on
emissions of CO2 at a
(2017–2020) gas get a fixed bonus
local level, for
(€1,000). July 2018 –
A bonus/malus system example through the
no end date.
where cars with zero rollout of alternative
emissions receive fuels infrastructure Action program
SEK 60,000 in (from 2015 until 2020). (Klimatklivet) that
bonuses. This bonus supports reduced
decreases emissions of CO2 at a
proportionately for local level, for
every gram of CO2 – example through the
down to SEK 10,000. rollout of alternative
The measure was fuels infrastructure, or
introduced on 1 July by covering part of
2018, with no end extra cost of
date. alternative fuels
vehicles
24Scandria®2Act Clean Fuel Deployment Strategy
Interreg Baltic Sea Region Project
Action program (from 2015 until
(Klimatklivet) that 2020).
supports reduced
Biofuels for vehicles
emissions of CO2 at a
are exempted from
local level, for
energy and carbon
example through the
dioxide tax
roll-out of alternative
(temporary agreement
fuels infrastructure
with the European
(from 2015 until 2020).
Commission until
Programme to support 2020)
charging stations in
The taxable value of a
private houses with
company car is
50% of installation and
reduced by 40%, up to
50% of equipment
a maximum of 10,000
costs up to a
SEK (ca. €1,000) per
maximum of 10,000
year (until 2019)
SEK (ca. €1,000) per
house. (2018 – no end
date)
Purchase subsidy for
electric buses >30
passengers (2016–
2023).
Regulatory Environmental zones for heavy vehicles (no end period):
The Government has set out criteria for environmental zones for cars (they have
instruments
existed for heavy trucks since 1996 in the larger cities). Three zones can be
implemented: Zone 1 for all cars; Zone 2 limited to Euro 5 diesel or cleaner
vehicles from 2020, and to Euro 6 only after 2022; and Zone 3, for zero-emission
vehicles and methane cars only (Euro 6). The implementation is voluntary..
Refuelling stations selling more than 1,500 m³ of fuel must provide at least one
type of alternative fuel (2005–no end period). Historically these have been E85
(ethanol) pumps, however with a declining market for flexifuel vehicles, this will
be discussed.
Soft There are two notable initiatives from the private sector that support the
instruments development of clean fuel vehicles:
o The 2030 Secretariat is a coalition of 80 industrial stakeholders,
catalysing developments in the areas of biofuels, vehicle technologies
and responses towards the 2030 target of 70% GHG reductions vs 2010.
o Fossil Free Sweden is a private-sector initiative based on the decision by
the Parliament to make Sweden climate-neutral by 2045. The Fossil Free
Sweden initiative has encouraged business sectors to draw up their own
roadmaps to show how they will become fossil-free while also increasing
their competitiveness.
25Scandria®2Act Clean Fuel Deployment Strategy
Interreg Baltic Sea Region Project
From 1 January 2019, new Swedish legislation will be introduced stipulating that
all fuels should be labelled with climate effect and country of origin. This labelling
is to be displayed at the refuelling and charging stations. Sweden will thus
become the first country in the world with this kind of requirement to show source
information on fuels.
Table 5: Policy instruments for alternative fuels in Sweden
4 Assessment of selected policy instruments to stimulate Clean Fuels
The present analysis is intended to focus on the identification and evaluation of efficient policy
instruments in the transport sector. From an academic point of view, the success of a policy
instrument is measured by its cost and effectiveness. Further, it is meaningful to evaluate the extent to
which the instrument is accepted and appreciated by the market participants, i.e. producers and
consumers. Time plays a crucial role for both: the lead time to establish the instrument as well as the
effective period.
Efficient instruments should substantially contribute towards reducing GHG emissions. Accordingly,
the higher the proven or expected GHG reductions of an instrument are, the more the instrument can
be assessed as being effective. In order to rate an instrument not only as effective, but also efficient,
the cost of such an instrument must be considered. Thus, particularly efficient instruments have low
costs in relation to the size of their impact on GHG emission reduction.
However, a correct assessment of an instrument’s effectiveness turns out to be challenging.
Environmental or market trends are never monocausal and it is thus hard to argue that only the
application of an instrument led to a certain development. As a consequence, an assessment can only
be an approximation to the instrument’s actual impact. Besides internal factors such as other policies
(taxes, subsidies), external factors like oil/gas prices and technological innovations can also influence
GHG emission and market developments.
Definition of criteria
The following table is a preliminary qualitative assessment to provide the reader with an overview of
the most powerful actions to support clean fuel deployment in the Scandria countries. The selected
instruments are part of a broader policy designed to increase the uptake of alternative fuels and
ultimately reduce harmful emissions. They are assessed by the means of the following criteria: cost,
effect, acceptance and time to point out their advantages and disadvantages. Thus by comparing
political efforts in different countries in relation to their success, it is possible to estimate their initial
transferability to other regions or countries.
Cost: The cost of introducing the instrument in monetary terms. “++” implies an inexpensive solution.
The instruments’ cost can result from direct payments such as subsidies or reduced tax revenues.
Effect: The effect is defined as the instrument’s grade of accomplishing the desired result. In other
words, it is the level of measurable impact by the instrument, e.g. increasing new alternative vehicle
registrations. A high effect is labelled “++”.
26Scandria®2Act Clean Fuel Deployment Strategy
Interreg Baltic Sea Region Project
Acceptance: The instrument’s acceptance is the extent to which the measure is approved by the
general public and policy makers. In this regard “++” means a high level of acceptance.
Time: This indicator describes the time from designing the policy instrument until implementation. “++”
means an ideally short duration.
The assessment according to the above categories is based on a survey of existing literature,
comprising existing meta-analyses such as (Hardman et al., 2017) as well as primary sources. A non-
exhaustive list of references for each instrument can be found in the table below. The qualitative
assessment below has been complemented by a survey of transportation experts in the respective
region or country. The table includes a selection of measures in the respective countries and regions,
but is not exhaustive. Some recent measures have not been included, as it is too early to evaluate
their effect (e.g. LNG/BEV HDV subsidy in Germany, bonus/malus system in Sweden).
+ + = very positive, + = positive, o = medium, - = negative, - - = very negative
Assessment of selected instruments on national level
Battery electric vehicles and plug-in hybrid electric vehicles
Purchase subsidies/tax rebates
Acceptance
Effect
Time
Cost
Literature
Reduced registration tax for BEVs -- ++ + -- (Electrek, 2017)
Purchase subsidies for BEVs for - + + o (IEA, 2018a, p. 28)
municipalities and companies
CO2-based vehicle registration tax + + ++ o (Ministry of Transport and
Communications, 2017,
p. 27; INSERO, 2018,
p. 24; IEA, 2018a, p. 21;
ACEA, 2017b, p. 88 ff)
Subsidy for the purchase of BEVs - o + o (BAFA, 2017, 2018;
Tietge, 2016)
No registration taxes on BEVs, reduction for -- ++ + o (Figenbaum et al., 2014;
PHEVs Fearnley et al., 2015;
Haugneland et al., 2017;
Exemption from VAT on purchase for BEVs -- ++ + o
IEA, 2018a, p. 21;
Figenbaum,
Kolbenstvedt, 2015,
2016; Tietge et al., 2016;
27Scandria®2Act Clean Fuel Deployment Strategy
Interreg Baltic Sea Region Project
Bjerkan et al., 2016;
Norsk Elbilforening,
2017)
Purchase tax rebate for “super-green cars” -- ++ o -- (ICCT, 2017; IEA, 2018a,
p. 21)
Bonus/malus for new cars ++ ++ + - Own assesement on the
basis of partner
information
Table 6: Purchase subsidies and tax rebates for BEVs & PHEVs in Scandria countries
Vehicle ownership taxes
Acceptance
Effect
Time
Cost
References
Exemption of BEVs from annual vehicle tax o + + o (Electrek, 2017;
(subsequent phase-out) Sierzchula et al., 2014)
CO2- and weight-based vehicle ownership o o + ++ (Ministry of Transport and
tax Communications, 2017,
p. 27; IEA, 2018a, p. 26)
Exemption from vehicle ownership tax o o + o (ACEA, 2017b, p. 105;
Deutscher Bundestag,
2016; Harendt et al.,
2017, p. 145)
Reduced vehicle ownership tax for BEVs o + o o (Figenbaum et al., 2014;
Fearnley et al., 2015;
Haugneland et al., 2017;
IEA, 2018a, p. 21;
Figenbaum,
Kolbenstvedt, 2015;
Tietge et al., 2016;
Bjerkan et al., 2016;
Norsk Elbilforening, 2017;
Figenbaum,
Kolbenstvedt, 2016)
Lower tax for bonus cars and biofuel cars ++ + + + Own assesement on the
from year four in the bonus/malus model basis of partner
information
Vehicle ownership tax exemption for five o + + o (IEA, 2018a, p. 26;
years after registration INSERO, 2018)
Table 7: Vehicle ownership taxes for BEVs & PHEVs in Scandria countries
28Scandria®2Act Clean Fuel Deployment Strategy
Interreg Baltic Sea Region Project
Charging infrastructure
Acceptance
Effect
Time
Cost
References
Income tax relief for home charger o + + + (IEA, 2018a, p. 51)
installation costs
Energy tax rebate for EV charging for + + + o (Noel et al., 2017)
businesses
Subsidy for investment in charging o o + + (International Energy
infrastructure Agency, 2018, p. 51)
Subsidy for charging Infrastructure - + + - (BMVI, 2017, 2018; Hall,
Lutsey, 2017)
Funding of charging infrastructure - + o o (Hall, Lutsey, 2017;
Lorentzen et al., 2017;
Norsk Elbilforening,
2017)
Subsidy for investment in charging - + + o (IEA, 2018a, p. 53;
infrastructure Langbroek et al., 2016)
Table 8: Subsidies for charging infrastructure in Scandria countries
Tolls, parking, access and other instruments
Acceptance
Effect
Time
Cost
References
National funding programme by the Danish o + + + Own assesement on the
Energy Agency for projects related to EVs basis of partner
information
Government allows municipalities to exempt o o - o (IEA, 2018a, p. 27)
EVs from parking fees
No fees on toll roads for BEVs - + + o (Aasness, Odeck, 2015;
Mersky et al., 2016;
No fees on ferries for BEVs o o o o
Norsk Elbilforening,
Free municipal parking for BEVs - o + o 2017)
Access to bus lanes for BEVs + + + o
29You can also read