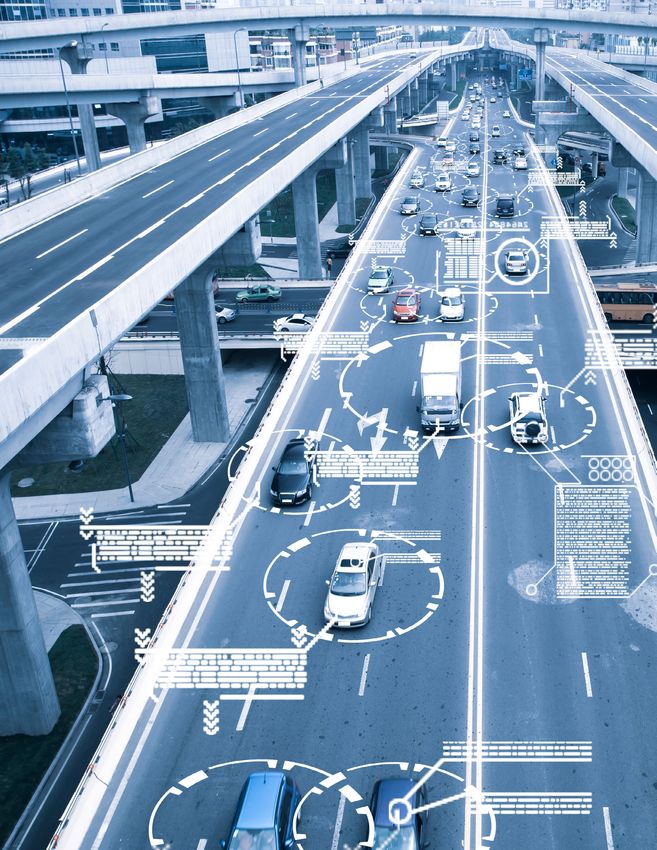
DRIVING A SHARED, ELECTRIC, AUTONOMOUS MOBILITY FUTURE - What China, India, and the United States Can Learn From Each Other
←
→
Page content transcription
If your browser does not render page correctly, please read the page content below
MOUN
      KY

             TA
ROC

  IN           IN
       STIT UTE

DRIVING A SHARED,
ELECTRIC, AUTONOMOUS
MOBILITY FUTURE
What China, India, and the United States Can Learn From Each Other

BY GARRETT FITZGERALD AND RICHARD LI
“China and India have two of the fastest
developing economies in the world and
aspire to become global leaders in vehicle
manufacturing and intelligent mobility
technologies. Understanding how these
countries are playing roles in shaping the
global mobility future is the first step to
ensuring a clean, efficient, and low-cost
mobility future.”

AUTHORS & ACKNOWLEDGMENTS
AUTHORS
Garrett Fitzgerald and Richard Li

* Authors listed alphabetically. All authors from
Rocky Mountain Institute unless otherwise noted.

ADDITIONAL CONTRIBUTORS
Edward Klock-McCook, Rocky Mountain Institute

CONTACTS
Garrett Fitzgerald, gfitzgerald@rmi.org
Richard Li, rli@rmi.org

SUGGESTED CITATION
Li, Richard and Garrett Fitzgerald. Driving A Shared,
Electric, Autonomous Mobility Future: What China,
India, and the United States Can Learn From Each
Other. Rocky Mountain Institute, 2019. https://rmi.
org/insight/driving-a-shared-electric-autonomous-
mobility-future/

Images courtesy of iStock unless otherwise noted

ABOUT ROCKY MOUNTAIN INSTITUTE
Rocky Mountain Institute (RMI)—an independent nonprofit founded in 1982—transforms global energy use to
create a clean, prosperous, and secure low-carbon future. It engages businesses, communities, institutions, and
entrepreneurs to accelerate the adoption of market-based solutions that cost-effectively shift from fossil fuels to
efficiency and renewables. RMI has offices in Basalt and Boulder, Colorado; New York City; the San Francisco Bay
Area; Washington, D.C.; and Beijing.
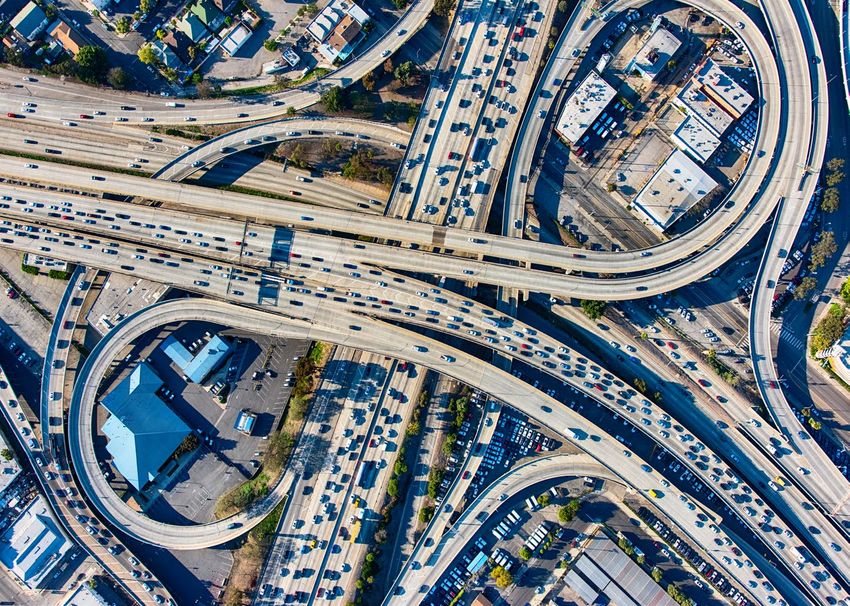
TABLE OF CONTENTS

 1                                     2                                   3                                    4                                    5

EXECUTIVE SUMMARY.................................................................................................................................... 05

1: THE RISE OF PERSONAL VEHICLES.......................................................................................................... 11
Transportation Modes of Choice...................................................................................................................................12
Why Personal Vehicles Are Not a Scalable Solution......................................................................................................14
The Future of Personal Vehicles....................................................................................................................................15

2: THE POTENTIAL OF SHARED, ELECTRIC, AUTONOMOUS MOBILITY SERVICES (SEAMS).... 17
What Are SEAMS?.........................................................................................................................................................18
Advantages of SEAMS................................................................................................................................................ 20
Implementing SEAMS................................................................................................................................................. 20

3: ELECTRIC VEHICLES (EVS)..........................................................................................................................22
EV Adoption.................................................................................................................................................................23
Key Drivers...................................................................................................................................................................24

4: SHARED MOBILITY SERVICES...................................................................................................................36
Mobility Services Adoption.......................................................................................................................................... 37
Key Drivers...................................................................................................................................................................38

5: AUTONOMOUS VEHICLES......................................................................................................................... 47
AV Adoption.................................................................................................................................................................48
Key Drivers...................................................................................................................................................................49

6: CONCLUSION..................................................................................................................................................56

ENDNOTES............................................................................................................................................................59
SECTION TITLE WHEN THERE IS NO HEADLINE ON THIS PAGE

EXECUTIVE SUMMARY
 SECTION TITLE
 SECONDARY TITLE
 Third level title
 Fourth level title

 Text, text, text, text

 • The First Tier Bullet point example text, text, text,
   text , text, text, text, text, text, text, text, text
   • Second Tier Bullet. Text, text, text, text , text, text,
     text, text, text, text, text, text
       •Third Tier Bullet point example. Text, text, text,
        text , text, text, text, text, text, text, text, text

 • Next Bullet point will have a hard enter between the
   previous when it’s two lines or longer.

 Short Bullets
 • When it just
 • One word or on
 • 1 line they don’t need that
 • Space

                                                                                                     REPORT TITLE | 5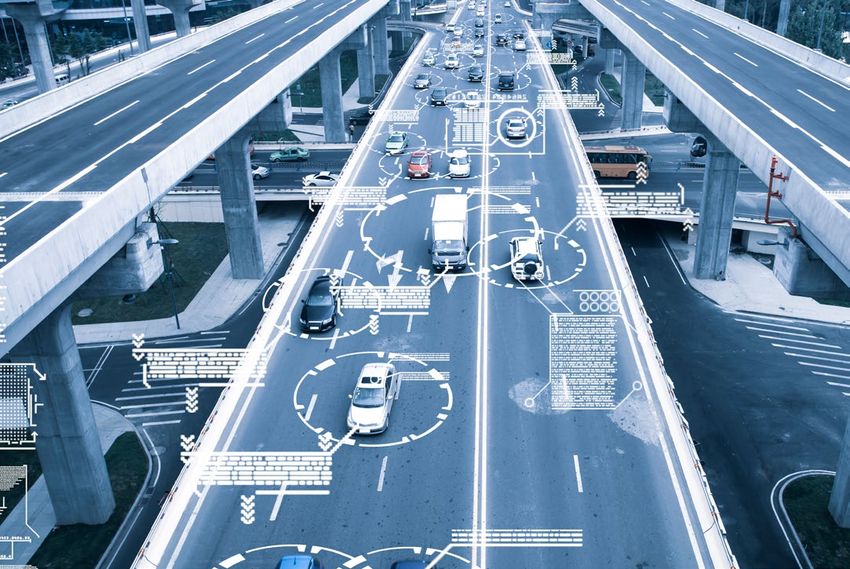
EXECUTIVE SUMMARY
     The global mobility ecosystem has been under a               China and India have two of the fastest developing
     continual state of evolution for the past century,           economies in the world and aspire to become global
     transitioning from a reliance on animal- and human-          leaders in vehicle manufacturing and intelligent
     powered vehicles to gas-powered vehicles, and now            mobility technologies. Understanding how these
     moving toward shared and electric vehicles. While the        countries are playing roles in shaping our global
     rate of this transition and the key drivers behind it vary   mobility future is the first step to ensuring we get the
     in different regions of the world, there are important       best mobility future possible.
     observable trends that are common globally, some of
     which benefit society and others which have negative         In this report we evaluate how mobility ecosystems are
     consequences. Identifying these trends and learning          evolving in three fast changing markets: China, India,
     how they apply differently in different regions enables      and the United States. Specifically, we evaluate the
     us to proactively shape the new mobility paradigm in         role of policy, economics, infrastructure, and behavioral
     a way that works for rather than against people and          norms in shaping the mobility transformations in these
     the climate.                                                 three countries. The result of this multi-region and
                                                                  multivariate evaluation provides insights into how society
     Personal vehicle ownership continues to grow                 can be proactive at shaping the future of mobility.
     globally, improving personal mobility but also
     contributing to congestion and pollution, particularly
     in dense urban areas. At the same time, there has            The Three Markets
     been an uptake in the use of mobility services such          China has seen great success in kick-starting its
     as Ola, Lyft, Uber, and Didi as well as new micro            transition to an electrified transportation future and is
     mobility such as e-scooters, bikeshares, and other           slowly phasing out subsidies as EV growth becomes
     light vehicles. As the rate of urbanization continues to     more organic and market driven. China is now focusing
     increase, the demand for urban mobility also rises—          on autonomous vehicles (AVs), with a supportive
     putting greater stress on already overburdened               national-level policy and clear framework for road
     systems potentially leading to more traffic, worsened        testing. China’s head start on electric vehicles, its
     air quality, more space taken for streets and parking,       supportive AV policy, and its willingness to utilize
     and less convenient travel.                                  congestion-reducing taxes and regulations puts it
                                                                  on a good path toward a future of shared, electric,
     Vehicle electrification addresses pollution issues (noise,   connected, and eventually autonomous mobility.
     particulate matter, and carbon dioxide) and can enable
     a more flexible electric grid that integrates renewables,    The United States has made some progress with
     but electrifying vehicles creates a need for new charging    electric vehicles due to state-level efforts and a
     infrastructure and does not help lessen congestion           moderate federal rebate program, but the lack of
     on its own. Autonomous vehicle technology has the            a robust approach leveraging both push and pull
     long-term potential to truly disrupt the current mobility    policies has caused the US EV market to fall behind
     paradigm—but the result of that disruption may not           China’s. However, the United States is leading the
     benefit society equally and in fact could result in less     pack in the development of autonomous vehicle
     equitable access, more congestion, and more pollution.       technology—even though public perception of the
     Ensuring that rides in autonomous vehicles are both          technology has been tepid. Unfortunately, there has
     electrified and pooled can mitigate these congestion         been minimal demonstrated success in increasing
     and pollution issues and provide reliable, low-cost          the pooling and sharing aspect of the new mobility
     mobility for a rapidly urbanizing society.                   paradigm. In fact, in some denser cities ridehailing has

6 | ROCKY MOUNTAIN INSTITUTE
EXECUTIVE SUMMARY

lowered transit ridership and increased congestion,         Recommendations and Takeaways
while in other cities with more urban sprawl personal       Electric vehicles
car ownership continues to be the default mode of           • Falling battery costs will bring EVs to price parity
transportation. The United States can take a lesson           with combustion vehicles in the next 5–10 years
from China and India and apply national and local             across all three countries. While prices will naturally
policies to increase the level of sharing and pooling,        fall as scale and learning continues, supportive
in addition to electrification across the mobility            policies are needed to accelerate this transition and
service ecosystem.                                            help overcome behavioral norms that bias toward
                                                              gas vehicles and the advantages of already-built
While India has the lowest rate of car ownership              fueling infrastructure.
of these three countries today, that statistic is
changing rapidly as a result of urbanization and            • A set of coordinated but distinct policies targeting
economic growth. However, the Government of                   both automakers and consumers with a healthy
India has wisely taken a tip from China’s success             balance of rewards and punishments has proven to
on comprehensive policy and has implemented a                 be most effective in China. However, each country
national EV policy, FAME II. The rates of ridesharing         has different capacities and appetites for top-down
and pooling are already higher in India but it has            mandates versus subsidies and incentive packages.
taken an approach that for the near term will leave
out autonomous technology from its mobility future.         • Adopting a uniform, national EV-sales mandate to
Although autonomous technology appears to be a                send a clear message to automakers to scale up
key milestone for mobility service really taking hold in      production—as has been done in China—can be
the United States and China it appears to be less of          effective across all countries.
a necessity in India, owing to the lower cost of labor
relative to the capital and operational costs of vehicles   • Focusing finite EV subsidies on high-utilization vehicles
and infrastructure.                                           —as has been done in India—allows for the greatest
                                                              leverage of public funds to increase electric vehicle
Since each of these countries is at a different stage         miles while creating broad public exposure to EVs.
of development in these emerging technologies, they
have the opportunity to share learnings and adapt           • A coordinated and collaborative approach to
each other’s frameworks to accelerate the global              charging infrastructure investment and buildout that
mobility transition, as summarized in Exhibit ES2.            engages public and private sectors across both the
                                                              transportation and electricity sectors is required for
                                                              quick and efficient deployment of infrastructure at
                                                              the level required to support rapid EV adoption.

                                                                   DRIVING A SHARED, ELECTRIC, AUTONOMOUS MOBILITY FUTURE | 7
EXECUTIVE SUMMARY

     Shared mobility                                             Autonomous vehicles
     • Encouraging pooling and electrification of ridehailing    • Establishing uniform, national guidelines around AV
       through tiered taxes and incentives can minimize the        testing to provide a clear pathway to production by
       impact on congestion and air quality and can help           AV companies will create greater confidence in the
       overcome the strong behavioral preferences for              market and improve public perception.
       single occupancy rides.
                                                                 • Encouraging electrification and pooling for AVs
     • Ridehailing services will thrive in dense, urban            through tiered taxes, to avert congestion and air
       environments where they are competitive with the            quality issues, will help to avoid potential negative
       price and convenience of personal vehicles and              side effects of low-cost AV mobility services.
       can be integrated with public transit (buses, rail, and
       subways) and nonmotorized transit modes.                  • Creating liability standards and vehicle monitoring
                                                                   protocols can help avoid fatal accidents and instill
     • China and India have the potential to leapfrog the          public confidence.
       American paradigm of car ownership, due to their
       rapid urbanization and less entrenched car culture.       • China’s funding and research into AV technology will
                                                                   likely accelerate the pace of AV development globally.
     • Ridehailing services have the potential to both
       reduce congestion (through pooling) and integrate         If adopted in isolation, each of these technologies can
       with public transit systems to increase ridership and     potentially create new problems and unnecessary
       enable better transit services. Well-designed policies    additional external cost to consumers in the form of
       should encourage ridehailing companies to develop         congestion, pollution, and added cost. Various policies
       products that meet these goals, instead of emulating      have been implemented to minimize these issues
       the single-occupancy private vehicles that they           and encourage synergistic benefits, however current
       sought to replace.                                        policy is proving insufficient. Ensuring that rides in
                                                                 autonomous vehicles are both electrified and pooled
     • Shared mobility must be well integrated with existing     can mitigate these congestion and pollution issues
       public transit infrastructure and should be part of       and provide reliable, low-cost mobility for a rapidly
       future transit planning processes. Increased use of       urbanizing society. A summary of policies and industry
       public private partnerships should be encouraged          developments that encourage the codevelopment of
       to ensure an efficient use of public resources and        EVs, AVs, and mobility as a service (MaaS) is shown in
       private investment.                                       Exhibit ES1.

8 | ROCKY MOUNTAIN INSTITUTE
EXECUTIVE SUMMARY

Technology integration and co-development                        • Electric vehicles are quickly gaining market share
• There is huge interest in AV development, due to                 in the United States and China with India in a
  cost savings in transporting goods and people.                   position to follow fast, especially for two- and three-
  However, if AVs are not electric, they will worsen               wheelers. Without adequate and collaborative
  pollution; if they are not shared or regulated, they             planning among utilities, regulators, policymakers,
  will worsen congestion.                                          and the private sector there is potential for inefficient
                                                                   or insufficient investment in charging infrastructure. If
• Shared mobility companies are also battling to enter             done in isolation of the needs of the electricity system,
  new markets globally. But if they are not electric,              mass adoption of EVs could result in significant added
  they will worsen pollution; if they are not shared,              costs that could easily be avoided with intelligent and
  they will worsen congestion.                                     forward-looking planning processes.

EXHIBIT ES1
Policies and Industry Developments that Encourage the Co-Development of EVs, AVs, and MaaS

                                        Synergies
                                                                                                  SEAMS Support
             EV + AV                    AV + MaaS                    EV + MaaS

             In San Francisco,          In Michigan and San          California has          Medium EV
             the proposed AV tax        Francisco, proposed          implemented ridehailing Mixed AV
 United      is lower for electric      AV taxes are lower for       emissions standards.    Mixed MaaS
 States      vehicles. Currently, 67%   shared rides.                                        Minimal Pooling
             of testing miles are
             electric (Waymo, GM).

             AVs are likely to be       NA                           High EV penetration          High EV
             electric due to a                                       in existing ridehailing      High AV
 China
             maturing EV market and                                  fleets due to                Medium MaaS
             registration restrictions.                              registration restrictions.   Minimal Pooling
             NA (AV testing not         NA (AV testing not           EV subsidies are limited     High EV
             allowed on public          allowed on public            to 4-wheelers used for       AV Testing Prohibited
 India
             streets)                   streets.)                    commercial purposes.         High MaaS
                                                                                                  No Pooling

                                                                       DRIVING A SHARED, ELECTRIC, AUTONOMOUS MOBILITY FUTURE | 9
EXECUTIVE SUMMARY

     EXHIBIT ES2
     What Countries Can Learn From and Share With Each Other to Accelerate Adoption

                                       Shared Learnings Between Countries
                 EV                                   AV                                 MaaS

                 China’s national New Energy          China’s AV companies are           US ridehailing companies can
                 Vehicle mandate was modeled          opening US offices to attract      borrow from China an integrated
                 after California ZEV. The            talent while US companies are      ride booking system that
      United     United States can adopt a            testing vehicles on Chinese        incorporates public transit and
      States &
                 more comprehensive policy            roads to accelerate their          bikeshare as part of a multimodal
      China
                 framework from China with            technology development.            journey.
                 clear benchmarks for bringing
                 EVs to market.
                 India took a tip from from           India can look to China for        China and India have many
                 China’s national level EV policy     guidance on implementing           rapidly urbanizing, dense
                 approach. China can adapt            AVs if and when India revises      cities that are well suited for
                 India’s prioritization of support    laws that prohibit AV testing.     mobility services integrated with
      China &
                 for commercial EVs and include       Public perception of AVs           public transit. A robust policy
      India
                 a component of ridepooling to        in China and India is more         framework can shift the course
                 encourage higher load factors.       supportive than in the United      of development toward pooled
                                                      States.                            rides and away from personal
                                                                                         vehicles.
                 The United States can borrow         India can take a tip from the US   India can borrow from the US
                 from India’s policy framework        experience of implementing         emerging tiered tax structures on
                 and target high mileage              AVs if and when India revises      MaaS providers to create market
      United     commercial vehicles for              laws that prohibit AV testing.     incentives that favor higher
      States &
                 electrification first resulting in                                      load factors.
      India
                 both favorable economics for
                 the operator and more vehicle
                 miles electrified.

10 | ROCKY MOUNTAIN INSTITUTE                                             DRIVING A SHARED, ELECTRIC, AUTONOMOUS MOBILITY FUTURE | 10
1 THE RISE OF PERSONAL VEHICLES
Image: pxhere.comTHE RISE OF PERSONAL VEHICLES
With the rapid development and globalization of China’s TRANSPORTATION MODES OF CHOICE
and India’s economies, consumers in these countries Personal vehicles dominate transportation in US
are following in the footsteps of the United States and cities, while public transit and non-motorized transit
demanding personal vehicles to improve their mobility have a larger modal share in Chinese and Indian
and convenience. cities. Nonetheless, personal vehicle ownership is
rising rapidly in China and India, and could approach
Access to reliable transportation has significant impacts US levels within a few decades. In the chart below
on employment opportunities, healthcare outcomes, we present the modal split by vehicle type in each
and social mobility. However, personal vehicles are country. While 3-wheelers are technically not a public
not the optimal solution in these rapidly urbanizing transit mode we include them in a public transit
countries, which are facing mounting issues with category in India due to the nature of how they are
congestion, air quality, and affordability. In this report used in the mobility ecosystem.
we explore how personal mobility is evolving in India,
China, and the United States, and the underlying drivers
of change that have informed the direction and pace of
mobility transformation globally.
EXHIBIT 1:
Transportation Methods Used in Large Cities in the Three Countries
100%
Personal Vehicle
18% 2-Wheelers Public Transit
29% Bike
75%
10% 4-Wheelers Walk
7% 3-Wheelers
78%
Modal Share
50% 40% 33%
10% 10%
25%
17%
21% 24%
1%
0% 4%
China1 India2 United States3
Note: Sums may not total 100 due to rounding.
12 | ROCKY MOUNTAIN INSTITUTETHE RISE OF PERSONAL VEHICLES
EXHIBIT 2
Annual Vehicle Sales in the Three Countries
40
China4
4-Wheelers
India5
Annual Vehicle Sales (in Millions)
30
17% Car Ownership 2- and 3-Wheelers
China6
2-Wheelers
10% 2-Wheeler
Ownership
20
United States7
4-Wheelers
76% Car Ownership
19% 2-Wheeler Ownership
10 India8
4-Wheelers
9% Car Ownership
0
2010 2015 2020 2025 2030
United States
Transportation in the United States has been dominated Car sales in the United States have consistently
by personal vehicles—cars in particular—for over a exceeded 10 million vehicles per year since 1960.
century. Once-ubiquitous streetcars were abandoned in However, sales have flattened recently, due to the
the mid-20th century with the rise of automobile, oil, and recession and weaker overall demand. This shift
tire manufacturers. The Eisenhower-era federal interstate has been attributed to a variety of factors, including
highway system, established in 1956, cemented the increased congestion, the cost of cars, a reversal of
role of private automobiles for long distance travel. urban sprawl, and a cultural shift from asset ownership
Today, the majority of American cities and towns are to technology-driven services and sharing, especially
designed around the use of cars. With few competing among the younger generation in dense urban areas.
transportation options, the personal car has emerged as
the standard for mobility in the United States.
DRIVING A SHARED, ELECTRIC, AUTONOMOUS MOBILITY FUTURE | 13THE RISE OF PERSONAL VEHICLES
China WHY PERSONAL VEHICLES ARE NOT A
Once known as the bicycle kingdom, China has largely SCALABLE SOLUTION
followed in the footsteps of the United States—increasing The current mobility paradigm—characterized by
reliance on private vehicles. In Beijing, bicycle rides once privately owned, single-occupancy vehicles—is
accounted for 58% of commutes in 1986, but have now expensive, polluting, unsafe, and inefficient, but
plummeted to less than 10%. With the rapidly growing alluringly convenient.
economy and influx of wealth, car ownership has become
associated with freedom and social status, and represents Expensive
an aspiration for many Chinese citizens. In the United States, the average cost of owning and
operating a vehicle is over $8,400/year, including
China’s passenger car sales have increased rapidly depreciation, maintenance and repair, fuel, and
over the past decade, surpassing the United States in insurance. This makes transportation the second-
2010 to become the largest global auto market. While largest expenditure for American households (after
two-wheelers remain common in rural areas of China, housing), and presents a disproportionate burden on
sales have fallen significantly due to strict restrictions on low-income households. Without strong alternatives
registration and road usage in an attempt to curb mounting for transportation in most metropolitan areas, low-
congestion and pollution in large cities. Nevertheless, car income Americans are forced to either bear the cost
ownership per capita in China (17%) is still only a fraction of of car ownership or suffer a significant loss in mobility.
that in the United States (76%). This leaves plenty of room This mobility gap is even more prominent in China and
for growth, fueled by the rising middle class. However, if India because of even greater income inequality and
car ownership rates in China even remotely approach US significantly lower average incomes than that in the
levels, there would be profound implications for China’s United States.i Since access to reliable transportation
mounting congestion and air quality issues. has significant impacts on employment opportunities,
healthcare outcomes, and social mobility, improving
India access to transportation can have cascading benefits
India has also seen growth in vehicle sales driven by for the most vulnerable members of society. But since
rapid urbanization and economic growth. India’s roads are these three countries are so large, the sheer number
shared by a diverse set of motorized vehicles, including of middle- and upper-class buyers is still huge—and
scooters and motorcycles (two-wheelers), auto-rickshaws cars are in their sights.
(three-wheelers), and passenger vehicles (four-wheelers).
Two-wheelers are expected to continue their growth, Polluting
driven by their affordability and maneuverability through Transportation emissions (especially from diesels and
congested roads. older cars) are a major contributor to air pollution,
which has become a leading public health concern in
The four-wheeler market is dominated by small vehicles large cities around the world. Air pollution is strongly
(below $10,000), but even these have historically fallen linked to cardiovascular disease, and accounted for
outside of the price range of most Indian drivers. However, more than 1.2 million premature deaths in China in
this gap is shrinking with improved job opportunities and 2013. In the 20 largest cities in both India and China,
disposable income. particulate levels routinely fall into the unhealthy
i
Average income is $8,690/year in China, $1,800/year in India, and $58,270/year in the United States. While car ownership
costs will also be lower in China and India, we assume that these costs do not scale linearly with income levels.
14 | ROCKY MOUNTAIN INSTITUTETHE RISE OF PERSONAL VEHICLES
category, as shown in Exhibit 3. To fully address this THE FUTURE OF PERSONAL VEHICLES
issue, a new mobility system will need to eliminate While the United States is at or nearing peak car
emissions both at the tailpipe and at the source of ownership, China and India are rapidly moving in
energy generation while also reducing the recirculation the opposite direction. These developing countries
of dust caused by heavy congestion and road use. have the opportunity to leapfrog the American
paradigm of personal vehicle ownership and avoid
Unsafe many of its associated issues. However, this leapfrog
Human-operated vehicles are also prone to causing opportunity will not be realized on its own and will
traffic accidents, which claim over 502,000 lives each require both policy and cultural change to facilitate
year in the three countries combined. The majority the level of system transformation needed. At this
of fatal traffic accidents in all three countries can be critical juncture in their transportation futures, China
attributed to speeding, intoxication, and disregard of and India have the potential to divert the worsening
priority rules, all of which could potentially be avoided patterns of congestion and pollution, capture billions
through autonomous driving technology. of dollars in economic and social benefits, and set a
new precedent for urban mobility in emerging markets
Inefficient worldwide by continuing to implement strategic
Traffic congestion has worsened significantly in policies and smart investment in system infrastructure.
metropolitan areas in all three countries, as road
infrastructure has not been able to accommodate the
pace of private vehicle growth. The annual cost of
congestion in India’s four largest cities is estimated to
be $22 billion, which does not account for the social
costs of traffic-induced stress and road rage. A new
mobility system should be able to address these
inefficiencies without resorting to the buildout of more
road infrastructure, which does not solve problems for
long if at all. More lanes have been shown to result in
more vehicle miles traveled (VMT) with no observable
reduction in congestion.
Convenient
Currently, the most compelling advantage of personal
vehicles over other modes of transit is the convenience
factor. The flexibility to travel at any time of day to nearly
any location, in a reliable and comfortable vessel, is
the hallmark of a private vehicle. Empirical evidence
and observation suggest that these non-economic
factors can have an even stronger influence on transit
mode decisions than economic factors. Thus, any new
mobility services aiming to fill the role of private vehicles
must be able to exceed this standard of convenience
or provide alternative benefits, in addition to addressing
issues of affordability, pollution, safety, and efficiency.
DRIVING A SHARED, ELECTRIC, AUTONOMOUS MOBILITY FUTURE | 15THE RISE OF PERSONAL VEHICLES
EXHIBIT 3
Air Pollution in 20 Largest Cities of Each Country 9, ii
125 Delhi
100
PM2.5 Average (ɥg/m3)
Unhealthy
Beijing
75
50
Unhealthy
for Sensitive
Groups
25
Moderate
Chicago
Good
Good
0
China India United States
Average Average Average
Size of cities included
India China United States
>1.6M >5.3M >0.6M
ii
Beijing, Delhi, and Chicago have the worst air pollution (PM2.5) among the 20 largest cities in their respective countries.
16 | ROCKY MOUNTAIN INSTITUTE02 THE POTENTIAL OF SHARED,
ELECTRIC, AUTONOMOUS MOBILITY
SERVICES (SEAMS)THE POTENTIAL OF SHARED, ELECTRIC,
AUTONOMOUS MOBILITY SERVICES (SEAMS)
Shared, electric, and autonomous mobility services he or she can increase the load factor, but the vehicle
(SEAMS) are emerging as the most viable solution would still remain underutilized for most of the day.
to address the transportation needs of individuals
in cities around the world. When properly deployed, Alternatively, ridehailing drivers could transport several
SEAMS have the potential to reduce congestion and different people to their respective destinations over
traffic accidents and provide mobility at a lower cost the course of an 8-hour workday, raising vehicle
per mile than operating a personal vehicle, without utilization to 33%. This would obviate the need for all
sacrificing comfort and convenience. Though no of those individual passengers to operate their own
system of this sort is possible yet, significant analysis vehicles, freeing up parking and reducing congestion
makes it clear how well—and if done badly how associated with searching for parking. Carsharing
poorly—this could work. services (both fleet-based and peer-to-peer) achieve
the same effect of increasing utilization by allowing
a single vehicle to be used by several individuals
WHAT ARE SEAMS? throughout the day.
Sharing models
The goal of shared mobility is to reduce the number In addition to increased utilization, ridehailing
of vehicles required to satisfy the mobility needs for a vehicles can also improve their load factor by pooling
population. This can be achieved by either increasing passengers. The most optimal sharing solution
the load factor (i.e., pooling several passengers into combines the pooled ridehailing and carsharing
one vehicle), increasing utilization (i.e., operating the models, such that the vehicle can be operated up to 24
vehicle more frequently throughout the day), or both. hours a day (based on demand) by different ridehailing
This is illustrated in Exhibit 4. For example, in the drivers. When optimally implemented, ridehailing using
United States, the typical privately owned vehicle is a shared asset achieves significantly higher efficiency.
used to transport a single passenger to and from work. The advantage of the ridehailing plus carsharing model
This represents a load factor of one, and a utilization is its operational flexibility, as vehicles can be rerouted
of approximately 2 hours out of the 24-hour day (8%). real-time to accommodate shifts in passenger demand,
If the owner of the vehicle decides to start a carpool, as opposed to a fixed transit route.
18 | ROCKY MOUNTAIN INSTITUTETHE POTENTIAL OF SHARED, ELECTRIC, AUTONOMOUS MOBILITY SERVICES (SEAMS)
EXHIBIT 4
Shared Mobility Load Factor and Vehicle Utilization
Ridehailing (Uber, Didi, Ola) Pooled Ridehailing
Privately Owned, (UberPool, Didi ExpressPool)
Single Occupancy Carpooling or using a
Carsharing (Zipcar, Turo) Shared Vehicle (Maven Gig)
Load Factor
Vehicle Utilization
A.M. A.M. A.M. A.M.
P.M. P.M. P.M. P.M.
8–9 a.m. and 5–6 p.m. 8–9 a.m. and 5–6 p.m. 9 a.m.–12 p.m. and 12–5 p.m. 5–9 a.m. Morning Commute,
Commute Commute Ridehailing 10 a.m.–2 p.m. Midday Shift,
4–8 p.m. Evening Commute,
9 p.m.–2 a.m. Nightlife Shift
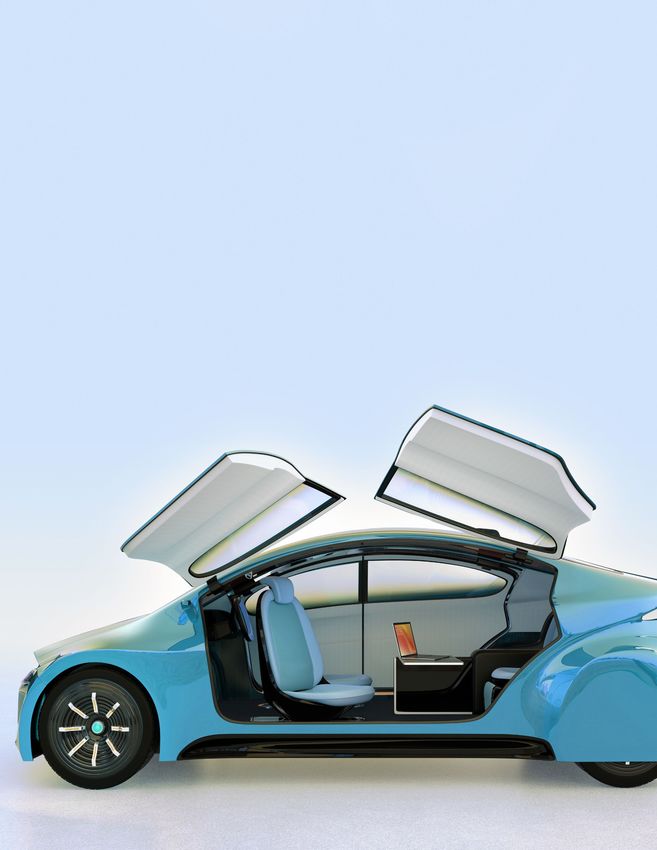
Electric vehicles Autonomous driving technology
An electric vehicle (EV) is an umbrella term used Autonomous vehicles (AVs) are vehicles of any kind
to describe any vehicle using an electric motor for with the capability to drive themselves using a suite
propulsion. EVs can include trucks, buses, cars, of hardware and software without the active physical
motorcycles, bikes, and even planes, and can be fully control or monitoring of a human operator. To qualify
battery electric (BEV), plug-in hybrids (PHEV), hybrids as a fully autonomous vehicle, the vehicle must be
(HEV), or fuel cell-powered (FCEV). In this report we able to navigate to a predetermined location over
focus on only full battery electric vehicles as they are roads that have not been specifically adapted for AV
seeing the most rapid growth and investment globally. use and without any human intervention.
DRIVING A SHARED, ELECTRIC, AUTONOMOUS MOBILITY FUTURE | 19THE POTENTIAL OF SHARED, ELECTRIC, AUTONOMOUS MOBILITY SERVICES (SEAMS)
Mobility services of vehicles on the road, reducing congestion. AVs
Mobility services, often referred to as mobility as a can also platoon and use road space more efficiently,
service (MaaS), describe a wide range of mobility reducing congestion and infrastructure costs.
solutions that are consumed as a service as opposed
to personally owned modes of transportation such • Convenient: If implemented well, SEAMS can be as
as a personal car or two-wheeler. Typically, MaaS convenient, reliable, on-demand, and as comfortable
combines various modes of transportation, both public as personal vehicles while eliminating the chore of
and private, where users can create, manage, and fueling, cleaning, maintaining, and storing a vehicle.
pay for the journey through a single interface, often a These benefits are especially pronounced in dense
smartphone application. The key definition of MaaS urban environments, where mobility services are far
is a service that meets the mobility needs of the user more readily available than parking spaces.
and is independent of the vehicle or mode used to
meet that mobility need.
IMPLEMENTING SEAMS
The most efficient implementation of SEAMS does not
ADVANTAGES OF SEAMS displace public transit, walking, or biking, but provides
There are many reasons why SEAMS are a viable an alternative to personal car ownership by strategic
alternative to car ownership. SEAMS are: integration with these other modes.
• Affordable: Autonomous driving technology has the
potential to reduce the cost of shared mobility services Mass transit is the most efficient form of transportation
below that of personal vehicles by significantly in high-density areas along high-volume corridors.
lowering the cost of operating the mobility service. However, US metropolitan areas are generally
Electrification of AVs can further reduce operations sprawling and difficult to serve by transit lines,
costs associated with fuel and maintenance. compared to cities in India and China. In the United
States, there are only two major cities with densities
• Clean: Electric vehicles produce zero tailpipe above 15,000 people per square mile (New York City
emissions, which improves local air quality. And and San Francisco), whereas India has 14.
when fueled with renewable sources EVs do not
contribute to greenhouse gas emissions. As the Building public transit infrastructure also requires
energy system continues to decarbonize, the entire political will. While US transit agencies continually
energy supply chain will be emissions-free and struggle to secure funding due to tepid public support
carbon neutral, resulting in zero-emissions vehicles from those who vote and pay the most taxes, China’s
at both the tailpipe and the generation site. centralized model allows the government to invest
billions in subway infrastructure.
• Safe: AV technology is expected to be much safer
than human drivers, particularly once the majority of Thus, SEAMS are best suited to replace personal
vehicles on the road are automated. AVs can help vehicles in areas that are not sufficiently dense for
eliminate occurrences of drunk and distracted driving public transit. Mass transit should continue to serve
and human error, providing a safer environment not passengers along high-traffic corridors and in city
only for drivers but for all road users and pedestrians. centers, from which SEAMS can be integrated as a
first/last-mile solution. By no means should SEAMS
• Efficient: Increased utilization of vehicles from displace public transit, which has a significant role in
ridepooling and carsharing will reduce the number nearly every major city. There is not enough space in
20 | ROCKY MOUNTAIN INSTITUTETHE POTENTIAL OF SHARED, ELECTRIC, AUTONOMOUS MOBILITY SERVICES (SEAMS)
the streets for every urban dweller to own a vehicle. In the following sections, we provide a deep dive into
For personal vehicles to work, people simply have to the three technologies—electric vehicles, autonomous
be closer together (or, in an economist’s view, pay an technology, and shared mobility services. For each
awful lot for the privilege of the space they use). technology, we compare the adoption across the three
China, India, and the United States are all moving countries and identify the key driving forces behind
toward a SEAMS future. However, the key drivers for them. We highlight the successes and setbacks of each
these technologies vary among the three countries as country’s efforts. At the end of each section we provide
a result of their unique financial markets, government a set of key takeaways that can support and accelerate
structures, and cultural attitudes. the adoption of SEAMS across all three countries.
DRIVING A SHARED, ELECTRIC, AUTONOMOUS MOBILITY FUTURE | 2103 ELECTRIC VEHICLES (EVS)
ELECTRIC VEHICLES (EVS)
EV ADOPTION                                                          China
The global electric vehicle (EV) market is still nascent,            As a result of its aggressive sales mandates and
accounting for less than 2.2% of vehicle sales, but is               generous subsidies, China reached a record 7% EV
expected to grow as EVs reach price parity over the                  sales in Q4 2018 and has already met its 2020 EV
next decade. Policies can accelerate this transition by              sales targets two years ahead of schedule.
targeting both automakers and consumers.
                                                                     India
United States                                                        EV Sales in India tripled in 2018, but India’s EV
In the United States, patchwork state policies have                  growth has been limited thus far. In February 2019,
sent mixed signals to auto manufacturers, delaying                   India announced plans to significantly expand its
the development of more sophisticated and lower-                     subsidies for EVs and charging infrastructure and has
cost new products (a four- to five-year cycle) and the               committed to ambitious electrification goals at the
eventual scale-up of EV manufacturing. Since EVs                     state and central government levels. The government
cost, in the near-term, significantly more than their                is targeting high-utilization commercial vehicles, which
gasoline counterparts, early adoption of EVs has been                will encourage the electrification of two-wheelers,
limited to the wealthy and the truly committed.                      three-wheelers, and shared mobility vehicles.

EXHIBIT 5
Annual EV Sales in the Three Countries

                        1,250,000

                                                                             China
                                                                                                  NEV (New Energy
                                                                             4.3%                 Vehicle) Mandate10
                        1,000,000

                                                  China implements
                                                  NEV Mandate
 Annual Vehicle Sales

                         750,000
                                                                                                  ZEV (Zero Emissions
                                                                                                  Vehicle) Mandate11

                         500,000
                                                                           United States
                                                                           2.0%
                                                                                                     BNEF Projections12
                         250,000
                                                                      India 2-wheelers
                                                                      0.3%
                                                                            India 4-wheelers BNEF Projections13
                               0                                            0.1%
                                    2012   2014           2016           2018              2020                 2022

    NEV and ZEV provide EV sales targets for automakers. BNEF provides projections for EV sales in India based on the Faster
    Adoption and Manufacture of Electric Vehicles (FAME) II scheme

                                                                          DRIVING A SHARED, ELECTRIC, AUTONOMOUS MOBILITY FUTURE | 23
ELECTRIC VEHICLES (EVS)
KEY DRIVERS price parity with gas vehicles is one key milestone
EVs have benefited from significant government for EV adoption to take off, there are other important
intervention in the form of supportive policy, fiscal aspects to consider, including but not limited to: An
incentives, and infrastructure investment, which has extensive and robust charging network, supportive
accelerated the timeline of price parity with incumbent policy, adequate vehicle model options, new financing
vehicle technology. However, RMI’s research into options, and cultural biases. In the following section we
behavioral economics shows that commuting decisions evaluate the role of five key drivers in the evolution of
are more nuanced than a simple price comparison and the electric vehicle markets over the past decade in
involve a complex set of emotions and biases. Although China, India, and the United States.
EXHIBIT 6
Key Drivers and Barriers for EV Adoption
MAJOR DRIVER MAJOR BARRIER
Supportive Lack of Charging
Policy & Cost Infrastructure
Parity
All Decision Drivers Strong Driver Medium Driver Weak Driver Not a Driver
Policy Economic Behavioral Culture
Infrastructure Financial
Cost Parity
24 | ROCKY MOUNTAIN INSTITUTEELECTRIC VEHICLES (EVS)
EV Policy As a result, auto manufacturers are compelled to
Overview: Types of Policy meet EV sales targets in these ZEV states, while also
EV policies include supply-side and demand-side responding to growing consumer demand for SUVs
strategies, providing both push and pull forces to drive nationwide. This has created a split market, where
EV adoption. Supply-side regulations encourage auto automakers are pushed to offer different models in
manufacturers to increase model availability and meet different states, effectively diluting their investments in
efficiency standards. Demand-side incentives aim to a wider range of models than would likely occur with
reduce the upfront price of EVs and drive consumer a nationwide mandated ZEV program. This market
decisions. A successful set of policies should leverage segmentation has prompted Ford to announce that it
both push and pull strategies to drive EV adoption. would phase out all of its passenger cars except for
Exhibit 7 provides an overview of these different types two models in order to focus on trucks and EVs.
of policies, which we dive deeper into below.
China adapted California’s ZEV to establish its own new
energy vehicle (NEV) mandate in 2017, the first of its kind
Pushing the Automakers to be implemented at a national level. The main difference
EV sales mandates in the NEV mandate is that the vehicle credit calculation
EV sales mandates require automakers to sell a certain is more flexible, taking into account the vehicle’s weight
proportion of zero-emissions passenger vehicles and energy consumption. This is shown below in Exhibit
as part of their total fleet. Eligible vehicles, including 8. Unlike the ZEV, this does not penalize manufacturers
battery-electric, fuel cell, and plug-in hybrid vehicles, for selling larger EVs. As a result, the NEV mandate can
are each assigned a certain number of credits. better accommodate shifts in consumer preference in
Manufacturers that do not meet their targets have to China, which is similarly trending toward SUVs.
buy credits from other manufacturers or pay penalties.
This supply-side strategy leverages market forces to India has not yet implemented a national EV sales
motivate automakers to accelerate their timelines for mandate. However, seven Indian states have
entry into the EV market or pay others to do so. announced state level EV policies that include fiscal
and non-fiscal incentives that encourage local EV
California was the first US state to introduce a zero- manufacturing and sales. A national-level mandate
emissions vehicle (ZEV) mandate in 2013, which has in India could help drive EV production from the
been voluntarily adopted by 10 other states. In total, supply side, to complement the subsidies that India is
these 11 states comprise 31% of the US population. providing on the consumer side.
EXHIBIT 7
Categories of Supportive EV Policies
Push forces Pull forces
Supply side Sales mandates
Incentives for local automakers
(Automakers) Fuel efficiency standards
Demand side Internal combustion engine registration Subsidies/tax credits
(Consumers) restrictions Priority road/parking access
DRIVING A SHARED, ELECTRIC, AUTONOMOUS MOBILITY FUTURE | 25ELECTRIC VEHICLES (EVS)
EXHIBIT 8
EV Sales Mandates
California’s Zero Emission Vehicle China’s New Energy Vehicle (NEV)
India
(ZEV) mandate mandate
Implementation Adopted by 11 states of which Enforced nationally
level California was by far the largest
Vehicles are assigned credits based Vehicles are assigned credits based on
Vehicle credit on their zero-emissions range. several factors, including range, energy
formula Credits per vehicle can range from 0.4 consumption, and curb weight. None
to 4. Credits per vehicle can range from 1 to 6. currently
By 2020, 9.5% credits or ~4.1% sales By 2020, 10% credits or ~4.0% sales
Targets
By 2025, 22% credits or ~8.0% sales
Fuel efficiency standards
Historically, fuel efficiency standards have been
considered one of the most successful policies for
mitigating emissions in the transportation sector.
These standards require car manufacturers to
maintain a minimum average fuel efficiency over their
vehicle fleets, which increases model availability for
consumers. Certain countries have set standards for
greenhouse-gas emissions instead of fuel economy
as a means to more directly and clearly address their
climate goals.
In the United States, the current administration
is planning to effectively freeze fuel efficiency
requirements at 2021 levels through 2026. In response,
14 states have elected to adopt their own, stricter
requirements. This may create another split market
for US automakers, who will now have to comply with
different regulatory environments by state.
26 | ROCKY MOUNTAIN INSTITUTEELECTRIC VEHICLES (EVS)
EXHIBIT 9
Fuel Efficiency Standards in the Three Countries14
60
India
China
50
MPG (CAFE Standards)
United States*
40
30
0
2005 2010 2015 2020 2025
*In the United States, the current administration is planning to freeze fuel efficiency requirements at 2021 levels through 2026.
China and the United States appear to be tracking
closely in fuel economy improvements, and all
three countries have set comparable fuel efficiency
targets for the early 2020s.iii Comparatively, India’s
vehicles are significantly more fuel efficient due to
their smaller size, less powerful engines, and high
diesel penetration. This has led some to believe that
India should enact stricter regulations that require
a proportional improvement in fuel economy. In its
current state, India’s current fleet characteristics show
the best potential for developing right-sized, purpose-
built vehicles for shared mobility use.
iii
All three countries have set targets of 48 mpg by 2020–2022 (by CAFE standards), which corresponds to approximately 35 mpg
in real on-road conditions.
DRIVING A SHARED, ELECTRIC, AUTONOMOUS MOBILITY FUTURE | 27ELECTRIC VEHICLES (EVS)
Pushing the Consumers Pulling the Consumers
Registration restrictions EV purchase incentives
Some cities restrict the number of vehicles that can be Financial incentives for electric vehicles are provided
registered per year to curb congestion and improve by national and local governments to offset the
air quality. Most tier 1 cities in China have done relatively high purchase price of EVs. Exhibit 10 shows
this through auction or lottery systems. In auction the relative fraction of the average electric vehicle
systems, the cost of registration can amount to the purchase price that is covered by national and local
cost of the vehicle itself. In lottery systems, the wait subsidies. Due to the high variation in local subsidies
time to draw a registration can be two to eight years. across states and regions, with many having no local
These restrictions are often lifted for EVs, providing a subsidy, the light blue bar represents the highest local
strong incentive to purchase an EV even if it requires subsidy in each country.
a small premium.
This type of sweeping restriction is unlikely to gain public
support in the United States. Nonetheless, it has been a
very effective mechanism for reducing congestion and
indirectly promoting EV adoption in China.
28 | ROCKY MOUNTAIN INSTITUTEELECTRIC VEHICLES (EVS)
EXHIBIT 10
EV Purchase Subsidies in the Three Countriesiv
Average $29,459 $650 $12,219 $44,513
EV Price
100%
Relative Proportion of EV Purchase Price
75%
50%
25%
0%
China15 India India United States18
2-Wheelers16 4-Wheelers17
Remaining Cost of Vehicle Local Subsidy National Subsidy
China has historically provided the most generous a nascent market. The subsidies have since been
subsidies, which has spurred mass production of updated with more stringent requirements that
lower-range, more affordable EVs. As a result, the encourage automakers to produce longer-range EVs
total subsidy can cover more than half the cost of to compete in the global market.
an EV. This has proven so successful in driving sales
that China has reduced subsidies by half starting in The United States also provides moderate financial
2019, and plans to phase them out entirely by 2020. incentives for EV purchases, but they represent a
Nonetheless, EV sales are expected to remain high smaller proportion of the total vehicle cost, due to
due to internal combustion engine (ICE) registration higher EV prices. In 2018, the mass production of
restrictions, EV sales quotas, and organic demand Tesla’s Model 3 brought down the average EV price
growth. This is an example of a successful subsidy by $15,000, but that price point of about $45,000
phasing out after achieving its purpose of catalyzing is still $15,000 higher than the average EV price in
IV
Average EV prices were calculated by taking a weighted average of the MSRPs of the five top-selling EV models in each country.
DRIVING A SHARED, ELECTRIC, AUTONOMOUS MOBILITY FUTURE | 29ELECTRIC VEHICLES (EVS)
China. Further, whereas China’s subsidies are applied implemented various demand-side fiscal and non-
as rebates at the point of purchase, the United States fiscal incentives, including direct subsidies for vehicles
offers a tax credit, the full value of which can only be and infrastructure, waived road and excise tax, waived
claimed if the purchaser’s annual income exceeds registration fees, favorable electricity tariff structures,
$65,000/year. This further restricts EV adoption to and favorable lending rates.
wealthier segments of society.
The United States could benefit from refining its EV
Under its recently amended FAME II scheme, India subsidy to 1) prioritize high-utilization vehicles to
plans to subsidize 1 million two-wheelers, 500,000 maximize vehicle miles electrified, and 2) implement a
three-wheelers, and 55,000 four-wheelers. Four- phase-out strategy with clear benchmarks for bringing
wheelers will only be subsidized for commercial EVs to market.
and shared mobility use, not for private ownership.
This prioritizes vehicle segments that are both
high polluting and high utilization. This targeted Economics of EVs
approach is very well-designed from an economic Price parity
and environmental standpoint. Auto-rickshaws and Currently, EVs cost between 25% and 50% more than
ridehailing vehicles have the highest utilization, comparable ICE vehicles, presenting a significant barrier
so electrifying them would eliminate the most for consumers. We anticipate that mass adoption will
tailpipe emissions per vehicle. This also avoids the require EVs to reach and likely go beyond price parity
pitfall of subsidizing high-end vehicles for those with ICE vehicles. In the United States, this is expected
who can already afford them without the subsidy. to occur between 2024 and 2027, depending on the
Several state governments in India announced and vehicle type. Falling battery prices are the main driver for
30 | ROCKY MOUNTAIN INSTITUTEELECTRIC VEHICLES (EVS)
EXHIBIT 11
US Medium BEV Price Breakdown, ICE Price and Share of Battery Costs20
$45
$40
$35
$30
$ in Thousands
$25
$20
$15
$10
$5
$0
2016 2018 2020 2022 2024 2026 2028 2030
Battery Powertrain Vehicle ICE
this cost decline, as the battery pack currently comprises battery market and in some cases the same auto
40% of the total EV cost. As battery manufacturing market. Price parity may be slightly delayed in these
continues to scale up, battery costs are expected to fall countries, since vehicle prices are on average lower
below $100/kWh by 2025. As a result, the cost of the than in the United States and thus more sensitive to
battery will comprise less than 20% of the total EV cost in high battery costs making up a large portion of the
the United States by 2025. total vehicle cost. As a result, battery prices must be
reduced even more to reach price parity or battery
We expect EV costs to follow a similar trajectory in packs will remain relatively smaller in Indian and
China and India, as they participate in the same global Chinese vehicles to keep overall costs competitive.
DRIVING A SHARED, ELECTRIC, AUTONOMOUS MOBILITY FUTURE | 31ELECTRIC VEHICLES (EVS)
Nonetheless, we expect EVs to reach price parity in Operating costs
China and India by the mid to late 2020s for private Price parity in the total cost of ownership (TCO), which
vehicles and likely much earlier for high-utilization takes into account operating costs, will be reached
commercial vehicles. several years earlier than for the capital costs such
as fueling and maintenance, and is already present
These projections for price parity are based on for some drivers. This is because EVs are cheaper to
assumptions around existing government support. operate on a per-mile basis, due to their lower fuel
Policy plays a critical role in driving the scale-up of costs and maintenance requirements.
battery manufacturing, as it provides confidence to
the private sector to invest in these technologies and Vehicles used for ridehailing, which will be discussed
prepare for future EV demand. Loss of government in the following section, are strong candidates for
support, such as the proposed rollback of fuel electrification due to their high utilization rates. As
efficiency standards in the United States, will likely demonstrated in RMI’s previous study, full-time ridehailing
delay EVs from reaching price parity and achieving drivers for ridehailing companies can save up to $5,200/
mass adoption. year in fuel and maintenance costs with an EV compared
to a gas vehicle.
32 | ROCKY MOUNTAIN INSTITUTEELECTRIC VEHICLES (EVS)
EXHIBIT 12
Cost by Vehicle Type for Ridehailing Drivers21
Fuel Costs Maintenance Costs
$5,000 $5,000
$4,000 $4,000
Maintenance Cost Per Year
Fuel Cost Per Year
$3,000 $3,000
$2,000 $2,000
$1,000 $1,000
$0 $0
Gas Vehicle Electric Vehicle Gas Vehicle Electric Vehicle
Type of Ridehailing Driver:
Casual (10 hr/wk) Part time (25 hr/wk) Full Time (50 hr/wk)
Charging Infrastructure of these countries will require a properly adjusted mix
In all three countries, mass adoption of EVs will be of public DC fast charging, public Level 2 charging,
heavily tied to the availability of public and private private home charging, and dedicated fleet charging,
charging infrastructure. In our previous RMI report working across a wide range of vehicle types. While
From Gas to Grid, we demonstrate that deploying China has made significant progress in deploying
charging infrastructure in a cost-effective and optimal DC fast charging networks in particular, the United
way requires careful planning, appropriate government States and India are behind and require significant
incentives, and a high level of coordination and further investment from the private and public sectors.
collaboration between public and private sectors. Uniquely, India is likely to invest in both conventional
Supporting a healthy electric vehicle ecosystem in any charging infrastructure and a battery swapping
DRIVING A SHARED, ELECTRIC, AUTONOMOUS MOBILITY FUTURE | 33You can also read