BIS Papers The design of digital financial infrastructure: lessons from India - Monetary and Economic Department
←
→
Page content transcription
If your browser does not render page correctly, please read the page content below
BIS Papers
No 106
The design of digital
financial infrastructure:
lessons from India
by Derryl D’Silva, Zuzana Filková, Frank Packer and
Siddharth Tiwari

Monetary and Economic Department

December 2019
The views expressed are those of the authors and not necessarily the views of the BIS.

This publication is available on the BIS website (www.bis.org).

©   Bank for International Settlements 2019. All rights reserved. Brief excerpts may be
    reproduced or translated provided the source is stated.

ISSN 1682-7651 (online)
ISBN 978-92-9259-324-7 (online)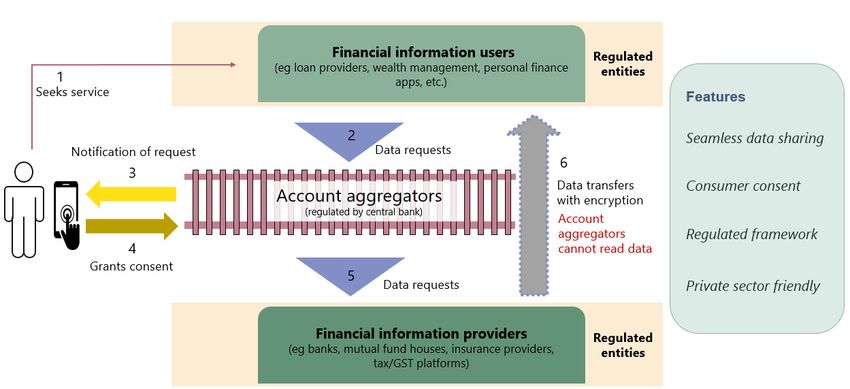
The design of digital financial infrastructure: lessons
from India

Derryl D’Silva, Zuzana Filková, Frank Packer and Siddharth Tiwari*

Abstract

Digital finance has the potential to transform emerging market and advanced
economies alike. India’s approach rests on the principle of providing digital financial
infrastructure as a public good. It offers an important case study where the results are
relevant and applicable for all economies, irrespective of their stage of development.
The provision of a national digital biometric identity to all residents has effectively
granted them broad access to the banking system. The development of a real-time
payment system platform has brought efficiencies to retail customers and small-scale
transactions. By providing cheap and instantaneous payment services to ordinary
citizens, the design of the Indian payment system challenges the business case for
standalone private payment systems. The establishment of a legal framework for data
fiduciaries promises to ensure that individuals can readily access the data generated
by their online activity and dictate the circumstances for sharing those data.
Keywords: digital finance, financial inclusion, payment system, interoperability, data
privacy, India Stack.
JEL classification: G28, H41, L15, L17, O33.

Acknowledgements

We are grateful to Agustín Carstens for suggesting this topic. The substance of the paper
arose from a conversation in Nandan Nilekani’s office in Bangalore. We are grateful to
Tanuj Bhojwani, Sanjay Jain, and Sharad Sharma (iSPIRT) and Rohit Das and Karan
Javaji (Reserve Bank of India) for extensive collaboration over the course of the project.
We are also grateful to Raphael Auer, Frédéric Boissay, Stijn Claessens, Jon Frost,
Leonardo Gambacorta, Stefan Ingves, Sanjeev Mehra, and Tara Rice for comments on
earlier drafts. We thank Jenny Hung for providing excellent support throughout the
project and Margaret Siu for assisting with document preparation. Responsibility for any
errors in the paper remains our own.

*
     Bank for International Settlements.

BIS Papers 106                                                                           i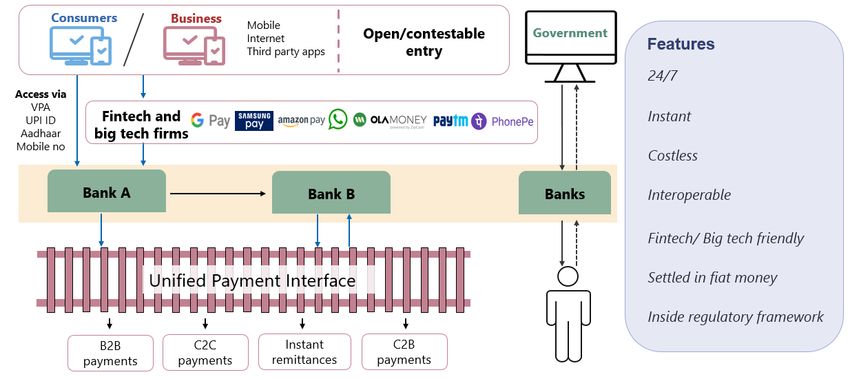
Contents

1. Introduction ....................................................................................................................................... 1

2. The challenges .................................................................................................................................. 3
        a.      The challenge then: inclusion through identity ........................................................ 3
        b.      The challenge now: improving payment services within the formal
                financial system...................................................................................................................... 5
        c.      The challenge going forward: data empowerment with consent ...................... 5

3. What is a technology stack? ........................................................................................................ 6

4. India Stack .......................................................................................................................................... 7

5. Digital financial infrastructure .................................................................................................. 10
        Rail 1: Identity ................................................................................................................................ 10
                a.      Unique identity ........................................................................................................... 10
                b.      Expansion and impact on financial inclusion .................................................. 12
                c.      Electronic KYC (e-KYC) ............................................................................................. 13
                d.      Other applications ..................................................................................................... 14
        Rail 2: Payment systems............................................................................................................. 15
                a.      Initial conditions ......................................................................................................... 15
                b.      Unified Payments Interface (UPI) ......................................................................... 16
                c.      Expansion and impact .............................................................................................. 18
                d.      Challenges from the private sector..................................................................... 20
        Rail 3: Data-sharing ..................................................................................................................... 22

6. Conclusions ...................................................................................................................................... 25

7. References ........................................................................................................................................ 28

BIS Papers 106                                                                                                                                           iii
1. Introduction
Access to finance for individuals is critical for tapping the full potential of an economy.
There have traditionally been significant barriers to financial inclusion in most
economies emanating from societal attitudes, legal frameworks and prohibitively
high transaction costs. Recent evidence has shown that digital technologies offer a
powerful way to overcome these barriers and boost access to the banking and
financial system.
Key features of digital finance include the ability to use mobile devices, quickly
authenticate identity, and real-time payment services. Their scalability means that
they can be applied to hundreds of millions of customers, even for low-value
transactions. Such low-cost, high-volume, low-value digital financial transactions
were unimaginable just a decade ago. Much has already been achieved: in India alone,
nearly half a billion adults opened bank accounts between 2011 and 2017.
In spite of these advances in digital technologies, some 1.7 billion people today
still remain unbanked, with virtually all unbanked individuals living in developing
economies. Women remain overrepresented amongst the unbanked globally at
about 1 billion, as well as individually in each economy. Globally, about half of
unbanked individuals come from the poorest 40% of households and the unbanked
are disproportionately young.2 The current system penalises those who can afford it
the least. Doing nothing is not an option.
Increasing access to finance first involves the challenge of bringing the
population into the country’s formal financial system. Entrepreneurship, investment
and economic growth suffer when savings are held, credit granted and payments
settled outside the formal system to the benefit of usurious middlemen. But another
challenge is to retain individuals in the formal financial system through constant
innovation and satisfactory performance. In both cases, the digital financial
infrastructure can be designed and implemented so that the large gaps in financial
inclusion narrow between genders, as well as between income levels, education and
degrees of urbanisation.
India offers an example of how various policy reforms related to digital finance –
including transformation of the traditional banking system with the central bank
playing a pivotal role – can solve many of the challenges of inclusive financial
development that once seemed out of reach. It also offers insights into how the
regulator (eg the central bank) and the regulated (eg commercial banks) can together
run a payment system that operates around the clock throughout the year, is open
to the participation of firms ranging from boutique fintechs to big techs and provides
all the network benefits that big tech systems usually provide, but settles instantly in
fiat money inside the central bank.3 India’s approach is built upon four pillars:
(i) providing digital financial infrastructure as a public good; (ii) encouraging private
innovation by providing open access to this infrastructure; (iii) creating a level playing
2
The four largest developing economies with unbanked individuals are: China (224 million), India (191
million), Pakistan (99 million) and Indonesia (97 million). There are 980 million women globally
without a bank account, of whom 132 million are in China, 109 million in India, 56 million in Pakistan
and 47 million in Indonesia. 30% of unbanked adults are between 15 and 24 years old. See Demirgüç-
Kunt et al (2018) and World Bank (2018).
3
By fiat money, we mean state-issued money, declared by the sovereign government to be legal
tender.
BIS Papers 106 1field through the regulatory framework; and (iv) empowering individuals through a
data-sharing framework that requires their consent. India offers important lessons
that are equally relevant for both advanced economies and emerging market and
developing economies.
In the 10 years since 2009 – when the Aadhaar programme, the world’s first
initiative to provide biometric identity, was launched for all Indians – India has created
several innovative digital platforms, built as public goods. Each platform, designed
within the regulatory system, solves a single need such as identity, payments or data
sharing. But when put together, these platforms, which we sometimes refer to as
“rails” in this paper due to their ability to connect different parties, create a powerful
“stack” of applications. The stack reinforces private sector innovation in fintech by
supporting open, free and contestable markets in digital finance. By embracing the
stack approach, the official sector, in turn, has created a payment system
characterised first and foremost by interoperability.4
For instance, the identity rail has not only greatly increased financial inclusion,
but Aadhaar-based KYC procedures also offer more robust anti-money laundering
(AML) / combating the financing of terrorism (CFT) checks to the banking system than
before. The payment rails handle instantaneous and seamless financial service
transactions for more citizens than before, in fiat money and settling within the
banking system. They also route some government payments and can be accessed
by private fintech firms.
Similar to other forms of digital infrastructure, the “India Stack” is also making
Indians data rich. Data-sharing rails are designed to prevent data capture by the state
or the private sector, instead empowering consumers and businesses to benefit from
their own data. In this digital financial infrastructure, consumers – by controlling the
access to and management of their own data – can transact in the marketplace
without compromising privacy. At the same time, convenient means of sharing data
where necessary are incorporated in the infrastructure. Easier access to data, granted
with consumer consent, ultimately means that it is cheaper for consumers to find
alternative products and services by fostering more competition to provide them.
A key feature of this framework is that it dramatically changes the dynamic
between regulators and innovators. It enables a type of collaboration between the
public and private sectors that harnesses the rapid force of private innovation while
protecting the economy (and consumers) through the traditional guardrails of
regulation. Notably, the Indian example has established that central banks can be
proactive and equal partners with private sector counterparts when it comes to
fostering technological innovation in the financial sphere.
The strengths of the framework aside, the cyber security risks of any system of
digital financial platforms are immense. These include identity and data theft, scope
for unlawful violations of privacy and so on. In particular, the risks that identification
schemes and system integrity face from hackers must be monitored vigilantly.
Likewise, the state’s ability to access identification for profiling and access to private
details should be carefully circumscribed.
4
Interoperability – the technical or legal compatibility that enables a system or mechanism to be used
in conjunction with other systems or mechanisms – allows participants in different systems to
conduct, clear and settle payments or financial transactions across systems without participating in
multiple systems. The ability to use one bank’s mobile app to access and make payments from
accounts in another bank is an example.
2 BIS Papers 106The rest of this paper is structured as follows. In Part II, we outline the main
challenges faced by Indian policymakers a decade ago, currently and in the future.
Part III outlines the concept of a technology stack and Part IV presents the Indian
version of the stack approach. Part V provides more details on India’s digital financial
infrastructure, including the establishment of a digital identity, the enhancement of
the payment system to bring efficiencies to retail customers and the development of
a data-sharing framework that mandates customer consent. Conclusions are
presented in Part VI.
2. The challenges
a. The challenge then: inclusion through identity
In 2008, only one in 25 people in India had formal identification and around one in
four Indian adults had a bank account.5 The financial exclusion of marginalised groups
– women, the poor, those out of the labour force or with less formal education – was
extreme.6
It is a well established regularity that financial deepening – often measured as
the growth of financial assets as a share of GDP – goes hand in hand with economic
development.7 A similarly strong positive relationship between economic
development (as proxied by GDP per capita) and financial inclusion (as proxied by the
share of adults with a bank account) has been suggested by the first available cross-
country data on financial inclusion, taken from the World Bank’s Global Findex
database. According to the estimates across 121 national jurisdictions in 2011, the
first year for which the inclusion data are available, a rise in GDP per capita from
$5,000 to $20,000 was associated with an increase in the share of adults holding bank
accounts from 30% to almost 80% (see fitted black line, Graph 1, left-hand panel).
5
In 2008, 40 million Indians, or around one in 25 of the population, had a passport, which was the only
unique, multi-purpose form of identity at the time (GSMA (2017)). Data on the adult population with
bank accounts in 2008 are not available. The total is estimated by approximating the size of the adult
population with bank accounts in 2011 from the World Bank’s Global Findex database (the first year
of the database) and discounting the 2011 figure by the growth rate of standard commercial
(“scheduled”) bank accounts, as published by the Reserve Bank of India, between 2008 and 2011. We
then arrive at 27% – or around one in four – by dividing the estimated number for 2008 by the adult
population of India in 2008.
6
The evidence for 2011 of outsize financial exclusion of marginalised groups, presumably less than in
2008, is presented in Table 1 on page 15. A description of the inefficiencies of earlier cash transactions
to transfer government benefits can be found on the website of the Indian government’s Direct
Benefit Transfer programme (https://dbtbharat.gov.in/).
7
A large literature dating at least as far back as Bagehot (1873) and Schumpeter (1911) emphasises
the positive influence of the development of a country’s financial sector on the level and the rate of
growth of its income per capita. Theoretical papers on this topic in the 1980s and 1990s established,
in particular, that development in the financial system: (i) reduce the cost of acquiring and processing
information and thereby improve resource allocation (Diamond (1984), Boyd and Prescott (1986)); (ii)
help monitoring investments and exerting corporate governance after providing finance (Stiglitz and
Weiss (1983), Jensen and Meckling (1976), Jensen (1993)); (iii) facilitate the trading, diversification,
management of risk and pooling of saving (Acemoglu and Zilibotti (1997)); and (iv) ease the exchange
of good and services (Greenwood and Smith (1996)). Empirical studies confirm these mechanisms.
For a review, see Levine (2005).
BIS Papers 106 3At the same time, it is increasingly recognised that identification is one of the key
elements of financial inclusion.8 According to the Global Findex database, there is also
a strongly positive relationship between the proportion of population with an ID and
those having bank accounts (Graph 1, right-hand panel). As people obtain such
verifiable identities, they also have an easier time opening bank accounts, obtaining
credit and enrolling in social welfare programmes. Transactions become more
efficient, with less leakage of value along the path to the payee.
Leapfrogging traditional development processes Graph 1
Positive relation between GDP per capita and adults with Positive relation between having a bank account1 and
a bank account1 in 2011 having an ID in 20172
100 100
Adults with an account (%)
Adults with an account (%)
India
80 2017 80
/\
60 60
40 40
20 47 years 20
2008
0 0
0 10,000 20,000 30,000 40,000 0 20 40 60 80 100
GDP per capita (USD) Population with an ID (%)
1
Bank account held by people aged 15 and older. Data on adults with an account in 2008 were not available, therefore the graph assumes
India to be on the fitted line. GDP per capita restricted to $50,000 to remove outliers and expressed in 2011 USD values. 2 Due to data
constraints, data in the right-hand panel are displayed for 2017 instead of 2011.
Sources: A Demirgüç-Kunt, L Klapper, D Singer, S Ansar and J Hess, “The Global Findex Database 2017: measuring financial inclusion and the
fintech revolution”, World Bank Group, 2018; IMF, World Economic Outlook, October 2019; World Bank Group, Global Findex Database; World
Bank Group, Identification For Development (ID4D) Global Dataset.
Given the low levels of both financial inclusion and formal identification in 2008,
the magnitude of the challenges facing India a little more than a decade ago was
clearly immense. Based on the bank account data and the relationship with GDP per
capita discussed above, one rough estimate is that it would have taken 47 years to
achieve 80% of adults with a bank account had India solely relied on traditional
growth processes.9
8
The role of digital finance in promoting financial inclusion is reviewed in Ardic et al (2019), Deloitte
and Confederation of Indian Industry (2016), Gates Foundation and G7 French Presidency (2019) and
Riley and Kulathunga (2019). The role of central bank and government policies in advancing financial
inclusion is discussed in Carstens (2019a). That enabling digital identification results in higher levels
of inclusive economic growth is argued in McKinsey Global Institute (2019b). An analysis of the
payment aspects of financial inclusion is discussed in CPMI and World Bank Group (2016).
9
Assuming the level of GDP per capita subsequent to 2008 grew in accordance with medium-term
projections at that time for Indian GDP from IMF, World Economic Outlook, April 2008, and for
population from the World Bank, then based on the relationship of GDP per capita and financial
inclusion estimated with 2011 data (Graph 1, left-hand panel, data cover 121 countries), it would have
taken until 2055 for India to achieve 80% of adults with an account.
4 BIS Papers 106b. The challenge now: improving payment services within the formal
financial system
Just as important as increasing financial inclusion is the challenge, in the face of
emerging competition, of keeping consumers within the banking system after they
have entered it. For many years, consumers have been seeking instant, 24/7 and cost-
free ways to transfer money to other consumers and businesses using mobile
applications. Yet transfers remain costly, involve processes that are cumbersome to
navigate and slow to execute, are generally available only during limited times of the
day and can take days to clear. While payment systems have become more efficient
in many jurisdictions, progress has been uneven, with considerable scope to upgrade
further.
Many central banks and sovereigns have yet to provide an app-based payment
system that meets consumer needs as outlined above and settles in fiat money inside
the central bank. This failure has given rise to private schemes from non-banks.
Spurred by fintech innovation, privately provided payment products and services are
increasingly filling the gap outside the formal financial system. If the increased
consumer use of these services is not incorporated and linked to the formal system
in some fashion, it has the potential to disintermediate both banks and central bank
payment platforms/systems, as well as create financial stability and AML/CFT risks.10
Cross-border payments pose a distinct challenge. Inefficiencies abound, and the
costs of overseas remittances are often exorbitant.11 Improving cross-border payment
services involves more than technological solutions; standards and practices across
jurisdictions must be coordinated to find efficient ways to connect payment systems.
Enabling such solutions requires that domestic payment networks address AML/CFT
concerns.
c. The challenge going forward: data empowerment with consent
The challenge of empowering consumers with the data generated from their online
activity will be of increasing importance going forward. As in many jurisdictions, the
Indian population, at over 1 billion, is becoming data-rich with increasing penetration
of internet connectivity and mobile phones. But in the absence of public initiatives,
newly created digital data will tend to be gathered and retained in proprietary silos.
The challenge is to create a structure allowing customers to readily access and share
their personal data to overcome information asymmetries and lack of trust, and in so
doing obtain financial services. With such an approach, consumers are likely to benefit
from more personalised products linked to their individual needs. More open access
10
See Carstens (2019c), G7 Working Group on Stablecoins (2019) and Duffie (2019). The government’s
role more generally in managing payment systems is discussed in Boel (2019) and Raman and
Staschen (2017).
11
See World Bank, “Remittance Prices Worldwide”, September 2019. In Q3 2019, the global average
cost for sending remittances was 6.84%, compared with the G8 (2010) and the G20 (2011, 2014)
commitment to reduce the global average cost to 5% and the United Nations Sustainable
Development Goal target of 3% by 2030.
BIS Papers 106 5to data can also lower switching costs for customers and foster competition and
financial inclusion.12
At the same time, while ensuring wider access to data is beneficial, care should
be taken that rights to privacy are protected. In jurisdictions with dominant big techs,
firms have considerable autonomy over the customer data they acquire and relatively
limited fiduciary responsibilities to the customers whose activities generate the data.13
While data have often been used by institutions to market to customers without their
informed knowledge or consent, one key issue is how can usage be disciplined so
that individuals can readily access their own data and determine the conditions under
which their data are shared.
3. What is a technology stack?
The term ”technology stack” usually refers to a set of interconnected yet independent
single-purpose technologies – called “platforms” – that work together towards
general purpose tasks. This set is called a “stack” because it is modular in construction
and its component platforms can be flexibly stacked upon each other to build a digital
infrastructure. Platforms, in turn, are complex systems that connect, directly or
indirectly, many users and are able to adapt to evolving user needs.14 Platforms
involve the exchange of information (eg social media), the exchange of goods
(eg eBay) and the transmission of some form of money (eg credit cards, PayPal). In
many cases, service delivery is allowed outside the platform (Uber and Airbnb), but
the transmission of money takes place within the platform. In this manner,
interactions on a platform resemble any economic or social exchange, whether in the
real world or virtually. Moreover, it is possible for all firms – irrespective of size – to
have equal access to platforms, creating network effects that lower costs and improve
processes.
As an example (Graph 2), consider the combination of technologies that enables
a person to hail a ride using a smartphone or book a stranger’s house instead of a
hotel. Various technologies (publicly and privately) developed independently of each
other have been combined to enhance the services without the end user being aware
of them. In a typical taxi transaction, the consumer uses a personal smartphone to
connect via publicly provided internet to a satellite-based navigation system (also
developed by the public sector) to locate a driver. In this case, the service is delivered
outside the platform, but payment takes place on the platform through commercially
available methods (credit cards etc).
The public sector can buttress the technology stack. Historically there are already
a number of important examples where digital infrastructure has been created as a
12
For a discussion on the role of personal data in digital financial innovation, see Carstens (2019b).
13
For a general discussion of data-opolies, see Stucke (2018). For a debate on the legal responsibilities
of big tech firms, see Dobkin (2018) and Khan and Pozen (2019).
14
See Parker et al (2016). There is an important distinction between platforms and products. Platforms
are used to build content. For example, YouTube is a platform because it allows users to build content
on it. By contrast, Netflix is a product because, while content is seen on it, it does not let third parties
build on it.
6 BIS Papers 106public good. The internet and the GPS stand out as examples of two foundational
digital infrastructures that were initially developed by the US government, and
subsequently made available to the private sector to build upon further, forming the
base for public-private partnerships.15
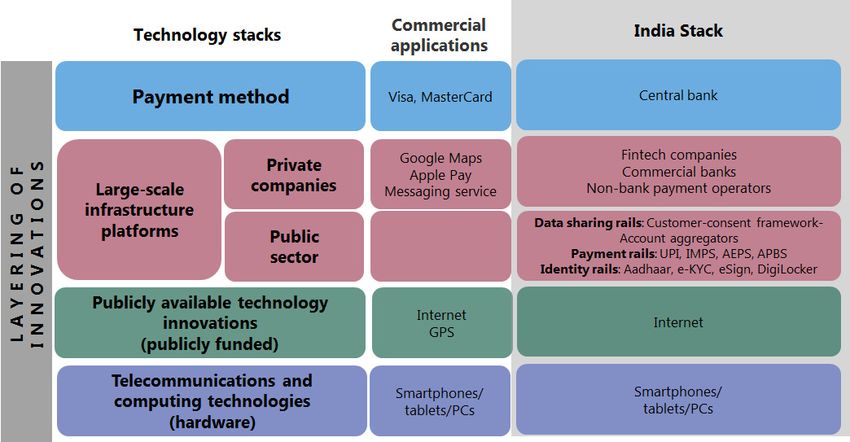
Technology stack architecture Graph 2
4. India Stack
India has addressed the challenges outlined in Part II by developing a version of a
technology stack known as the India Stack (Graph 3). Instead of simply undertaking
multiple technology projects in isolation, India created a state-of–the-art digital
foundational infrastructure based on two principles: (i) building digital platforms as
public goods so both public and private sector participants are able to develop
technological innovations; and (ii) incorporating data privacy and security in the
design of digital public goods.16 In this paper, the India Stack concept is developed
for transactions in the payment systems, although it is also applicable to other
industries (eg health care, insurance).
India’s digital infrastructure is designed to support both public and private sector
innovators, including big tech companies, to create products that operate within the
regulatory framework. Therefore, a big tech firm and a traditional commercial bank
can both operate on the same digital platform. Further, these platforms, when built
and operated by public institutions, provide regulators with the means to ensure that
financial stability concerns are adequately addressed.
15
See Nilekani (2018).
16
See iSPIRT (Indian Software Product Industry Roundtable, https://ispirt.in/), including the discussion
in Ruhela (2019). For a helpful guide to India Stack, see also India Stack (2016).
BIS Papers 106 7India Stack Graph 3
A verifiable identity is the bedrock of a modern economy. Launched in 2010,
India’s unique digital identity system, Aadhaar, was the first digital public good
designed for the specific purpose of authenticating individual identity. More than 1.2
billion Indians now have a unique digital identity.
Various platforms – verification, digital signature and payments – have been
developed over Aadhaar, built as public goods, each solving for a single purpose,
each enabling another and all capable of scaling up. Using the payment systems
terminology, we call these platforms “rails”, as they serve as an infrastructure for other
applications to run on top of. Public and private sector innovators can use these
publicly provided rails to create and exchange value, doing away with the need to
build their own digital infrastructure, thereby significantly lowering transaction costs.
The e-KYC rail – digitalisation of the manual KYC process – was launched in 2012,
soon after Aadhaar. This drastically reduced transaction costs for businesses and also
enabled greater access to bank accounts (see discussion of e-KYC in Part V). The
government could now also directly transfer subsidies to bank accounts rather than
conduct these transactions in cash. Already more than $100 billion has been
transferred directly to the beneficiaries over seven years (equivalent to 5% of average
period GDP), thereby reducing fraud and leakage.17 Subsequently, other rails such as
digital signature, digital repository and Unified Payments Interface (UPI) were
launched, each tackling a specific need. The UPI payments rail has been remarkably
17
See Direct Benefit Transfers, Government of India, https://www.dbtbharat.gov.in/. The total
cumulative direct benefit transfer up to the 2019/20 financial year is scaled by average annual GDP
between 2013 and 2019 taken from IMF, World Economic Outlook, October 2019. For an earlier
overview of government transfer payments in India, see Breloff and Rotman Parker (2011). For a more
general overview of how digital payments can transform public finance, see Cangiano et al (2019)
and Gupta et al (2017).
8 BIS Papers 106popular: in three years since 2016, it has handled a total of more than 12 billion
transactions compared with 5 billion credit card transactions over the same period.18
Critically, the rails handle a high volume of data flows, raising issues of data
security and privacy. In addition, as more people use the rails, they generate their own
data. In the present system, citizens will have control over their own data and who
they can share the data with, for how long, and whether the information can be shared
further.19
Over time, this collection of rails, all offered as digital public goods, has come to
be known as India Stack (Graph 4). These rails, when connected, allow many different
and competing solutions to emerge for technological problems, all capable of scaling
up. India Stack promotes a host of new services, from lending to insurance and wealth
management.
Development of India Stack – a collection of rails Graph 4
• Identity rail, where Aadhaar allows the authentication of identity on demand
without the need for a physical presence, as well as e-KYC (verification), eSign
(digital signature) and DigiLocker (online document depository).
• Payment rail, where the UPI is a single interoperable interface to bank accounts
effectively granting everyone mobile access to the payment system and allowing
financial transactions to take place instantly, on demand, and in fiat money inside
the formal financial system.
• Data-sharing rail, where data privacy is ensured and customer data facilitate
financial transactions, while moving efficiently and securely based on customer
consent.
India Stack is an example of how a unified, multi-layered set of digital platforms,
provided by the public sector, gives businesses, startups and developers significantly
improved access to financial services. At the same time, it also promotes financial
18
See National Payments Corporation of India, https://www.npci.org.in/statistics; and Reserve Bank of
India, https://www.rbi.org.in/Scripts/BS_ViewBulletin.aspx?Id=18573.
19
See iSPIRT (Indian Software Product Industry Roundtable; https://ispirt.in/), “Data Empowerment and
Protection Architecture Explained”, June 2019.
BIS Papers 106 9inclusion, efficient conduct of specific fiscal policies, increased efficiency, financial
stability and easier access to data granted with consumer consent.
5. Digital financial infrastructure
As noted above, India’s digital financial infrastructure consists of modular, open
source architectures and standards covering three rails – identity, payments and
data-sharing – that need to work concurrently.
Rail 1: Identity
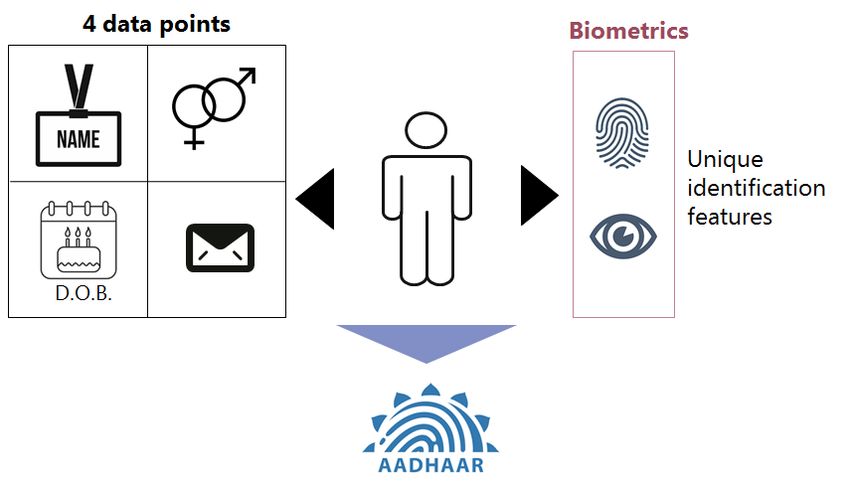
a. Unique identity
The first rail of India’s digital financial infrastructure is used to access a unique,
verifiable identity for each of its residents, available as a public good. Aadhaar is a
biometric identity that requires minimal information and has a low marginal cost per
identification.20 It consists of a 12-digit random number that corresponds to certain
demographic and biometric information of an individual. The mandatory information
to be provided to receive the Aadhaar number comprises four data points: name,
date of birth, gender and residential address (Graph 5). In addition to that, the user
provides a photograph of the face and biometrics (fingerprints and iris scans) that
can authenticate the user’s identity when the number is used.21
Components of digital identity Graph 5
20
See Zelazny (2012), where the cost per identification is estimated at approximately $0.79, based on
200 million people enrolled at the time.
21
See UIDAI (2019a). For other comprehensive guides to Aadhaar, see also GSMA (2017), IDinsight
(2017) and UIDAI (2019b).
10 BIS Papers 106As a general purpose identity, it is usable across various functions which has
increased consumer convenience and lowered transaction costs. The use of
biometrics unique to the individual also significantly reduces the possibility of misuse.
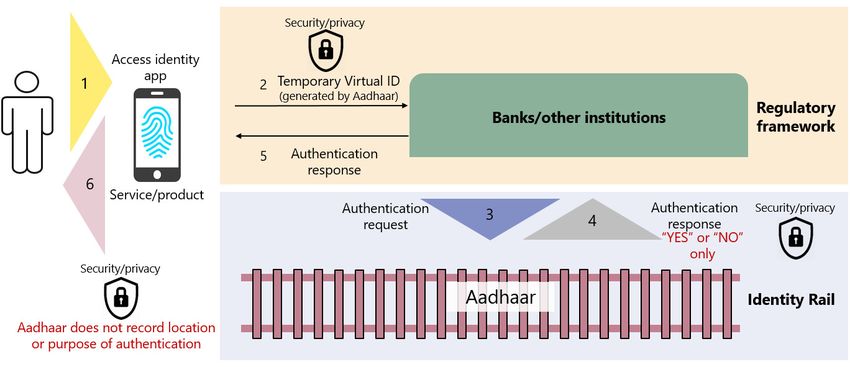
The workings of the Aadhaar identity rail, by which individuals identify
themselves to obtain services and products, are depicted in Graph 6. This includes a
number of privacy protection features. When the individual accesses the Aadhaar
identity app, the app generates a temporary “virtual ID” that connects to the original
Aadhaar number and can be used to verify the identity.22 By virtue of not being
permanent, it does not allow financial institutions or data brokers the institutions may
transact with to put together a detailed profile combining transactions across
databases.
Furthermore, when the bank or other institutions send an authentication to
Aadhaar, the application does not record the location or purpose of authentication.
Similarly, the authentication response to the providing institution is “Yes” or “No”
only; no other information about the individual is conveyed.
Aadhaar – the identity rail Graph 6
This overview of the structure by no means implies that the workings of Aadhaar
are flawless. There have been some publicised data breaches, and a number of critics
worry about the threat to individual privacy from a single identification number,23
although these people argue less for scaling back Aadhaar than for enhanced cyber
security, as well as legislation that protects the privacy of its citizens and efforts to
educate the population about their data rights.
22
The virtual ID is valid for a minimum of a calendar day, although the individual can continue to use it
up to the point that he or she voluntarily decides to generate a new one. See UIDAI (2019b).
23
See the discussion in Khaira (2018). Agrawal et al (2017) argue for stronger legal and policy
frameworks to ensure the privacy and security of Aadhaar.
BIS Papers 106 11b. Expansion and impact on financial inclusion
Aadhaar has been adopted at an extremely rapid pace. Today, over 1.2 billion Indians
have an Aadhaar number, and the system is used to authenticate identity some 900
million times a month (Graph 7). Aadhaar has also served as the basis for other
significant policy initiatives – most notably, the Pradhan Mantri Jan Dhan Yojana
(PMJDY) initiative launched in 2014. Under this financial inclusion programme, the
government allowed simple, no-frills bank accounts to be provided to individuals if
they could supply their identity details. By December 2019, almost 380 million bank
accounts had been opened under PMJDY.24 The Direct Benefit Transfer programme,
another government initiative launched in 2013 that has benefited from Aadhaar
authentication, permits the government to place subsidies directly into bank
accounts. In the 2018/19 financial year, about one third of transfers under the
programme, amounting to nearly $12.3 billion25 or 0.4% of GDP,26 were paid by the
government into an Aadhaar-linked bank account.
Aadhaar: speed of adoption Graph 7
Enrolment in Aadhaar1 Volume of Aadhaar-linked authentications
Millions Billions Billions
Demonetisation
1,000 1.2 40
36 bn
750 0.9 30
500 0.6 20
250 0.3 15 bn 10
1 bn
0 0.0 0
2011 2012 2013 2014 2015 2016 2017 2018 Nov 2012 2013 2014 2015 2016 2017 2018 2019
2019
Lhs: Rhs:
Monthly authentications Cumulative authentications
1
For data during the period from 2011 to 2016, see State of Aadhaar Report, Figure 2.1. For 2018 and current data, see UIDAI dashboard,
https://uidai.gov.in/aadhaar_dashboard/. The value for 2017 is linearly interpolated.
Source: IDinsight, State of Aadhaar Report 2016–17, May 2017; UIDAI; iSPIRT.
In sum, the speed of adoption of Aadhaar – together with the other government
initiatives mentioned above – has also led to a sharp increase in bank accounts.
Between 2011 and 2017, some 470 million Indian adults opened a bank account in a
financial institution. As mentioned earlier, the share of the population with bank
24
See Pradhan Mantri Jan Dhan Yojana, https://pmjdy.gov.in/account.
25
The 2018/19 financial year runs from April 2018 to March 2019. See Direct Benefit transfers,
Government of India, https://dbtbharat.gov.in/; and National Payments Corporation of India,
https://www.npci.org.in/.
26
GDP data from IMF, World Economic Outlook, October 2019.
12 BIS Papers 106accounts soared to 80% – the largest increase (45 percentage points) recorded for
any of the 121 countries in our sample during this period.27
The increase in financial inclusion was also accompanied by a sharp reduction in
the exclusion of marginalised groups more generally (Table 1). The gender gap – the
difference between the shares of men and women with a bank account – diminished
from 17% in 2011 to 6% in 2017.28 Similarly, the inclusion difference between those
in and out of the labour force fell from 18% to 9%; between those with secondary
education and those without from 29% to 10%; and between rich and poor from 14%
to 5%. The gaps are now all less than world levels.
Closing inclusion gaps Table 1
2011 2014 2017
India India India World
Percent with bank account 1
35% 53% 80% 67%
Gender gap 17% 20% 6% 7%
Men 44% 62% 83% 71%
Women 26% 43% 77% 64%
Employment gap 18% 23% 9% 14%
In-labour force 44% 63% 84% 72%
Out-of-labour force 26% 41% 75% 58%
Education gap 29% 21% 10% 23%
Secondary education or more 59% 64% 85% 77%
Primary education or less 31% 43% 75% 54%
Income gap 14% 15% 5% 13%
Richest 60% 41% 59% 82% 72%
Poorest 40% 27% 43% 77% 59%
1
All data in this table reflect bank accounts held by people aged 15 and older.
Sources: A Demirgüç-Kunt, L Klapper, D Singer, S Ansar, and J Hess, “The Global Findex Database 2017: Measuring financial inclusion and the
fintech revolution”, World Bank Group, 2018; World Bank, Global Findex Database.
c. Electronic KYC (e-KYC)
In addition to the PMJDY financial inclusion and Direct Benefit Transfer programmes
mentioned above, Aadhaar has also paved the way for making it much easier for
individuals to navigate the know-your-customer (KYC) processes used by regulated
entities – such as banks, other financial institutions and telecommunications
27
The sample consists of countries which reported data on bank accounts held by people aged 15 and
older in the World Bank’s Global Findex database both, in 2011 and in 2017. The country set is then
matched with GDP per capita using the IMF’s World Economic Outlook database and further
restricted to GDP below $50,000 to remove outliers.
28
That innovation which enhances access to digital financial services can increase the financial inclusion
of women in particular is a point emphasised by Melinda Gates (2019).
BIS Papers 106 13companies – to evaluate new customers and satisfy regulatory requirements.29 In
2012, the government launched electronic KYC (e-KYC), which allows banks and other
companies to handle the KYC processes paper-free, reducing the costs of engaging
new customers while complying with bank and anti-money laundering regulations.
Aadhaar qualifies as an officially valid identity as part of the package for e-KYC
requirements.30
Many countries, including India, prefer a conservative approach to KYC to
prevent fraud in financial transactions, requiring in-person verification of identify by
a trusted agent at the first instance. The cost of procuring and verifying this identify
from every customer can be a major hurdle to innovative financial products and
financial inclusion.
Aadhaar-based e-KYC is fast and cheap and it simplifies the process for accessing
a range of financial services.31 Instead of providing multiple paper identity
documents, customers can use biometrics to allow their service provider to access
their demographic information and photograph for verification. E-KYC can verify
instantly and at significantly less cost than conventional KYC that the details on the
ID are true and that the person with the ID is who they claim to be. As a paperless
system, e-KYC also reduces the risk of document forgery. At the same time, India’s
regulators remain prudent in enforcing compliance requirements, since e-KYC still
requires in-person verification for the initial opening of fully fledged bank accounts,
in the presence of an approved agent. But with a network of local shops adopted as
an agent, e-KYC is still less cumbersome than regular KYC practice.
The strictness of e-KYC for opening bank accounts makes it a reference point
– “foundational e-KYC” – for the e-KYC performed for other purposes. For example,
the e-KYC requirements for opening a brokerage or investment account are fulfilled
with a one-time password for the second-factor authentication over the phone, as
long as the customer already has a bank account that has undergone e-KYC as
described above.
The impact of e-KYC has been substantial. A total of 8 billion e-KYC requests
have been received since 2012; an average of 3 million Aadhaar-based e-KYC requests
have been processed per day over the last 12 months. According to one estimate,
banks that use e-KYC could lower their cost of compliance with mandatory KYC
processes for setting up accounts from $15 to around $0.07.32 Thus, Aadhaar has not
only made a digital KYC process possible but has also dramatically reduced its costs.
d. Other applications
The ability to use Aadhaar to authenticate and verify identity on demand, at
significantly lower transaction costs, has significant scope to enable access to many
29
KYC is the process of verifying identity and assessing if the customer is suitable for a business
relationship. Before opening a basic bank account, banks are required to conduct a KYC check for
regulatory compliance requirements, to prevent fraud, money laundering and terrorist financing.
30
India’s Supreme Court has ruled that the use of Aadhaar is mandatory for the distribution of
government subsidies and benefits, but not for opening bank accounts. See UIDAI Circular “Hon.
Supreme Court’s Aadhaar judgement”, October 2018, https://uidai.gov.in/about-uidai/legal-
framework/circulars.html.
31
Turnaround time for retail customer onboarding for a large bank is down from six days to one hour
(India Stack (2016)).
32
See Hariharan (2016).
14 BIS Papers 106more products and services in a range of industries. For this, a suite of applications
linked to Aadhaar have been developed:
• ESign allows any individual with Aadhaar to sign documents digitally on their
phones. The signature is issued only after biometrics have been confirmed or a
one-time password has been used. So far, it has been heavily used for income
tax returns, which are all digitally signed, and is anticipated to make it simpler for
small and medium-sized enterprises to sign invoices, which, in turn, could
support invoice financing for these enterprises.
• DigiLocker is an online repository (cloud-based) of digital documents.
Government organisations registered with DigiLocker can deposit digital copies
of documents issued by them directly into citizens’ lockers. Since documents are
already verified by the issuer, individuals can use the documents to access various
services, from banking to telecommunications, and potentially also the health
care sector. A person can also upload other documents, such as land records and
insurance policies, and share them using the eSign capability. So far, about 30
million people have been using this service.33
Rail 2: Payment systems
a. Initial conditions
India has traditionally had a high level of cash usage. Cash in circulation was 11.2% of
GDP in 2018, which while not as high as Japan and Hong Kong SAR, was well above
the average of countries covered in the Red Book statistics of the Committee on
Dominance of cash Graph 8
Cash in circulation as a share of GDP1 Transactions in cash only3
Per cent Per cent
Paid utility bills
20
Received private
sector wages
15
Received payments
for agricultural products
2014 average = 9 10
Sent or received
domestic remittances
5
Received government
payments
0
2
JP HK IN CN EA SG US KR ID TR GB ZA SE 0 20 40 60 80
2014 2018 2014 2017
1
Cash in circulation from the CPMI Red Book statistics. The weighted average of 2014 is calculated using GDP from the IMF World Economic
Outlook. 2 Euro area. 3 Cash transactions as a percentage of the respective population involved in such transactions and older than
15 years. See World Bank, Global Findex Database.
Sources: A Demirgüç-Kunt, L Klapper, D Singer, S Ansar and J Hess, “The Global Findex Database 2017: Measuring financial inclusion and the
fintech revolution”, World Bank Group, 2018; IMF, World Economic Outlook, October 2019; World Bank, Global Findex Database; CPMI, Red
Book statistics.
33
See DigiLocker, Government of India, https://digilocker.gov.in/.
BIS Papers 106 15Payments and Market Infrastructure (CPMI), as well as above the ratios of comparable
emerging market economies such as China, Indonesia, South Africa and Turkey
(Graph 8, left-hand panel). In India, cash has been used for a significant proportion of
all transactions, including the payments of wages and utility bills, domestic
remittances and some government payments (Graph 8, right-hand panel).34
In a society where many consumers have been reluctant to take on debt,
payment card usage has been relatively low. In fact, the share of all payment card
transactions – which includes debit cards, credit cards and prepaid instruments – in
India is below 8% of GDP, well below not only advanced economies such as the United
States and the United Kingdom, but also the comparable emerging market
economies mentioned earlier, with the exception of Indonesia (Graph 9). This meant
that there was the absence of an entrenched legacy framework devoted to card-
related payments that could have slowed efforts to modernise the payments
framework.
Payment cards have not gained popularity
Value of payment card transactions1 as a share of GDP in 2018 Graph 9
Per cent
840
40
30
20
10
0
2
CN KR GB US ZA SE TR SG JP DE IN ID
1
Debit cards, credit cards and prepaid instruments, which CPMI defines as “e-money”. 2
The value for China (CN), at 840%, is off this scale.
Source: IMF, World Economic Outlook, October 2019; CPMI, Red Book statistics.
At the same time, the domestic banking system employed an array of payment
options that were not interoperable; furthermore, users could not integrate their
payments across different payment systems. For example, sending money from an
account at one bank to an account at another bank could take up to two calendar
days, if sent after a cut-off time, and even longer over weekends or holidays. In
addition, non-bank wallet providers were outside of the system, making it impossible
to make a direct transaction from, for example, a Google Pay account to another
account on WhatsApp. The system was ripe for change.
b. Unified Payments Interface (UPI)
UPI is an instant real-time payment system developed by the National Payments
Corporation of India (NPCI) – a non-profit owned by the Reserve Bank of India (RBI)
34
For further evidence that the Indian economy has been relatively cash-heavy and estimates of the
costs of the phenomenon, see Bech et al (2018), Bapat et al (2019) and Visa (2016). For benchmarking
of India’s payment system to other economies, see Reserve Bank of India (2019a).
16 BIS Papers 106and 56 commercial banks. In operation since 2016, it is regulated by the RBI. Primarily
intended to bring payment efficiencies to low value transactions, UPI unified multiple
legacy payment systems via an open API architecture.35
The UPI system works by virtualising accounts, with uniform addresses along the
lines of email addresses. It allows a wide range of methods for customers and
operators to transfer funds within the system, using any of the following: a virtual
payment address (VPA) or UPI ID, a mobile number, a bank code and account number,
an Aadhaar number, or even a QR code which has captured any of the above
information. The system operates 24/7, is frictionless/straight-through (ie requires no
manual intervention) and enables access to funds instantly. It covers all types of
consumer-to-consumer (C2C) and consumer-to-business (C2B) payments, as well as
many business-to-business (B2B) payments.
The mechanics of the UPI payment rail and how it connects payment system
participants together are illustrated in Graph 10. In addition to the security and
efficiency attributes mentioned earlier, the following features are worth noting:
• Interoperability: The open API architecture enables individuals to use a single
bank or payment service application to manage their money residing in multiple
banks, as well as to execute and receive payments through UPI. As an example,
retail customers can conduct transactions on their accounts at Bank A from inside
the mobile banking app of Bank B. The greater ease of transferring funds
between banks offered by UPI ensures greater competition on bank interest rates
and services. Likewise, as long as the interfaces are linked to a UPI member bank,
users can use fintech or big tech interfaces that they are familiar with to execute
payments.36
• Open/contestable entry (including big techs): Any regulated payment service
provider can directly use UPI to transfer funds between individuals, bank
branches/correspondents, ATMs, POS machines and mobile subscribers. Fintech
and big tech firms can also ride on the UPI rail, through regulated payment
service providers, to offer services: WhatsApp has a pilot under way for its peer-
to-peer payment service in India, which, when approved, will offer over 400
million37 users in India another means of payment via a trusted interface, and
within the regulated system. Smaller domestic payment service providers such as
Paytm, PhonePe and OlaMoney also connect with UPI through regulated
payment service providers.38
• Within the regulatory framework: As mentioned above, the UPI platform itself
is regulated by the RBI. While all payment system players have access to the
system, with the exception of some prepaid instruments (eg prepaid cards), only
regulated banks can transfer money along the UPI payment rail. The
35
As of December 2019, the upper limit of fund transfers using UPI is ₹100,000 (roughly $1,500); see
https://www.npci.org.in/what-limit-fund-transfer-using-upi. For a comprehensive overview of UPI,
see Desai et al (2017). Further information can be found in National Payments Corporation of India
(2016, 2018a, 2019). For a guide to NPCI activities and their evolution more generally, see Cook and
Raman (2019).
36
For discussions of wallet interoperability, see Gupta (2018).
37
See techcrunch, July 2019, https://techcrunch.com/2019/07/26/whatsapp-india-users-400-million/.
38
“NPCI statement pertaining to WhatsApp BHIM UPI beta launch”, www,npci.org.in/press releases, 16
February 2018.
BIS Papers 106 17establishment of payment banks39 has enabled telecom providers as well as the
postal system to join the banking network. These digital payments are also
settled within the banking system, in fiat currency. As of December 2019, 14340
banks were on UPI, representing more than 90%41 of the Indian banking
industry’s total assets.
UPI – a payments rail Graph 10
c. Expansion and impact
With almost all of the Indian banking industry’s customers and fintech companies
able to access UPI and offer instant payment services on it as well, the use of UPI has
expanded quite rapidly since its inception (Graph 11, left-hand panel). The monthly
volume of UPI digital retail transactions has risen seven-fold since the beginning of
2018; in November 2019, there were more than a billion transactions, totalling around
$27 billion in value. For the six months through September 2019, payments via UPI
accounted for 25% of the volume of all digital retail payments, compared with much
smaller numbers for other forms of payment (Graph 11, right-hand panel). In value
terms, UPI remains much smaller, though this is as expected since it has primarily
brought efficiencies to low-value retail transactions.42
39
Payment banks provide (i) small savings accounts and (ii) payment/remittance services to migrant
labourers, low income households, small businesses, other unorganised sector entities and other
users; see https://www.rbi.org.in/scripts/ BS_PressReleaseDisplay.aspx?prid=32615.
40
See https://www.npci.org.in/upi-live/members.
41
At end-March 2019, see ProwessIQ database.
42
The value of retail transactions on UPI represents only 0.3% of total payments in India in the 2018/19
financial year. Total payments include digital transactions and cheque clearing and excludes cash
transactions. See Reserve Bank of India, https://www.rbi.org.in/scripts/Publications
View.aspx?Id=19057. For an in-depth discussion of the transition for cash to non-cash and cheque
to digital payments in India, see Reserve Bank of India (Maiti (2017)).
18 BIS Papers 106UPI has become the most common method for digital retail transactions Graph 11
Monthly UPI transactions grow at dizzying rate Share of digital payments by volume from April to Sept
20191
Millions
1,000
12%
750 25%
13%
500
7% 6%
250 14% 14%
9%
0
2016 2017 2018 2019 UPI Credit card Debit card Other
Internet and mobile banking PPI
Volume of transactions:
Recurrent electronic payments Electronic payments
UPI Credit card at point of sale
Mobile wallet Debit card at point of sale
1
Credit card = credit card payments at point of sale and online. Debit card = debit card payments at point of sale and online. PPI = prepaid
payment instruments, comprising mobile wallets and prepaid cards. Recurrent electronic payments = payments through the National
Automated Clearing House (NACH). Electronic payments = payments through the Immediate Payment Service (IMPS), National Electronic
Funds Transfer (NEFT) and Real Time Gross Settlement (RTGS). Other = other digital payments as defined by DigiDhan Dashboard: BHIM
Aadhaar, closed loop wallets and other. Digital payments such as Unstructured Supplementary Service Data (USSD) and National Electronic
Toll Collection (NETC) are excluded due to the possible impact of double-counting. Aadhaar-enabled payment services (AePS) system is also
excluded as it includes cash withdrawal and cash deposit transactions that are not considered payment transactions.
Sources: Reserve Bank of India; DigiDhan Dashboard; NPCI.
UPI has thus facilitated the large-scale adoption of digital retail payments in
India, increasing from 65% in 2013/14 to 95% in 2018/19 (Graph 12). Aided by a
young population,43 mobile penetration increased connectivity and led to a
significant reduction in the costs of mobile data consumption, which means that
digital payments in India are bound to increase further. At the same time, the fact
that the increase in digital retail payments is occurring through UPI ensures that the
increasing transition to instant, round-the-clock payment services is in fiat money that
settles within the banking system.44
43
Over two thirds of the population is under 35 years of age. See Office of the Registrar General and
Census Commissioner India, https://censusindia.gov.in. That the leveraging of mobile phone
technology was the key trigger to sizeable increases in financial inclusion is a point emphasised by
Bank of Kenya Governor Patrick Njoroge (2017).
44
For further discussion of the digital payments outlook in India and elsewhere more generally, see
Bank of England (2019), Das (2019), Deloitte and Internet and Mobile Association of India (2017),
McKinsey & Company (2018, 2019), Reserve Bank of India (2019b, 2019c) and Visa (2016). For articles
paying particular attention to the development of mobile technology for digital finance in India, see
Deloitte and Associated Chambers of Commerce and Industry of India (2016), Deloitte and
Confederation of Indian Industry (2016), Ernst & Young LLP and Associated Chambers of Commerce
and Industry of India (2018) and McKinsey Global Institute (2019a).
BIS Papers 106 19You can also read