Capturing the value of community fuel poverty alleviation
←
→
Page content transcription
If your browser does not render page correctly, please read the page content below
Law Research Paper Series
                                                Paper #002 2021

                            Capturing the value of community
                            fuel poverty alleviation

Colin Nolden, Daniela Rossade and Peter Thomas
University of Bristol Law School
Wills Memorial Building
Queen’s Road
Bristol
BS8 1RJ

                      bristol.ac.uk/law/research/legal-research -papers

ISSN 2515-897X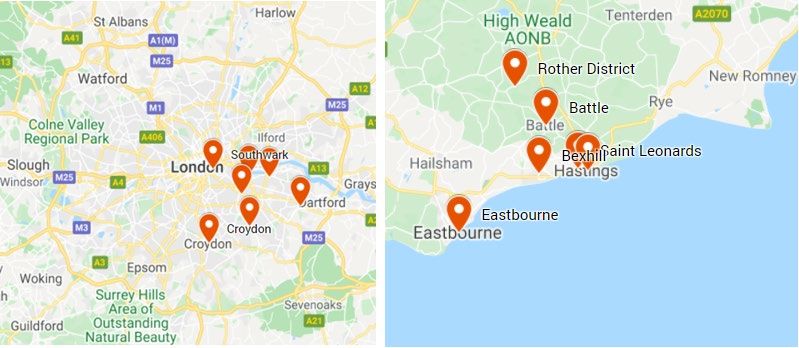
The Bristol Law Research Paper Series publishes a broad range of legal scholarship in all subject
areas from members of the University of Bristol Law School. All papers are published electronically,
available for free, for download as pdf files. Copyright remains with the author(s). For any queries
about the Series, please contact researchpapers-law@bristol.ac.uk.
Capturing the value of community fuel poverty alleviation

                          Colin Nolden 1, Daniela Rossade 2, Peter Thomas 3

This report summarises the findings of the ‘Capturing the value of community energy’ business
collaboration project. Completed between September 2020 and January 2021, a team of researchers
from University of Bristol (Vice-Chancellor’s Fellow Colin Nolden and PhD Researchers Daniela
Rossade and Peter Thomas) analysed company data stretching back to 2015 from Energise Sussex
Coast (ESC) and South East London Community Energy (SELCE), two non-profit social enterprises that
seek to act co-operatively to tackle fuel poverty and the climate crisis. Both have won multiple awards
for their work which includes community owned renewable energy schemes and tackling fuel poverty,
which involves reaching out to vulnerable members of their communities to help them understand
their energy bills, switch suppliers and reduce their energy demand. This business collaboration
involved the analysis of their fuel poverty alleviation data to gain a better understanding of what fuel
poverty advice and energy saving action works and what does not. We pursued a three-pronged
approach to the data analysis. Firstly, we tried to establish comparability among the quantitative
datasets to compare their approach, outreach and success in tackling fuel poverty. Secondly, we
calculated the Social Return on Investment (SROI) using one specific dataset from 2018/19. Thirdly,
we analysed the qualitative data to gain a deeper understanding of links between organisational
approaches, fuel poverty alleviation interventions, data capture and management, and the funding
environment. Due to complicated and highly variable reporting procedures it was only possible to
establish comparable datasets on a few metrics which reflect requirements set by funders. The SROI
calculation revealed that community fuel poverty alleviation efforts undertaken by companies such as
SELCE and ESC has a SROI of 9-10:1 for every £1 invested. The qualitative analysis revealed the
systematic underreporting of such value as funders’ targets are narrowly defined around numbers
rather than genuinely lifting people out of fuel poverty. This report concludes with some
recommendations to improve the operational environment for community fuel poverty alleviation
services, especially given their invaluable efforts in reaching out to some of the most vulnerable
members of our communities.

This research was funded by the Economic and Social Research Council (ESRC), Impact Accelerator
Account (IAA), Accelerating Business Collaboration (ABC), Grant Agreement Number ES/V502182/1.

1
  Vice-Chancellor’s Fellow in Energy and Climate Governance, Law School, University of Bristol and Researcher,
Centre for Research into Energy Demand Solutions, Environmental Change Institute, University of Oxford
2
  PhD Researcher, Department of Mechanical Engineering, University of Bristol
3
  PhD Researcher, Department of Civil Engineering, University of Bristol

                                                      1
1. Introduction
The following is an excerpt from a 2016 Big Energy Savings Network (BESN) report analysed as part of
this business collaboration. It highlights fuel poverty alleviation funding and data reporting issues and
summarises the importance of this analysis:
        It is a large amount of work to only fund 1 person for £5k to ensure delivery of 100 1:2:1
        customised energy advice sessions and 40 frontline workers. [Our organisation] has had to
        contribute our own funds in order to be able to reach targets. […]. The funding certainly doesn’t
        cover time needed for any follow up advice such as tracking identified savings. Many
        beneficiaries will only switch once they have discussed the issue with fellow householders and
        only if they have this vital follow up support. […] Funding simply does not allow for this
        following up work. […]. Maybe it would be better to record ALL identified savings then also
        record if they switched or not. For example, during March we identified savings totalling
        £7,864 but actually people switching on the day £3,064. Also, from a financial point of view
        [Warm Home Discount] is worth an extra £140 per year. The focus on recording savings from
        switching underestimate the total savings from a combination of switching and access to the
        [Warm Home Discount].
For community organisations engaging in fuel poverty alleviation, this narrow focus on targets,
especially advising a minimum of 100 vulnerable people through 1:2:1 advice sessions, and switching
suppliers during these sessions, even though Warm Home Discounts (WHD) provide an additional
means of reducing expenditures, is evidently frustrating.
        As an organisation we were aiming to be cost effective but it was hard when people need 20-
        mins to 90 mins, depending on how vulnerable or complicated their situations are. The only
        thing we could do to overcome these barriers was deliver more sessions.
Against this backdrop it might appear strange that the UK was the first country to define fuel poverty
and politically recognise it as an issue. Initially it was defined as a household that “needs to spend
more than 10% of its income on fuel to maintain an adequate level of warmth”. However, this
definition was considered too sensitive to fluctuations in gas and electricity prices as well as
assumptions about what constitutes an adequate temperature (Hills 2012). In 2012 it was replaced by
the Low Income High Cost (LIHC) indicator where fuel poverty is defined as a household that has fuel
costs that are above average and, were they to pay that amount, would be left with a residual income
below the official poverty line. However, this definition has also been criticised due to the significant
reduction in the projected number of fuel-poor households it entails (Bouzarovski 2018).
Although these definitions are important, they are not relevant to this report as SELCE and ESC reach
out, and provide services to, vulnerable people more generally. Fuel poverty tends to be one aspect
of their vulnerability, often compounding other vulnerabilities, and one which can be at least partly
alleviated through a wide range of interventions. To really address these vulnerabilities, however,
systemic changes, including better housing conditions, addressing the widening gap between the rich
and the poor and better mental and physical support, just to name a few, are necessary.
Organisations such as SELCE and ESC nevertheless provide an essential service in reaching out to the
vulnerable whose vulnerabilities are increasing in the absence of such system change. At the same
time, Covid-19 has pushed more people into vulnerable situations while traditional approaches of
community fuel poverty outreach, including energy shops, energy cafes and home visits, have not
been possible. These are challenging times for a sector doing significant, often life changing work on
a shoestring while desperately applying to funders who are mainly focused on chasing numbers and
who have created a competitive market environment which drives consolidation in the hands of large
organisations with no community links.

                                                   2
This business collaboration evolved out of discussions about the difficulty establishing anything
resembling a self-sustaining community fuel poverty alleviation business model in light of these
challenges. The initial objective of trying to establish which community fuel poverty alleviation
approach works and which do not work progressed into the need for a reflective policy piece that goes
beyond the existing research conducted on behalf of funders which has tended to deliver what funders
want to hear.
SELCE’s objective is to use this to influence funders to focus on what funding really works by
overcoming assumptions about what community fuel poverty alleviation can and cannot deliver. ESC
on the other hand want to understand what enables economies of scale, what is transferrable and
what can be considered a standardised approach that delivers specific outcomes, which could be
included in a support documentation for other organisations. Both want better data, better databases
and better baselines as the funding environment is tipping towards organisations with very good data
capturing, management and dissemination infrastructures. Both have a desire to use this business
collaboration to develop a better understanding of what will alleviate fuel poverty?
This report is structured as follows: Section 2 provides background information on fuel poverty
alleviation at European and UK level, as well as policies, strategies and funding which play a role in
supporting organisations such as SELCE and ESC. Section 3 introduces the two organisations in more
detail, their funding environment which determines their approach to fuel poverty alleviation, their
data capturing and management approaches which are largely determined by their funding
environment, and the methodologies we used to analyse this data. Section 4 analyses their company
data, firstly by establishing comparability among the quantitative datasets and secondly by calculating
the SROI. Section 5 contextualises these findings to gain a deeper understanding of links between
organisational approaches, fuel poverty alleviation interventions, data capture and management, and
the funding environment. Section 5 provides a discussion of this business collaboration. Section 6
concludes and Section 7 provides policy recommendations.

2. Background
    2.1 UK fuel poverty in context
EU Energy Poverty Observatory (EPOV, 2019) figures show that 5.4% of the UK’s population of around
67 million (2018 figures) reported that they were unable to keep their homes adequately warm in that
year, compared to an EU average of 7.3%. Similarly, 5.4% were unable to pay their utility bills on time
due to financial difficulties, compared to an EU average of 6.6%. Although this demonstrates that the
UK fares better than the EU average it means that approximately 3.6 million households in the UK are
in fuel poverty. Importantly, among the poorest 20% of society, 78% of households live in fuel poverty
(NEA 2020). At the same time, 18.8% of households spend large proportion of their income on energy.
These households are likely to occupy dwellings with poor energy efficiency ratings. As a reflection of
poverty more generally, these households are also more likely to live in private rented accommodation
(see Table 1 based on the LIHC calculation).

             Energy Efficiency Band           Not Fuel Poor        Fuel Poor              Ratio
             A/B/C                            1,495,000            57,000                 96:4
             D                                1,790,000            431,000                80:20
             E                                338,000              230,000                60:40
             F/G                              124,000              89,000                 58:42
Table 1: Private rented homes by energy efficiency band (England only, 2018; BEIS 2020)

Based on the UK government’s LIHC calculation, around 18% of private rental sector households are
in fuel poverty, compared to 9% of social housing households and 8% of owner-occupied households

                                                            3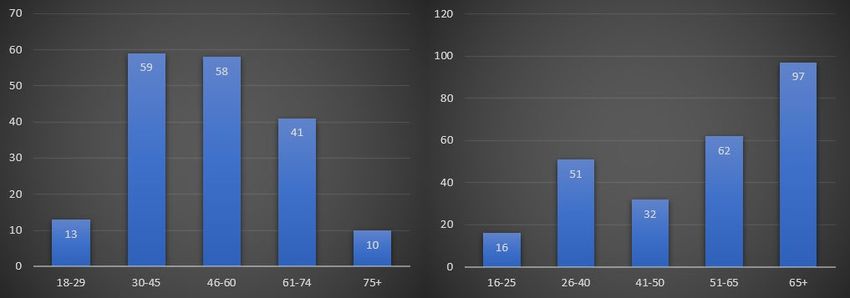
(BEIS 2020). Using a different calculation, National Energy Action concludes that around 1 in 7 UK
households experience fuel poverty and live in homes that are difficult and expensive to heat (NEA
2020).

Compared to other European countries, energy bills are higher in the UK in part because of poor
infrastructure and inefficient housing stock, which is among the oldest in Europe. In 2017, according
to the Building Research Establishment Trust report on The Housing Stock of the United Kingdom
(Piddington et al., 2020), around 20% of UK houses were built before 1919 and only 25% were built
after 1980.

With its history of poor housing, fuel poverty has long been recognised as an issue in the UK
(Boardman 1991). This has resulted in an accumulation of experience in community engagement,
social policies and practical methodologies to address it. The issue of fuel poverty is also increasingly
recognised as a major public health problem in the UK. An estimated 9,700 deaths each year “are
attributable to the avoidable circumstances of living in a cold home” (Guertler and Smith 2018: 2).
According to E3G and National Energy Action (Guertler and Smith 2018), a baby born into cold housing
is three-times more likely to suffer from illness such as respiratory diseases than a baby born into
warm housing which in turn results in a 30% greater risk of hospital admissions. As the child develops,
the effect of growing up in cold housing reduces long-term educational attainment due to illness
and/or because they cannot find a quiet, warm place to study. One in four teenagers growing up in
such conditions are at risk of multiple mental health problems.
In the UK almost 20% of households with a child under 16 lives in fuel poverty. Among lone parent
households, the number climbs to 25%. Even regular work and income does not necessarily alleviate
fuel poverty, with 47% of fuel poor households in full or part-time work. These issues are compounded
for households in fuel debt that are forced to use a pre-payment meter because they are typically
excluded from the cheapest tariffs. This can create anxiety, exacerbate mental health problems and
lead to further depression and potentially suicide (Guertler and Smith 2018). In later life, fuel poverty
often leads to poor physical and mental health, as well as loneliness. This is important because health
conditions such as cardiovascular and respiratory diseases, falls and injuries and mental health cost
the NHS an estimated £1.36 billion per year (Age UK 2012).
With energy bills expected to increase by up to 20% due to Covid-19, more households sheltering and
working from home, and incomes declining due to redundancies and general economic uncertainty it
is possible that more households will be facing fuel poverty in the future. This could have devastating
long-term effects on all household members, but especially children. Home energy improvements to
address fuel poverty have shown to decrease the rate of sickness absence from school by 80% for
children with asthma and recurrent respiratory infections (Somerville et al. 2000; in Guertler and
Smith 2018).

    2.2 The UK fuel poverty policy and alleviation environment
Despite years of engagement and developing understandings of the causes and effects of fuel poverty,
including a desire to eradicate fuel poverty in the Warm Homes and Energy Conservation Act 2000
(DETR 2000; HM Government 2015), there is no national system in place to help the vulnerable. Nor
is a national fuel poverty registry in place to track progress, not to mention an adequate support
infrastructure. This is regularly identified as a significant flaw in the system, with a study supported by
the Chesshire Lehmann Fund (2016) stating that:
        “The success of the [Big Energy Saving Network] scheme, continued in 2016, should not mask
        the very real challenge facing all voluntary and public sector organisations: namely that there
        is little or no effective national energy advice infrastructure in the UK”

                                                    4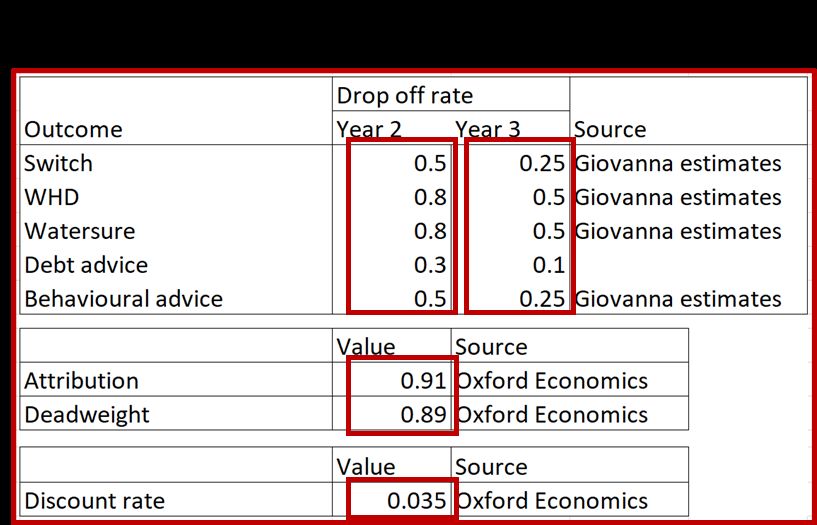
Successive governments have shown no interest in these issues. Community organisation wishing to
address fuel poverty in their local areas are at the whim of funders, mostly energy utilities, who are
required by the Office of Gas and Electricity Markets (Ofgem) to address fuel poverty. Such utilities,
however, do not have a good track record of treating their customers fairly and Ofgem does not have
a good track record of encouraging them to do so either.
Grants are often targeted at supplier switching and receiving income supplements such as the Warm
Home Discount (WHD). Although these are essential and vital activities that provide immediate
benefits to households in fuel poverty, tackling this issue systematically would require an overall
improvement of housing conditions as well as more equal wealth distribution. In the absence of a
supportive policy regime to address these issues, the value of engaging with and visiting the fuel poor
in their homes morph from admirable recognition at national level into numbers of “customers” on
funders’ spreadsheets.
Nevertheless, a wide range of community organisations, charities and NGOs work against the odds to
provide fuel poverty alleviation work throughout the UK. Paid staff are essential for continuity and in-
depth advice to grant the fuel poor the financial support they are entitled to. Advice workers in the
community are trusted and have detailed knowledge of their local areas. Due to a lack of funding,
however, these organisations struggle to maintain their operations.
At the same time, the sector is in flux. In the past, organisations were motivated by government
policies and targets around fuel poverty. In the early 2000s, these included the 2001 Fuel Poverty
Strategy and the cross-government commitment to end fuel poverty by 2015 (DETR 2000; CEE 2020).
Such ambitions were reinforced in the 2010s through the Fuel Poverty (England) Regulations 2014
which set a target requiring that as many fuel poor homes as is reasonably practical achieve a
minimum energy efficiency rating of Energy Performance Certificate Band C by the end of 2030. In
2015, the Fuel Poverty Strategy established interim milestones of “raising as many fuel poor homes as
reasonably practical to Band E by 2020, and as many fuel poor homes as is reasonably practical to
Band D by 2025” (BEIS 2020: 15).
The 2010s also saw the launch of the feed-in tariff (FIT) for renewable electricity generation. As a
result, community groups in particular started shifting their focus towards electricity generation,
sometimes to develop a sustainable income stream to support their fuel poverty alleviation work
(Nolden et al. 2020). The focus has shifted once more following the termination of the feed-in tariff
and the declaration of a national net-zero carbon target as well as local climate emergencies in villages,
towns, cities and regions (Tingey and Webb 2020).

    2.3 Energy White Paper
The recently published Energy White Paper (published December 2020) will bring further changes to
the organisational and institutional environment of community fuel poverty alleviation services. It
commits to placing consumer costs and fairness at the centre of the energy transition. For example,
the report states that energy policies should protect the fuel poor, provide opportunities to save
money on bills, give us warmer, more comfortable homes and balance investments against bill
impacts. The report goes on to state that vulnerable consumers may need additional protections
appropriate to their circumstances and that people in fuel poverty will not be left behind. However, it
indicates that most changes will be set out in its Fuel Poverty Strategy for England, due to be published
in early 2021. The following areas of the report are particularly relevant to organisations such as SELCE
and ESC.

        2.3.1 Tariffs
The White Paper includes a commitment to consult by March 2021 on changes to tariffs including opt-
in and opt-out tariff switching. The report cites evidence that over 50% of consumers remain of default
tariffs and end up paying more than they need to despite almost all knowing they can switch. While

                                                    5
no specific polices are recommended the report notes that a study by Ofgem found that customers
can be prompted to switch with well-designed letters and emails. It also notes that the most successful
techniques were ones that removed as many steps as possible from the switching process and
provided additional reassurances, such as independent support.

        2.3.2 Smart System
There is recognition in the report of the role smart technologies including smart meters and smart
appliances will play in the future energy system. In theory these technologies help to ensure billing
accuracy by reporting exact usage to the energy provider and can help reduce bills, for example, by
automatically running the washing machine while electricity is cheap. However, these ‘smart
appliances’ are potentially out of reach of fuel poor households who may end by being penalised as a
result.

        2.3.3 Energy Efficient Retrofit
The Government indicates that there needs to be a significant push to ensure homes are more energy
efficient in order to significantly reduce demand and save money on their bills. In September 2020 it
consulted on proposal to ensure privately rented homes meet a minimum of EPC by 2029 and it plans
to consult on how mortgage lenders could support homeowners in making these improvements. The
report also notes that 44 per cent of all social rented homes in England currently have an EPC Rating
below C and committed to a review of the Decent Homes Standard which currently only stipulates
that homes should provide a reasonable degree of thermal comfort and be free of excess cold (broadly
equivalent to EPC Band F). Finally, it notes that the benefits of well-insulated homes, on health and
well-being and on bills, should not be the preserve of households which can afford to pay for energy
efficiency measures.

        2.3.4 Grants
The report outlines the Government’s intention to continue offering additional protections to the
vulnerable and fuel poor, through the Energy Company Obligation (ECO), the Warm Home Discount
(WHD) scheme and the Green Homes Grant. ECO and the WHD will both be extended to 2026 and the
WHD will be expanded so that all suppliers can offer it which will give fuel poor consumers more
flexibility regarding switching to a cheaper tariff with an alternative supplier. The Government also
plans to implement reforms to improve fuel poverty targeting, such as using government data to
provide automatic rebates to most recipients. Lower income households can receive up to £10,000 to
improve the energy efficiency of their homes via the Green Homes Grant scheme. Households can
also benefit from the £500 million of the Green Homes Grant that has been ringfenced for Local
Authority Delivery.
The two Accelerating Business Collaboration partners, ESC and SELCE, need to adapt their business
models accordingly. For the moment, however, they struggle to maintain the necessary income
stream to continue delivering award-winning energy poverty alleviation.

    2.4 Energise Sussex Coast and South East London Community Energy
Energise Sussex Coast (ESC) was founded in 2012 to address fuel poverty and increase renewable
energy generation in the Hastings area. Since 2013, ESC has been running pop up energy shops and
energy advice desks staffed mainly by trained volunteers in locations frequented by the fuel poor,
such as libraries, town halls, community centres, medical practices, job centres and day centres. To
achieve continuity in light of piecemeal funding, ESC complements grant income with renewable
energy generation. In the last 8 years, ESC has helped thousands of people make their homes more
efficient and save vulnerable people money on their bills, as well as lowering carbon emissions. Mostly
this has been achieved through face-to-face meetings and events where ESC representatives discuss
clients’ issues. As this has not been possible in 2020 due to Covid-19 restrictions, ESC has set up a new
Energy Helpline in collaboration with Hastings Advice and Representation Centre (HARC), alongside

                                                   6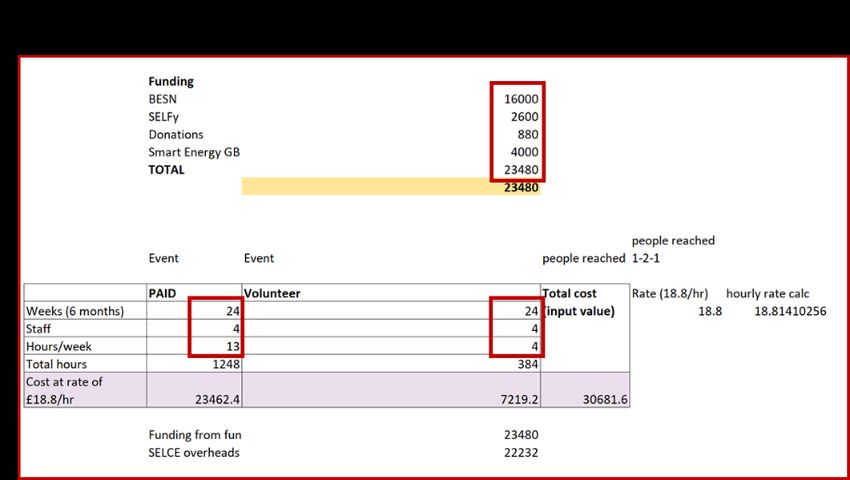
their online help. CEO Richard Watson was awarded an OBE in 2016 for services to the community of
Sussex.
South East London Community Energy (SELCE) was founded in 2014 and now comprises three strands.
The fuel poverty side of its business model, which increasingly includes energy efficiency, is highly
dependent on grant income are barely breaks even. To help address this issue, SELCE developed a
0.5MW community financed solar scheme to provide a continuous income stream. Increasingly, SELCE
is moving into the retrofitting business with able-to-pay clients by offering a wide range of energy
efficiency services. SELCE’s approach typically follows the sequence of switching to an energy company
which provides a Warm Home Discount (mainly funded through the Energy Company Obligation which
covers about half the money required), checking bills to assess whether they are higher than average
(standard contracts are for one year so this needs to be done on a regular basis) and home visits
(where possible) to improve energy efficiency. In 2019, SELCE was awarded the Community Energy
Social Impact Award at the Community Energy Awards.

    2.5 Funding and data
Relevant current grant providing organisations in the geographical and organisational context of ESC
and SELCE include:

    •   Department for Business, Energy and Industrial Strategy (BEIS) and National Energy Action
        (NEA) who fund the Big Energy Saving Network (BESN)
Launched by the Coalition Government in 2013, BESN is one of the largest programmes to support
third sector organisations and community groups to deliver help and advice to vulnerable consumers.
Following the success of the inaugural 2013/14 BESN, which reached over 90,000 consumers
nationally, the Department of Energy and Climate Change (now BEIS) provided £1m funding to
continue the programme into 2014/15. In 2017/18 this had increased to £1.7m.

    •   UKPN (UK Power Networks)
UKPN provided grants of up to £30,000 to address fuel poverty. This has been replaced by £300,000
per year to fund the Power Partners scheme which is administered by the Centre for Sustainable
Energy. Power Partners supports up to 40 organisations with grants of £2,000-20,000 to combat fuel
poverty, improve energy efficiency and support people in vulnerable circumstances. Together with
eight utilities UKPN donated another £500,000 to support vulnerable customers during Covid-19.
According to Julie Minns, Head of Customer Engagement, UKPN “provide an essential service to some
of the richest and poorest communities in Britain, and over the past few years we have developed our
role from simply keeping the lights on, to being a highly respected corporate citizen providing advice
and support to over 1.6 million customers in vulnerable circumstances” (UKPN, 2019).

    •   SGN (formerly Scotia Gas Network)
SGN’s engagement in fuel poverty alleviation is delivered through its Discretionary Reward Scheme. It
supports Ofgem’s Fuel Poor Network Extension Scheme and, according to its own accounts, has made
a voluntary contribution of £145m to consumers in November 2017. Together with stakeholders, SGN
has also established a £20m fund and created a dedicated team to address fuel poverty. Some of this
money is used to support partnerships with community organisations to deliver social outputs.
Together with UKPN, Thames Water and SSEN for example they supported a 2-year “Faith and
Utilities” project (SGN, 2018). SGN are particularly interested in knowing what works under what
cultural, geographical and demographic circumstances.

    •   The British Gas Energy Trust (BGET)
BGET was established in 2004 by British Gas as an independent Charitable Trust. Now a Charitable
Incorporated Organisation, it is governed by a group of Trustees with Jessica Taplin CEO overseeing

                                                  7
day-to-day operations. Its mission is to alleviate the detrimental impact of poverty, helping people in,
or at risk of, financial hardship to meet their energy needs and manage their energy costs through
support, education and raising awareness of sound money management. Through direct access grant
programmes for individuals, families and third-sector money and energy advice organisations, is seeks
to contribute to the relief of poverty, with a particular focus on energy poverty by helping those who
are struggling to pay for their gas and electricity consumption to get out of fuel debt.
Community Energy South, an umbrella organisation and regional hub enabling its members (local
community energy groups and community organisations) to grow as sustainable low carbon
businesses, provided match-funding from SGN for this project. This funding was used to pay the CEOs
of SELCE and ESC, Giovanna Speciale and Richard Watson OBE, for their time on this project. It covered
the sourcing, anonymising, sharing and interpretation of their company data.
As part of this business collaboration, community Energy South also contributed aggregate data on
fuel poverty submitted by the by the following organisations:
• Energise Sussex Coast (ESC)
• South East London Community Energy (SELCE)
• Brighton and Hove Energy Service Cooperative (BHESCo)
• Ouse Valley Energy Services Coop (OVESCo)
• Sussex Green Living
This data allows ESC and SELCE data to be placed into the context of community organisational fuel
poverty alleviation efforts across a greater geographical area. ESC and SELCE company data itself
reflects the source of funding and associated reporting and monitoring requirements. Most of their
fuel poverty alleviation activities since 2015 have been funded by BESN, UKPN and SGN. Other sources
such as the Chesshire Lehmann Fund, Community Chest, East Sussex County Council and SELFy have
also been used to help cover expenses as funding provided by utilities and BESN is insufficient to reach
their targets. This funding gap is evident in the organisational data provided by SELCE and ESC.
3 Organisational data and methodology
3.1 Organisational data
Overall, the data is best described as messy and inconsistent, although it varies hugely form year to
year and between the two organisations. Aggregate yearly data is provided in excel spreadsheets.
Changing requirements by funders, changing organisational capacity and changing data gathering
approaches imply that such yearly data is often inconsistent. Significant support by both the CEOs of
ESC and SELCE was necessary to facilitate interpretation and allow us to gain an overview of inputs
and outcomes.
Funders’ emphasis on switching suppliers and making savings on energy bills through the Warm Home
Discount throughout the years provides us with a certain consistency while SELCE’s calculation of
financial return on investment from the year 2018/19 provides the basis for our SROI calculation. More
granular data is available in case studies and reports. These paint a very different picture of the success
and shortfalls of community fuel poverty alleviation. The following sections provide an overview of
organisational differences in data capturing and management.
3.1.1 Summary of Data provided by SELCE
SELCE’s data for the past 5 years was provided for this project. Given the changes in funding sources,
General Data Protection Regulation (GDPR) rules and the economic climate, there is a vast discrepancy
in exactly what data was collected each year.
The most useful source of information was the raw data spreadsheet which exists for each winter
(2015/16 - 2019/20). The following information was collected in all years: those given switch advice,
8those eligible for WHD, those who received information about WHD, those who applied for WHD,
those eligible for Energy Company Obligation (ECO) services, those eligible for the Priority Service
Register (PSR), and those for whom no action was taken. In some years (such as 2017) this information
is recorded in words, in some years (such as 2019) it is also provided as a binary count.
In some years much more information is collected than listed above. Information on housing
conditions (central heating, old or inefficient heating, storage heating, poor or no insulation, mould or
damp and draughts) was included in the data for 2017/18 and 2019/20. Data from 2019/20 also
included information on white goods. Years 2017/18 and 2018/19 included questions that could be
useful in assessing vulnerability, such as ‘are you cold in your home?’ or ‘are you fuel bills more than
you can pay?’ with pre-allocated answers ‘always’, ‘sometimes’, ‘never’. However, for year 2018/19,
of 330 client entries in the spreadsheet those questions are only answered by 30% and 28% of clients
respectively making it hard to draw any statistical conclusions from.
A large number of unpopulated fields is also seen in the demographic data such as age and gender.
Although the spreadsheet is set up to collect this information, it its only populated in 35% and 51% of
cases respectively. Without significant time input from SELCE staff, it was often also difficult to
interpret the data. For example, a count was made of ‘action taken’. In some years it seems to only
refer to the switching of supplier on the day, while in other cases it seems to include any action,
including advice. For the year 2015/16 two data spreadsheets were included and it was unclear if these
were separate activities or if they were subsequent drafts of the same activities and therefore
contained information on the same clients. Attempts were made to combine the information into a
single database to simplify the analysis but discrepancies between years and type of questions asked
made this challenging.
SELCE also provided additional documentation, for example case studies for each year. Sometimes
these were typed into report form and sometimes included as scanned copies of handwritten notes
taken during advice sessions. Sometimes drafts of the questionnaires and scripts used by energy
advisors were also included. Funding reports were included for the years 2015/16, 2016/17, 2018/19
but not the other two years. These funding reports were helpful for analysis of activities but each
report contained different information, most likely a result of which funding body the report was
written for. The most useful information was in the report for the year 2018/19 which included a
simplified SROI calculation, although on further scrutiny did not include all project inputs and only
calculated the financial return on investment. It therefore did not include value as a result of improved
health or living conditions. For the year 2020, reports included one on social impact estimated based
on calculations using the HACT social value bank. The results in this report were difficult to
substantiate as there was not a clear description of the methodology or of assumptions. The report
also states that its ‘value’ calculation does not include comfort or financial security.
3.1.2 Summary of Data provided by ESC
ESC’s data provided for this project also covers the last 5 years. Given the same changes in funding
sources, GDPR rules and economic climate, the quality and quantity of activities and data also varies
widely from year to year. Some data was more valuable for this analysis that others, for example, one
spreadsheet recorded the provision of food parcels provided to clients during 2020.
The most comprehensive data is available from 2015/16 and 2016/17. One particular document
included 220 case studies from 2016. The case studies included a description of the situation, action
and outcome for specific cases along with basic demographic and energy related data. For example,
one entry recorded the following:
Situation: Age UK referral for pensioners receiving Disability Living Allowance who is also hard
of hearing so finds it difficult to speak to suppliers on phone and doesn’t have access to the
internet.
9Action: During the home visit the advisor from ESC called the existing gas and electricity
supplier and arranged for the customer to be on a new tariff.
Outcome: The pensioner saved £425 per year and said they were "thrilled to bits with it […]
being hard of hearing this has helped a lot and my partner has a medical condition so this has
really helped".
Aside from switching suppliers and arranging WHD this dataset provided great detail on debt
repayment and energy efficiency improvements, including better insulation, new boilers and central
heating systems that were provided as part of the project.
In other years, data closely aligned to the funders’ requirements. This reflects the organisations
capacity to collect and evaluate data. This was especially the case where the donor stipulated a certain
reporting format as part of the funding requirements. For example, data was provided for the BESN
UKPN SGN project. This recorded the number of people who received advice and estimated the value
associated with it. In most cases the data provided was standardised. For example, the provision of
energy efficiency advice was recorded at £40, income maximisation advice at £200 and behavioural
change at £30. Brief notes were sometimes recorded by advisor to provide some additional context
on the advice given. Similar data was also provided for the Energy Caravan events run by ESC in
October - November 2019 and January – March 2020. ESC provided a range of other excel
spreadsheets include BSEN data for 2017 and 2019 that recorded the number and types of events
carried out. Some of this data provided a brief overview of the number of clients reached and
estimates of the finical value of the advice given. Some also provide notes on the advice given.
ESC also provided datasets for their project with British Gas Energy Trust. The main dataset recorded
60 interactions with customers during October and November 2020. The data collected was very
similar to the other datasets provided but, in some cases, it also included notes on whether the
customer was being impacted by Covid-19. Another spreadsheet recorded follow up actions made by
ESC and while data wasn’t recorded universally it did include notes regarding the actions taken.
One dataset recorded energy saving and retrofit measures that had been provided to households.
Measures had been recorded as ‘major’ which mostly included mostly included replacing storage
heaters and gas boilers with more efficient alternatives and ‘minor’ which included things such as
draught proofing, replacing old bulbs with LED alternatives, installing a thermostat and repairing or
replacing doors and windows. In both cases the cost of the measure along with the annual CO2 saving
was recorded for each measure. In total, 124 major measures and 458 minor measures were recorded
(Lowe and Maclean 2018).
ESC also provided an example of a questionnaire used by advisors to collect data. The questionnaire
comprised of 97 questions which included customer demographic and economic data including access
to financial support schemes, questions about who was providing the advice and how, data protection
and sharing clarifications, questions about the dwelling including tenure information, details about
electricity and gas consumption, home insulation and heating system details and access to schemes
such as the WHD. An example of the simple advice sheet completed following a one-to-one advice
session was also provided. This recorded data such as the advisor and customer name, date of the
interaction along with a brief description of the advice given and key actions taken during the session.
3.2 Establishing comparability
Establishing comparability between these two datasets required comparative analysis of the yearly
spreadsheets. This process is explained in the following paragraphs, starting with Table 2, which is a
random excerpt from one of the datasets (columns detailing the financial benefit of individual actions
are analysed in more detail below):
10Financial
In-depth advice
Location of interaction given - action
Date of interaction
Benefit -£
(postcode) taken/likely to
follow
Total
04/09/2019 BN11 1EE 1 £335.00
11/09/2019 BN11 1EE £0.00
18/09/2019 BN11 1EE 1 £196.00
18/09/2019 BN11 1EE 1 £0.00
18/09/2019 BN11 1EE 1 £140.00
25/09/2019 BN11 1EE £0.00
09/10/2019 BN11 1EE 1 £0.00
09/10/2019 BN11 1EE 1 £403.00
30/10/2019 BN11 1EE 1 £0.00
30/10/2019 BN11 1EE 1 £0.00
30/10/2019 BN11 1EE 1 £205.00
30/10/2019 BN11 1EE 1 £0.00
30/10/2019 BN11 1EE 1 £0.00
Table 2: Excerpt from company data excluding columns detailing the financial benefit of individual actions
Data in Table 2 indicates that the interaction takes place on the same day of the week, sometimes on
a weekly basis, sometimes less frequently, in the same location. It also shows that on some days, no
actions are likely to follow in-depth 1:2:1 advice sessions. It also shows that on around half the
occasions where in-depth 1:2:1 advice is given (5/11), it results in financial benefit, in this case
averaging around £250 savings. This might not sound like a lot of money but if it entails warmer living
conditions, lower bills and/or reduced stress regarding fuel debt, such benefit can be substantial. This
data does not reveal anything about the input that went into enabling such interactions to take place
on the same day of the week, sometimes on a weekly basis, sometimes less frequently, in the same
location.
Such information about the staff input hours is essential to understand what resources are required
to provide this service. With the help of the CEOs and our review of the literature we established that
such regular interactions are often pop-up energy shops or energy cafes. However, “it is difficult to
estimate what proportion of energy-shop clients have been fuel poor, as community groups have
limited resources to undertake consistent data collection. Furthermore, identifying those in need of
advice can be very difficult. The reach of energy shops varies, with for example one pop-up shop
reaching 200 clients in one week, whilst another had only six clients during three drop-in sessions”
(Speciale 2016, in CLF 2016: 46). With such background information and interpretative support, the
company data also provides insight into the organisational structure of the organisations providing
these services and the organisations funding these services.
Organisational data on measures and interventions is generally most detailed and useful (see Sections
2.2 and 2.3). Where it has been recorded consistently, such data provides details regarding the value
and frequency of fuel poverty alleviation action. The abovementioned omitted columns of the random
dataset include the following data (Table 3).
11Financial
Financial
Estimated value
Financial
Estimated value
Estimated value
Financial
Estimated value
Financial
Heating solutions
Energy Efficiency
maximisation
Benefit -£
Benefit -£
Benefit -£
Benefit -£
Benefit -£
Income
Tariffs
Total
of
of
of
of
1 219 1 116 £335.00
£0.00
1 196 £196.00
£0.00
1 140 £140.00
£0.00
£0.00
1 284 1 119 £403.00
1 0 £0.00
1 0 £0.00
1 170 1 35 £205.00
£0.00
£0.00
1 140 £140.00
Table 3: Columns detailing the financial benefit of individual actions
Data in Table 3 shows that income maximisation advice, where applicable, can result in the greatest
single financial benefit, without specifying what such maximisation encompasses. Tariff switching is
the most frequent action undertaken with financial benefits averaging over £100. Heating solutions
appear as a flat rate of £140 while energy efficiency advice, in this case, has no financial value
attached.
To decipher these figures, we conducted some research on financial proxies. Two reports stand out,
one by Sia Partners (2018) and one by Oxford Economics (2015), because of their detail and because
they were commissioned by government or funders, one by Ofgem and one by the British Gas Energy
Trust respectively. Key costs and value relevant to this report are summarised in Table 4 below.
Proxy Unit Cost/value Activity
Switching Year £1501 Average annual cost saving for customers going
on to social tariff as opposed to standard tariff
WHD Person £1401 Either as Guarantee Credit element of Pension
Credit (known as 'core group') or meeting
supplier's criteria (knows as 'broader group')
Winter Fuel Payment Person £2001 Those born before 5 November 1953 could get
between £100 and £200 to help pay heating
bills
Watersure Year £2001 Households with an income below a certain
threshold are entitled to a discount on their
water bill
Annual savings per Year £194.311 Fight fuel poverty and give advice to vulnerable
vulnerable customer customers on how to save money and keep war
12Life satisfaction change person £499.381 Increase quality of life
per individual
Average cost of mould Event £2,1471 Heating leads to higher quality homes and less
removal need for home improvements
Reduced stress, £2,9402 Loss of a QALY for a person with mild mental
depression and anxiety health issues
(mild)
Reduced stress, £10,5602 Loss of a QALY for a person with severe mental
depression and anxiety health issues
(severe)
Improved financial skills £4952 Cost of non-professional budgeting course
NHS - general health £1,4562 Cost of visiting GP more often
Sources: Sia Partners (2018) and Oxford Economics (2015)
1 2
Table 4: Financial proxies used by other organisations to calculate cost-benefit profiles (Oxford Economics 2015; Sia Partners
2018)
Some of these costs and values are direct financial benefits, such as the WHD which was introduced
by government in 2011. It offers a one-off discount of £140 on electricity bills between September
and March to those who receive the Guarantee Credit element of Pension Credit (core group) and
those on low income who meet their energy supplier’s criteria (broader group). Other costs and
values, however, are approximations such as ‘life satisfaction change per individual’.
Due to different approaches to calculating and interpreting such approximations, we place more
emphasis on direct benefits in both the analysis of fuel poverty data trends and the SROI calculation
in the following sections. Evaluating direct benefits form WHD is also helped by organisational
experience with advice and applications. As a result, data on WHD applications and advice is also fairly
consistent over the years (see analysis section below). This also applies to data on switching suppliers.
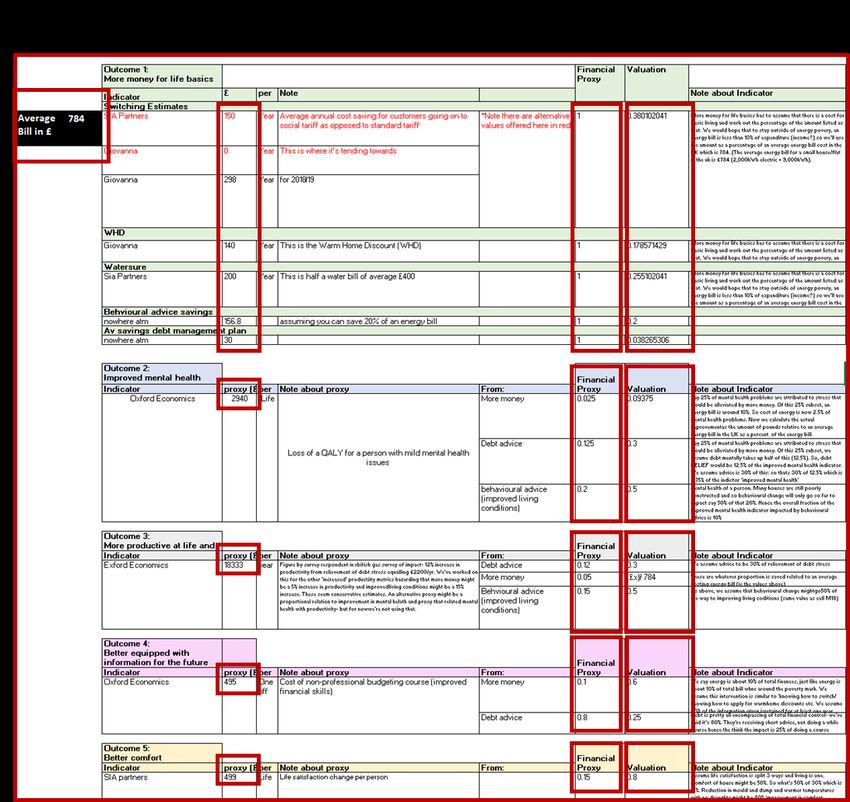
3.3 Calculating the Social Return on Investment
As switching suppliers and WHD applications only represent a share of the total financial savings and
benefits that result from 1:2:1 advice provided by organisations such as ESC and SELCE, it is necessary
to put these figures into the context of financial support and overall financial savings and benefits.
While figures on switching and WHD applications represent absolute figures, others, especially on the
financial savings and benefits side, are less accurate as they include many assumptions about actions
taken and average values. These include assumptions about action taken on switching advice and
WHD advice as well as other schemes such as the Energy Company Obligation (ECO) and behaviour
change following 1:2:1 advice.
At aggregate level, the following numbers have been provided which provide an insight into the direct
financial return on investment. This is the money directly saved by clients per pound of funding
awarded to the charity:
2018/19 2019/20
UKPN £25,000 £25,850
SGN £20,385 £25,000
Total funding £45,385 £50,850
Total saving £52,317 £76,270
Return on investment 1.152737689 1.499901672
Table 5: Total funding and savings at aggregate level
13UKPN and SGN provided between £20,385 and £25,850 funding in both 2018/19 and 2019/20 which
amount to a total of £45,385 and £50,850 respectively. Total savings and benefits delivered by the
organisations to whom this funding was distributed amounted to £52,317 in 2018/19 and £76,270 in
2019/20, with returns on investment of 1.15 and 1.5 respectively for every £1 invested.
What these numbers do not tell us, however, is both the effort that goes into achieving these savings
nor the benefit that such savings and experiencing dedicated 1:2:1 advice implies for somebody in fuel
poverty. We have tried to get a more accurate picture of both the efforts going into fuel poverty action
and the outcomes by calculating the SROI. To this end, we drew on data from energy interventions
run by SELCE in 2018/19.
In a typical SROI analysis, the stakeholders would be engaged to offer their opinions on the value that
has been created for them. This project calculated SROI based on existing data and since there was no
funding to reach out to stakeholders, such engagement was outside the scope. Instead, the numbers
used in this report are taken from other SROI calculations conducted by Oxford Economics (2015) for
British Gas and Sia Partners (2018) for Fuel Poor Network Extension Scheme. The numbers used were
also discussed and validated with the CEO of SELCE who has seven years of experience talking to
stakeholders and understanding how their lives are and could be affected by interventions related to
energy poverty, and has contributed to several reports and academic papers on fuel poverty (e.g. CLF
2016; Martiskainen et al. 2018).
The methodology for a SROI calculation outlined by the SROI Network (2012) report ‘A guide to social
return on Investments’ has been used to develop this study. It has been slightly adapted in order to
use historical data rather than design the investment calculations for an upcoming intervention. The
process is depicted inError! Reference source not found.1. The assumptions and estimates used in
the study are explained in the following sections.
Figure 1: Methodology and stages of SROI calculations
The following analysis section compares SELCE’s and ESC’s client data and fuel poverty alleviation
trends over the years before presenting the SROI calculations.
4 Analysis of SELCE and ESC data
4.1 Comparative analysis of clients
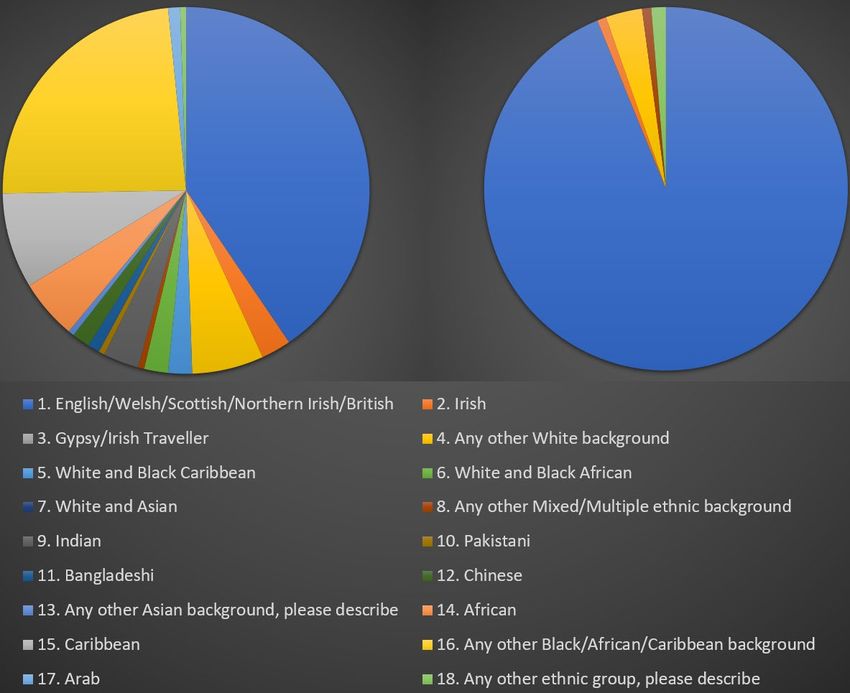
ESC’s and SELCE’s clients are as varied as the geographical area that they cover. SELCE is based in
Lewisham and provides fuel poverty alleviation services across several London Boroughs in the
southeast of London. ESC is based in St Leonards-on-Sea and provides fuel poverty alleviation services
in the surrounding areas (see Figure 2).
14Figure 2: Geographical reach of SELCE (on the left) and ESC (on the right)
The geographical areas that ESC and SELCE cover include some of the most deprived areas (at ward
and Lower Layer Super output Area – LSOA – level). But ESC’s location on the coast with its many
retirees and SELCE’s location in London, one of the most diverse metropolitan areas in the world,
imply that client demography varies significantly. Data, however, is inconsistent. Only one ESC dataset
includes information on age and the ranges are 16-25, 26-40, 41-50, 51-65 and 65+ (258 in total; right
side of Figure 2). SELCE has gathered such data on numerous occasions, but used different age ranges
(18-29, 30-45, 46-60, 61-74 and 75+; 181 in total; left side Figure 3). This limits comparability although
the overall trend is evident.
Figure 3: Age ranges of SELCE (on the left) and ESC (on the right) customers
Figure 3 indicates that SELCE’s customers tend to be younger than ESC customers. Similar
discrepancies are also evident in data on ethnicity, which is even less consistent than data on age. The
following graphs (Figure 4) provide a snapshot from the only data available, the Winter Home Check
Service 2015-18 report that ESC was involved with (831 responses, 215 blanks) and SELCE’s 2018/19
Energy Café dataset (417 responses, 227 blanks). Regarding ethnicity, the differences are striking (see
Figure 3).
15Figure 4: Ethnicity of SELCE (on the left) and ESC (on the right) customers
Despite inconsistencies, the snapshot of data from the two reports visualised in Figure 4 is clear.
Winter Home Check 2015-18 report data provided in part by ESC (on the right in Figure 3), where 91%
of respondents are white (which appear as blue in Figure 4), reflects the ethnic composition of East
Sussex, which is 96% white, and Hastings, which is 93.8% white (East Sussex County Council 2011).
Both SELCE and ESC report that non-native English-speaking communities tend to miss out on
opportunities to reduce their bills by switching and by applying for WHD. Recently immigrated
communities in particular often display cultural unfamiliarity with UK heating, warm water and
electricity provision and billing systems. Combined with cultural differences in cooking, heating, and
cleaning habits this can result in very high bills, but not necessarily through their own fault. Both SELCE
and ESC report anecdotally that billing mistakes appear to be more prevalent among such
communities.
There was also limited data available on the tenure of customers making analysis of this aspect
challenging. A dataset provided by ESC provided a snapshot of 58 customers supported as part of that
programme. It suggested that 63% were owner occupiers, 23% were the tenant of a private landlord,
6% were a council tenant and 8% were a housing association tenant. In terms of housing type, 31%
were recorded as living in a flat, 39% in a terrace house (mid and end terraced), 24% in a house
(detached or semi), 4% lived in a caravan and 2% lived in a bungalow.
In comparison, there was slightly more information available from SELCE. This data suggested that
that 28% of SELCE customers were owner occupiers, 19% were the tenant of a private landlord and
53% were in social housing (e.g. a council or housing association tenant). In terms of housing type,
1660% were recorded as living in a flat, 24% in a terrace house (mid and end terraced) and 16% in a
house (detached or semi). While this data set comprised a much large sample (n. 550) there were a
number of entries where data was not recorded. For example, approximately 61% of customers did
not have their tenure recorded and 65% did not have their household type recorded.
Data on vulnerability was even more difficult to find and evaluate. ESC has a very useful dataset of 220
case studies from 2016 which records information on whether customers receive government
benefits, whether they have disabilities, whether they have internet access, whether their households
are connected to the gas grid, whether they use electric heating and whether they pay their bills using
a prepayment meter. As such data was not gathered in other years, it is difficult to draw accurate
conclusions.
SELCE has gathered more such data over the years compared to ESC. Data sets on 2017/18 and
2018/19 included questions that could be useful in assessing vulnerability, such as ‘are you cold in
your home?’ or ‘are you fuel bills more than you can pay?’ with pre-allocated answers ‘always’,
‘sometimes’, ‘never’. However, for year 2018/19, of 330 client entries in the spreadsheet those
questions are only answered by 30% and 28% of clients respectively so even these more extensive
data sets make it difficult to establish statistical conclusions.
4.2 Comparative analysis of fuel poverty alleviation
Despite issues with data consistency, our analysis of SELCE and ESC company data alongside aggregate
Community Energy South data on Energy Champions provides us with some interesting insights into
trends. Organisational data from ESC encompasses BESN data for all years plus supplementary data
from other schemes, such as its Energy Caravan programme. Organisational data from SELCE also
encompasses BESN data for all years but in some cases data was separated into energy café notes,
home visit notes and telephone advice notes supported by a variety of organisations. The following
table (Figure 5) provides on overview of the total number of people reached in a given year for the
Winters of 2015/16 through to 2019/20, for example through energy cafes, pop-up energy shops and
phone advice:
3000
2500
2371 2452
2000
1500
1603
1000 1183
900 856 817
500
553 641 612
279 492 525 479
0
2015/16 2016/17 2017/18 2018/19 2019/20
Total number of individuals reached by ESC
Total number of individuals reached by SELCE
Total number of individuals reached by Energy Champions
Figure 5: Total number of individuals reached
Figure 5 shows that at aggregate level, numbers have fluctuated quite significantly. ESC was reaching
more people in its early years but after a particular difficult year in 2017/18 there is a slight upwards
trend in the numbers of individuals reached. SELCE, with the exception of 2018/19, has registered an
upward trend.
17Success in reaching out to the fuel poor, however, does not necessarily translate into direct financially
beneficial outcomes for the fuel poor, for example through energy bill savings or income
maximisation. At aggregate level, there has been an increase in the number of individuals who were
actively switched to another supplier as part of 1:2:1 advice while the average financial benefit has
declined over time (Figure 6).
600
500
£512.47
400
300
275
200
£211.13
£190.98 196
159 172 173
100 143 132 £141.78
79
0
2015/16 2016/17 2017/18 2018/19 2019/20
Switched Average saving WHD applied
Figure 6: Total number and value of actions at aggregate level
Figure 6 also shows how the number of WHD applications as part of 1:2:1 advice sessions has declined
slightly over the years at aggregate level. At organisational level, different trends are evident. Contrary
to the aggregate trend, the number of individuals who were actively switched to another supplier as
part of ESC 1:2:1 advice declined between 2015/16 and ESC’s most difficult year in 2017/18. Since
then, numbers of switches have increased while the average financial benefits of switching declined,
reflecting the trend at aggregate level. The number of WHD applications as part of 1:2:1 advice initially
fluctuated before increasing significantly in 2019/20 (Figure 7).
300
250
£244
£232
200 £213
£206
150 £166
100 115
101
50 66 66 63
56
25 47 40 33
0
2015/16 2016/17 2017/18 2018/19 2019/20
Switched Average saving WHD applied
Figure 7: ESC number and value of actions
SELCE, on the other hand, succeeded in continuously increasing in the number of individuals who were
actively switched to another supplier as part of 1:2:1 advice in line with the overall trend. Average
18You can also read