Report of the Illinois Climate Change Advisory Group - Submitted to Governor Rod R. Blagojevich
←
→
Page content transcription
If your browser does not render page correctly, please read the page content below
Report of the
Illinois Climate Change
Advisory Group

Submitted to
Governor Rod R. Blagojevich
Cover Photos: (top, left to right) methane power generation at central Illinois landfill; Chicago expressway; central
 Illinois wind energy farm (bottom, left to right) methane digester at dairy farm in northern Illinois; power plant in
                    central Illinois; compact fluorescent bulbs on sale in Illinois hardware store.

                           Illinois Climate Change Advisory Group Members
  Director Doug Scott, Chair of Task Force                          John Johnson
  Illinois Environmental Protection Agency                          Business Agent
                                                                    Illinois Brotherhood of Electrical Workers, Local 51
  Patrick Quinn
  Lieutenant Governor                                               Sadhu Johnston
  State of Illinois                                                 Commissioner, Department of Environment
                                                                    City of Chicago
  Michael Carrigan, Vice Chair of Task Force
  President                                                         David Kolata
  Illinois AFL-CIO                                                  Executive Director
                                                                    Citizens Utility Board
  Art Gibson, Vice Chair of Task Force
  Senior Vice President, Baxter Healthcare                          Al Larson
                                                                    Village President
  Howard Learner, Vice Chair of Task Force                          Village of Schaumburg
  Executive Director
  Environmental Law & Policy Center                                 Paula Lawson
                                                                    President
  Gary Butler                                                       League of Women Voters of Illinois
  United Mine Workers of America
                                                                    Ann McCabe
  Reverend Clare Butterfield                                        Union of Concerned Scientists
  Executive Director
  Faith in Place                                                    Doug McFarlan
                                                                    Vice-President Public Affairs
  Mark Calmes                                                       Midwest Generation
  Vice President, Environmental Office of Compliance & Ethics
  Archer Daniels Midland Company                                    Keith McFarland
                                                                    Vice President Midwest Fleet Operations
  Mary Culler                                                       Dynegy, Inc
  Government Affairs
  Ford Motor Company                                                William McNary
                                                                    Co-Executive Director
  Jack Darin                                                        Citizen Action of Illinois
  Illinois State Director
  Sierra Club-Illinois Chapter                                      Stefan Noe
                                                                    President
  John Disharoon                                                    Midwest Wind Energy
  Director of Sustainable Development
  Caterpillar, Inc.                                                 Paul Pike
                                                                    Strategic Analyst
  Dr. Samuel Dorevitch                                              Ameren
  Research Assistant, Professor, School of Public Health
  University of Illinois - Chicago                                  Lois Vitt Sale
                                                                    Principal, Phoenix Architects, Inc.
  Amanda Espitia                                                    US Green Building Council
  Illinois League of Conservation Voters
                                                                    Michael Schlesinger
  William Gerwing                                                   Professor, Atmospheric Sciences
  General Manager, Regulatory Affairs                               University of Illinois - Urbana/Champaign
  BP America Inc.
                                                                    Steve Schlickman
  Henry Henderson                                                   Executive Director
  National Resource Defense Council                                 Regional Transportation Authority
  James J. Jerozal Jr.                                              William Schubert
  General Manager, Environmental Health & Safety                    Vice President Operations Support
  NICOR                                                             Waste Management

                                                           i
Craig Sieben James T. Volanski, P.E.
President General Manager, Environmental Affairs
Sieben Energy Associates US Steel
Rebecca Stanfield Susan M. Watkins
Executive Director Vice President
Environment Illinois State Farm
Joe Szabo Scott Wiseman
Illinois State Director Vice-President Midwest Region
United Transportation Union Center for Energy & Economic Development
John Thompson Laurie Zelnio
Director, Coal Transport Project Director, Safety, Environment Standards & E-PDP
Clean Air Task Force Deere & Company
iiTABLE OF CONTENTS
Page Number
Section I. Executive Summary 1
Section II. Governor Blagojevich’s Global Warming Initiative 9
Section III. Overview of the ICCAG Process 11
Section IV. Illinois Greenhouse Gas Inventory and Projections to 2020 15
Section V. Evaluation of Greenhouse Gas Reduction Strategies 22
Section VI. Emissions and Economic Impact Modeling 26
Section VII. Strategies Recommended by the Advisory Group 42
Section VIII. Concluding Remarks 56
Section IX. Key Developments Since the ICCAG Made Its Recommendations 57
Appendices, Volume 1
A. Governor Blagojevich’s Executive Order
B. Governor Blagojevich’s GHG Reduction Goals
C. WRI GHG Emissions Inventory and Documentation
D. WRI Policy Options Spreadsheet
E. ICCAG Priority Options Voting Results
F. Complete Text of Approved Strategies
G. Illinois EPA’s Response to Comments about the ICCAG Process
H. ICFI Modeling Assumptions Book
I. ICFI Modeling Results
Appendices, Volume 2
A. Written Comments from ICCAG Members and Interested Parties
iiiSECTION I. EXECUTIVE SUMMARY
Background
On October 5, 2006, Governor Blagojevich launched his Global Warming Initiative by signing an
Executive Order (EO) that created the Illinois Climate Change Advisory Group (ICCAG). See
Appendix A for a copy of the EO. The Advisory Group was chaired by Doug Scott, Director of the
Illinois Environmental Protection Agency (Illinois EPA), and included 39 other members
representing local government; labor unions; public transit; scientists; environmental, consumers,
and faith-based groups; and the following industries: agriculture, utilities, power generators, auto
manufacturing, farm and construction equipment, oil, insurance, and waste management. Three vice
chairs were also appointed to help guide the process: Michael Carrigan, AFL-CIO; Arthur Gibson,
Baxter Healthcare; and Howard Learner, Environmental Law and Policy Center.
The Governor charged the ICCAG with recommending state-level strategies to meet his statewide
greenhouse gas (GHG) reduction goals, which are similar to goals set by other states and those
proposed in Congress: (a) 1990 levels by 2020, and (b) 60 percent below 1990 levels by 2050.
See Appendix B for more information on the Governor’s goals. Scientists believe that GHG
reductions of this magnitude are needed to avoid significant consequences due to climate change.
Key Findings
ICCAG members voted on 24 strategies to reduce greenhouse gas emissions in Illinois. ICF
International (ICFI), a global energy and environmental consulting firm, was retained to model the
emissions and economic impacts of different policy scenarios. ICFI’s modeling found that
implementing the 24 strategies voted on by ICCAG members would meet the Governor’s goal for
reducing greenhouse gas emissions to 1990 levels by 2020.
In addition, ICFI’s modeling found that executing all 24 strategies to reduce greenhouse gases
would benefit the Illinois economy compared to taking no action to address climate change.
According to ICFI, these economic benefits include cutting average electricity costs by more than 3
billion dollars per year in 2020 as well as boosting the gross state product (GSP) and personal
disposable income by billions of dollars while creating tens of thousands of new jobs (see Section
VI for detailed economic estimates).
At its July 10 meeting, ICCAG members voted to support nineteen strategies with no dissent and at
least one abstention. At the September 6 meeting, a majority of voting ICCAG members voted to
support an additional five strategies, with eight to ten members dissenting and several members
abstaining. These strategies are listed below in Tables 1 and 2:
1Table 1. Nineteen Strategies Supported by ICCAG Members with No Dissent
Brief Description of Strategy Subgroup
Implement smart growth initiatives and expansion of mass transit Transport
Incentives for fuel efficient vehicles Transport
Low-carbon fuels standard Transport
Fuel efficiency and/or low carbon fuel requirements for all government vehicles Transport
Passenger and freight rail upgrades Transport
Small renewable distributed generation: rules, legislation, incentives Power/Energy
Energy efficiency standards for appliances and equipment Power/Energy
Establish residential and commercial energy efficiency construction codes
beyond international standards; includes government buildings. Power/Energy
Phase-in of energy efficiency standards for light bulbs Power/Energy
Energy conservation and efficiency programs for existing state facilities Power/Energy
Enhanced renewable portfolio standard of 25 percent by 2025 Power/Energy
Enhanced energy efficiency: two percent demand reduction by 2015. No revenue
cap. Power/Energy
Commercial,
Programs to encourage forest management, reforestation, tree- and grass- Industrial,
planting Agriculture (CIA)
Energy efficiency incentives, assistance and standards for commercial/industrial
generators and boilers CIA
Expand use of no-till farming CIA
Encourage methane capture from coal mines, landfills, livestock farms and
wastewater treatment plants. CIA
Increase traditional recycling diversion rate with municipal goals and by
stimulating demand for recycled materials CIA
Land use development offset requirement CIA
Encourage or require reductions in emissions of high GWP gases (N2O, HFCs,
PFCs, SF6) CIA
2Table 2. Five Strategies Supported by a Majority of Voting ICCAG Members
Brief Description of Strategy/Vote Subgroup
GHG emissions standards for automobiles
In favor: 20 Opposed: 8 Abstaining: 5 Transport
CO2 emissions performance standards for electricity generation or purchases
electricity (new generation only)
In favor: 20 Opposed: 8 Abstaining: 2 Power/Energy
Carbon capture & storage (from the outset) portfolio standard of 5 percent.
Utilities must buy if available.
In favor: 20 Opposed: 8 Abstaining: 2 Power/Energy
20 percent carbon offset requirements for new fossil fuel power plants
In favor: 19 Opposed: 8 Abstaining: 3 Cap and Trade
Cap and trade program for power generators and relatively large industrial
sources; preference to link with other states
In favor: 21 Opposed: 10 Abstaining: 3 Cap and Trade
Summaries of the ICCAG strategies are provided in Section VII, and complete descriptions are
included in Appendix F. Written comments from ICCAG members and the public are in Volume 2
of the Appendices.
Potential economic impacts were discussed extensively by the ICCAG, and ICFI modeling
indicated macro-level economic benefits from implementing the 24 strategies compared to taking
no additional steps to reduce GHG emissions. However, some members voted against these five
strategies largely due to concerns about potential negative economic and employment impacts in
specific sectors (i.e., conventional coal-fired electric generation). These dissenting members also
argued that these strategies should only be implemented at the national level.
Description of the ICCAG Process
The ICCAG process was designed to be transparent, inclusive, and collaborative. ICCAG meetings
and conference calls were open to other stakeholders and the general public, and anyone who
participated was given the opportunity to raise questions, concerns, and other issues. All major
decisions regarding policy proposals were vetted through ICCAG subgroups and the full ICCAG.
All information prepared in support of the process, and any written comments from members and
non-members, were posted on the Web at www.ilclimatechange.org.
ICFI was retained to model the emissions and economic impacts of different policy scenarios. ICFI
is a global energy and environmental consulting firm based in Washington, D.C., with a staff of
over 1,500 consultants in 20 offices. The firm’s clients include the Canadian government, the US
federal and state governments, the EU, and several oil and gas producing nations.
The World Resources Institute (WRI) was retained to assist in the facilitation of ICCAG meetings
and to provide technical expertise. WRI is a Washington D.C.-based environmental research and
policy organization, and their climate change experience includes co-authoring the standard for
measuring and reporting GHG that is used by companies throughout the world. They have provided
similar assistance to northeastern states, western states, and Wisconsin. WRI prepared an inventory
of Illinois GHG emissions (1990-2003) and projections for future emissions through 2020 to help
guide the ICCAG’s development and assessment of policy options to meet the Governor’s goal (see
Appendix C). A variety of other background documents were also prepared throughout the process
to better inform ICCAG members.
3WRI developed an initial list of 88 policy options for reducing GHG emissions (see Appendix D)
that was narrowed down by ICCAG members to 25 through an anonymous, on-line voting process
(see Appendix E). These 25 policy options were assigned to four subgroups to formulate policy
proposals that could be modeled for their emissions and economic effects. A fifth subgroup was
created to oversee the modeling process. The subgroups were chaired by the ICCAG chair and vice
chairs:
x Power and Energy: Chair, Howard Learner, Environmental Law and Policy Center
x Transportation: Chair, Michael Carrigan, AFL-CIO
x Cap and Trade: Chair, Doug Scott, Illinois EPA
x Commercial, Industrial, and Agricultural: Chair, Arthur Gibson, Baxter Healthcare
x Modeling: Chair, Doug Scott, Illinois EPA
Illinois EPA and other state agencies such as the Illinois Department of Commerce and Economic
Opportunity (DCEO) helped staff the ICCAG process.
Table 3. Illinois Climate Change Advisory Group Timeline
Event Location Date Subjects
Meeting 1 Chicago February 22, 2007 x Review ICCAG’s mission
x Process overview; ground rules
x IL GHG inventory and forecast
x Overview of Governor’s energy plan
x Introduction of policy options
x Discussion of modeling strategy
Meeting 2 Springfield April 3, 2007 x Updates to IL GHG inventory and forecast
& Chicago x Results of policy option voting
via video x Formation of subgroups and tasks
conference x Update on selection of modeling contractor
Meeting 3 Chicago & May 23, 2007 x Presentation on the ENERGY 2020 model by ICF
Springfield International
via video x Subgroup recommendations for policies to be
conference modeled
x Discussion and action on subgroup
recommendations
x Modeling assumptions and the Modeling
Subgroup’s role
Meeting 4 Chicago & July 10, 2007 x Review of modeling results and input by the
Springfield Modeling Subgroup
via video x Reference case modeling results
conference x Preliminary policy scenario modeling results
x Discussion of modeled policies
x 19 strategies supported by ICCAG members with
no dissent
4Meeting 5 Chicago & September 6, 2007 x Emissions inventory update
Springfield x Review of final reference case modeling results
via video x Review of final policy scenario modeling results
conference x Majority of voting ICCAG members supported five
additional strategies
The subgroups were allowed to add or delete policy options under their consideration as long as
ICCAG members agreed. After many conference calls and hours of discussions that were open to
the public, the subgroups recommended 24 policy proposals for modeling (see Section V, Table 8).
Of the 24 proposals, four were new proposals not in the top 25 list. Two proposals from the top 25
list were not recommended, and six from this list were combined into three proposals.
Among the 24 proposals was a market-based “cap and trade” program to reduce GHG emissions
from fossil fuel power plants and other relatively large emitters. Under a cap and trade program, the
total pool of emissions are initially limited, or capped, to a set amount that shrinks over time, and
sources that stay below their allotted emissions can sell emissions “allowances,” or allotments, to
sources that exceed their allowable limits.
ICFI developed a detailed forecast of emissions and economic trends under “business as usual”
conditions through 2020, which is called the reference case. It assumes a continuation of current
economic trends and the associated GHG emissions and reflects, to the extent possible, recently
enacted policies and new projects that could affect GHG emissions trends. The reference case
serves as a point of comparison in analyzing the GHG reductions from strategies included in the
proposed policy scenarios.
Because no single strategy alone can achieve the Governor’s goals, ICFI modeled the emissions and
economic effects of four policy packages (scenarios) recommended by the Modeling Subgroup:
Scenario #1. All 24 strategies except for cap and trade.
Scenario #2. All the strategies including an Illinois-only cap and trade program.
Scenario #3. All the strategies including cap and trade with a link to the Northeast States’
Regional Greenhouse Gas Initiative (RGGI) cap and trade program.
Scenario #4. The same as #2, but with an assumption of high oil and gas prices.
ICFI projects that Illinois GHG emissions will grow to 312 million metric tons of CO2 equivalents*
(Mt CO2e) by 2020 under the business as usual scenario. In order to meet the Governor’s goal of
reducing greenhouse gas emissions to 1990 levels (231 Mt CO2e) by 2020, emissions in 2020 would
need to be 81 Mt CO2e less (312 minus 231) than what ICFI projects for the business as usual
scenario. Current annual GHG emissions in Illinois are about 276 Mt CO2e, or 45 Mt CO2e, above
1990 levels. Figure 1 shows the emission trajectories for the reference case and Scenarios #1, #2
and #3 compared to the goal of achieving 1990 levels by 2020.
* CO2 equivalent provides a standardized unit of measurement to represent various greenhouse gases that have
different global warming potentials relative to the global warming potential of carbon dioxide, the most prevalent
greenhouse gas.
5By 2020, Illinois GHG emissions are projected to be
81 million metric tons above 1990 levels.
Figure 1. Illinois GHG Emissions: Reference Case and Three Policy Scenarios**
350
Total Emissions in 1990: 231
Mt CO 2 e (Source: WRI)
300 Total - 312 Mt CO2e
Gap - 81 Mt CO2e
250
Target - 231 Mt CO2e
200
Mt CO2e
Reference Case
All except Cap & Trade
150 All In with C&T
All In with C&T & RGGI
100
50
0
2000 2005 2010 2015 2020
** Includes reductions achieved inside Illinois (including purchased offsets that are allowed under the cap and
trade proposals) plus allowances purchased outside Illinois for compliance in-state. Does not include modeled
direct emissions reductions outside Illinois that would be difficult to verify.
The modeling results (see footnote** above) indicate that Scenario #1 is not a viable option because
it achieves less than half of the reductions needed to meet the Governor’s 2020 reduction goal of
231 Mt CO2e in 2020; Scenario #2 meets the goal with 2020 emissions of 227 Mt CO2e. Scenario
#3 also meets the goal, with 2020 emissions of 229 Mt CO2e if emissions allowances purchased
from sources in the RGGI states count.
ICFI’s modeling found that implementing the policy scenarios to reduce greenhouse gases would
reduce electricity costs and increase employment, GSP and personal disposable income compared to
the business as usual reference case of not implementing new polices to reduce greenhouse gases.
For policy Scenario #3, the computer modeling showed the following economic impacts:
x Average electricity costs decline for residential, industrial and commercial customers, with
total savings across all sectors of approximately $1.1 billion in 2010, $2.6 billion in 2015,
and $3.2 billion in 2020.
x 61,000 additional jobs per year in 2020.
x Annual gross state product $7.5 billion higher in 2020.
x Assuming that 85 percent of emissions allowances are auctioned, the cap and trade program
would likely generate hundreds of millions of dollars per year.
6The positive economic outcomes are largely due to policies that would replace imports of coal,
oil, and natural gas with in-state investments in renewable energy and energy efficiency
measures. Dollars that would otherwise be exported to out-of-state companies are instead
invested in Illinois. Although electricity rates would increase modestly due to compliance costs
for fossil fuel electric power plants, the amount of the rate increases is reduced over time. In
addition, the rate increases are more than offset by the energy efficiency measures that would
reduce overall energy costs through energy savings for homes and businesses as noted above.
The modeling process benefited from oversight by the Modeling Subgroup and significant input
from ICCAG members and non-members. The ICFI modeling team responded verbally and in
writing to numerous questions and comments, and they often revised their analyses in response
to this input. However, some ICCAG participants felt the modeling process was inadequate
and/or disagreed with some modeling assumptions and/or results. For more information about
ICCAG modeling, see Section VI and Appendices H and I.
Because the ICCAG process was open and responsive to members and non-members alike, the
process was revised on numerous occasions in response to suggestions. However, certain process
decisions made by Illinois EPA and its advisors, such as the decision to exclude federal policy
recommendations, were questioned. The Illinois EPA’s response to those concerns is found in
Appendix G. Written comments from ICCAG members and the public are in Volume 2 of the
Appendices.
The ICCAG membership represented diverse interests and perspectives, and the process was
infused with a spirit of achieving a common goal—the Governor’s emissions reduction goals for
the state of Illinois. Chairman Scott indicated that additional stakeholder input would be sought
if the Governor directs agencies to design and implement any of these strategies. In addition,
given the long-term nature of the climate change challenge, the chair is recommending to the
Governor that the ICCAG continue to meet periodically.
Key Developments Since the ICCAG Made Its Recommendations
Since the ICCAG voted on its recommendations, a number of important actions have been taken
at the state, regional, and federal levels to mitigate GHG emissions. Some of these actions
overlap with particular ICCAG recommendations.
At the state level, the Illinois Power Agency Act (IPAA) of 2007 was signed into law by
Governor Blagojevich in August of last year. The IPAA includes two provisions that are similar
to two ICCAG recommendations:
x Renewable portfolio standard. Beginning in 2008, electric utilities must supply renewable
energy for two percent of the electricity they provide customers, increasing to 25 percent
by 2025. The requirements only apply to electricity supplied to residential and small
commercial customers. The renewable energy requirement is scaled back if electricity
rates increase more than 0.5 percent per year or two percent total. The ICCAG
recommendation, which was approved with no dissent does not include spending caps
and applies to all electricity customers.
x Energy efficiency portfolio standard. Beginning in 2008, electric utilities must achieve a 0.2
percent energy use reduction through investments in energy saving programs, increasing to
two percent by 2015. The reduction goals are scaled back if electricity rates increase more
than 0.5 percent per year or two percent total. The ICCAG recommendation has the same
7energy reduction goals but with no spending caps, and the goals also apply to natural gas
utilities. This recommendation was approved with no dissent.
At the regional level, Governor Blagojevich signed the Midwestern Greenhouse Gas Reduction
Accord (the “Accord”) in November 2007 along with the governors of Iowa, Kansas, Michigan,
Minnesota, and Wisconsin, and the Premier of Manitoba. The Accord states that the participating
states will develop (a) regional greenhouse reduction goals by the summer of 2008, and (b) a model
rule for a multi-sector, market-based cap and trade program by November 2008. The Accord will
largely implement the cap and trade program recommendation approved by a majority of the voting
ICCAG members. The recommendation calls for links to other states, preferably nearby states,
because that would create a more efficient, less costly program and would minimize the extent to
which emissions “leak” from Illinois to other states rather than being eliminated.
In December 2007, the federal Energy Independence and Security Act (EISA) of 2007 was signed
into law. The EISA includes four provisions that are similar to four ICCAG recommendations:
x Energy efficiency standards for light bulbs. The new EISA standards are virtually identical
to the ICCAG recommendation that was approved without dissent, although the ICCAG
approved mercury content standards that are not included in EISA.
x Energy efficiency standards for appliances and equipment. The new EISA standards are very
similar to the ICCAG recommendation that was approved with no dissent.
x Increased Corporate Average Fuel Efficiency requirements. Increased Corporate Average
Fuel Efficiency requirements will be phased in, starting in 2010. More fuel efficient vehicles
emit fewer GHG emissions because they consume less fuel. A majority of voting ICCAG
members recommended that Illinois adopt and implement state-level GHG emissions limits
for passenger vehicles based on the California vehicle emissions standards. Under the
federal Clean Air Act, California is allowed to adopt more stringent vehicle emissions
requirements with approval from the U.S. Environmental Protection Agency (USEPA), and
states must choose either the California standards or the federal standards established by
USEPA. Eleven other states have chosen the California standards. California has more
stringent vehicle emissions standards for non-methane organic gases (NMOGs, similar to
volatile organic compounds or VOCs), nitrogen oxides (NOx), particulate matter (PM),
carbon monoxide (CO), and hazardous air pollutants.
Neither California nor USEPA currently regulate GHGs from motor vehicles, but California
had asked for USEPA’s approval to do so. USEPA denied that request late last year.
California and other states, including Illinois, have challenged USEPA’s decision in court.
Compared to the new CAFE standards in the EISA, the California standards would reduce
global warming gases and improve fuel economy three to four years faster and
approximately 13.1 percent more in the year 2020. (Based on data from: California Air Resources
Board Addendum to February 25 Technical Assessment, May 8, 2008: Comparison of Greenhouse Gas
Reductions for the United States and Canada under ARB GHG Regulations and Proposed Federal 2011-2015
Model Year Fuel Economy Standards.)
x Low carbon fuels standard. Under EISA, lifecycle carbon emissions for new renewable fuels
production facilities must be 20 percent below a baseline level. The ICCAG recommended,
with no dissent, a broader “low carbon fuels standard” that would require transportation fuel
producers, importers, refiners and blenders to ensure that all transportation fuels sold in
Illinois have lifecycle carbon emissions that are 10 percent less than current levels by 2020.
8SECTION II: GOVERNOR BLAGOJEVICH’S GLOBAL WARMING INITIATIVE
Formation of the Illinois Climate Change Advisory Group
On October 5, 2006, Governor Blagojevich launched his Global Warming Initiative by signing an
EO that created the ICCAG. (See Appendix A for a copy of the EO.) The ICCAG was directed to
consider the full range of policies and strategies to reduce GHG emissions in Illinois and to make
recommendations to the Governor. The EO said the ICCAG should have broad representation and
be chaired by the Director of the Illinois EPA, Doug Scott.
In addition to the chair, 39 members were selected representing: local government; labor unions;
public transit; academia; environmental, consumer and faith-based groups. The following industries
were also represented: agriculture; utilities; power generators; auto manufacturing; farm and
construction equipment; oil; insurance; and waste management. (See Appendix A for the ICCAG
membership list.) Three vice chairs were also appointed to help guide the process: Michael
Carrigan, AFL-CIO; Arthur Gibson, Baxter Healthcare; and Howard Learner, Environmental Law
and Policy Center.
Governor’s Greenhouse Gas Reduction Goals
Before the first ICCAG meeting, Governor Blagojevich announced a statewide goal to reduce GHG
emissions to 1990 levels by 2020 and 60 percent below 1990 levels by 2050. The Governor charged
the ICCAG with recommending strategies to meet these GHG reduction goals, which are similar to
goals set by other states and those proposed in legislation before Congress. Scientists believe that
global reductions of this magnitude are needed to avoid significant, adverse consequences due to
climate change.
Other Elements of the Governor’s Global Warming Initiative
The Governor has already launched a number of strategies for reducing GHG emissions in order to
protect the environment and public health, including:
x In the summer of 2006, Governor Blagojevich announced an Energy Independence Plan to
meet the state’s energy needs by investing in wind power and cleaner burning renewable
fuels that will cut greenhouse gas emissions. The plan also included a proposed pipeline to
help capture carbon dioxide emissions from new coal gasification plants.
x Recently, the Governor signed into law the IPAA that implements elements of his energy
plan. For example, the new law requires Illinois utilities to generate or obtain a certain
percentage of their electricity from renewable energy sources (renewable portfolio standard,
or RPS). The IPAA also requires utilities to invest more in energy efficiency and demand
response to meet specific energy saving goals.
x In February 2007, the Governor joined California Governor Arnold Schwarzenegger and
executives from BP to launch the Energy Biosciences Institute to be based at the University
of Illinois Urbana/Champaign and the University of California, Berkeley. The $500 million
effort funded by BP will invest in research on next-generation homegrown biofuels made
from crops that will cut GHG emissions, boost America’s energy independence, and create
new markets for Illinois farmers.
x In January 2007, Illinois adopted rules that the Governor introduced to dramatically improve
air quality and protect public health by slashing mercury, sulfur dioxide, and nitrogen oxide
9emissions from the three largest coal-fired power plant companies in Illinois—Midwest
Generation, Ameren, and Dynegy. The agreements include commitments to shut down three
of the oldest, least efficient boiler units, leading to a reduction of 2.1 million tons of CO2
annually.
x Illinois has become only the second state in the nation to join the Chicago Climate Exchange
(CCX). As a CCX member, the state makes a voluntary, but legally binding, commitment to
reduce GHG emissions from state buildings and vehicle fleets.
x In July 2006, the Governor announced the State of Illinois would power 141 Springfield-
based facilities under his control with clean renewable wind energy purchased from the
Springfield’s municipal utility company, City Water Light and Power. This is one of the
largest wind power purchases by any state or local government in the U.S.
x The first two utility-scale wind farms in Illinois became operational during the Blagojevich
administration, and fifteen more are proposed.
x Illinois played a pivotal role in the creation of The Climate Registry, a collaboration among
39 states to develop and manage a common greenhouse gas emissions reporting system.
Illinois EPA Director Doug Scott is Vice Chair of The Climate Registry.
x In early 2006, Illinois launched the Illinois Conservation Climate Initiative (ICCI) in
partnership with the CCX and the Delta Institute. ICCI offers farmers and other landowners
the opportunity to earn and sell greenhouse gas emission reduction credits through CCX
when they use conservation tillage and plant grasses and trees. These practices keep carbon
in the soil and plants instead of being released as carbon dioxide. Illinois is the first state to
sponsor such a program. More than 650 landowners have enrolled 127,000 acres.
x The state has taken numerous steps to reduce GHG emissions from its vehicle fleet,
including reducing the overall number of state vehicles by 11 percent, from 13,635 in 2003
to 12,100 in 2007; increasing the number of flex fuel vehicles in the state fleet from 1,339 in
2000 (10 percent of fleet), to 1,944 now (16 percent of fleet); and increasing the use of
renewable and cleaner burning ethanol and biodiesel in the state fleet. More than one million
gallons of biofuels have been consumed by state vehicles since April 2004.
x The Governor has approved incentives and programs that helped make Illinois the number
one consumer of biodiesel in the nation and the state with the second largest number of retail
gasoline stations that offer 85 percent ethanol fuel (E85). Biodiesel and E85 reduce CO2
emissions compared to diesel and gasoline.
x In 2006, the Governor signed legislation to limit idling by diesel vehicles in the state’s air
quality nonattainment areas (metropolitan Chicago and E. St. Louis). This reduces fuel
consumption and greenhouse gas emissions.
x In 2005, the Governor signed into law energy-efficiency commercial building code
standards, which reduce electricity demand and the corresponding GHG emissions from
power plants.
x The Governor introduced open road tolling on the Illinois Toll Highway System, which
reduces congestion, idling, fuel use, and greenhouse gas emissions.
x The Governor has recently signed three others pieces of legislation that will reduce GHG
emissions through energy efficiency and renewable energy generation:
o HB 1384 (P.A. 95-559) State buildings to reduce energy use by 10 percent in 10 years.
o HB 1460 (P.A. 95-104) State-owned and -leased buildings to have Energy Star lights.
o SB 680 (P.A. 95-420) Net metering for distributed renewable energy.
10SECTION III: OVERVIEW OF THE ICCAG PROCESS
Description of ICCAG Membership and Staffing
As noted above, the ICCAG was chaired by Doug Scott, Director of the Illinois EPA, and included
39 other individuals from private sector businesses, environmental groups, non-profit organizations,
academia, agriculture, local government, and labor unions. Members represented diverse
stakeholders and interests from throughout the state of Illinois. Members who were not able to
attend group meetings frequently sent another representative for their organization or business.
Illinois EPA retained the services of the World Resources Institute (WRI)—a Washington D.C.-
based environmental research and policy organization—to assist in the facilitation of ICCAG
meetings and provide technical expertise and general guidance in the formation of policy proposals.
They have provided similar assistance to northeastern states, western states, and Wisconsin. Dr.
Jonathan Pershing, Director of WRI’s Climate, Energy, and Pollution program, headed the WRI
team and facilitated each of the ICCAG’s five general meetings, along with Director Scott. Staff
from Illinois EPA and other state agencies such as DCEO were also asked to support the
stakeholder process, providing analytical and logistical support as needed.
With the input and assistance of WRI, the ICCAG retained the services of the consulting firm ICFI
to assess the recommended policy packages using the ENERGY 2020 model, a multi-sector energy
and emissions analytical computer model used in conjunction with the macroeconomic REMI
model, managed by DCEO staff. This enabled a full-economy assessment of state GHG trends as
well as the commensurate impacts on the economy (e.g., gross domestic product, personal income,
and jobs) resulting from the implementation of the proposed suite of climate policies through the
year 2020. The ENERGY 2020 model was chosen in large part because the ICCAG members
expressed a preference for a multi-sector model that accounts for the interaction of policies within
and between sectors. Section VI describes the modeling process.
Description of the ICCAG Process and Timeline
The ICCAG process was designed to be transparent, inclusive, and collaborative. ICCAG meetings
and conference calls were open to other stakeholders and the general public; moreover, anyone who
participated was given the opportunity to raise questions, concerns, and other issues. All major
decisions regarding policy proposals were vetted through ICCAG subgroups and the full ICCAG.
All information prepared in support of the process, and any written comments from member and
non-members, were posted on the Web at www.ilclimatechange.org.
At the first ICCAG meeting on February 22, 2007, Chairman Scott presented some ground rules to
help the ICCAG meet its goal of recommending strategies to achieve the Governor’s GHG
reduction goals. In particular, some subjects were designated as outside the scope of the process
and the discussions intended for the meetings, such as the following:
x Quality of climate change science. The Governor’s EO on climate change states that “the
scientific consensus is that increasing emissions of greenhouse gases are causing global
temperatures to rise at rates that could cause worldwide economic disruption, environmental
damage and public health crises.” Therefore, the ICCAG process did not assess nor debate
climate science.
11x Recommendations for national and international policies. While the Governor supports
national strategies to reduce GHG emissions, he and other governors around the country are
taking action to fill the void due to inaction at the federal level. The Governor’s leadership
on climate change is positioning Illinois to adjust to, and take advantage of, the low carbon
economy that is on the horizon. Moreover, by pursuing GHG abatement strategies that work
well in Illinois, the state is better positioned to help shape national strategies that may be
adopted in the future. Therefore, the process focused on measures that can be implemented
in Illinois.
x Policies related to vulnerability and adaptation. The Illinois EPA is participating in the
Chicago Climate Change Task Force, which includes an analysis of vulnerabilities and
adaptation strategies for the city of Chicago. This analysis has some applicability to the state
as a whole, and these important issues may be further considered at the state level in another
forum.
x Research and development. The long-term solutions to climate change will require extensive
research and development efforts at all levels of government. While such efforts are
important, the advisory group focused on recommending policy options with predictable
emissions reduction benefits.
It was also decided that the ICCAG would focus on strategies to meet the Governor’s 2020 goal,
and that this is the first step towards meeting the 2050 goal. Chairman Scott indicated that he would
recommend that the ICCAG, or a successor entity, should continue to meet periodically to both
assess progress toward meeting the Governor’s 2020 GHG reduction goal, and to discuss additional
strategies that will be needed to meet the Governor’s 2050 goal.
At the outset of the process, WRI created several documents for the ICCAG to facilitate the
assessment and selection of policy measures to reduce statewide GHG emissions. These documents
included an inventory of Illinois GHG emissions based on WRI data (see Section IV and Appendix
C), along with supplementary analysis regarding the emission profiles of other Midwest states and
states considered to be major exporters of electricity (like Illinois), as well as a detailed analysis of
key economic sectors within Illinois.
Table 4 below shows the ICCAG timeline, from the first meeting in February to the last meeting in
September. The ICCAG started with a list of 88 policy options (see Appendix D) that was
winnowed down to 25 for further analysis through an anonymous, online voting process for ICCAG
members designed by WRI. Four subgroups were created to assess these 25 policy options and to
ultimately recommend policy proposals to the full ICCAG to be modeled for their emissions and
economic effects. A fifth subgroup was created to oversee the modeling process. ICCAG members
and non-members alike were allowed to participate in the subgroups’ calls.
The ICCAG chair and vice chairs chaired the five subgroups, which were:
x Power and Energy: Chair, Howard Learner, Environmental Law and Policy Center
x Transportation: Chair, Michael Carrigan, AFL-CIO
x Cap and Trade: Chair, Doug Scott, Illinois EPA
x Commercial, Industrial, and Agricultural: Chair, Arthur Gibson, Baxter Healthcare
x Modeling: Chair, Doug Scott, Illinois EPA
The subgroups recommended 24 proposals to be modeled, including a market-based cap and trade
strategy to control emissions from fossil fuel power plants and relatively large commercial and
industrial sources of GHG emissions. Under a cap and trade program, the total pool of emissions is
12initially capped to a set amount that shrinks over time, and sources that stay below their allotted
emissions can sell emissions allowances, or allotments, to sources that exceed their allowable limits.
See Section V, Table 8 for a summary of the subgroup modeling recommendations.
Table 4: Illinois Climate Change Advisory Group Timeline
Event Location Date Agenda
Meeting 1 Chicago February 22, 2007 x Review ICCAG’s mission
x Process overview; ground rules
x IL GHG inventory and forecast
x Overview of Governor’s energy plan
x Introduction of policy options
x Discussion of modeling strategy
Meeting 2 Springfield & April 3, 2007 x Updates to IL GHG inventory and
Chicago via forecast
video x Results of policy option voting
conference x Formation of subgroups and tasks
x Update on selection of modeling
contractor
Meeting 3 Chicago & May 23, 2007 x Presentation on the Energy 2020
Springfield via model by ICF International
video x Subgroup recommendations for
conference policies to be modeled
x Discussion and action on subgroup
recommendations
x Modeling assumptions and the
Modeling Subgroup’s role
Meeting 4 Chicago & July 10, 2007 x Review of modeling results and input
Springfield via by the Modeling Subgroup
video x Reference case modeling results
conference x Preliminary policy scenario modeling
results
x Discussion of modeled policies
x 19 strategies supported by ICCAG
members with no dissent
Meeting 5 Chicago & September 6, 2007 x Emissions inventory update
Springfield via x Review of final reference case
video modeling results
conference x Review of final policy scenario
modeling results
x Majority of voting ICCAG members
supported five additional strategies
13With input from the Modeling Subgroup, ICFI developed a forecast of emissions and economic
trends under “business as usual” conditions through 2020, which is called the reference case. It
assumes a continuation of current economic trends and the associated GHG emissions and reflects,
to the extent possible, recently enacted policies and new projects that could affect GHG emissions
trends. The reference case serves as a point of comparison in analyzing the GHG reductions from
strategies included in the proposed policy scenarios developed by the ICCAG. A first iteration of
the reference case was presented to the full ICCAG at the fourth general meeting on July 10, 2007.
Four policy scenarios were modeled during the ICCAG process using the ENERGY 2020 and
REMI models to assess how close each scenario came to meeting the 2020 emissions reduction
goal, and to assess the economic impacts of each scenario. These policy scenarios included:
Scenario #1. All 24 strategies except for cap and trade.
Scenario #2. All the strategies including an Illinois-only cap and trade program.
Scenario #3. All the strategies including cap and trade with a link to the Northeast States’
Regional Greenhouse Gas Initiative (RGGI)—a regional cap and trade program.
Scenario #4. An additional model ‘sensitivity’ run on #2 above was performed that assumes
higher oil and gas prices (i.e., higher than those suggested by national government
agencies).
NOTE: Scenario #3 assumed a link to RGGI, rather than another cap and trade program,
because it is the only mandatory cap and trade program in the U.S. that is completed and can be
modeled.
Preliminary modeling results for the policy scenarios were presented to the full ICCAG membership
at the July 10, 2007, meeting, and the final results were presented at the last meeting on September
6, 2007. These results indicated that Scenarios #2, #3, and #4 would meet the Governor’s 2020
GHG reduction goal, and Scenario #1 would not. Compared to the reference case with no new
policies to address climate change, the modeling found that all four scenarios would increase
employment and GSP while decreasing electricity costs. See Section VI for more information about
the modeling results.
At its July 10 meeting, ICCAG members voted to support 19 strategies with no dissent and at least
one abstention. At the September 6 meeting, a majority of voting ICCAG members voted to support
an additional five strategies with eight to ten members dissenting and several members abstaining.
Summaries of the strategies supported by ICCAG members are provided in Section VII. Complete
descriptions of the strategies are included in Appendix F, and written comments from ICCAG
members and the public are in Volume 2 of the Appendices.
Because the ICCAG process was open and responsive to members and non-members alike, the
process was revised on numerous occasions in response to suggestions. However, certain process
decisions made by Illinois EPA and its advisors, such as the decision to exclude federal policy
recommendations, were questioned. The Illinois EPA’s response to those concerns is found in
Appendix G. Written comments from ICCAG members and the public are in Volume 2 of the Appendices.
14SECTION IV. ILLINOIS GREENHOUSE GAS INVENTORY
AND PROJECTIONS TO 2020
To provide the ICCAG with background and baseline data from which to base policy
recommendations, WRI developed an inventory of GHG emissions in Illinois (1990-2003) and
projections for future emissions through 2020. The inventory included each of the six major GHGs:
carbon dioxide (CO2), methane (CH4), nitrous oxide (N2O), and those referred to as the “F-Gases” –
hydrofluorocarbons (HFCs), perfluorocarbons (PFCs), and sulfur hexalfuoride (SF6). For the
purposes of compilation and comparison, emissions were described in terms of CO2e (CO2
equivalent*), referring to their global warming potential (GWP) relative to CO2.
All data for 1990-2003, unless otherwise noted, were derived from the U.S. module of WRI’s
Climate Analysis Indicators Tool (CAIT-US), and projections through 2020 were based on
historical trends and regional energy consumption growth rates developed by the U.S. Department
of Energy.
The inventory and projections document prepared by WRI was originally presented to the full
ICCAG in February 2007. At that meeting there were several technical comments and questions
from the group reflecting a desire to have more detailed GHG data in each major sector; to see how
GHG emissions in Illinois compare with other states; and to better understand how much electricity
Illinois exports and how this compares to others states. As a result, WRI prepared three addenda to
the emissions inventory that were presented at the April ICCAG meeting. The original inventory
document and the three addenda are found in Appendix C.
Since that time, revised and updated data have been incorporated into CAIT-US. To provide the
Governor with the most accurate and complete data available, this report presents emissions data
from CAIT-US version 2.0 (released in June 2007). The following is an overview of the original
document, incorporating the latest emissions data available. For additional information on the
emissions inventory, see Appendix C.
GHG Emissions in Illinois in 2003
In 2003, the most recent year for which data were available, Illinois produced an estimated 269
million metric tons of GHGs on a CO2 equivalent basis (MtCO2e), ranking it 7th compared to other
states, only slightly behind Florida and Indiana. Illinois generated 4.0 percent of total U.S.
emissions in 2003. For international context, if Illinois were its own country, it would rank as the
26th largest emitter in the world, slightly ahead of Thailand. See Table 5 below.
*CO2 equivalent provides a standardized unit of measurement to represent various greenhouse gases that have
different global warming potentials relative to the global warming potential of carbon dioxide, the most prevalent
greenhouse gas.
15Table 5. Top 10 GHG Emitting States
MtCO2e % of US
1 Texas 782 11.6%
2 California 453 6.7%
3 Pennsylvania 301 4.5%
4 Ohio 299 4.4%
5 Florida 271 4.0%
6 Indiana 269 4.0%
7 Illinois 268 4.0%
8 New York 244 3.6%
9 Michigan 212 3.1%
10 Louisiana 209 3.1%
Table 6 provides a breakout of emissions data by gas and sector, further illustrated in Figures 2 and
3.
Table 6. Illinois GHG Emissions by Gas and Sector – 2003
1,000 Tons CO2e CO2 CH4 N2O F-Gases Total
Electricity Generation 86,365 21 410 86,796
Residential 26,363 155 37 26,556
Commercial 12,641 42 14 12,698
Industrial 39,334 60 95 39,489
CO2 = carbon dioxide
CH4 = methane
Transport 64,677 94 1,414 66,185 N2O = nitrous oxide
HFC = hydrofluorocarbons
PFCs = perfluorocarbons
Fugitive Emissions 1,878 1,878 SF6 = sulfur hexafluoride
Industrial Processes 8,331 5,103 13,434
Agriculture 2,861 11,773 14,634
Waste 6,085 732 6,817
Total 237,711 11,196 14,477 4,852 268,487
16Figure 2. Illinois GHG Emissions by Gas Figure 3. Illinois GHG Emissions by
Economic Sector
Electric Generation
5% 2% CO2 5% 3%
4% 5%
Transportation
1%
31% Industrial
5%
CH4 Residential
10% Commercial
Fugitive Emissions
N2O
Agriculture
15%
Industrial Processes
89% 25%
Waste
F-Gases
Broken out by gas, CO2 comprises the largest share of Illinois GHG emissions at 89 percent,
equivalent to the proportion at the national level. It is also worth noting that N2O comprises a larger
share of GHG emissions in Illinois than does CH4 owing to the greater prevalence of cultivated
crops and fertilizer use in Illinois. By sector, electricity generation and transportation account for
more than half the state’s emissions. Energy-related emissions (electricity generation,
transportation, industrial, residential, commercial, and fugitive emissions) account for over 85
percent of Illinois GHG emissions.
GHG Emissions Trends in Illinois (1990-2003)
Total GHG emissions in Illinois increased between 1990 and 2003, as they did in all other states. In
Illinois, GHG emissions increased, in aggregate, by 16.1 percent. By comparison, the national rate
was 13.9 percent. However, an analysis of trends at the sector level reveals significant differences
between emissions growth in Illinois and the country as a whole. Table 7 presents emission trends
in Illinois and the U.S., and Figure 4 presents the annual trends in Illinois emissions by sector
between 1990 and 2003.
17Table 7. Emissions Growth in Illinois vs. U.S.
Illinois 1990 2003 Growth Annual Rate
Total (MtCO2Eq) 231.3 268.5 16.1% 1.2% 1
According to WRI, there
Electricity Generation 56.9 86.8 52.5% 3.3% is a discontinuity in data
availability for state level
emissions in the
Residential 25.7 26.6 3.3% 0.2% Industrial Processes
sector between 1996 and
Commercial 12.6 12.7 1.1% 0.1% 1997. As this sector is the
major source of F-gases it
Industrial 45.7 39.5 -13.6% -1.1% remains in this inventory;
however, trends in this
Transportation 55.9 66.2 18.5% 1.3% category from 1990-2003
are hindered by an
artificial growth in
Fugitive Emissions 4.2 1.9 -55.6% -6.1%
emissions, and trend
values are therefore likely
Industrial Processes 1 3.6 13.4 275.8% 10.7% lower than those
presented here.
Agriculture 17.5 14.6 -16.6% -1.4% 2
U.S. data are sourced
Waste 9.2 6.8 -25.9% -2.3% from EPA’s Inventory of
U.S. Greenhouse Gas
Sources and Sinks: 1990-
2004. Because of
differences in sector
U.S. 2 1990 2003 Growth Annual Rate definitions and methods
for assigning GHG
Total (MtCO2Eq) 6,108.9 6,959.1 13.9% 1.0% emissions to economic
sectors, emissions trends
Electricity Generation 1,803.6 2,272.2 26.0% 1.8% for the Residential,
Commercial and
Industrial sectors are
Residential 338.0 378.8 12.1% 0.9%
illustrative, but not
directly comparable to
Commercial 222.6 235.8 5.9% 0.4% those presented for
Illinois. Only CO2
Industrial 1,082.2 1,065.4 -1.6% -0.1% emissions from direct
fossil fuel combustion are
Transport 1,460.0 1,818.4 24.6% 1.7% displayed for the
Residential, Commercial
Fugitive Emissions 254.9 217.4 -14.7% -1.2% and Industrial sectors,
thus the sum of U.S.
sector data does not
Industrial Processes 301.1 304.1 1.0% 0.1% match the actual total
shown in Table 7.
Agriculture 439.6 439.1 -0.1% 0.0%
Waste 210.0 194.8 -7.2% -0.6%
18Illinois emissions increased steadily between 1990 and 2003, although there were three notable
periods when emissions declined. Between 1991-1992 and 2001-2002, the U.S. experienced mild
economic recessions resulting in lower economic output and GHG emissions. Emissions in 2002
and 2003 did not increased significantly primarily due to a lack of continued growth in electric
generation emissions in these years. The other instance of a decrease in Illinois emissions occurred
in 1998, coinciding with a significantly warmer than normal winter that resulted in lower than
average emissions from the residential and commercial sectors due to a reduced demand for heating
fuels.
Figure 4. Illinois GHG Emission Trends by Sector: 1990-2003
300
Industrial Processe
250 Fugitive Emissions
Million Metric Tons CO2 Eq.
Waste
200
Commercial
150 Residential
Agriculture
100
Industrial
Transportation
50
Electric Generation
0
03
90
91
92
93
94
95
96
97
98
99
00
01
02
20
19
19
19
19
19
19
19
19
19
19
20
20
20
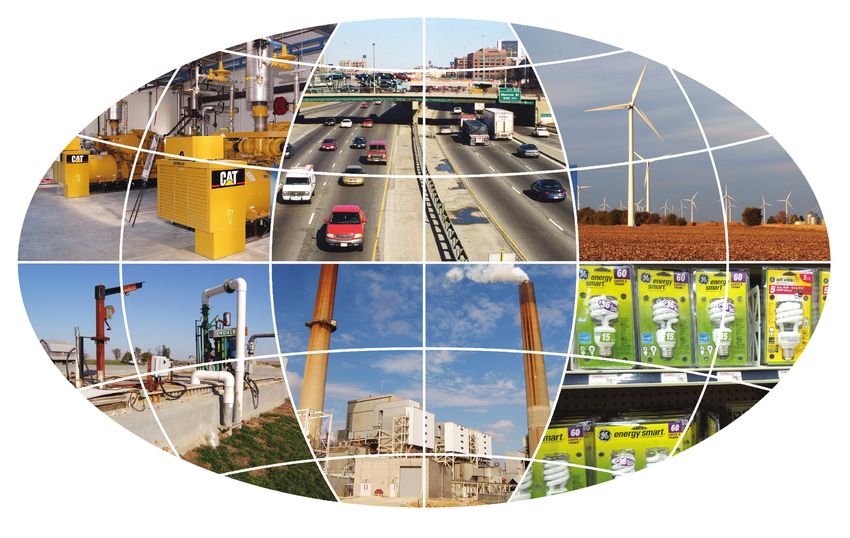
Between 1990 and 2003, electricity generation from nuclear power and coal increased by
approximately 30 percent and 65 percent, respectively, with total electricity generation increasing
46 percent over the same time period compared to 28 percent for the U.S. as a whole. See Figure 5
below. The significant increase in coal-fired generation contributed to the 52.5 percent increase in
GHG emissions from the electricity sector shown in Table 7 above.
Electricity generation increased even though no new coal or nuclear capacity was installed over this
time span; instead, existing nuclear and coal plants increased their generation of electricity. The
significant growth in electricity generation coincided with Illinois’ adoption of utility deregulation
in 1997 and the subsequent expansion of Illinois electricity exports. See Figure 6 below. Electricity
exports have steadily increased, more than doubling since 1990, with the exception of a clear
decrease in 1997-1998. During this time, a portion of Illinois’ nuclear generation capacity was
temporarily off-line. This reduced total state electricity generation as well as net electricity exports,
but not GHG emissions since some of the lost, zero-emitting nuclear generation was made up by
increased coal generation.
19Figure 5. Illinois Electric Generation by Fuel 1990-2005
200,000
180,000 Other
160,000 Hydroelectric
Conventional
140,000
Other Renewables
Thousand MWH
120,000
Other Gases
100,000
Petroleum
80,000
Natural Gas
60,000
Coal
40,000
Nuclear
20,000
0
1990 1995 2000 2005
Figure 6. Illinois Electricity Exports 1990-2005
60,000
50,000
Thousand MWH
40,000
Illinois Electricity
30,000
Exports 1990-2005
20,000
10,000
0
90
92
94
96
98
00
02
04
19
19
19
19
19
20
20
20
Source for Figures 5 and 6: Energy Information Administration, Electric Power Annual 2005
http://www.eia.doe.gov/cneaf/electricity/epa/epa_sprdshts.html; WRI calculations
Emissions from transportation also increased significantly (nearly 19 percent), as vehicle miles
traveled (VMT) in Illinois increased by 28 percent in the aggregate and 17 percent per capita
between 1990 and 2003 (an increase in emissions and VMT slightly less than the national trend).
The decline in industrial emissions was due primarily to fuel switching away from coal and towards
natural gas as well as increased efficiency as energy use in the sector remained stable through this
period. Meanwhile, emissions from the agriculture sector decreased 17 percent in Illinois between
1990 and 2003, compared to an essentially flat rate nationally, due in part to lower methane
20emissions with decreased numbers of livestock, especially cattle and swine.
It is difficult to attribute the trends in several of the other sectors, such as residential and
commercial sectors due to seasonal and annual variations in temperature, or the waste sector due to
population-based emissions estimates.
Projections of Illinois GHG Emissions (2003-2020)
To provide a range of possible future emissions trends, WRI presented three emissions forecasts
through 2020, referred to by WRI as “low,” “best guess,” and “high,” at the first ICCAG meeting in
February. The projections were based on regional growth rates for energy consumption developed
by the Energy Information Administration (EIA) (published in the Annual Energy Outlook 2006)
and historic emission trends for electric power, waste, agriculture, and industrial processes. See
Appendix C. Some members asked why the emissions forecasts did not extend to 2050 to be
consistent with the Governor’s 2050 goal. WRI explained that due to difficulties and uncertainties
around 2050 projections, 2020 projections are more reliable.
WRI also provided preliminary estimates of emissions reductions from implementing Governor
Blagojevich’s Energy Independence Plan (EIP). Some ICCAG members thought WRI’s EIP
estimates were overly optimistic, and they asked for a range of emissions projections based on
different assumptions around the effectiveness of cellulosic ethanol and integrated gasification
combined cycle power plants using carbon capture and sequestration (CCS) to reduce emissions.
This information was provided at the next meeting in April.
WRI’s projections were simply an early stage range of estimates to give ICCAG members a relative
sense of Illinois’s future GHG emissions in advance of the modeling by ICFI. The ICFI modeling
produced a far more detailed and robust forecast of emissions that was ultimately used for decision
making (see Section VI). At the same time, the information that was assembled at this earlier stage
of the process ultimately helped inform the modeling by ICFI. See Appendix C for further
discussion of WRI’s emissions projections.
21You can also read