CRD Residential Energy Retrofit Program - Business Case Phase 2 Memo - FINAL APPENDIX A - Capital Regional ...
←
→
Page content transcription
If your browser does not render page correctly, please read the page content below
APPENDIX A
P

l
    CRD Residential Energy Retrofit Program
            Business Case Phase 2 Memo – FINAL

                                                 September 2021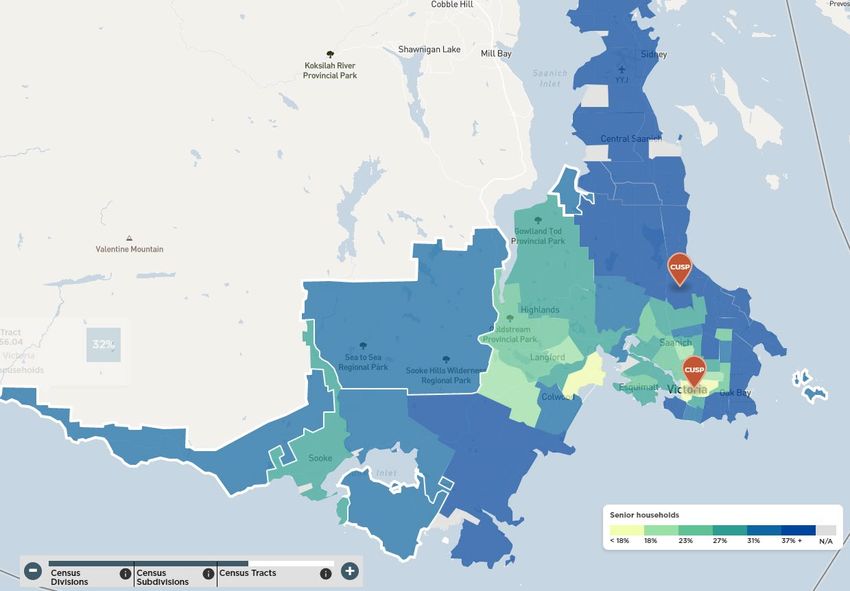
Prepared by

Integral Group
Suite 180 - 200 Granville Street
Vancouver, BC V6C 1S4

Windfall Ecology Centre
93a Industrial Pkwy S, Aurora, ON L4G 3V5
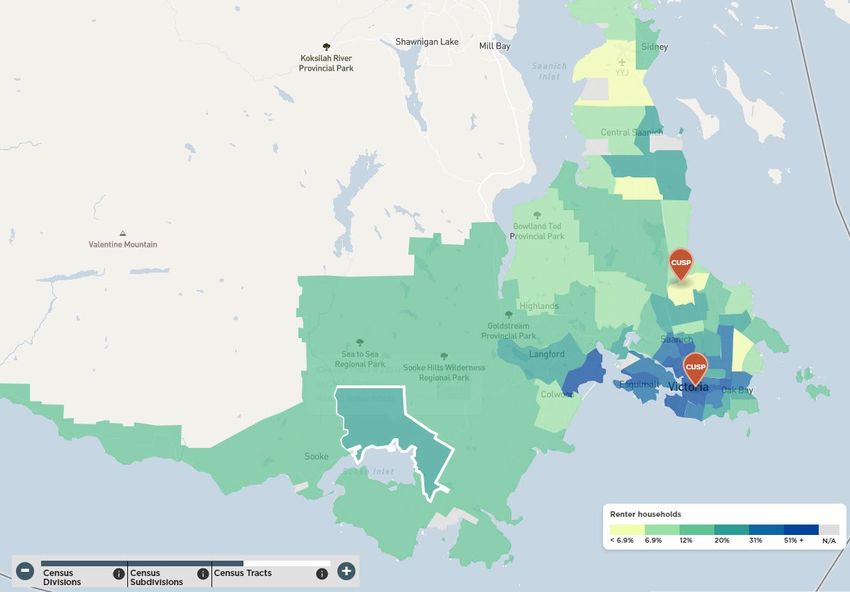
TABLE OF CONTENTS
EXECUTIVE SUMMARY ........................................................................................................................................ 5
1. INTRODUCTION......................................................................................................................................... 10
  1.1.  Background ...................................................................................................................................... 10
     1.2.       Project Purpose & Approach .......................................................................................................... 11
2.     EMISSIONS REDUCTION POTENTIAL IN THE CAPITAL REGION ..........................................................12
     2.1.  Single-Family/Part 9 Savings Potential .......................................................................................... 13
     2.2.       Multifamily/Part 3 Savings Potential ............................................................................................. 14
     2.3.       Housing Stock Analysis ................................................................................................................... 15
     2.4.       Emissions Reduction Potential Across the Capital Region .........................................................21
     2.5.       Key Takeaways ................................................................................................................................. 27
3.     THE EXISTING PROGRAM LANDSCAPE ................................................................................................... 28
     3.1.   Utility Programs ............................................................................................................................... 28
     3.2.       CleanBC Better Homes and Buildings........................................................................................... 29
     3.3.       Natural Resources Canada ............................................................................................................. 30
     3.4.       Bring It Home for the Climate ........................................................................................................ 31
     3.5.       SEA Change – Strata Energy Advisor Program ............................................................................. 31
     3.6.       Federation of Canadian Municipalities (FCM) .............................................................................. 31
4.     PROPOSED PROGRAM DESIGN ............................................................................................................... 32
     4.1.  A Proposed Program Model for the CRD ..................................................................................... 32
     4.2.       Proposed Program Design ............................................................................................................. 33
     4.3.       Targeting Program Markets ........................................................................................................... 35
     4.4.       Exploring Potential Homeowner Markets .................................................................................... 40
     4.5.       Key Takeaways ................................................................................................................................. 44
     4.6.       Additional Program Benefits .......................................................................................................... 45
5.     ESTIMATED PROGRAM COSTS................................................................................................................. 47
     5.1.   Estimated Costs: Program Overhead............................................................................................ 48
     5.2.       Estimated Costs: Homeowner Support ........................................................................................ 50
     5.3.       Key Takeaways ................................................................................................................................. 52
     5.4.       Key Barriers and Issues to Resolve ............................................................................................... 52
     5.5.       Managing Liability and Program Risk............................................................................................ 55
6.     PART 3 MULTIFAMILY HOMES ................................................................................................................. 55
     6.1.  Strata Buildings ................................................................................................................................ 56
     6.2.       Multifamily Rental Buildings .......................................................................................................... 56
7.      CONCLUSION ............................................................................................................................................ 57

                                                                                3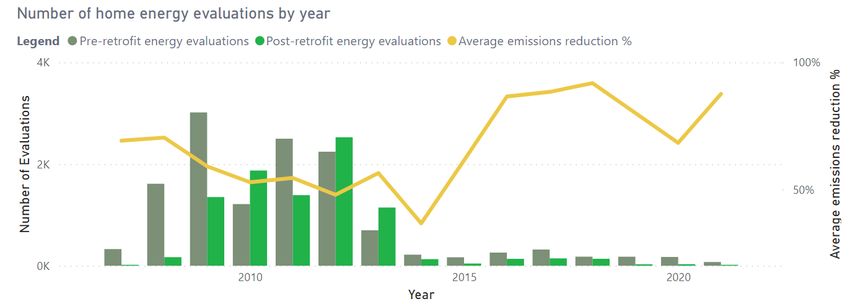
APPENDIX A.  ONE-STOP-SHOP (OSS) CASE STUDIES ............................................................................. 58
  A.1  KFW Effizienzhaus ............................................................................................................................ 58
   A.2        Oktave ............................................................................................................................................... 59
   A.3        Izigloo ................................................................................................................................................ 60
   A.4        SuperHomes ..................................................................................................................................... 61
   A.5        BetterHome ...................................................................................................................................... 62

                                                                                  4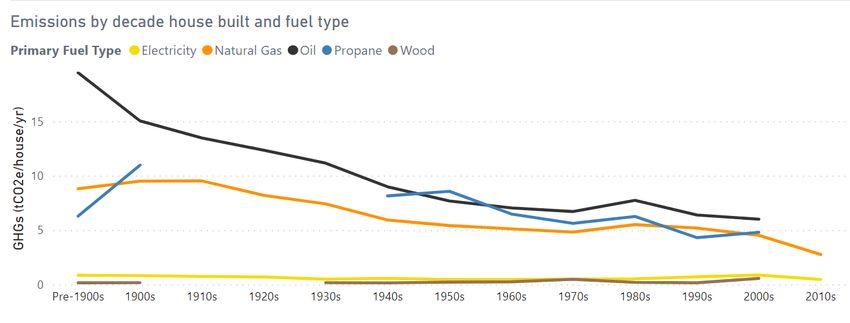
EXECUTIVE SUMMARY

Background

Reducing emissions in the buildings sector presents a significant challenge. While new construction
standards are continuously improving in energy efficiency (with an emissions target potentially
forthcoming), the existing stock of the capital region's homes will need to be retrofitted to reduce
energy consumption and shift to renewable, low emissions sources of energy. When combined with
the region's existing affordability challenges, retrofits pose a complex issue.

To help address these challenges and support the achievement of the Capital Regional District’s
(CRD) and local municipal climate change goals, the CRD and local government partners, are
exploring the development of a Regional Residential Energy Retrofit Program capable of spurring deep
emissions retrofit actions by home and building owners across the region. While several programs
at the federal, provincial, and regional level have been put in place to support homeowners in
retrofitting their homes, they have only begun to address the many barriers that homeowners face,
from a lack of awareness of options, to a lack of trust in or access to measures, affordability
challenges, and the sheer complexity of the task, among others.

A regionally-coordinated program that builds on these programs and specifically seeks to remove
these barriers and provide homeowners with the support they need to make the switch to lower
carbon home energy systems will be crucial to meeting the CRD’s emissions reduction targets. Such
a program would also highlight the many benefits to homeowners that electrification can bring,
including:

   •   Improved air quality, by improving filtration and ventilation, regulating moisture,
       strengthening barriers to outdoor pollutants, and reducing sources of indoor air pollutants
       that can exacerbate pre-existing conditions.

   •   Increased equity and affordability, by helping homeowners identify and implement
       measures to reduce their energy consumption, especially when coupled with other
       incentives that reduce retrofit costs.

   •   Improved resilience, by supporting homeowners install heat pump systems that provide
       cooling as well as heating, safeguarding against increases in summer temperatures and the
       incidence of heat waves that will come with climate change. Supporting the addition of
       enhanced air filtration will also help protect household health against increasing wildfire
       smoke events.

   •   Increased local economic growth, by increasing the number of higher income/lower
       barrier jobs in the retrofit industry.

                                                 5
A Regional Home Energy Retrofit Program
To help homeowners identify and implement retrofit measures best-suited for their home, a
subsidized “One Stop Shop” model is recommended for the capital region based on its ability to:
• Build on and integrate existing program infrastructure, including the CRD’s current Bring It
Home 4 Climate (BIH4C) program and the Province’s Energy Coach Service, by providing
homeowners with much-needed support in choosing the right option for them
• Provide homeowners with enhanced retrofit coordinator support tailored according to their
needs, and focused on supporting the decarbonization of existing homes
• Better identify and target local market opportunities and help establish local contractor
delivery networks, and
• Monitor performance through post retrofit follow-up to ensure homeowner satisfaction
A new CRD program could leverage the intake process through the Energy Coach program, while
placing a concerted focus on fuel switching for emissions reductions as in BIH4C to ensure the
benefits of home electrification are reaped. The proposed program design assumes that a moderate
level of support could be provided by a Retrofit Coordinator per household to add to existing
services, specifically helping alleviate the challenges of navigating the retrofit process once initial
support has been provided via the Energy Coach service. Specific services that are assumed will be
provided by a Retrofit Coordinator are outlined in the table below. These services build on the
information and resources provided by the Federal government and the EnerGuide auditor, while
addressing key gaps that prevent residents from translating the EnerGuide recommendations into
specific actions and real-world GHG savings.
Step Tasks
Screen • Conduct (virtual) home energy check-up/screening
• Review EnerGuide Renovation Upgrade Report
• Assist client with upgrade choices
Review and Plan • Consider DIY options and provide contractor selection advice and standardized
quotation forms
• Direct client to qualified contractor directory
• Help homeowner scope work, compare contractor bids, ensure rebate
Compare & Select
eligibility, and provide troubleshooting throughout the process.
Finance • Help identifying and selecting financing and incentives
Document • Help getting documentation and assist with submitting rebate applications
• Quality Assurance checks post-retrofit (done in aggregate or spot-check)
Evaluate
• Measurement & Verification
An initial focus on Part 9 (i.e., single family homes, duplexes and townhomes) is recommended for
the CRD, as this sector represents the most significant opportunity and a potential savings of up to
15% of the capital region’s total emissions over current levels. The upper end of this range can be
captured by ensuring that most retrofits involve electrification and that the benefits of all electric
homes listed above are captured. Some key considerations for the development of a Part 9 focused
program are noted below:
6• Oil heated-homes constructed before 1940 have the highest GHG emissions and remain a
good target for retrofits, though there are fewer of these homes remaining. Oil-heated
homes are also high adopters of fuel switching projects and often select heat pumps.
• Pre-1990 gas heated homes are high adopters of insulation upgrades, though they tend to
retain or upgrade gas equipment rather than considering fuel switching. Newer homes (i.e.,
after 1990) are particularly high adopters of heat pumps.
• The rapid increase over the last decade of homes in the capital region adding natural gas
furnaces indicates a continued risk of homes fuel switching towards natural gas. Every home
that replaces electric resistance heating with a heat pump is one fewer home adding natural
gas. As such, homes with electric resistance heating should remain a target area for the
program, to forestall increases in natural gas use that could otherwise eliminate the net
savings.
• The Province of BC is releasing an income qualified program specifically targeting low-
income households and the unique barriers they face in upgrading their homes, the CRD
should focus on other demographics in initial stages of the program and seek to strategically
fill gaps as these income-qualified programs become established in the market.
• Targeting program outreach materials to the following markets will help to increase uptake
in formative program years and build overall market capacity and demand:
o Demographics and neighbourhoods that may be well equipped to make
improvements, including higher income neighborhoods (e.g., Oak Bay and the
Uplands), senior populations, and households in need of renewal, can improve
program uptake and the overall impact on energy and carbon savings.
o Newly purchased homes represent an opportunity for upgrades, as many new
homeowners often take on renovations early on.
o Moderate-income communities where natural gas is less prominent, and electric
resistance and oil heating are more common, also presents a valuable GHG
reduction opportunity alongside a potential reduction in energy poverty.
• Emphasizing the non-financial benefits of retrofits (e.g., increased thermal comfort and
cooling, better indoor air quality, and lower carbon footprint), in communication and
outreach can help attract homeowners to the program.
7A Business Case for the CRD
Total estimated program costs for a Part 9 focused home retrofit program are outlined in the table
below:
Program Year Y1 Y2 Y3 Y4 Y5
Calendar Year 2022 2023 2024 2025 2026
Budget $602,500 $602,500 $602,500 $602,500 $602,500
CRD Staff (0.5 FTE) $52,500 $53,500 $54,500 $55,500 $56,500
Program Overhead $240,000 $188,220 $190,484 $192,794 $195,150
Homeowner Support $310,000 $360,780 $357,516 $354,206 $350,850
Estimated Program FTEs
3 5 5 5 4
(excluding CRD staff)
% Program Overhead (excluding
40% 31% 32% 32% 32%
CRD staff)
Homes Going Through 885 1030 1021 1012 1002
Program/Year
% annual penetration 0.9% 1.0% 1.0% 1.0% 1.0%
Homes/Year with leveraged
92 107 106 105 104
resources
% annual penetration with
0.1% 0.1% 0.1% 0.1% 0.1%
leveraged resources
Additional tCO2e abated each year* 1781 2072 2054 2036 2016
Key insights from the cost analysis include the following:
• A CRD-run program that integrates into existing program offerings and provide homeowners
with coordinator support not currently offered by existing CleanBC Energy Coach services is
estimated to require an average of 7 hours of support or $350 per household. Such levels of
support will vary considerably as those engaging in deeper retrofits or with more complex
homes may require more, while others will require less.
• Program overhead is estimated at approximately $290,000 in the first year, decreasing to
$240,000 in subsequent years as the program gets off the ground and promotional materials
are developed.
• Program resources that can be leveraged in a CRD-led program include existing federal and
provincial rebates and incentives for pre- and post-retrofit audits, electrical service upgrade
top-ups and rebates. In the event that these resources are reduced or eliminated, the CRD
will need to reassess the nature and/or level of support for homeowners to reap the best
value.
• A fixed budget of $602,500 per year for the first five years is estimated to support the
completion of home retrofits in 1% of the homes in the capital region per year, representing
a standard but substantial uptake rate. While carbon savings will vary based on the nature of
the upgrade, it is estimated that this could yield between 1.18 tCO2e and 2.43 tCO2e of
emissions savings per home, or a total of over 2000 tCO2e additional carbon savings across
8the capital region each year. This translates into a cumulative29,443 tCO2e avoided over five
years.
• Program costs supporting a 1% uptake rate can be met by applying to the Federation of
Canadian Municipalities’ Community Efficiency Financing (CEF) funding stream. However, an
uptake rate of 3% of homes per year is necessary to achieve a full building stock
improvement by 2050. The scale of such a program would require significant support at
provincial and federal levels, including additional incentives and rebates for electrification
equipment and supporting efficiency measures.
Moving Beyond Single-Family Homes
While the GHG savings available in Part 3 multifamily buildings represent only 18% of the GHG
savings potential as is available in the Part 9 housing stock, a significant proportion of the building
sector in some CRD communities is made up of multi-unit residential buildings. As such, both strata
owned and rental, and will require dedicated programming to meet municipal and provincial
emission reduction ambitions. With respect to strata, a project currently being led by Metro
Vancouver and a group of other local governments is exploring the potential expansion of Metro
Vancouver's Strata Energy Advisor Program across the province. In its current form, the program is
intended to provide strata buildings with a program specifically designed to address their unique
barriers. If adopted at the provincial level, such a program would support strata owners and their
property managers understand and undertake energy efficiency and emissions reduction upgrades,
and fill the gap of retrofit support currently available to strata owners. However, even if the Strata
Energy Advisor program is not expanded provincially, it would provide a strong framework on which
to expand the CRD’s program to strata housing in a later or concurrent phase.
The analysis of the multifamily rental housing stock listed in the BC Assessment data indicates that
there are 30 purpose-built rental buildings over 100,000ft2, accounting for 20% of the rental floor
area in the region but only 2.5% of the 1,187 buildings. The overall age of the rental stock is older
than the strata stock as well; 15 of the 30 largest rental MURB buildings were built before 1977, with
the median year built for the sector overall at 1969. Targeted outreach to the owners and property
managers for these buildings could have a significant impact on community emissions across the
region, and would benefit a greater proportion of lower-income households or those living in or at
risk of energy poverty.
91. INTRODUCTION
1.1. Background
The Capital Regional District (CRD) has set a target of reducing its greenhouse gas (GHG) emissions
community-wide by 61% (over a 2007 baseline) by 2038, and working towards regional carbon
neutrality by 2030. To meet this goal, emissions reductions will need to be achieved across several
sectors, including the building sector, which accounts for over 30% of the capital region's emissions.
Figure 1: CRD GHG inventory by sector, 2018
Reducing emissions in the buildings sector presents a significant challenge. While new construction
standards are continuously improving in energy efficiency (with an emissions target potentially
forthcoming), the existing stock of capital region's homes will need to be retrofitted to reduce
energy consumption and shift to lower carbon sources of energy. When combined with the region's
existing affordability challenges, retrofits pose a complex issue. Indeed, the CRD's Transition 2050
initiative identified seven key challenges to deep emissions retrofits 1:
• Scale of the challenge. Retrofit uptake has been low across the Province, meaning a rapid
increase in the rate, scale and depth of home retrofits will be required for both the CRD and
the Province of BC to meet their 2030 GHG reduction targets.
• Economic barriers. Changes in utility costs, high upfront costs, overall affordability, and
contractual restrictions with some rental properties all constrain retrofit uptake.
• Awareness and acceptance. Homeowners lack awareness and understanding of retrofit
opportunities, rebates, technologies, and the overall benefits of retrofits.
1
City Green Solutions & Home Performance Stakeholder Council. Residential Retrofit Market Acceleration Strategy.
10• Consumer trust, access, and industry capacity. There is limited access to high efficiency
products, as well as challenges finding qualified contractors.
• Rental housing and demographic challenges. Economic barriers are present in low-
medium income (LMI) households, while rental properties are faced with a split incentive
problem.
• Complexity. The overall complexity of the retrofit process and additional barriers associated
with hazardous material; for example, asbestos and disposal costs limit homeowners' ability
and willingness to engage in retrofits.
• Psychological barriers. Physiological barriers to the adoption of residential retrofits include
distrust towards experts and authorities, as well as a perceived risk of changing from one
system to another.
Coupled with the fact that approximately 15% of the capital region's population is characterized as
living in or being at risk of energy poverty, any effort to increase the rate and depth of retrofits must
take care to also ensure that the cost of living can be improved or at least maintained. Energy
poverty is often defined as households who struggle to meet their home energy needs and spend
more than 6% of their after-tax income on their energy needs. 2 Similar concerns also exist around
the issue of “renovictions”, in which tenants may be evicted to allow for renovations to be made to a
unit, often resulting in higher rent units.
1.2. Project Purpose & Approach
To help address these challenges and support the achievement of the CRD's climate change goals,
this project is tasked with developing a detailed business case for a successful Regional Residential
Energy Retrofit Program capable of spurring deep emissions retrofit actions by home and building
owners across the region. While several programs at the federal, provincial, and regional level have
been put in place to support homeowners in retrofitting their homes, they have only begun to
address the barriers noted above. A regionally-coordinated program that builds on these programs
and specifically seeks to remove these barriers and provide homeowners with the support they
need to make the switch to lower carbon home energy systems will be crucial to meeting the CRD’s
emissions reduction targets. Such a program would also highlight the many benefits to homeowners
that electrification can bring, from improved air quality and resilience, to lower home energy costs
and increased local economic activity.
Given the emissions reduction opportunity that this sector faces, this memo has developed a draft
program design and business case focused on Part 9 homes (i.e., single-family, duplex and
townhouse). The data presented here is based on the following steps and sources of information
and analysis:
• A review of available data sources to assess the scale of the retrofit market in the capital
region
• A review of existing and planned program offerings in the residential retrofit market in
BC and Canada
2
CUSP. 2019. Energy Poverty in Canada: a CUSP Backgrounder
11• A scan of best practices in residential retrofit programs to determine potential models
• A workshop and follow-up meetings with an Advisory Committee to review proposed
program approaches and costs, representing leaders and key stakeholders in the retrofit
market
• Discussions with CRD staff and Steering Committee members, representing staff from
member jurisdictions
The information and insights derived from these steps were used to draft a high-level set of
assumptions around potential program design, which were then costed based on consultant team,
Advisory Committee and CRD and municipal staff experience to inform a business case prior to full
program design. Recommendations for Part 3 (i.e., multi-unit residential buildings) are also
provided, given the importance of taking advantage of the equity and emissions reduction
opportunities in this sector as well.
2. EMISSIONS REDUCTION POTENTIAL IN THE CAPITAL REGION
To assess the potential of a residential retrofit program to help meet the CRD’s emissions reduction
targets, it is necessary to first identify the region's current residential building stock and its key
characteristics. The scale of the retrofit market in the region was assessed by taking the following
steps for both Part 9 and Part 3 residential buildings 3:
1. Energy Savings Potential:
a. Part 9: An assessment of available EnerGuide data to show the average pre- and
post-retrofit energy use intensities (EUI) and greenhouse gas intensities (GHGI)
b. Part 3: A review of energy savings estimates from the Strata Energy Advisor program
and an analysis of the GHG potential for multi-unit residential buildings (MURB) fuel-
switching
2. Building Stock: An analysis of BC Assessment data to identify the number of homes and
floor area across the capital region, grouped by decade built, jurisdiction, and housing type.
3. Fuel Type Estimates:
a. Part 9: An exploration of a Victoria Real Estate Board survey of >10,000 homes to
estimate primary heating fuel for single family homes.
b. Part 3: A review of the BC Assessment data, coupled with an application of
assumptions from previous studies
4. Region-wide Estimates: An application of EnerGuide pre-retrofit, post-retrofit, and post-
fuel-switch-retrofit 4 EUIs and GHGIs assigned across homes (based on number and floor
area) by jurisdiction and building age, to estimate total current emissions and total
emissions savings potential across the region
3
The B.C. Building Code has two main categories of buildings, Part 9 (simple buildings) and Part 3 (complex buildings). Part 9
buildings are generally three stories or less, and under 600 square meters. Some examples include houses and duplexes,
small apartment buildings, and small commercial buildings. Part 3 buildings are generally over three stories and more than
600 square meters. Some examples include shopping malls, office buildings, condos, apartment buildings, schools, theaters,
and care facilities.
4
A fuel switch retrofit refers to a replacement of a more GHG emissions-intensive heating system (i.e., one that uses oil or
natural gas) with one that is lower in emissions intensity (i.e., electricity)
12Each of these steps is discussed in further detail in the sections below.
2.1. Single-Family/Part 9 Savings Potential
EnerGuide for Houses is a program created by Natural Resources Canada (NRCan) that provides
homeowners with independent expert advice concerning energy efficiency in their homes. Through
the work of Registered Energy Advisors (REAs), homes are evaluated across Canada both before and
after energy efficient retrofit projects. By collecting key measurements such as fuel type, floor area
and insulation levels, REAs use a home modelling software to derive metrics including GHG
emissions, EUI, and EnerGuide ratings, all of which are used to advise the homeowner on making
energy efficient improvements to their home. Data from all EnerGuide evaluations are then
collected by NRCan, creating a database of houses and home retrofit projects ideal for
benchmarking existing homes and estimating emission reduction potential.
Figure 2: Reviewed EnerGuide data set and average emissions reductions.
Figure 3: Pre-retrofit emissions by decade and heating fuel type (Note: gaps indicate where no data was gathered on
homes of that vintage using that fuel)
For this project, 13,177 pre-retrofit evaluations and 9,117 post-retrofit evaluations within the capital
region were analyzed, spanning from 2007 to early 2021 (see Figure 2). Below are some key findings:
13• An average retrofit project within the region reduces GHG emissions by 38.45%. When
segmented, fuel switching projects save an average of 70.53 of emissions, whereas non-fuel
switching projects save 10.58%.
• Fuel switching occurs in 26% of recorded retrofit projects, with 63% switching to electricity
and 37% switching to natural gas. 92% of fuel switches see a shift away from oil, with 5%
shifting away from natural gas. The high occurrence of fuel switching away from oil reflects
the high cost of oil heat, as well as the Oil-to-Heat-Pump program that operated in the region
from 2015 to 2018.
• Average household GHG emissions vary heavily based on the heating fuel source used. Oil-
using homes are the highest emitters with an average of 9.92 tCO2e/year, followed by
natural gas at 8.05 tCO2e/year and propane at 7.70 tCO2e/yr. Electric heated homes are
considerably lower at 1.52 tCO2e/year. Figure 3 shows the pre-retrofit evaluation GHGs per
home by decade.
• The largest quantity of GHG emissions reduced through retrofitting is in 1910 homes, with
an average household reduction of 3.32 tCO2e/yr. The average reduction continues to
decline with decreasing house age, with homes built in the 2000s only saving an average of
0.52 tCO2e/yr.
• While the high number of EnerGuide evaluations in the sample reflects in part the availability
of federal ecoEnergy incentives during the earlier half of the sample period, these 9,117
completed retrofits still represent less than 10% of the homes in the capital region.
• Among single family homes, floor area, year of construction and primary pre-retrofit heating
fuel are key indicators of GHG savings. These findings drove the structure of the remainder
of this analysis.
2.2. Multifamily/Part 3 Savings Potential
Given the absence of EnerGuide data to draw on for Part 3 multi-family buildings, the energy savings
potential for the Part 3 building stock was estimated by using findings from Metro Vancouver’s Strata
Energy Advisor program, in addition to a set of studies of retrofit opportunities in MURB properties
on Vancouver Island and the Lower Mainland. 5 The Strata Energy Advisor pilot program report from
2016 grouped MURB retrofits into several key retrofit tiers. 6 However, this analysis did not examine
a change of heating fuel or technology; buildings using natural gas heat were assumed to still be
using natural gas heat, and buildings using electric resistance were not assumed to switch to heat
pumps. As such, a Tier 4 retrofit opportunity was developed by drawing on an analysis of the heat
pump opportunities to estimate the savings opportunity from a fuel switch. 7 The resultant tiers are
as follows:
0. Retrocommissioning / Tune-up only
1. Normal Renewal: code minimum equipment replacement without increased insulation, or air
sealing
5
Metro Vancouver, Strata Energy Advisor. http://www.strataenergyadvisor.ca/Pages/default.aspx
6
RDH, Strata Energy Advisor Program Recommendations, 2016
7
Integral Group, Heat Pump Applications in Residential Buildings, 2016
142. Energy Retrofit: R5 Wall Insulation, R10 Roof Insulation, Condensing Boiler/furnace
3. Comprehensive Retrofit: R10 Wall Insulation / R20 roof insulation, air sealing, U-0.2
windows,93%+ efficient furnace or boilers
4. Heat Pump Retrofit: Distributed air source heat pump or 4-pipe air-to-water heat pump with
COP of 3.0, and a central air to water heat pump for domestic hot water, along with similar
insulation upgrades as Tier 3.
Average emissions savings estimates for MURB retrofits for each of these tiers are shown in Figure
4.
100%
90%
80%
73%
70%
60%
60%
52%
50%
40%
40%
32%
30% 23%
20% 17%
13%
10% 10%
10%
0%
Tier 0 Tier 1 Tier 2 Tier 3 Tier 4
Natural Gas Elec Res
Figure 4: Potential GHG savings in MURB retrofits, British Columbia Climate Zone 4C
2.3. Housing Stock Analysis
A review of the BC Assessment housing data for the region was conducted to identify the floor area
of homes by decade and jurisdiction (see Figures 5 and 6 for single family homes, and Figures 7 and
8 for Part 3 Multifamily buildings). This analysis revealed that most homes in the capital region are
smaller, single-family homes, and 63% of all residential dwellings and 68% of all residential floor
area is represented by Part 9 buildings. These 101,535 homes in the dataset comprise single-family
detached homes, townhouses, strata townhouses, duplexes, triplexes, and fourplexes. 8
The remaining residential floor area is represented by strata multifamily buildings and purpose-built
rental multifamily buildings. Stratified condominium buildings (strata) represent 63% of the Part 3
floor area and 20% of the overall residential floor area, while purpose-built rental represents 37% of
the Part 3 buildings and 12% of overall residential floor area. The bulk of the Part 3 stock is found in
the City of Victoria, home to 49% of all multifamily units, and 61% of the purpose-built rental
8
As BC Assessment does not account specifically for First Nations homes, they are not represented in this analysis
15multifamily units in the Capital Region. Esquimalt, Langford, Saanich, and Sidney are home to 86% of
the total multifamily housing stock in the Capital region. 9 A summary breakdown of all home types
across the capital region is shown in Table 1.
Table 1: Breakdown of home type across the capital region
Units/ Gross Floor % of
Typology Homes Buildings Area (ft2) Units/Homes % Buildings % GFA
Single Family
Houses
110,034 92,085 133,454,861 56.9% 90.7% 63.9%
(including
suites)
Duplex, Triplex,
12,786 6,074 8,523,298 6.6% 6.0% 4.1%
and Fourplex
Strata MURB 40,674 2,200 41,954,968 21.1% 2.2% 20.1%
Rental MURB 29,730 1,187 24,772,510 15.4% 1.2% 11.9%
Total Residential 193,224 101,546 208,705,637 100.0% 100.0% 100.0%
9
Purpose-built rental multifamily floor area and unit counts are both partial estimates. As 75% of the multifamily rental
buildings in the BC Assessment dataset have no listed floor area, floor area was estimated based on the number of units.
Conversely, as 40% of the buildings with a listed gross floor area had no unit counts, unit counts for those properties were
estimated based on the floor area. Both sets of estimates used the ENERGY STAR assumption of 1.2 units per 1,000 ft2. An
additional 272 multifamily properties had neither floor area nor unit counts; these buildings were excluded from the sample
entirely.
16Figure 5: Number of homes in the capital region by decade built and jurisdiction (Victoria Rural here refers to the
unincorporated Juan de Fuca Electoral Area)
17Figure 6: Total floor area of homes in the capital region by decade and jurisdiction (Note: Victoria Rural here refers to
the unincorporated Juan de Fuca Electoral Area)
18Victoria
Saanich
Langford
Sidney
Esquimalt
Colwood
View Royal
Central Saanich
Sooke
Oak Bay
Juan de Fuca
Gulf Islands
North Saanich
Figure 7: Breakdown of strata-owned MURB (outer ring) and purpose-built rental MURB (inner ring) floor area by
jurisdiction
16,000,000
Total Gross Floor Area, square feet
14,000,000
12,000,000
10,000,000
8,000,000
6,000,000
4,000,000
2,000,000
-
Decade Built
Purpose-Built Rental Multifamily Residential Buildings (MURB)
Strata Condominium Multifamily Residential Buildings (MURB)
Figure 8: Distribution of Strata and Purpose-Built Rental MURB floor area by decade built in the capital region.Survey data of 10,000 homes in the capital region was also used to assess heating fuel type
distribution. This data shows that natural gas use is also increasing across the capital region, as the
rate of gas hookups has gone up five-fold over the last decade (see Table 2and Figure 9). This is an
issue of particular concern for a residential retrofit program, as natural gas represents an emissions-
intense source of energy.
Table 2: Primary heating fuel breakdown among single family homes in each jurisdiction (Note: some rows do not add
up to 100% due to rounding)
Jurisdiction Electric Gas Oil Propane Wood
Colwood 39% 42% 6% 3% 9%
Central Saanich 42% 36% 5% 6% 12%
Esquimalt 41% 35% 10% 2% 11%
Gulf Islands 38% 1% 2% 12% 46%
Highlands 44% 24% 2% 11% 19%
Langford 58% 33% 3% 2% 4%
Metchosin 27% 12% 17% 11% 33%
North Saanich 58% 16% 5% 12% 9%
Sidney 42% 46% 3% 2% 7%
Oak Bay 34% 46% 12% 1% 7%
Saanich 42% 34% 12% 3% 10%
Sooke 45% 28% 2% 10% 16%
Victoria 42% 41% 8% 2% 7%
View Royal 46% 44% 2% 3% 4%
Figure 9: New natural gas connections in the capital region, 2010-2018
202.4. Emissions Reduction Potential Across the Capital Region
Part 9
To model the potential emissions savings from a residential retrofit program, a number of steps
were taken. First, home age and the heating fuel survey results were used to assign an assumed
heating fuel to each home in region's BC Assessment dataset. Each home was then assigned a pre-
and post-retrofit energy use and emissions profile, based on the home's size, age, and assumed
heating type, which resulted in 890 possible combinations of heating fuel type, decade built, and
jurisdiction. Using EnerGuide data, a pre- and post-retrofit energy use intensity (EUI) and
greenhouse gas emissions intensity (GHGI) was calculated for each of the combinations of decade
built and primary pre-retrofit heating fuel. Average post-retrofit EUI and GHGI values were also
calculated for homes that switched from any heating fuel to electricity. These two sets of EnerGuide-
derived EUI and GHGI values were then mapped to homes in the region.
This process allowed for an estimate the pre-retrofit emissions for all homes in the capital region, by
jurisdiction, and estimate hypothetical post-retrofit emissions if all homes were to be retrofitted.
Estimated pre-retrofit emissions cannot be directly compared to the CRD GHG inventory, due to
inconsistencies in the assignment of energy use to sectors of the building stock and the specific
emission factors. However, calculated emissions roughly align with the current CRD inventory for
residential emissions, which validates the overall approach. Post-retrofit estimates were calculated
for two scenarios. Under the “standard” scenario, all homes receive retrofits that achieve the
average savings for homes of their age and heating type (with 25% switching to lower emissions
heating fuels, in line with historical rates). Under the second scenario, all homes are assumed to
switch to high-efficiency electric heating (i.e., heat pump); see Table 3. 10
Table 3: Potential GHG savings, assuming all Part 9 homes in the capital region are retrofitted
Savings Average % GHG
Estimate GHG Savings in Savings as %
Total GHG
Single Family Scenario (tCO2e) vs Savings Single of CRD 2018
(tCO2e)
Calculated per home Family Emissions
Baseline Sector
Baseline Calculated Emissions 375,918
Scenario 1: Post-retrofit with
248,932 126,986 1.35 34% 7%
standard approach
Scenario 2: Post-retrofit with
131,498 244,420 2.60 65% 15%
electric heat pump fuel switch
The variation across jurisdictions as shown in Figure 9 and Figure 10 below is due to the differences
in the age of homes, the predominant heating fuels, and the number of homes. Most jurisdictions
10
As these calculations use the latest 2021 BC Hydro emissions factor of 40.1 tCO2e/GWh, the comparison with the CRD’s
2018 emissions inventory (see Figure 1) is not exact, but gives a general sense of the scale of the potential impact.
21will see emissions reductions in the single-family sector of between 30% and 40% in the standard
retrofit scenario, and 55% and 70% in the electrification fuel switch scenario. Langford and Sooke
are outliers due to the age of their housing stock; new homes see lower emissions savings, and in
both jurisdictions, the majority of homes were built in the last 30 years. The unincorporated areas of
Juan de Fuca and the Gulf Islands also have lower savings, as a higher proportion of the existing
homes in those areas already use a biomass fuel and so see lower emissions savings from retrofits.
0% 10% 20% 30% 40% 50% 60% 70% 80% 90% 100%
Central Saanich 34%
64%
Colwood 32%
65%
Esquimalt 36%
69%
Gulf Islands 28%
43%
Highlands 28%
55%
Juan de Fuca 28%
42%
Langford 19%
52%
Metchosin 43%
66%
North Saanich 33%
59%
Oak Bay 37%
75%
Saanich 38%
68%
Sidney 30%
64%
Sooke 25%
56%
Victoria 35%
71%
View Royal 28%
61%
Grand Total 34%
65%
% Emissions Savings, Part 9 Standard Retrofit % Emissions Savings, Part 9 Fuel Switch Retrofit
Figure 10: GHG savings potential in Part 9 homes by jurisdiction, percentage
22Annual emissions savings with all homes retrofitted, tCO2e
- 50,000 100,000 150,000 200,000 250,000 300,000
Central Saanich 5,664
10,778
Colwood 5,691
11,518
Esquimalt 4,832
9,182
Gulf Islands 5,299
8,236
Highlands 699
1,350
Juan de Fuca 1,056
1,586
Langford 5,543
14,920
Metchosin 2,220
3,466
North Saanich 4,635
8,348
Oak Bay 11,820
23,868
Saanich 49,360
88,421
Sidney 3,650
7,761
Sooke 3,265
7,449
Victoria 20,724
41,941
View Royal 2,528
5,596
Grand Total 126,986
244,420
Sum of Emissions Savings (by home), Standard Retrofit Sum of Emissions savings by home, fuel switch
Figure 11: Emissions savings potential in Part 9 homes by jurisdiction, annual avoided tco2e
23Part 3
To model the potential emissions savings from a program targeting Part 3 strata and purpose-built
rental homes, data from the Climate Action Secretariat and NRCAN’s Comprehensive Energy Use
Database (CEUD) was used to estimate the division of the multifamily housing stock in the capital
region. These estimates were created using five scenarios of space heating energy source and
domestic hot water energy source (see Figure 12), each of which have different associated baseline
EUIs and GHGIs. Due to lack of localized survey data on heating fuels or achieved emissions
reductions for Part 3 MURB in the capital region, Part 3 GHG estimates are higher level than Part 9
estimates described above.
3.6%
Natural Gas Space Heating +
11.9% Natural Gas DHW
Natural Gas Space Heating +
Electric Resistance DHW
42.2%
Electric Resistance Space
Heating + Natural Gas DHW
23.5%
Electric Resistance Space
Heating + Electric Resistance
DHW
Heat Pump Space Heating +
Electric DHW
18.8%
Figure 12: MURB heating sources in British Columbia Climate Zone 4A
EUI, total energy use, and total GHG emissions were then calculated for the estimated MURB floor
area for each heating configuration and jurisdiction. GHG savings for the five tiers of MURB retrofits
(which also differ by heating configuration) were then calculated and totaled, as shown in Table 4.
Of these five tiers, the Tier 2 “Standard Retrofit” is the closest MURB approximation of the EnerGuide
“standard retrofit” shown above, while the Tier 4 fuel switch retrofit is a heat pump-based fuel
switch and electrification retrofit. Overall, the potential savings represent approximately one quarter
of the estimated savings from the single-family home sector, but remain significant. Savings are
broken out between rental and strata buildings; however, as there is insufficient data on the
differences in heating types between rental and strata-owned MURB, this is based solely on floor
area. As heating sources may vary between strata and rental buildings; the relative savings may also
be different. Figure 13 shows the distribution of savings by jurisdiction, which primarily reflects the
distribution of MURB floor area across the capital region.
24Table 4: Estimated potential energy and GHG savings for Part 3 residential buildings
Total GHG Savings Savings Savings
Estimates Estimate Estimate Estimate % GHG Savings as %
Scenario for Part 3 (tCO2e) for (tCO2e) for (tCO2e) for Savings in of CRD 2018
MURB Part 3 Strata Rental Multifamily Emissions 11
(tCO2e) MURB MURB MURB Sector
Baseline Calculated
Emissions 103,740
Tier 0:
93,366 10,374 10% 0.6%
Retrocomissioning 6,523 3,851
Tier 1: Basic
Renewal 87,325 16,415 16% 1.0%
10,321 6,094
Tier 2: Standard
Retrofit 72,888 30,852 30% 1.8%
19,398 11,454
Tier 3:
“Comprehensive” 53,505 50,235 48% 3.0%
Retrofit 31,585 18,650
Tier 4: Fuel Switch
Retrofit 32,360 71,380 69% 4.2%
44,880 26,500
11
Calculated emissions use the latest 2021 GHGI figures for BC Hydro, which diverges from the assumptions used in the 2018
CRD GHG Inventory, Therefore, the comparison of estimated savings to the region-wide inventory is provided to give a sense
of relative scale but does not represent an apples-to-apples comparison.
25Annual Emissions Savings Potential, tCO2e
- 10,000 20,000 30,000 40,000 50,000 60,000 70,000 80,000
293
464
Central Saanich 871
1,419
2,016
368
582
Colwood 1,094
1,782
2,532
716
1,134
Esquimalt 2,130
3,469
4,929
656
1,038
Langford 1,951
3,176
4,513
290
459
Oak Bay 862
1,404
1,994
2,111
3,341
Saanich 6,279
10,224
14,527
499
789
Sidney 1,483
2,414
3,430
165
262
Sooke 492
801
1,138
4,713
7,458
Victoria 14,016
22,822
32,429
103
163
Juan de Fuca 306
499
709
319
505
View Royal 949
1,546
2,197
10,374
16,415
Grand Total 30,852
50,235
71,380
Tier 0 Tier 1 Tier 2 Tier 3 Tier 4
Figure 13: Emissions savings potential at varying Retrofit Tiers in Part 3 MURB by jurisdiction, annual avoided tCO2e
(Note: jurisdictions accounting for less than 1% of total potential emissions savings are not shown).
262.5. Key Takeaways
The analysis above reveals a number of key points of relevance to a potential energy retrofit
program in the capital region:
• Overall, there is a large untapped potential for energy retrofits to help reduce emissions
from existing homes in the capital region and support the achievement of the CRD’s climate
targets. Retrofitting every home in the region could achieve a 7% to 15% reduction in region
wide GHG emissions relative to current levels, a significant contribution to its goal of
reducing emissions by 61% by 2038. The upper end of this range can be captured by
ensuring that most retrofits involve electrification (i.e., a switch to a heat pump).
• Part 9 homes represent the most significant opportunity for emissions reductions, while Part
3 residential dwellings make up a much smaller proportion of total homes in the region.
• There is significant emissions reduction potential from fuel switching from high emitting
heating sources such as oil, natural gas, and propane towards electric heating.
• Older construction homes and homes using fuel oil are best to target for a residential
retrofit program, as they have the highest average GHG emissions and the highest emission
reduction potential. However, given the increasing growth of natural gas, retrofitting homes
from natural gas to electricity will also be an important program focus.
Targeting homes that are 15 to 25 years old and using natural gas or another fossil fuel are a
potential program target, as they will be coming up on their first heating system replacement and
will have sufficient insulation to make a switch to a heat pump more cost-effective (in general,
residential heating systems have a lifespan of 15 years, though many are used beyond that lifespan).
273. THE EXISTING PROGRAM LANDSCAPE
Prior to developing its own program, it is important for the CRD to explore the existing program
landscape to ensure complementarity and avoid duplication or potentially confusing the market.
Several programs are already on offer in the Canadian and BC context that have begun to address
some of the barriers associated with deep emissions retrofits in the residential sector. However,
many still remain, leaving a need and an opportunity for the CRD to go further in supporting
homeowners in completing retrofit projects. The success of a residential retrofit program for the
CRD will be contingent on its ability to leverage and fit into this existing program landscape, and fill
any remaining gaps, while staying within its legal authority and an acceptable budget. The key
programs that are either currently offered or have been signalled as forthcoming are summarized
briefly below.
3.1. Utility Programs
Part 9
The province's two main utilities, FortisBC and BC Hydro, offer a number of incentives and rebates
that support homeowners in reducing the costs of home energy upgrades. Rebates ranging from
$100 to $2000 are currently offered for the following upgrades:
o Electrical heating systems to heat o Window and door upgrades
pumps o Insulation upgrades
o Furnace upgrades o Secondary space heating
o Water heater upgrades to high o Appliances
efficiency natural gas heaters
Many capital region municipalities also offer top-ups for specific rebate programs, ranging from
$350 to $2000. However, it should be noted that a number of these top-ups are currently fully
subscribed and are therefore no longer available (e.g., District of Central Saanich, District of North
Saanich, Township of Esquimalt, CRD).
Part 3
Utility incentives are also available for improving the performance of multi-unit residential buildings
(Part 3). Rebates range from $1,000 - $45,000, and are currently offered for:
• Natural gas furnace and boiler • Window and door upgrades
upgrades • Insulation upgrades
• Water heater upgrades to high- • Secondary space heating
efficiency natural gas heaters • Lighting upgrades
• HVAC controls • Appliances
While many incentives exist for broad upgrade measures that improve the overall efficiency of both
Part 9 and Part 3 homes, those that encourage natural gas upgrades are currently incentivizing
more emission-intensive choices, making it more challenging for homeowners to make lower-carbon
choices.
283.2. CleanBC Better Homes and Buildings
Part 9
CleanBC Better Homes is an online platform funded by the Province of BC and the Government of
Canada. The platform provides online resources and support for homeowners and businesses
interested in reducing energy use and greenhouse gas emissions from new and existing buildings.
CleanBC sponsors a number of rebates, ranging from $100-$3000. This includes the CleanBC Heat
Pump Group Purchase Rebate (GPR). The GPR rewards groups of homeowners who join together and
complete a fuel switch upgrade to an electric air source heat pump. The larger the group, the higher
the rebate, ranging from $200 per participant (2-4 homes) to $500 per participant (20-30 homes).
Another notable aspect of the program is the offer of free energy coaching services, provided by
trained energy efficiency specialists via email or phone. This service is available at all stages of an
energy improvement project. Energy coaches provide information and advice on energy efficiency
upgrades and rebates, with translated services are also available in Cantonese, Mandarin, Punjabi
and Farsi. It should be noted, however, that this service is “fuel neutral”, in that upgrades and
rebates for fossil fuel equipment (e.g., natural gas boilers) are available and may be recommended.
In addition to the energy coaching service, the following are also available via the Better Homes
program:
• Educational materials on types of energy efficiency upgrades available and the
interaction of upgrades with the 'House As a System' approach
• Details of the EnerGuide Home Evaluation process, benefits and eligibility
• Energy advisor search tool filtered by upgrade type and area
• Information on the CleanBC Better Homes and Home Renovation Rebate Program
• User-friendly rebate search tool
• Explanation of program requirements and sample contractor invoices
• Help finding a suitable contractor through the Program Registered Contractors list. The
database allows the homeowner to filter contractors by location and type of upgrade
• Online application tool to help homeowners and businesses apply for rebates
The Province of BC is also currently considering an income-qualified home retrofit program intended
to provide high-value incentives to low- and moderate-income households for a range of space
heating, building envelope, ventilation and health and safety measures. While qualification criteria
are currently under development, the projected value of retrofits are expected to cover up to 80-
90% of costs for low-income households, and 70-80% of costs for moderate-income households. The
program is expected to launch in late summer or early fall 2021, and will offer support services tied
to the receipt of specific rebates, providing significant cost reduction opportunities for homeowners
across the board. The focus of this program on either energy efficiency and/or emissions reductions
(and therefore on fuel switching) is currently unknown.
Part 3
CleanBC provides three custom programs focused on electrification of larger residential and
commercial buildings. The Custom, Custom-Lite, and Commercial Express programs allocate incentives
based on carbon savings, and the CleanBC Small Building Energy Coach program provides support
for smaller buildings in accessing these incentives.
29• The Custom Program supports up to 50% of an energy study's cost, up to a maximum of
$20,000. based on a rate of $40/tCO2e of lifetime greenhouse gas savings, BC Hydro will
support up to $200,000 per customer. For heat pump rooftop units, the Program offers a
rate of $60/tCO2e.
• The Custom Lite Program provides $60/tCO2e of lifetime GHG savings for heat pump
rooftop units up to a maximum of $72,000 and $40/tCO2e of lifetime GHG savings for all
other qualifying measures up to maximum $48,000 incentive per customer.
• The Commercial Express Program offers capital incentives up to a maximum of $100,000 per
project. Incentives are based on various factors specific to your building, including building:
type, age, location, square footage, hours of operation, and the type of equipment being
considered.
• The CleanBC Small Building Energy Coach program currently offers free energy coaching
services to assist building owners and operators reduce GHGs through fuel-switching and
other electrification measures and take advantage of CleanBC’s Commercial Express and
Custom Lite programs.
3.3. Natural Resources Canada
Part 9
The Canadian federal government committed to supporting home and building retrofits in the Pan-
Canadian Framework on Clean Growth and Climate Change, which outlined the following
commitments:
• Developing a model code for existing buildings by 2022 to be adopted by the provinces and
territories
• Requiring benchmarking and labelling of building energy use
• Setting new standards for heating equipment and other key technologies to the highest level
of efficiency that is economically and technically achievable, and
• Supporting the continuation and expansion of provincial and territorial efforts to retrofit
existing buildings
Since then, the federal government has committed to supporting homeowners in retrofitting their
homes via an allocation of $2.6 billion to Natural Resources Canada to supply:
• Canada Greener Homes Grant
o Up to $5,000 per home in energy efficiency grants
o $1 million for free EnerGuide assessments ($600 per home)
• Up to $40,000 in interest-free loans, and
• $10 million for EnerGuide Energy Advisor training
Part 3
The Federal Government has committed to investing $2 billion in low-interest financing for energy
efficient buildings through the Canada Infrastructure Bank (CIB) Building Retrofit Initiative. The
initiative provides funding for large projects with a minimum requirement of $25 million. Two types
of project applicants are eligible:
301. Building owners may apply for financing to retrofit one or more of their buildings
2. Third-party retrofit aggregators, including:
• Existing Energy Service Companies (ESCO) that form a dedicated Special Purpose Vehicle
(SPV) to originate and develop retrofit projects
• Super ESCO models that are SPVs functioning as an intermediary between building
owners and multiple ESCO providers
• New entrants to the energy services market that are working on buildings or investing in
retrofit projects
• Commercial PACE (C-PACE) program administrators
3.4. Bring It Home for the Climate
The Bring It Home 4 the Climate program (BIH4C) program is designed to support and engage
homeowners in the capital region by addressing barriers to retrofit uptake. The program forms a
component of the Transition 2050 Residential Retrofit Acceleration project developed by the CRD and
City Green Solutions.
To encourage progress towards deep energy and emission retrofits, the program subsidizes
EnerGuide energy assessments and provides free materials for shallow retrofits. BIH4C focuses on
building community champions and rewarding those who participate to raise awareness and
motivate others in the community to explore energy efficiency upgrades. The program includes the
offering of a free Virtual Home Energy Check Up (VHEC), which involves an online survey followed by
a video call with an energy expert to explore next steps. The BIH4C administrative team is also
available to support participants in registering for a subsidized Pre-Upgrade EnerGuide Home
Evaluation. A unique element of the program is the seasoned EnerGuide evaluators who operate as
program “Energy Experts” available to support homeowners on a wide range of topics related to the
retrofit process including accessing rebates. Advice is additionally geared towards supporting low-
carbon retrofits, in light of the program’s focus on climate change and emissions reductions The
BIH4C program is funded to the end of 2021.
3.5. SEA Change – Strata Energy Advisor Program
The Strata Energy Advisor pilot program was launched in May 2018 in Metro Vancouver to address
the unique barriers strata councils face in retrofitting common space. The program provided strata
councils, property managers and strata members free assessments and advice on measures to
reduce energy and carbon. Through the initial pilot, 38 buildings completed retrofits resulting in
2,265 tonnes of GHG reductions. Metro Vancouver and UBC are currently exploring opportunities to
expand the program provincially.
3.6. Federation of Canadian Municipalities (FCM)
The Federation of Canadian Municipalities (FCM) supports local governments in implementing
sustainability practices through the Green Municipal Fund. This program provides funding streams,
resources and training to help municipalities deliver their sustainability initiatives. CRD's Residential
Energy Retrofit Program Business Case study is supported by FCM's Community Efficiency Financing
31You can also read