2019 forecasting and planning scenarios, inputs, and assumptions - Aemo
←
→
Page content transcription
If your browser does not render page correctly, please read the page content below

2019
forecasting
and planning
scenarios,
inputs, and
assumptions
August 2019

For use in the 2019-20 Integrated System Plan, 2019 Electricity Statement of Opportunities
for the National Electricity Market, and 2020 Gas Statement of Opportunities for eastern
and south-eastern Australia
Important notice

PURPOSE
The publication of this Report concludes AEMO’s consultation on AEMO’s planning and forecasting inputs,
scenarios and assumptions for use in its 2019-20 publications for the National Electricity Market (NEM). This
report outlines the scenarios to be used by AEMO in 2019-20 publications, informing the Integrated System
Plan (ISP) and Electricity Statement of Opportunities (ESOO).
This publication has been prepared by AEMO using information available at 1 July 2019. Information made
available after this date may have been included in this publication where practical.

DISCLAIMER
This document or the information in it may be subsequently updated or amended.
AEMO has made every effort to ensure the quality of the information in this document but cannot guarantee
its accuracy or completeness.
Anyone proposing to use the information in this document should independently verify and check its
accuracy, completeness and suitability for purpose, and obtain independent and specific advice from
appropriate experts.
Accordingly, to the maximum extent permitted by law, AEMO and its officers, employees and consultants
involved in the preparation of this document:
• make no representation or warranty, express or implied, as to the currency, accuracy, reliability or
  completeness of the information in this document; and
• are not liable (whether by reason of negligence or otherwise) for any statements or representations in this
  document, or any omissions from it, or for any use or reliance on the information in it.

VERSION CONTROL

Version        Release date             Changes

1              16/08/2019               Initial release

© 2019 Australian Energy Market Operator Limited. The material in this publication may be used in
accordance with the copyright permissions on AEMO’s website.
Executive summary

AEMO delivers a range of planning and forecasting publications for the National Electricity Market (NEM),
including the NEM Electricity Statement of Opportunities (ESOO), the Gas Statement of Opportunities (GSOO)
and the Integrated System Plan (ISP)1. This report contains descriptions of the 2019-20 scenarios, inputs, and
assumptions which will be used in AEMO’s 2019-20 NEM Planning and Forecasting publications.

2019 NEM Planning and Forecasting consultation
AEMO published the 2019 Planning and Forecasting Consultation Paper for stakeholder consultation on
5 February 2019. AEMO received 25 submissions from industry, academia, individuals, and small business,
which provided feedback on the key modelling inputs and assumptions, the proposed scenarios for 2019, and
the consultation process itself. AEMO received additional feedback from stakeholders at Planning and
Forecasting workshops and forums.
AEMO has considered this feedback in determining the scenarios, inputs, and assumptions. This report
describes the scenario narratives and key input parameters driving each scenario. A separate report provides
AEMO’s response to stakeholder feedback2 and explains how AEMO has taken this feedback into account.

2019-20 scenarios
The use of scenario planning is an effective practice to manage investment and business risks when planning
in a highly uncertain environment, particularly through disruptive transitions. Scenarios are a critical aspect of
forecasting, providing the information needed to assess future risks, opportunities, and development needs in
the energy industry. It is vital that the dimensions of scenarios chosen cover the potential breadth of plausible
futures impacting the energy sector and capture the key uncertainties and material drivers of these possible
futures in an internally consistent way.
For forecasting and planning purposes, five scenarios have been developed that provide a suitably wide
range of possible industry outcomes differing with respect to the growth in grid-scale renewable generation
resources, the uptake of distributed energy resources, and the level and breadth of decarbonisation policies
(see Figure 1):
• The Central scenario reflects the current transition of the energy industry under current policy
  settings and technology trajectories, where the transition from fossil fuels to renewable generation is
  generally led by market forces and supported by current federal and state government policies3.
• The Slow Change scenario reflects a general slow-down of the energy transition. It is characterised by
  slower advancements in technology and reductions in technology costs, low population growth, and low
  political, commercial, and consumer motivation to make the upfront investments required for significant
  emissions reduction.

1
    For National Electricity Rules purposes, the ISP will largely incorporate the information required to be contained in the National Transmission Network
     Development Plan (NTNDP). This consultation incorporates the formal requirements for consultation on NTNDP inputs, material issues, and other
     matters specified in the rules prior to the development of an NTNDP.
2
    AEMO, 2019 Planning and Forecasting Consultation responses on Scenarios, Inputs, Assumptions and Methodology, available at
     https://www.aemo.com.au/-/media/Files/Electricity/NEM/Planning_and_Forecasting/Inputs-Assumptions-Methodologies/2019/2019-Planning-and-
     Forecasting-Consultation-Responses.pdf.
3
    Includes existing Federal emissions reduction policy to reduce Australia’s emissions by 26% by 2030 economy wide, state renewable energy targets,
     pumped hydro initiatives (Snowy 2.0 and Battery of the Nation), and various policies affecting the scale and timing of energy efficiency adoption and
     distributed energy resources (DER) penetration. Section 2.3 provides more detail.

© AEMO 2019 | 2019 forecasting and planning scenarios, inputs, and assumptions                                                                                3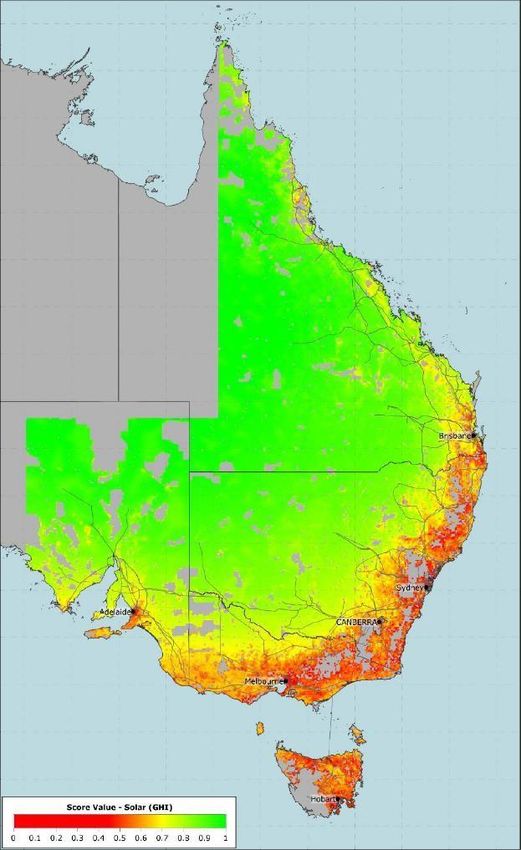
• The High DER scenario reflects a more rapid consumer-led transformation of the energy sector, relative
  to the Central scenario. It represents a highly digital world where technology companies increase the pace
  of innovation in easy-to-use, highly interactive, engaging technologies. This scenario includes reduced
  costs and increased adoption of distributed energy resources (DER), with automation becoming
  commonplace, enabling consumers to actively control and manage their energy costs while existing
  generators experience an accelerated exit. It is also characterised by widespread electrification of the
  transport sector.
• The Fast Change scenario reflects a rapid technology-led transition, particularly at grid scale, where
  advancements in large-scale technology improvements and targeted policy support reduce the economic
  barriers of the energy transition. This includes coordinated national and international action towards
  achieving emissions reductions, leading to manufacturing advancements, automation, accelerated exit of
  existing generators, and integration of transport into the energy sector.
• The Step Change scenario reflects strong action on climate change that leads to a step change
  reduction of greenhouse gas emissions. In this scenario, aggressive global decarbonisation leads to faster
  technological improvements, accelerated exit of existing generators, greater electrification of the
  transport sector with increased infrastructure developments, energy digitalisation, and consumer-led
  innovation.

Figure 1         Scenarios determined for use in AEMO’s 2019-20 forecasting and planning publications

The scenarios inform and support the realisation of economically efficient solutions to support the energy
system in transition. They inform risks and enable prudent decisions to be made that take risks into account,
enabling developments that adapt to differences in the pace or nature of change. The ISP uses scenarios to
develop a whole-of-system plan that manages the ultimate cost and risk of this transition in the long-term
interests of customers.4
AEMO will use these scenarios to assess potential development paths using a form of least regrets
methodology, designed to accommodate uncertainty by examining the consequences of each development
path under each scenario. Additional sensitivities may complement the scenarios, to identify the magnitude of
impact of key assumptions and test specific decisions that may be taken in the near future.

4
    The ISP identifies the optimal development path for the power system based on an engineering and economic assessment of infrastructure and resource
    costs. It assumes that the market is designed to deliver efficient outcomes.

© AEMO 2019 | 2019 forecasting and planning scenarios, inputs, and assumptions                                                                            4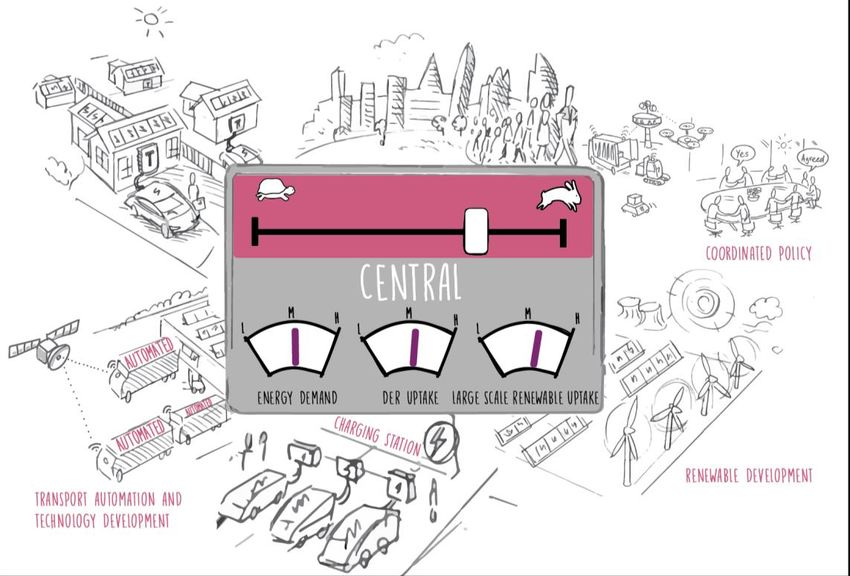
2019-20 inputs and assumptions
This report describes key inputs and assumptions in relation to:
• Components for forecasting energy consumption.
• Policy settings affecting energy supplies.
• Technical and economical settings affecting energy supply.
• Existing generation assumptions.
• Uptake scenarios of DER.
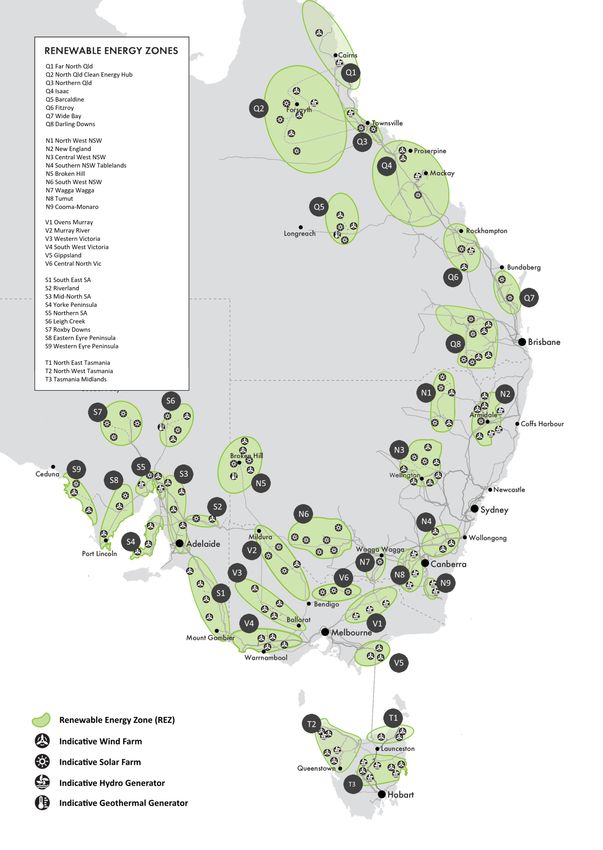
• Renewable energy zones (REZs).
• Interconnector augmentation options.
• Non-network technologies.
• System security constraints.
• Network losses and Marginal Loss Factor (MLF) modelling.
• Gas modelling.
Further information on inputs and assumptions to be used in AEMO’s 2019-20 planning and forecasting
publications can be found in AEMO’s 2019 Inputs and Assumptions Workbook 5. Methodologies for demand
forecasting, market modelling, assessing system strength, and inertia requirements are contained in
supplementary materials on AEMO’s Inputs and Assumptions web page 6.
5
The 2019 AEMO Inputs and Assumptions Workbook provides detail of all modelling inputs affecting supply and demand of electricity in the NEM. It is at
https://www.aemo.com.au/-/media/Files/Electricity/NEM/Planning_and_Forecasting/Inputs-Assumptions-Methodologies/2019/2019-Input-and-
Assumptions-workbook.xlsx.
6
AEMO’s inputs, assumptions, and methodologies for planning and forecasting activities are available at https://www.aemo.com.au/Electricity/National-
Electricity-Market-NEM/Planning-and-forecasting/Inputs-Assumptions-and-Methodologies.
© AEMO 2019 | 2019 forecasting and planning scenarios, inputs, and assumptions 5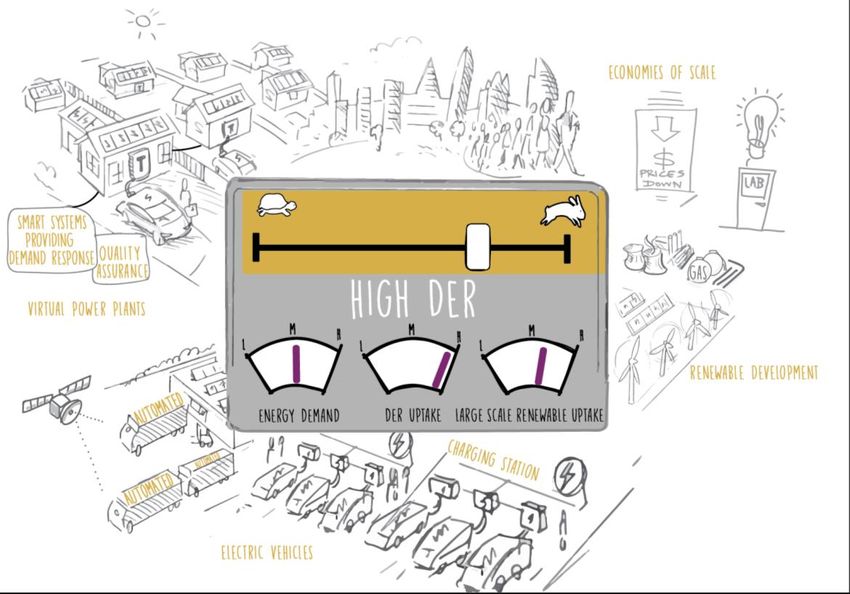
Contents
Executive summary                                                                3

1.         Introduction                                                          8
           Consultation process                                                   9
           Supplementary material                                                 9

2.         Scenarios                                                             11
           Scenario overview                                                     11
           Scenario narratives                                                   12
           Key scenario parameters                                               19
           Sensitivity analysis                                                  22

3.         Inputs and assumptions                                                23
           Key components for forecasting energy consumption                     23
           Key policy settings                                                   30
           Key technical and economic settings affecting energy supply           34
           Existing generator assumptions                                        42
           Renewable energy zones                                                46
           Network considerations                                                53
           Gas modelling assumptions                                             56

4.         Inertia and system strength requirements methodologies                58

5.         Applying the scenarios in decision-making                             59

Tables
Table 1      Additional information and data sources                              9
Table 2      2019 scenario policy settings                                       19
Table 3      2019-20 scenario dimensions                                         20
Table 4      Identified 2019-20 ISP sensitivities                                22
Table 5      Candidate generation technology options                             35
Table 6      NEM locational cost factors                                         38
Table 7      Regional build costs of pumped hydro for different storage sizes    41

© AEMO 2019 | 2019 forecasting and planning scenarios, inputs, and assumptions    6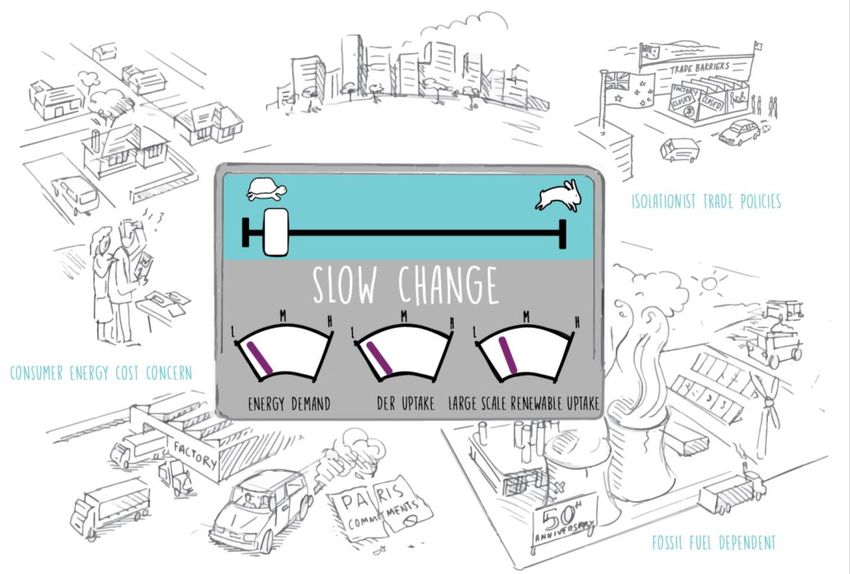
Figures
Figure 1 Scenarios determined for use in AEMO’s 2019-20 forecasting and planning publications 4
Figure 2 Consultation milestones 9
Figure 3 Scenarios determined for examination in the 2019-20 Integrated System Plan 11
Figure 4 Central scenario narrative 12
Figure 5 Slow Change scenario narrative 14
Figure 6 High DER narrative 15
Figure 7 Fast Change narrative 16
Figure 8 Step Change narrative 18
Figure 9 Forecast effective capacity of rooftop PV installations (MW) 24
Figure 10 Forecast effective capacity of installed consumer battery capacity (megawatt hours [MWh]) 25
Figure 11 Forecast electricity consumption from electric vehicles (MWh) 25
Figure 12 Coordinated battery capacity in terms of operating as VPPs 26
Figure 13 Forecast economic growth in Gross State Product of NEM regions 27
Figure 14 Forecast energy savings from energy efficiency measures impacting business and
residential sectors 28
Figure 15 Cumulative NEM electricity sector emissions to 2050 that will be input as carbon budgets 31
Figure 16 Climate pathways modelled across ISP scenarios 32
Figure 17 Build cost projection for selected technologies for 4-degrees scenario ($/kW) 36
Figure 18 Generation technology costs across the scenarios 37
Figure 19 Locational cost map 39
Figure 20 Regional gas prices to apply in the Central scenario for new entrant CCGT plant 44
Figure 21 Regional coal prices to apply in the Central scenario 45
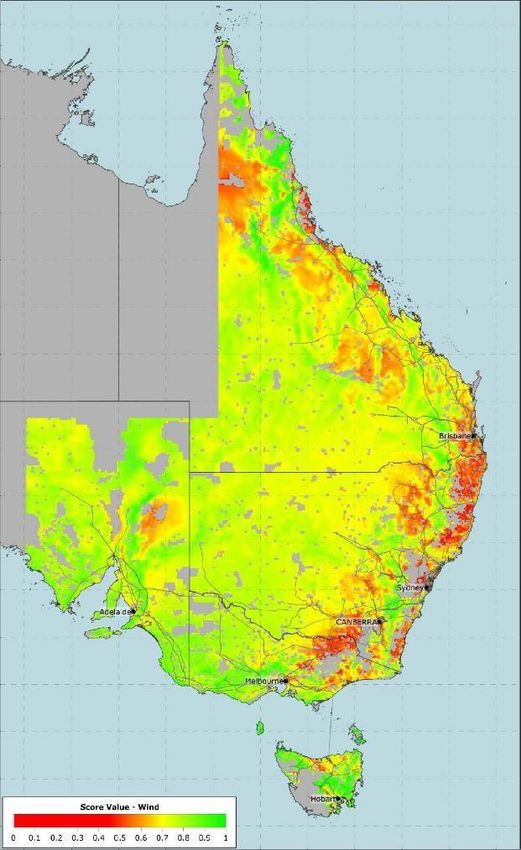
Figure 22 REZ candidates for 2019-20 ISP 48
Figure 23 Weighted wind (left) and solar (right) resource heat map 49
Figure 24 Division of REZ costs 50
Figure 25 Loop flow resulting from South Australia to New South Wales connection 55
Figure 26 Region boundary before (left) and after (right) possible boundary shift 56
© AEMO 2019 | 2019 forecasting and planning scenarios, inputs, and assumptions 7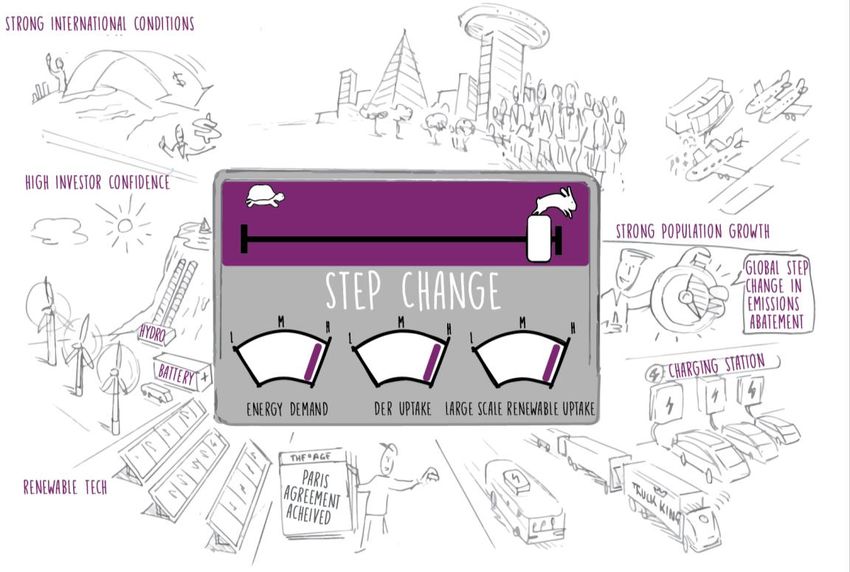
1. Introduction
AEMO produces several publications that inform the decision support function for stakeholders, and are
coordinated and integrated in AEMO’s modelling to provide its forecasting and planning advice:
• Electricity Statement of Opportunities (ESOO): The ESOO provides technical and market data that
  informs the decision-making processes of market participants, new investors, and jurisdictional bodies as
  they assess opportunities in the National Electricity Market (NEM) over a 10-year outlook period.
• Gas Statement of Opportunities (GSOO): The GSOO provides AEMO’s forecast of annual gas
  consumption and maximum gas demand, and reports on the adequacy of eastern and south-eastern
  Australian gas markets to supply forecast demand over a 20-year outlook period.
• Integrated System Plan (ISP): The ISP is a whole-of-system plan that provides an integrated roadmap for
  the efficient development of the NEM over the next 20 years and beyond. Its primary objective is to
  maximise value to end consumers by designing the lowest cost secure and reliable energy system capable
  of meeting any emissions trajectory determined by policy-makers at an acceptable level of risk7. It fully
  utilises the opportunities provided from existing technologies and anticipated innovations in distributed
  energy resources (DER), large-scale generation, networks, and coupled sectors such as gas and transport.
Many uncertainties face the energy sector:
• The role of consumers in the energy market is evolving as DER, new technological innovations, and
  customer behaviours change.
• Other industries, such as the transportation industry, are increasingly electrifying their energy supplies and
  are thus having a direct impact on the energy sector.
• Existing supply sources, particularly thermal generators, are ageing and approaching the end of their
  technical lives. These resources must be replaced while a reliable and secure power system is maintained
  that meets consumer demand at an affordable cost as well as public policy requirements.
AEMO uses a scenario analysis approach to investigate the direction and magnitude of shifts impacting the
energy sector, and the economically efficient level of infrastructure necessary to support the future energy
needs of consumers. This report outlines the scenarios to be modelled by AEMO across its planning and
forecasting publications, to best inform future investment or divestment decisions. It also describes key inputs
and assumptions to be used in AEMO’s modelling. It is complemented by AEMO’s:
• 2019 Inputs and Assumptions Workbook8.
• 2019 Planning and Forecasting Consultation Responses on scenarios, inputs, assumptions and
  methodology report (2019 Consultation Responses Report) 9.
• 2019 Market Modelling Methodology Paper10.
• 2018 Demand Forecasting Methodology Information Paper 11.

7
     The ISP identifies the optimal development path for the power system based on an engineering and economic assessment of infrastructure and resource
      costs. It assumes that the market is designed to deliver efficient outcomes.
8
     The 2019 AEMO Inputs and Assumptions Workbook provides detail of all modelling inputs affecting supply and demand of electricity in the NEM. It is at
      https://www.aemo.com.au/-/media/Files/Electricity/NEM/Planning_and_Forecasting/Inputs-Assumptions-Methodologies/2019/2019-Input-and-
      Assumptions-workbook.xlsx.
9
     The 2019 Planning and Forecasting Consultation responses are detailed in the following report: https://www.aemo.com.au/-/media/Files/Electricity/NEM/
      Planning_and_Forecasting/Inputs-Assumptions-Methodologies/2019/2019-Planning-and-Forecasting-Consultation-Responses.pdf.
10
     AEMO, Market Modelling Methodology Paper, at https://www.aemo.com.au/-/media/Files/Electricity/NEM/Planning_and_Forecasting/Inputs-Assumptions-
     Methodologies/2019/Market-Modelling-Methodology-Paper.pdf.
11
     AEMO, Demand Forecasting Methodology Information Paper, at https://www.aemo.com.au/-/media/Files/Electricity/NEM/Planning_and_Forecasting/
     NEM_ESOO/2018/Electricity-Demand-Forecasting-Methodology-Information-Paper.pdf.

© AEMO 2019 | 2019 forecasting and planning scenarios, inputs, and assumptions                                                                               8
Consultation process
The scenarios, inputs, assumptions and methods that apply for AEMO’s 2019-20 forecasting and planning
publications have been developed through an extensive consultation process that commenced in February
2019. Views have been sought from a broad collection of stakeholders throughout this period through written
submissions, in-person discussions, workshop participation, webinars and briefings.
Figure 2 below shows key engagement milestones during this time.

Figure 2       Consultation milestones

    Deliverables
 5 Feb                   20 Mar                                                                             16 Aug
 Forecasting and         Submissions on                                                                     Final scenarios,
 planning                forecasting and                                                                    inputs and
 consultation            planning                                                                           assumptions
 published               consultation                                                                       report published

        Feb               Mar                  Apr                  May                  Jun               Jul                 Aug

     19 Feb              3 Apr                 12 Apr               21 May             3 Jun                 13 Aug
     Stakeholder         Briefing webinar to   Stakeholder          Consumer           ISP scenarios and     Candidate
     workshop to         summarise             workshop to          engagement         assumptions           Renewable Energy
     address questions   submissions           explore scenarios    approach and ISP   briefing              Zones webinar
     of clarification                          and resolve issues   workshop

    Engagements and consultations

To challenge conventional thinking and ensure feedback was evaluated without unconscious bias, AEMO
engaged Boston Consulting Group (BCG) to assist in stretching the range of outcomes considered, ensure
there is a consistent scenario narrative behind the scenarios, and independently evaluate and cluster the
feedback received. This included facilitation of a stakeholder workshop held in Sydney, whereby industry and
consumer stakeholders gathered to determine the appropriate scenario narratives to adopt for the ISP, and
the settings most appropriate for each of those scenarios.
AEMO gratefully acknowledges the valuable contributions from all stakeholders and BCG in this process.

               Supplementary material
In addition to this document, AEMO has published an associated 2019 Inputs and Assumptions Workbook
and the 2019 Consultation Responses Report. The 2019 Consultation Responses Report details the stakeholder
feedback received during the consultation process and AEMO’s responses to these submissions.
Table 1 provides links to additional information that supplements this report, related to AEMO’s planning and
forecasting inputs, assumptions, and methodologies.

Table 1        Additional information and data sources
 Information source                    Source location

 2019-20 ISP Consultation              https://www.aemo.com.au/Stakeholder-Consultation/Consultations/2019-Planning-and-Forecasting-
 submissions and responses             Consultation
 website

 AEMO, 2019 ISP Inputs and             https://www.aemo.com.au/-/media/Files/Electricity/NEM/Planning_and_Forecasting/Inputs-Assumptions-
 Assumptions Workbook                  Methodologies/2019/2019-Input-and-Assumptions-workbook.xlsx

© AEMO 2019 | 2019 forecasting and planning scenarios, inputs, and assumptions                                                       9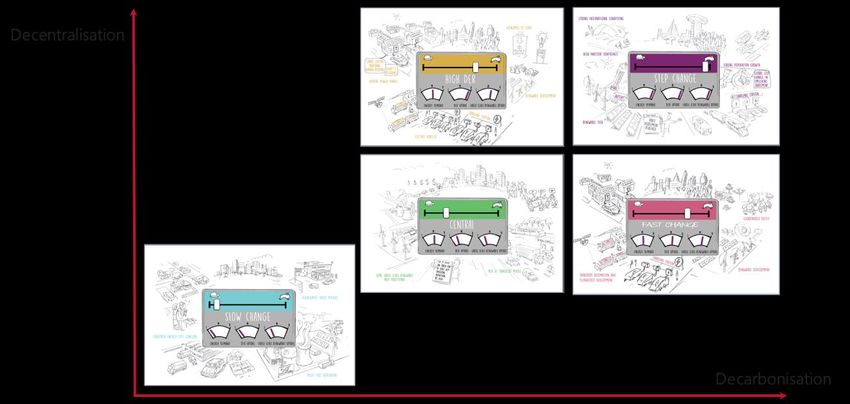
Information source                  Source location

 AEMO, 2018 System Strength          https://www.aemo.com.au/-/media/Files/Electricity/NEM/Security_and_Reliability/System-Security-
 Requirements Methodology            Market-Frameworks-Review/2018/System_Strength_Requirements_Methodology_PUBLISHED.pdf

 AEMO, 2018 Inertia                  https://www.aemo.com.au/-/media/Files/Electricity/NEM/Security_and_Reliability/System-Security-
 Requirements Methodology            Market-Frameworks-Review/2018/Inertia_Requirements_Methodology_PUBLISHED.pdf

 AEMO, Electricity Demand            https://www.aemo.com.au/-/media/Files/Electricity/NEM/Planning_and_Forecasting/
 Forecasting Methodology             NEM_ESOO/2018/Electricity-Demand-Forecasting-Methodology-Information-Paper.pdf
 Information Paper

 AEMO, Market Modelling              https://www.aemo.com.au/-/media/Files/Electricity/NEM/Planning_and_Forecasting/Inputs-Assumptions-
 Methodology Paper                   Methodologies/2019/Market-Modelling-Methodology-Paper.pdf

 AEMO, Constraint Formulation        http://www.aemo.com.au/-/media/Files/Electricity/NEM/Security_and_Reliability/CongestionInformation/
 Guidelines                          2016/Constraint_Formulation_Guidelines_v10_1.pdf.

 CSIRO, GenCost 2018:                https://publications.csiro.au/rpr/download?pid=csiro:EP189502&dsid=DS1
 Updated projections of
 electricity generation
 technology costs

 GHD, 2018 AEMO Cost And             Report: https://www.aemo.com.au/-/media/Files/Electricity/NEM/Planning_and_Forecasting/Inputs-
 Technical Parameter Review          Assumptions-Methodologies/2019/9110715-REP-A-Cost-and-Technical-Parameter-Review---Rev-4-
                                     Final.pdf
                                     Databook: https://www.aemo.com.au/-/media/Files/Electricity/NEM/Planning_and_Forecasting/Inputs-
                                     Assumptions-Methodologies/2019/GHD-AEMO-revised---2018-19-Costs_and_Technical_Parameter.xlsb

 Entura, 2018 Pumped Hydro           https://www.aemo.com.au/-/media/Files/Electricity/NEM/Planning_and_Forecasting/Inputs-Assumptions-
 Cost Modelling                      Methodologies/2019/Report-Pumped-Hydro-Cost-Modelling.pdf

 Core Energy, 2019 Wholesale         Report: https://www.aemo.com.au/-/media/Files/Electricity/NEM/Planning_and_Forecasting/Inputs-
 Gas Price Outlook                   Assumptions-Methodologies/2019/CORE_Delivered-Wholesale-Gas-Price-Outlook_16-January-2019.pdf
                                     Databook: https://www.aemo.com.au/-/media/Files/Electricity/NEM/Planning_and_Forecasting/Inputs-
                                     Assumptions-Methodologies/2019/CORE-Eastern-Australia-Gas-Price-Projections-Databook_16-January-
                                     2019.xlsx

 Deloitte, 2019 AEMO Long-           https://www.aemo.com.au/-/media/Files/Electricity/NEM/Planning_and_Forecasting/Inputs-Assumptions-
 term Economic Scenario              Methodologies/2019/Long-term-economic-scenario-forecasts---Deloitte-Access-Economics.pdf
 Forecasts

 CSIRO, 2019 Projections For         https://www.aemo.com.au/-/media/Files/Electricity/NEM/Planning_and_Forecasting/Inputs-Assumptions-
 Small Scale Embedded                Methodologies/2019/2019-Projections-for-Small-Scale-Embedded-Technologies-Report-by-CSIRO.pdf
 Technologies Report

 Energeia, 2019 Distributed          https://www.aemo.com.au/-/media/Files/Electricity/NEM/Planning_and_Forecasting/Inputs-Assumptions-
 Energy Resources and Electric       Methodologies/2019/Distributed-Energy-Resources-and-Electric-Vehicle-Forecasts---Report-by-
 Vehicle Forecasts                   Energeia.pdf

 Wood Mackenzie, 2019 Coal           Report: https://www.aemo.com.au/-/media/Files/Electricity/NEM/Planning_and_Forecasting/Inputs-
 Cost Projections                    Assumptions-Methodologies/2019/WoodMackenzie_AEMO_
                                     Coal_cost_projections_Approach_20190711.pdf.
                                     Databook: https://www.aemo.com.au/-/media/Files/Electricity/NEM/Planning_and_Forecasting/Inputs-
                                     Assumptions-Methodologies/2019/WoodMackenzie_AEMO_Delivered_cost_of_coal_20190711.xlsx.

 Strategy Policy Research,           https://www.aemo.com.au/-/media/Files/Electricity/NEM/Planning_and_Forecasting/Inputs-Assumptions-
 2019 Energy Efficiency              Methodologies/2019/StrategyPolicyResearch_2019_Energy_Efficiency_Forecasts_Final_Report.pdf.
 Forecasts

© AEMO 2019 | 2019 forecasting and planning scenarios, inputs, and assumptions                                                    10
2. Scenarios
Scenario overview
Each year, AEMO assesses future planning and forecasting requirements under a range of credible scenarios
over a period sufficiently long to support stakeholders’ decision-making in the short, medium, and long term.
Five scenarios have been developed in collaboration with the energy industry, that vary broadly with respect
to the rate of growth in grid-scale renewable generation resources, and the uptake of distributed energy
resources (see Figure 3). Scenarios resulting in stronger decarbonisation and/or stronger decentralisation of
the energy industry also include stronger electrification of other sectors, particularly the transport sector.
Figure 3 Scenarios determined for examination in the 2019-20 Integrated System Plan
The scenarios provide a breadth of potential futures examining different roles for different elements of the
industry. The scenario analysis approach will enable the identification of stationary energy industry
developments to support future consumer energy needs efficiently and at lowest risk.
These scenarios investigate:
• Current transition of the energy industry, under current public policies and technology trajectories, such
that consumers and investors drive future infrastructure needs (Central).
• Slower technology advances, lower consumer interest in directing change, and no direct policy changes
beyond existing commitments (Slow Change).
• Consumer-led transformation of the industry, with a much faster pace of innovation and development of
DER due to significant embrace from consumers (High DER).
• Technology-led transition of the industry, supported by policy to remove any barriers to entry, leading to
a faster pace of change and cost reduction affecting large-scale providers of energy, with grid-based
solutions being favoured over consumer-driven alternatives (Fast Change).
© AEMO 2019 | 2019 forecasting and planning scenarios, inputs, and assumptions 11• Strong climate commitments and developments to support the achievement of ambitious decarbonisation
objectives, in line with the aim of the Paris Agreement to limit the increase in global average temperatures
to well below 2°C, supported by a mixture of technology advancements at the large scale, and
consumer-led innovation (Step Change).
These scenarios are described in more detail in the following sections.
All five scenarios will be used in AEMO’s ISP. The 2019 ESOO for the NEM and 2020 GSOO for eastern and
south-eastern Australia will also use a selection of the same scenarios.
Scenario narratives
2.2.1 Central
The Central scenario reflects a future energy system based around current government policies and
best estimates of all key drivers.
This scenario represents the current transition of the energy industry under current policy settings
and technology trajectories, where the transition from fossil fuels to renewable generation is generally
led by market forces.
Figure 4 Central scenario narrative
In this scenario:
• Moderate growth in the global economy is in line with current best estimates, with Australia’s long-term
average growth in line with an economy in many parts of the nation slowly transitioning from being
export-oriented to service-oriented. Emission reduction and energy policy settings are in line with current
government policies, with focus at a federal level being on consumer costs and reliability, and regional
renewable generation development and consumer investment in DER encouraged at a state level. Sectoral
change beyond current policies is driven by commercial decision-making as ageing power stations close.
© AEMO 2019 | 2019 forecasting and planning scenarios, inputs, and assumptions 12• Technology improvements – particularly in renewable energy and consumer technologies – are gradual,
and adoption trends in new technologies such as consumer energy storage systems (ESS) and electric
vehicles (EVs) are relatively slow in the next decade. Technology cost breakthroughs domestically are not
expected in the short term, particularly in EVs, because vehicle prices are slow to reduce and vehicle
model availability is limited. Cost parity with traditional internal-combustion engine (ICE) vehicles is not
expected until about 2030, with a stronger focus on short-range vehicles (with heavier vehicles reaching
cost parity approximately 10 years later). A lack of supportive policy and EV infrastructure contributes to
this delayed parity with ICEs.
• Broader energy efficiency and DER development (particularly rooftop photovoltaic [PV] systems)
continues, as consumers seek to invest in devices to lower their energy cost exposure, however there is no
significant change to customer tariffs or additional DER incentives.
• In terms of large-scale developments, economic factors (rather than intervention policies) drive industry
change. Australia remains on track to meet its current emission reduction commitment to 2030. However,
global commitments to climate change and decarbonisation do not lead to strong government-led
increases in commitments to meet the Paris Agreement, and as such, coal generation remains to the end
of its technical life, and is not hastened by policy measures. The change affecting the stationary energy
sector is evolutionary and gradual.
• In the long term, modest global carbon reduction ambitions lead to higher global and domestic
temperatures and more extreme weather conditions, consistent with the IEA’s latest World Energy Outlook
(2018) projections12.
Policy settings to apply in the Central Scenario
The Central scenario incorporates all government environmental and energy policies where:
a) There is a current policy commitment with clear articulation of when and how it impacts the power
system, and
b) Any of the following criteria are met:
– A commitment has been made in an international agreement.
– The policy is legislated.
– There is a regulatory obligation in relation to a policy.
– The policy has received material funding in a State or Federal government budget.
– The Council of Australian Governments (COAG) Energy Council, or the COAG Energy Council Senior
Committee of Officials (SCO), has advised AEMO to incorporate the policy.
Given the above approach, the Central scenario includes:
• Federal emissions reduction objective of at least 26% economy-wide by 2030, with the NEM taking a
pro rata share.
• Victorian Renewable Energy Target (VRET, 50% by 2030).
• Queensland Renewable Energy Target (QRET, 50% by 2030).
• New South Wales Transmission Infrastructure Strategy.
• Snowy 2.0 storage project committed.
• Current state and federal policies impacting DER and energy efficiency (EE) policies.
12
International Energy Agency, World Energy Outlook (2018) examines the forecast energy outcomes considering the impacts of only those policies and
measures that are firmly enshrined in legislation as of mid-2018. According to the IEA’s “Tracking Clean Energy Progress’ tracker, at
https://www.iea.org.au/tcep/, “we are far from on track” to hitting the objectives of the Paris Agreement’s well below 2°C climate goal.
© AEMO 2019 | 2019 forecasting and planning scenarios, inputs, and assumptions 132.2.2 Slow Change In this scenario, economic conditions are challenging, leading to a slowdown in investment and hence transformation of the industry. Consumers and governments put more emphasis on protecting standards of living than on structural reform to the energy sector and, with less capital available, investors are slow in developing large-scale technology projects to replace existing resources. This maintains reliance on fossil fuels well into the second half of this century. Support for local industry is high, but slow global conditions lead to challenging times for some industrial sectors. This scenario reflects slower technology advancements, lower consumer interest, and fewer direct policy drivers. Key differences to the Central scenario: • Weaker economic and population growth. • Slower decarbonisation of stationary energy sector and transport sector, which in turn may result in life extensions of existing generators, if economic. • Proportionately lower decentralisation. Figure 5 Slow Change scenario narrative The Slow Change scenario reflects a future world with more challenging global and local economic conditions. In this scenario: • The population growth outlook is slower, lowering broader economic growth and limiting household disposable income growth. Weak economic conditions lead to higher risk of industrial demand closures, while business and residential loads seek to lower consumption to manage bill exposure. • With less disposable income and fewer policy settings to support DER, investment in rooftop PV, batteries, and EVs is lower relative to the Central scenario. Australia does not actively promote local EV deployment. © AEMO 2019 | 2019 forecasting and planning scenarios, inputs, and assumptions 14
• Renewable generation investment slows with limited political, commercial, and social support. The
  generation technology transition is slower, relative to the Central scenario. While innovation in renewable
  generation is still expected, the rate of transition globally is slower, resulting in slower improvements in
  renewable generation technology costs.
• In this scenario, owners of coal generators in particular may choose to extend their asset lives, if economic,
  rather than invest in new resources, particularly given the higher project financing costs.
• In the long term, climate change leads to higher temperatures and more extreme weather conditions.
  Long-term average rainfall decline also requires more frequent operation of desalination plant.

2.2.3        High DER

 This scenario represents a highly digital world where technology companies increase the pace of
 innovation in easy to use, highly interactive and engaging technologies.
 This includes reduced costs and increased adoption of solar PV, ESS and EVs, with automation
 becoming commonplace, enabling consumers to actively control and manage their energy costs, and
 consumer-led preferences lead to wide spread electrification of the transport sector.
 This scenario reflects a consumer-led transformation of the energy sector.
 The key difference to the Central scenario is significantly greater decentralisation through higher DER.

Figure 6     High DER narrative

In this scenario:
• Community groups recognise that consumers, rather than large commercial or government entities, can
  play a strong role in the future energy mix, and consumers’ actions will assist in broader decarbonisation
  efforts.

© AEMO 2019 | 2019 forecasting and planning scenarios, inputs, and assumptions                                 15
• Controllable home devices lead to a stronger role for at-home energy management, and the scenario has
  a relatively high share of consumer storage solutions, EVs, and controllable battery systems. Digital
  communities exist, with technological innovation increasing the ease with which energy solutions can be
  embraced with improved interoperability and minimal intervention.
• There is a migration away from large-scale generation developments to commercial and residential
  systems to help achieve decarbonisation targets.
This is a variant on the Central scenario with stronger growth in DER, and therefore has broader settings in
line with that scenario.

2.2.4        Fast Change

 This scenario includes reductions in international economic barriers, leading and delivering
 technological improvements and manufacturing advancements that will assist in delivering cost
 reductions to consumers and industry alike.
 Greater digitalisation increases consumers’ adoption of methods for controlling energy use and
 integrating transport into the energy sector. These technological improvements and cost reductions
 remove some of the political and social barriers to addressing climate change, and greater coordinated
 global emission reduction ambition is achieved.
 This scenario reflects a technology-led transition, particularly at grid scale.
 Key differences to the Central scenario:
 • Faster adoption of decarbonised investments.
 • Technology innovation and increased DER uptake.
 • Greater EV uptake and stronger role for energy storage solutions.

Figure 7     Fast Change narrative

                                         FAST CHANGE

© AEMO 2019 | 2019 forecasting and planning scenarios, inputs, and assumptions                                 16
In this scenario: • Moderate growth in the global economy is in line with current best estimates (same as Central scenario), with Australia’s long-term average growth in line with an economy slowly transitioning from being export-oriented to service-oriented in many parts of the nation. • Technology innovations lead to cost reductions across large- and small-scale technologies, as global uptake of zero and low emissions technologies is more rapid. This leads to a moderate to high degree of consumer DER penetration, with cost reductions complementing policy support that can catalyse local developments in DER including EVs (such as increased model availability and access to innovative customer tariff structures and charging stations). • In terms of large-scale developments, strong investment focus is placed on renewable generation to meet decarbonisation goals, and some coal-fired generation retires earlier than currently expected. High uptake of renewable resources nationally results in less need for state policies to try to incentivise development of these resources locally, leading to development in areas across all NEM regions where the resource quality and transmission access is best suited. • While stronger action on climate change is delivered sooner than in the Central scenario, developments to 2050 do not come quickly enough to limit global temperature rises to 2 degrees Celsius (⁰C) by 2100. 2.2.5 Step Change This scenario is new for 2019. It has been included in response to overwhelming feedback from stakeholders and industry that such a scenario would deliver valuable insights for decision-makers. This scenario includes a step change in response to climate change, supported by technology advancements and a coordinated cross-sector plan that efficiently and effectively tackles the adaptation challenges. Risks associated with climate change are urgently addressed. Domestic and international action rapidly increases to achieve the objectives of the Paris Agreement. Advancements in digital trends globally increases the role of consumer technologies to manage energy use, and technology improvements and complementary manufacturing and infrastructure developments enables greater adoption of alternative fuelled vehicles, electrifying much of that sector. Sustainability has a very strong focus, with consumers, developers and government also supporting the need to reduce the collective energy footprint through adoption of greater EE measures. This scenario reflects strong direct climate action, with a step change in approach that focuses on decarbonisation efforts. Key differences to the Central scenario: • Higher population and economic growth. • Most aggressive decarbonisation goals. • Technology innovation and increased DER uptake. • Greater EV uptake and stronger role for energy management solutions. • Stronger role for EE measures. © AEMO 2019 | 2019 forecasting and planning scenarios, inputs, and assumptions 17
Figure 8     Step Change narrative

In this scenario:
• Strong climate action underpins rapid transformation of the energy sector (and broader global economy)
  to achieve the Paris Agreement’s goal of limiting global temperature rises to no more than 2⁰C, ideally less
  than 1.5⁰C.
• Australia benefits from strong population growth and economic activity from increased quality of life,
  migration, access to renewable resources, and a greater digital economy.
• Technology innovations lead to cost reductions across large- and small-scale technologies as global
  uptake of zero and low emissions technologies is prolific.
   – Greater innovation in digital trends and technology costs leads to stronger consumer energy
     management and DER investment, as consumers embrace their role in decarbonisation efforts and
     move towards digital energy (highly flexible, measurable supply sourced from multiple sites,
     coordinated effectively in real time through greater digital connectivity and management of ‘big data’).
   – This leads to a relatively high degree of consumer DER penetration, similar to the High DER scenario
     (but with a greater population base), and the electricity sector includes electrification of transportation
     sectors to efficiently achieve decarbonisation goals, leading to strong growth in EVs. This includes
     continued innovation in transport services, such as ride-sharing and autonomous vehicles, that may
     influence charge and discharge behaviours of the EV fleet, including vehicle-to-home discharging
     trends.
• In terms of large-scale developments, the scenario will exhibit the fastest rate of technology cost
  reductions for zero/low emissions technologies. Consistent with a step change, new policies are
  implemented that drive uptake of renewable generation resources well in excess of current state and
  federal ambitions to 2030.
• Ambitious future EE standards are set for buildings and equipment, resulting in substantial energy savings.
• Global and domestic action on climate change successfully limits global temperature rises to 1.5⁰C or 2 ⁰C
  by 2100.

© AEMO 2019 | 2019 forecasting and planning scenarios, inputs, and assumptions                                 18
Key scenario parameters
For each scenario, the role of government and public policies can influence the ultimate direction and scale of
action affecting the energy sector. These policy settings collectively may influence the infrastructure
developed to support the consumption of energy, and each scenario will include a differing degree of
policy-driven change.
The key policy settings identified for 2019-20 scenarios include national and state-driven policies:
• Existing Federal emissions reduction policy to reduce Australia’s emissions by 26% by 2030
economy-wide, with a commensurate degree of decarbonisation to be required from the electricity sector,
and the NEM required to do much of this reduction (in line with the magnitude of energy consumed in
the NEM relative to other smaller grids, such as those in Western Australia, Northern Territory, and
regional areas).
• State renewable energy targets, including the VRET, QRET, and New South Wales Transmission
Infrastructure Strategy.
• Pumped hydro initiatives – Snowy 2.0 and Battery of the Nation.
• Various policies affecting the scale and timing of EE adoption and DER penetration.
While the Central Scenario includes all current government policies, future possible variations in these
policies are incorporated in the other scenarios to be internally consistent with the scenario narratives. Table 2
shows the settings to be applied to each scenario, and the choices are explained further below. The model
representation of these policies is discussed in more detail in the Market Modelling Methodology Paper13.
Table 2 2019 scenario policy settings
Policy Central Slow Change Fast Change High DER Step Change
26% reduction in emissions
by 2030 (NEM)
✓ ✓ ✓ ✓ ✓
VRET – 40% by 2025 ✓ ✓ ✓ ✓ ✓✓
VRET – 50% by 2030 ✓ X X ✓ ✓✓
QRET – 50% by 2030 ✓ X X ✓ ✓✓
NSW Transmission
Infrastructure Strategy
✓ X X ✓ ✓✓
Snowy 2.0 ✓ ✓ ✓ ✓ ✓
Battery of the Nation * * * * *
Current Distributed Energy
Resources policies
✓ ✓ ✓ ✓✓ ✓✓
Current Energy Efficiency
policies
✓ ✓ ✓ ✓ ✓✓
NEM carbon budget N/A N/A ✓ N/A ✓✓
Note: ✓✓ The existing policy is included at a minimum, but volume likely to be exceeded due to carbon budget constraints.
* Will not be included in the scenario as a required setting, but the project may be selected through the modelling process.
13
AEMO, Market Modelling Methodology Paper, available at: https://www.aemo.com.au/-/media/Files/Electricity/NEM/Planning_and_Forecasting/Inputs-
Assumptions-Methodologies/2019/Market-Modelling-Methodology-Paper.pdf
© AEMO 2019 | 2019 forecasting and planning scenarios, inputs, and assumptions 19The Slow Change scenario does not include the extended VRET and full QRET policy, as the scenario itself
considers less overall emission reduction ambition with no coordinated carbon budget. Furthermore, future
State governments are assumed to scale back the level of ambition pursued within their own renewable
energy development targets. Renewable generation already committed under the current schemes is
assumed to still be developed.
The High DER scenario closely represents the scenario settings of the Central Scenario, with State
Governments able to support full deployment of their various renewable energy development schemes as
consumers reduce the requirement from large-scale investments (and therefore the overall direct cost to
State government and their citizens).
The Fast Change scenario focuses on greater centralised, large-scale developments located in areas that
make most economic sense for investors. In this scenario, high uptake of renewable resources is expected to
reduce the relative value for state policies to incentivise local renewable developments, as these
developments are likely to develop naturally from the decarbonisation action nationally. As such, State
governments opt not to strengthen their renewable generation aspirations, and instead revert to reliance on
national objectives tied to decarbonisation goals. This is expected to lead to strong development of
renewable energy across all NEM regions where the resource quality and transmission access is best suited.
The Step Change scenario has significant national emission abatement ambition and is likely to be
supported by strong government policy at both federal and state levels. While the actual mechanisms for
achieving this ambition are not defined in the scenario, it is plausible to envisage that current government
policies would continue, supplemented by other incentives. In this instance, the global emission trajectory is
likely to be far more binding than any other policy settings and renewable generation and DER targets are
therefore expected to be well exceeded.
Table 3 consolidates all the key policy settings, demand drivers, technological improvements, investment
considerations, and climatic assumptions to be applied for each of the scenarios. Details are in the 2019
Inputs and Assumptions Workbook14.
Table 3 2019-20 scenario dimensions
Scenario Slow Change Central Fast Change High DER Step Change
Demand drivers
Economic growth and Low Moderate Moderate Moderate High
population outlook
EE improvement Low Moderate Moderate Moderate High
Demand Side Low Moderate Moderate Moderate High
Participation
DER uptake
Rooftop PV Low Moderate Moderate – High High High
Battery storage Low Moderate Moderate – High High High
installed capacity
14
AEMO. 2019 Inputs and Assumptions Workbook, at https://www.aemo.com.au/-/media/Files/Electricity/NEM/Planning_and_Forecasting/Inputs-
Assumptions-Methodologies/2019/2019-Input-and-Assumptions-workbook.xlsx.
© AEMO 2019 | 2019 forecasting and planning scenarios, inputs, and assumptions 20Scenario Slow Change Central Fast Change High DER Step Change
Battery storage Existing trials do Moderate role for Existing trials Existing trials Existing trials
aggregation/Virtual not successfully energy storage demonstrate a demonstrate a demonstrate a
Power Plant (VPP) demonstrate a aggregators and business case for business case for business case for
deployment by 2050 strong business VPPs. VPP aggregation. VPP aggregation. VPP aggregation.
case for VPP High role for High role for High role for
aggregation. Low energy storage energy storage energy storage
role for energy aggregators and aggregators and aggregators and
storage VPPs. VPPs. VPPs, faster than
aggregators and all other
VPPs. scenarios.
EV uptake Low Moderate Moderate-High Moderate-High High
EV charging times Delayed adoption Moderate Faster adoption Faster adoption Faster adoption
of infrastructure adoption of of infrastructure of infrastructure of infrastructure
and tariffs to infrastructure and and tariffs to and tariffs to and tariffs to
enable ‘better’ tariffs to enable enable ‘better’ enable ‘better’ enable ‘better’
charging options. ‘better’ charging charging options. charging options. charging options.
options.
Climate change (physical symptoms)
Representative RCP 8.5 RCP 7.0 RCP 4.5 RCP 7.0 RCP 1.9 / 2.6
Concentration (>4.5 C)
o
(3.0 – 4.5 C)
o
(2.5 – 2.7 C)
o
(3.0 – 4.5 C)
o
(1.4 – 1.8oC)
Pathway [RCP]
(average temperature
rise by 2100)A
Median Hydro inflow -18% -14% -7% -14% -4%
reduction by 2050B
Large-scale renewable build cost trajectoriesC
Solar PV CSIRO GenCost: CSIRO GenCost: CSIRO GenCost: CSIRO GenCost: CSIRO GenCost:
4-degrees 4-degrees 2-degrees 4-degrees 2-degrees
Wind Weaker CSIRO GenCost: CSIRO GenCost: CSIRO GenCost: Stronger
reductions than 4-degrees 2-degrees 2-degrees reductions than
CSIRO GenCost: CSIRO GenCost:
4-degrees 2-degrees
Pumped hydro Weaker CSIRO GenCost: CSIRO GenCost: CSIRO GenCost: Stronger
reductions than 4-degrees 2-degrees 4-degrees reductions than
CSIRO GenCost: CSIRO GenCost:
4-degrees 2-degrees
Battery CSIRO GenCost: CSIRO GenCost: CSIRO GenCost: Faster relative to Faster than
4-degrees 4-degrees 2-degrees other CSIRO GenCost:
technologies 2-degrees, with
using CSIRO no significant
GenCost: technological
2-degrees bias
scenario
outcomes
Solar thermal Weaker CSIRO GenCost: CSIRO GenCost: CSIRO GenCost: Stronger
reductions than 4-degrees 2-degrees 2-degrees reductions than
CSIRO GenCost: CSIRO GenCost:
4-degrees 2-degrees
© AEMO 2019 | 2019 forecasting and planning scenarios, inputs, and assumptions 21Scenario Slow Change Central Fast Change High DER Step Change
Investment and retirement considerations
Generator retirements Maintained at In line with In line with In line with In line with
least until expected closure expected closure expected closure expected closure
expected closure years, or earlier if year, or earlier if year, or earlier if year, or earlier if
year, potentially economic to do economic or economic or economic or
extended if so. driven from driven from driven from
economic to do decarbonisation decarbonisation decarbonisation
so. objectives. objectives. objectives.
Project finance costs High Moderate Moderate Moderate Moderate
A. For more information on Representative Concentration Pathways (2.6, 4.5, 6.0, 8.5) see https://www.climatechangeinaustralia.gov.au/
en/publications-library/technical-report/ . Additional RCPs (1.9, 3.4, 7.0) are emerging through work by the Intergovernmental Panel on
Climate Change (IPCC) sixth assessment due to be published in 2020-21 and are developed on a comparable basis.
B. Hydro reductions consider both rainfall reductions (global climate model [GCM] trajectories for the ‘Southern Australia’ supercluster in
which almost all hydro facilities are located, available from www.climatechangeinaustralia.gov.au. Median projection based on
ACCESS1.0, high and low sensitivities on GFDL-ESM2M & NorESM1-M GCMs) and estimates of the effect of reduced rainfall on broader
dam inflow reductions (informed by http://www.bom.gov.au/research/projects/vicci/docs/2016/PotterEtAl2016.pdf).
C. AEMO large-scale renewable build cost trajectories based off CSIRO GenCost 2018: Updated projections of electricity generation
technology costs, available at https://publications.csiro.au/rpr/download?pid=csiro:EP189502&dsid=DS1.
Sensitivity analysis
In any scenario analysis, it is important that scenarios be defined to adequately capture the spread of
potential future worlds. Fundamentally, in scenario analysis, scenarios are used to investigate alternative
futures, whereas sensitivities are designed to validate the significance of key assumptions within a given
future.
For the 2019-20 ISP, AEMO will use sensitivities to determine how resilient the development plan is to
variations in key assumptions.
Table 4 outlines AEMO’s current list of likely sensitivities that AEMO will explore at a minimum. The list
includes consideration of policies which are less certain, but reasonably likely. These sensitivities will focus on
identifying the robustness of the whole-of-system plan. Time permitting, AEMO may add to this list,
depending on the outcomes of the modelling being undertaken.
Table 4 Identified 2019-20 ISP sensitivities
Sensitivity Purpose
Delay in timing of To test the resilience of the development plan if the Snowy 2.0 scheme was delayed unexpectedly,
Snowy 2.0 without investor confidence to address the gap in development that this may create.
Early retirement of To test the resilience of the power system to a major reduction in brown coal power station generation
existing generation much earlier than submitted closure dates, without sufficient notice or capacity to develop efficient
generation alternatives. (Such a reduction could be realised ahead of permanent retirements, including
mothballing on a seasonal basis or reduced station output through rotating long-term maintenance on
parts of the station or stations.)
Battery of the Nation Committing the development of the BOTN project and accompanying Marinus Link to complement the
(BOTN) development of the Snowy 2.0 project. A phased Marinus Link will be assumed with 600 MW in 2025-26
and a further 600 MW in 2027-28.
De-commitment of Excluding the QRET policy to test the regional development of renewable resources in Queensland, and
QRET the impact of this on transmission development recommendations.
© AEMO 2019 | 2019 forecasting and planning scenarios, inputs, and assumptions 223. Inputs and assumptions
The key data required for AEMO’s supply forecasting models is:
• Demand forecasts, comprising the expected energy consumption, maximum and minimum demand
expectations, and the degree of avoided grid-consumed energy due to DER penetration or EE measures.
• Energy policy settings.
• Technical and cost data of existing, planned, and candidate generators, storages, and transmission paths.
The following sections outline the key inputs and assumptions AEMO will adopt in its 2019-20 planning and
forecasting publications. For each of these assumptions, the 2019 Inputs and Assumptions Workbook15
provides additional details.
Key components for forecasting energy consumption
AEMO updates its projections of energy consumption annually. This is done for electricity as part of the
ESOO, and for gas as part of the GSOO. This process includes significant stakeholder consultation, industry
engagement (via surveys), consultant data and recommendations, and AEMO’s internal forecasting of each
sector and sub-sector affecting energy consumption and peak demands.
The 2019-20 ISP will use the demand and energy forecasts produced for the 2019 ESOO16 and 2019 GSOO17.
These forecasts have involved extensive consultation with industry pre-publication (and after publication, in
the case of the GSOO), and during the drafting of the forecasts (in the case of the ESOO), via AEMO’s
Forecasting Reference Group and industry workshops.
Key components in the forecasts include:
• DER forecasts of:
– Rooftop PV.
– Customer ESS.
– EV uptake and charging behaviours.
– The role of ESS aggregation and virtual power plants (VPPs).
• Economic and population growth drivers.
• EE forecasts.
• Fuel switching.
• Outlook for large industrial loads and liquified natural gas (LNG) exports.
3.1.1 Customer distributed energy resources
In recognition of the uncertainty in, and importance of DER, AEMO engaged two consultants18 to provide
detailed assessments of the potential role of DER, as well as the charge and discharge behaviours of these
15
AEMO. 2019 Inputs and Assumptions Workbook, at https://www.aemo.com.au/-/media/Files/Electricity/NEM/Planning_and_Forecasting/Inputs-
Assumptions-Methodologies/2019/2019-Input-and-Assumptions-workbook.xlsx.
16
AEMO, NEM ESOO, at https://www.aemo.com.au/Electricity/National-Electricity-Market-NEM/Planning-and-forecasting/NEM-Electricity-Statement-of-
Opportunities.
17
AEMO, 2019, GSOO, at https://www.aemo.com.au/-/media/Files/Gas/National_Planning_and_Forecasting/GSOO/2019/2019-GSOO-report.pdf.
18
AEMO engaged CSIRO and Energeia to perform this work. Both consultant reports are available under “Supporting materials” at
https://www.aemo.com.au/Electricity/National-Electricity-Market-NEM/Planning-and-forecasting/Inputs-Assumptions-and-Methodologies.
© AEMO 2019 | 2019 forecasting and planning scenarios, inputs, and assumptions 23You can also read