The U.S. Electricity Industry after 20 Years of Restructuring
←
→
Page content transcription
If your browser does not render page correctly, please read the page content below
EI @ Haas WP 252R

       The U.S. Electricity Industry after 20 Years of
                       Restructuring

                   Severin Borenstein and James Bushnell
                            Revised May 2015

Energy Institute at Haas working papers are circulated for discussion and comment purposes.
They have not been peer-reviewed or been subject to review by any editorial board.

© 2014 by Severin Borenstein and James Bushnell. All rights reserved. Short sections of text, not
to exceed two paragraphs, may be quoted without explicit permission provided that full credit is
given to the source.

                                   http://ei.haas.berkeley.edu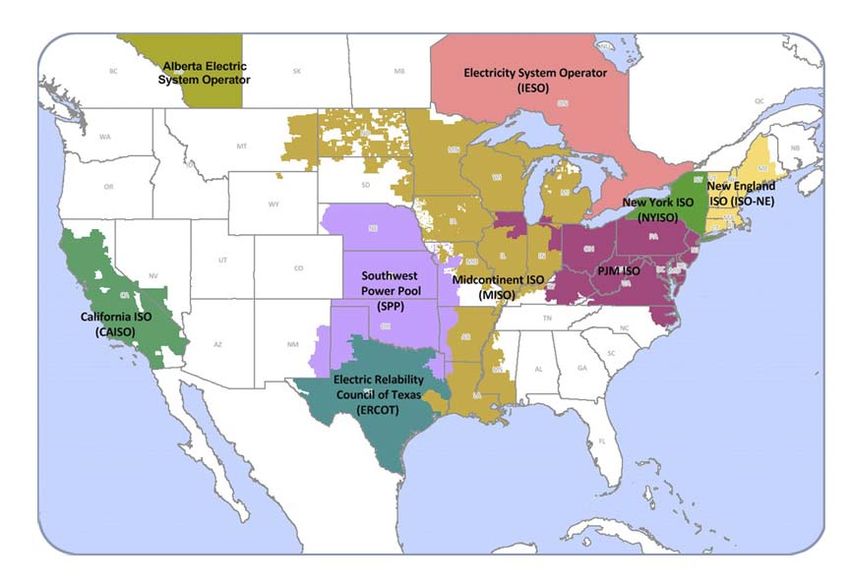
The U.S. Electricity Industry after 20 Years of Restructuring

                        By Severin Borenstein and James Bushnell∗

           Prior to the 1990s, most electricity customers in the U.S. were
          served by regulated, vertically-integrated, monopoly utilities that
          handled electricity generation, transmission, local distribution and
          billing/collections. Regulators set retail electricity prices to allow
          the utility to recover its prudently incurred costs, a process known
          as cost-of-service regulation. During the 1990s, this model was dis-
          rupted in many states by “electricity restructuring,” a term used
          to describe legal changes that allowed both non-utility generators to
          sell electricity to utilities – displacing the utility generation func-
          tion – and/or “retail service providers” to buy electricity from gen-
          erators and sell to end-use customers – displacing the utility pro-
          curement and billing functions. We review the original economic
          arguments for electricity restructuring, the potential winners and
          losers from these changes, and what has actually happened in the
          subsequent years. We argue that the greatest political motivation
          for restructuring was rent shifting, not efficiency improvements,
          and that this explanation is supported by observed waxing and wan-
          ing of political enthusiasm for electricity reform. While electricity
          restructuring has brought significant efficiency improvements in
          generation, it has generally been viewed as a disappointment be-
          cause the price-reduction promises made by some advocates were
          based on politically-unsustainable rent transfers. In reality, the
          electricity rate changes since restructuring have been driven more
          by exogenous factors – such as generation technology advances and
          natural gas price fluctuations – than by the effects of restructuring.
          We argue that a similar dynamic underpins the current political
          momentum behind distributed generation (primarily rooftop solar
          PV) which remains costly from a societal viewpoint, but privately
          economic due to the rent transfers it enables.

  ∗ Email addresses: Borenstein: severinborenstein@berkeley.edu; Bushnell: jbbushnell@ucdavis.edu. When citing
this paper, please use the following: Borenstein, S, Bushnell, JB. The U.S. Electricity Industry after 20 Years of
Restructuring. Annu. Rev. Econ. 7: Submitted. Doi: 10.1146/annureveconomics-080614-115630.
                                                        1
2

                                               I.   Introduction

  In the mid-1990s, the great majority of electricity customers in the U.S. were served by
an investor-owned, vertically-integrated monopoly utility (IOU) that provided generation,
transmission, local distribution and billing/collections.1 IOUs were closely regulated by
state-level public service commissions under “cost-of-service” regulation, in which utilities
were effectively guaranteed the recovery of prudently-incurred operating costs plus a reg-
ulated return on capital expenditures. In the seven years between 1995 and 2002 a wave
of major regulatory reform aimed at introducing competition in various utility functions –
known broadly as “electricity restructuring” – transformed the industry.2 These changes
followed closely on the heels of what was seen as the successful economic deregulation of
many other industries, including airlines, railroads, telecommunications, gasoline retailing,
and the production of oil and natural gas.
  At the time, it was widely expected that this transformation would eventually lead the
entire industry to a less-regulated and more market-based structure. Yet in the years
following 2002 – after the 2000-2001 electricity crisis in California’s restructured market –
the movement for electricity deregulation encountered a significant backlash. While there
was some debate over “rolling back deregulation,” public policy after 2002 is more accurately
described as a cessation of any further restructuring. For the last decade, the policy focus
for the electricity industry has turned elsewhere – mostly towards environmental concerns
– and the loud debates from the early 2000s over the merits of restructuring have been
reduced to a background murmur.
  The central premise of this paper is that views of restructuring in the electricity industry
over the last two decades have been driven primarily by pursuit of quasi-rents that have
resulted from investments in generation capacity, power purchase agreements, and other
strategies whose payoff is revealed over long time periods. These strategies create fluctu-
ations in the relationship between the average cost and marginal cost of producing and
delivering electricity to consumers. Average cost is the basis for price setting under regu-
lation, while marginal cost is the basis for pricing in a competitive market. During periods
in which these two costs have diverged, consumer and political sentiment has tilted toward
whichever regime (regulation or markets) offered the lowest prices at that time.
  The relationship between average and marginal cost in the industry is in turn influenced
by many factors. Some of these – such as productivity, level of investment, and the choice
of type of investment – are influenced by the transitional incentive problems attributed to
cost-of-service regulation. Others are influenced by factors largely beyond the control of
state utility commissioners. Two critical exogenous trends during this period have been
technology innovations adapted from other sectors (such as aircraft engine technology that
changed the design of gas turbines and semiconductor innovations that reduced the cost
of solar power) and trends in the prices of natural gas, which is generally the fuel setting

   1 More than 75% of end-use electricity was provided by IOUs. Most other customers received electricity from
publicly-owned municipal utilities or, in some rural areas, local cooperatives. See Energy Information Administration
(1995).
   2 Throughout this paper we use the term “restructuring” to describe the suite of changes that impacted both the
organization of electricity firms and the methods by which those firms were regulated.
ELECTRICITY RESTRUCTURING 3
marginal costs in most electric systems.
Thus, while the restructuring era dawned with great hope that regulatory innovations, and
the incentives provided by competition, would dramatically improve efficiency and greatly
lower consumer costs, that hope was largely illusory. In fact, rates rose in both regulated and
deregulated states, and more rapidly in the deregulated ones in the early years of reform.
Subsequent studies of retail rates in both groups of states have generally overlooked the
key point that exogenous shocks to the industry often dominated the incremental benefits
that regulatory reform can provide. There is clear evidence that competition has improved
efficiency at power plants and improved the coordination of operations across a formerly
balkanized power grid. But the impact of gas price movements and new technologies have
had a far larger impact.
We argue that many of the same incentive that created political momentum for restruc-
turing 20 years ago are still present in the industry. One way they manifest today is in the
increasing focus on “distributed generation,” the term generally used for electricity gener-
ation that takes place on the customer side of the meter and reduces the customer’s retail
electricity demand from the utility. While valid economic and technological arguments can
be made for and against an expanded role for distributed generation, transfers of quasi-rents
play a major role in the policy positions.
In section 2 we review the expectations the drove the push for electricity restructuring in
the 1990s and how those beliefs shaped the market-based models for electricity markets in
each vertical component of the industry: generation, transmission, distribution and retail-
ing. In section 3, we examine the evidence on what effect restructuring has actually had, as
well as the most common confusions that confound electricity restructuring with changes in
input costs and other factors. Section 4 looks ahead to the most pressing challenge the in-
dustry will face in the coming years, the increasing role of renewable and intermittent energy
sources, both from utility-scale generation plants and from much smaller scale distributed
generation at households and commercial customers. We conclude in section 5.
II. Theory and Implementation of Electricity Restructuring
One of the challenges for an analysis of electricity restructuring is that there are several
competing definitions of what restructuring or deregulation actually is. Outside the United
States, a key step in electricity restructuring was the divestiture of the government-owned
assets that had comprised a nationalized power sector. In the United States, government
ownership was never the dominant form of organization and the exceptions in the U.S. –
federally marketed hydro-electric power and municipally-owned generation and distribution
companies – have remained largely unchanged during the restructuring era. Technically,
wholesale electricity markets are still regulated by the Federal Energy Regulatory Commis-
sion (FERC) under the authority granted by the 1938 Federal Power Act. The wave of
state-level restructuring did not change this fact, although FERC has applied its authority
flexibly by allowing states and regions to set “market-based” rates. Such authority can be
revoked, however, so it is inaccurate to label even wholesale markets in fully restructured
regions as “deregulated.”
In a market-based system for electricity provision, the industry is generally considered as4
participating in four separate activities: generation of electricity, long-distance transmission
over high-voltage lines, voltage step-down (to the 110V common in the U.S. or 220V used
in Europe and elsewhere) and local distribution to end users, and retailing (marketing and
resale of wholesale power) to end use customers. The last activity includes procurement of
power under long-term contracts, rate setting, billing, and collection. The U.S. restructuring
process was focused on generation, transmission and retailing. The local distribution lines
continued to be considered a natural monopoly that would be subject to either regulation
or municipal ownership.
Changes to generation, transmission and retailing were pursued with varying levels of
commitment in different parts of the country. Independent oversight and control of the
transmission networks was viewed by many as the backbone of restructuring, because trans-
mission was critical to generators accessing a competitive wholesale market into which they
could sell and to retailers accessing competitive sellers from which they could buy. Re-
structuring of generation resembled most closely the deregulation that had taken place in
other industries, with free entry of unregulated electricity plants (known as “merchant”
generators or independent power producers (IPPs)) that would live or die by their cost of
production and the price they could get for their output. Finally, retail restructuring, in
the limited areas it has taken hold in the U.S., has allowed non-utility companies to become
the wholesale procurement entities for retail customers, offering customers alternative retail
pricing structures, though across a rather limited spectrum as we discuss below.
In theory, at least, the three aspects of restructuring were closely intertwined. Without
independent oversight of transmission, a merchant electricity plant would be at the mercy
of the local transmission owner, which could extract large shares of the quasi-rents available
once the plant was built, thereby discouraging entry of competitive generation. Even with
transmission access, a merchant generator would be in a very weak position if there were only
one retail electricity provider to which it could sell its output. A monopoly retail provider
(a distribution utility) could still engage in competitive procurement, but that creates a
narrower spectrum for competitive generation and it means that the monopoly retailer is
the single determinant of the range of products that might be procured for retail. For
instance, the monopoly retailer might not pursue low-carbon sources even if there are many
retail customers who would be willing to pay a premium for greener energy. Thus, retail
competition potentially makes competitive generation more viable. Likewise, competitive
generation is central to the retailer being able to offer better procurement options, different
generation sources, or alternative billing mechanisms, which the retailer would likely want
to balance with the wholesale contracts it has with producers.
In practice, while pursuit of restructuring in the three activities has been regionally corre-
lated, many areas have developed generation restructuring without retail competition. And
independent transmission operators have taken over large swaths of the U.S. grid in which
both generation and retail competition varies greatly.
A. Transmission Access Reforms
Transmission restructuring proceeded along two paths, a regulatory path that attempted
to impose rules upon vertically-integrated utilities that would promote third party accessELECTRICITY RESTRUCTURING 5
to their networks, and an institutional path that encouraged the creation of Independent
System Operators (ISOs) and later Regional Transmission Organizations (RTOs).3 FERC
attempted through a series of orders during the 1990s and 2000s to force the creation of
more transparent online market places for available transmission capacity and to require
vertically integrated utilities to provide transmission service to third-party independent
power producers. These efforts have achieved at best mixed success.
The more successful path to nondiscriminatory grid access appears to have been the cre-
ation of the RTO/ISO. These entities are organized as user-supported non-profit companies
and operate essentially as regulated entities overseen by FERC. In the U.S. these trans-
mission companies do not own the transmission assets in their jurisdiction, but rather they
control access to those assets by virtue of approving, and in some cases setting, the pro-
duction schedules of the power plants within their regions, as well as operating real-time
balancing markets that adjust supply as needed to maintain network reliability. In each
case, the decisions made by the ISOs with regards to generation operations are dominated
by a mandate to respect the constraints of the transmission network and other reliability
considerations. Unlike the vertically integrated network entities, ISOs have no generation
assets or retail consumers, and are therefore credibly impartial as to specific market out-
comes as long those outcomes do not threaten reliability.4
Initially the RTO/ISO model was largely restricted to markets undertaking the full suite
of restructuring steps described in this section. The full and unfettered access of disparate
power producers to the available population of electricity customers dictated an institutional
structure that would eliminate concerns over vertical barriers. Conversely, jurisdictions that
wanted no part of retail competition were equally suspicious of the RTO/ISO structure as
an initial step down the slippery slope to full restructuring. Thus, many municipal utilities
and some of the largest and strongest integrated utilities, as well as the Federal Marketing
Agencies, kept their transmission systems organized along traditional structures in which
they directly controlled access and real-time use.
This changed in the latter half of the 2000s. As we discuss below, the pressures to restruc-
ture other aspects of utility operations receded in many regions, so joining an RTO/ISO
market no longer implied the inevitable dissolution of the traditional utility franchise. At
the same time, the benefits of better coordination of operations and lowering of transactions
costs within ISOs appear to have been substantial.5 Figure 1 illustrates the geographic reach
of North American ISOs and RTOs as of 2012. Currently, RTOs such as the Midcontinent
Independent System Operator, Southwest Power Pool, and PJM each contain several states
that never seriously considered restructuring their generation or retail sectors.
The creation and expansion of the RTO/ISO model may be the single most unambiguous
success of the restructuring era in the United States. The U.S. has historically suffered
3 Both types of organizations are tasked by FERC to coordinate investment and operations of regional power grids
in a non-discriminatory transparent manner.
4 Indeed, RTO/ISOs have at times been criticized as being too exclusively focused on reliability and not sufficiently
concerned with the costs their instructions and mandates place on the customers and generators operating within
their systems. It is true that the performance of ISOs is generally measured in terms of the reliability of their systems
and the costs of the relatively narrow scope of operations directly housed within ISOs, rather than on the indirect
effects their decisions may have on productivity and prices.
5 See Joskow (2006), Wolak (2011a), and Mansur and White (2012).6
Figure 1. U.S. ISOs and RTOs as of 2012
from a utility system that was highly balkanized relative to most other countries. The
evidence suggests that the lack of coordination across utility control areas impeded Pareto-
improving trades worth billions of dollars.6 Although the early momentum for aggregating
utility control areas into more regionally managed RTOs was provided by it being seen as a
necessary step toward the ultimate goal of deregulating generation and retail, the expansion
of the RTO structure has come to be viewed as a valuable legacy of this period even for
states that never showed serious interest in these other aspects of restructuring.
B. Restructuring of Generation Ownership
The second dimension of restructuring impacted the ownership status and remuneration
of generation assets. Large amounts of generation capacity were converted from utility
status to independent power producer (non-utility or “merchant”) status. Effectively, these
assets transitioned from a cost-of -service regulation model, in which they were compensated
based upon average production cost, to a market-based pricing model, under which these
assets earned a market price for the output they were able to produce.
To the extent one considers the electric sector to be “deregulated,” it is due to this
fundamental shift in the paradigm for compensating owners of generation. In addition
to the divestiture of much of the existing generation fleet previously owned by IOUs in
restructured states, an equally dramatic change impacted the investment in new generation.
The construction of generation assets was no longer coupled with a guarantee to recover a
positive return on those capital costs. In 1997 only 1.6% of U.S. electricity was produced
by generation owned by firms classified as Independent Power Producers. That figure rose
6 See White (1995), Joskow(1997), Kleit and Reitzes (2008), and Mansur and White (2012).ELECTRICITY RESTRUCTURING 7
to 25% by 2002 and was just under 35% in 2012. The share of nuclear generation owned by
IPPs rose from zero in 1997 to almost 50% in 2012, as utilities sold off their nuclear assets.
Figure 2. Share of Output from Merchant Generators in 2012
Figure 2 displays the diversity of ownership patterns across the U.S. as of 2012 and
illustrates the strong regional pattern of generation restructuring. The Southeast, with its
large and regionally powerful IOUs, and much of the Pacific Northwest, with its dominance
of federally operated generation and municipal utilities, have largely resisted changes in
generation ownership. Importantly these regions also enjoyed amongst the lowest average
retail rates in the country in 1997. The Northeast and Illinois have almost fully transitioned
to a non-utility form of ownership, while Texas, California and Montana have also seen large
shares of IPPs.
As we will discuss below, we consider this dimension of restructuring to be the most
economically meaningful in its consequence. This is mainly because the majority of costs
still reside in the generation sector and the fact that the most potential variation in costs
and prices resides in this sector.
Political attitudes toward the effects of restructuring during the last 20 years have also
been dominated by outcomes in the generation sector. These attitudes can largely be
captured by comparing average to marginal costs.
In the early 1990s, just prior to the initial years of restructuring, much of the country
experienced large generation reserve margins (see Figure 3). Until the last few years (with
the rise of intermittent renewable generation), this statistic was a very good proxy for mea-
suring the efficient deployment of capital. Larger reserve margins generally imply installed
capacity (and capital) that is underutilized. Lower utilization implies higher average costs
as the capital expenditures are spread across a smaller consumer base. Lower utilization
rates also often implied that generation with relatively low marginal cost was often available,
and marginal, thereby contributing to relatively low regional wholesale prices. Historically8
low natural gas prices during the 1990s also greatly contributed to low regional wholesale
prices.
.3
.25
Reserve Margin
.1 .15
.05
0 .2
1990 1995 2000 2005 2010
Year
National Average Northeast
Midwest Texas
West Southeast
Figure 3. Generation Reserve Margins
The industry during the late 1990s was therefore experiencing very high reserve margins,
leading to unusually low marginal costs and unusually high average costs. This is the
fundamental source of the pressure for restructuring. While, as discussed above, much
of the rhetoric at the time focused on retail deregulation, this needs to be seen from the
perspective of customers (often large industrial customers) who saw great opportunity in
being able to gain “direct access” to the wholesale market. 7
Of course, what appeared as a great opportunity for customers conversely created a real
threat to utilities who were the residual claimants on generation assets for which the market
value in a competitive wholesale market would have been well below the depreciated capi-
tal value that remained on the utilities’ books at the time of restructuring. This fact was
quickly internalized by equity markets. Share prices of the largest utilities in California,
Pennsylvania, and New England all experienced sharp declines during the mid-1990s. The
concern among holders of utility stocks soon gave way to a period of reflection and negotia-
tion over an acceptable transition from an average-cost to market-based pricing paradigm.
The political and regulatory process was forced to confront the uncomfortable fact that
much of the consumer appeal of restructuring was rooted not in cost savings and produc-
tivity gains, but rather in an opportunity to shift responsibility for paying the sunk costs
of what were considered uneconomic “stranded assets.” This meant that immediate con-
7 In Borenstein and Bushnell (2000), we pointed out this tension between efficient economic decision making and
incentives for rent shifting.ELECTRICITY RESTRUCTURING 9
sumer savings were largely dependent upon an equivalent reduction in returns for utility
shareholders. This is an important theme we will return to when we examine the current
rhetoric about the “utility of the future.”
In the end, utilities in all restructuring states persuaded regulators that the implicit agree-
ment between the regulator and the IOU (commonly refered to as a “regulatory compact”)
required that the utility be made whole for any lost asset value from restructuring. Nearly
all the generation assets with market value below the IOU’s remaining book value had been
built with the approval, and in some cases mandate, of regulatory commissions,8 so it was
generally concluded that to force restructuring without compensation for stranded assets
would violate the regulatory compact. Most state restructuring schemes included a plan for
100% recovery by utilities of any stranded investment and the others aimed at nearly 100%
recovery.
The most common mechanism for recovering stranded cost was to allow a transition pe-
riod in which portions of utility retail prices would be frozen at what were then considered
to be above-market rates during a transition period. Utilities would therefore be allowed
to apply these excess retail margins to pay down the stranded costs on their divested and
retained generation assets. This approach produced devastating consequences for California
where the excess retail margins suddenly turned negative and caused the 2000-01 California
electricity crisis.9 In order to avoid conflict between the goals of fostering retail competition
and recovery of stranded costs, these competition transition charges were generally applied
as surcharges to the bills of distribution companies who maintained a monopoly franchise
over the wires components of the business. Therefore, somewhat ironically, while the cus-
tomer impetus that started electricity restructuring was a desire to avoid paying for high
average costs during a period when marginal costs were lower, the transition charges largely
guaranteed that utilities recovered something close to those costs anyway.
C. Restructuring and Reform of Retail Services
The aspect of restructuring to receive the most rhetorical attention and market hype was
the relaxing of the utility monopoly franchise over retailing. Phrases evoking liberty and
freedom, such as “customer choice” and “freedom to choose” were rhetorical staples of the
restructuring process. There was also much hope that electricity retail competition might
spur innovation in retail services in the way that it had for telecommunications. Exactly
how this was supposed to be achieved was never clear.10 Electricity service has proven to
be less amenable to the sorts of usage and complementary product innovation that wired
8 In addition to generation assets operated by utilities, stranded assets in several states included uneconomic long-
term contracts with IPPs that were mostly mandated by PUCs under the Public Utilities Regulatory Power Act of
1978. See White (1996).
9 Through a combination of real scarcity and generator market power (caused in part by high local natural gas
prices that followed a pipeline explosion), California wholesale electricity prices skyrocketed in summer 2000 and
remained extremely high into May of 2001. Under the competition transition plan, the two largest utilities in the
state were not allowed to raise retail rates to reflect the high wholesale prices. One of them, Pacific Gas & Electric, was
forced into bankruptcy and the other, Southern California Edison nearly followed. For detailed discussions of these
events, see Joskow (2001), Blumstein, Friedman and Green (2002), Borenstein (2002), Wolak (2003b), and Bushnell
(2004).
10 See Joskow’s (2000) discussion of the potential for new product innovation under electricity restructuring.10
telecom service experienced in the 1980s and 1990s. Perhaps this isn’t surprising given
that the product is so narrow – just the electricity, not any devices that use it – and so
homogeneous. In order to use the grid, electricity must meet exact specifications that make
one provider’s product indistinguishable from another’s. The place where innovation did
seem valuable and likely to occur with retail choice was in financial arrangements: price
schedules, payment plans, and options to bundle purchases with complementary products.
More concretely, retail restructuring involved giving customers access to new “energy-
only” retail providers who produced or acquired wholesale power for sale to end users.
The incumbent utility (and the grid operator) maintained a franchise over distribution
and transmission related functions. In many cases the incumbent utility was allowed to
continue to offer a default “bundled” retail rate for customers who did not switch retailers.11
Customers who did switch received a bill for “energy-only” service from the third-party
retailer they chose, and a separate charge, intended to recover transmission and distribution
system investments made by the incumbent utility.
Figure 4. Share of Retail Sales from Retail Power Marketers
The extent to which this transformation has materialized has varied greatly around the
U.S. Figure 4 illustrates the fraction of total sales in each state from entities with an
ownership classification of ’retail power marketer.’12 Texas has far outstripped the rest of
the country on the retail competition front, with the only other significant activity clustered
in the Northeast.
11 The bundled rate combined energy with the incumbent utility’s transmission, distribution and retailing charge.
This was sometimes called the “default provider” or “provider of last resort” (or POLR) rate. In some states, the
default provider franchisee is selected through auctions overseen by local regulators.
12 These data are compiled from EIA form 861.ELECTRICITY RESTRUCTURING 11 Retail Price Reform. — To understand the potential for efficiency improvements in pricing electricity, it helps to review the inefficiency concerns raised by the typical 1990s electricity retail tariff. Throughout most of the history of electric utilities, retail pricing policy has been driven more by equity than efficiency considerations. Because customers had little alternative to the monopoly utility provider, and the utility was focused on satis- fying the terms of cost-of-service regulation more than maximizing profits, there was little initiative to improve the efficiency of pricing. However, with greater competition and de- mand elasticity – from non-utility energy sources and retail suppliers, and more recently from improved opportunities to generate electricity on the customer side of the meter – the pressure to align prices with marginal costs has grown. Efficient retail prices should reflect the short-run marginal cost in every hourly (or even shorter) time period at every location on the grid. At the beginning of restructuring, nearly all residential, commercial and industrial customers faced prices that did not vary hour to hour. Furthermore, utilities recovered nearly all of their costs through volumetric charges, including the substantial share of costs that are fixed with respect to a customer’s marginal consumption. For most residential customers, the rate was a simple constant price per kilowatt-hour (kWh) consumed, regardless of when the energy was used, set to cover all the utility’s costs, variable and fixed.13 Setting price equal to short-run time-specific and location-specific marginal cost leads to efficient consumption given the level of investment, but only under a very narrow set of conditions does it exactly cover total costs.14 In reality, there are almost certainly some costs that scale less than proportionally with the total quantity sold, so efficient marginal pricing would result in a revenue shortfall. A fixed charge can be used to capture the additional needed revenue. A fixed charge (per month, for instance) is particularly efficient in residential electricity markets because the elasticity of connecting to the grid with respect to the monthly fixed charge is likely near zero over a wide range of charges. Thus, the deadweight loss that could result if some customers chose to consume zero because the fixed charge exceeds their consumer surplus is likely to be small. For basically the same reason, however, the distributional consequences of a fixed charge are of great concern. Moving from a flat volumetric rate and no fixed charge to a lower flat rate and a fixed charge is very regressive. Borenstein (2011) shows that such a revenue- neutral change to a higher fixed charge and lower volumetric rate would raise the average bills of low-income customers by 69% to 92% of the fixed charge across the three large investor-owned utilities in California. Equity notions often suggest that the fairest alloca- tion of such a revenue requirement would be in proportion to quantity consumed.15 That approach, however, steers back towards average cost pricing and the inefficiencies that it is known to produce. The problem of average cost pricing is exacerbated in the electricity industry by the na- 13 Borenstein and Holland (2007) show that the break-even flat price could be higher or lower than the second-best optimal flat rate, depending on whether peak or off-peak price elasticities are higher. 14 Under constant returns to scale, optimal pricing covers costs if capacity is also set optimally. If capacity is greater than the optimum level, optimal pricing will generate less revenue than is needed to cover total costs. 15 Or, if data were available, in proportion to consumer surplus gained by each customer.
12

ture of the contract between the retail provider and the customer. In nearly all cases, the
customer has an option, but not an obligation, to purchase any quantity at the announced
price, known in the industry as a “requirements contract.” This in itself wouldn’t be a
destabalizing force if price adjusted quickly,16 but with long lags between cost changes and
price adjustment, this creates an opportunity for buyers to switch between alternative sup-
pliers inefficiently. This is the same phenomenon as described earlier for the state decision
to deregulate, but manifest in contemporaneous customer choice among competing sources.
The combination of requirements contracts and average-cost retail pricing could create in-
creasing problems if distributed generation (“behind the meter”) continues to expand, as
we discuss below.
  Thus, as restructuring began 20 years ago, retail pricing deviated considerably from the
ideal efficient structure. It seemed at least possible that competitive pressure on the existing
structure would lead to substantial changes in pricing, and the potential for differentiation
among the products retailers sold. The technological and market configuration, however,
turned out to leave much less space for pricing innovation than was suggested at the time.
  The principle technological constraint was metering: in the 1990s, virtually all residential
customers, and most commercial and industrial customers, had meters that recorded only
the aggregate amount of electricity that had flowed through them. They did not have the
capability to collect information on when the electricity was consumed. This meant that
time-varying pricing wasn’t feasible without a significant investment in metering. Nor could
a retailer necessarily overcome this constraint just by metering its own customers, because
the arrangements for billing and payments among retailers and the utility providing distri-
bution services were generally not set up to accommodate time-varying pricing. Instead, in
most cases a retailer was deemed responsible for providing power to its customers – either
generating it, signing long-term contracts, or buying on the spot market – based on a stan-
dard assumed “load shape” (a time-varying pattern of consumption) that was applied to all
customers within broad location, customer type, and sometimes size, classes. The assumed
load shape was independent of the prices the customer faced, so the retailer had no incentive
to charge time-varying prices. With the expansion of smart meters in the late 2000s, the
groundwork is now being laid for broader use of time-varying pricing, but the vast majority
of residential customers with non-utility retail providers still see no time-variation in the
prices they pay. Commercial and industrial customers have experienced a much greater
shift towards time-of-use pricing, which entails two or three different pre-set prices that
apply at different times of the week. TOU pricing, however, is known to capture a small
share of the hourly variation in wholesale electricity prices.17
  A second way in which retailers might have offered greater differentiation was in reliability,
but this too was undermined by the structure of the retail markets that were established.
Because the grid operator must always balance supply and demand to avoid service dis-
ruptions, the grid operators in these markets procured enough reserves to make sure that
the full expected demand could be met. If one retailer did not procure sufficient supplies

  16 In a sense, sellers in any commodity market operate under requirements contracts, at least over a large range of
purchase quantity, but they can and do change prices rapidly as market conditions change.
  17 See Borenstein (2005).
ELECTRICITY RESTRUCTURING                                     13

to meet its retail demand obligation, the result was not reduced supply to the customers
of that retailer – as would occur with nearly any other product. Instead, the grid operator
drew on its reserves to make sure all demand was met. The cost of those reserves was spread
over all retail quantities whether or not the provider to a particular customer ever caused
the grid operator to need those reserves. Reliability was assured by the grid operator and
charged to every kWh supplied, so there could be no differentiation on reliability. Alterna-
tive arrangements – in which the customer either lost power when its supplier had procured
insufficient quantities (which posed technological challenges along the same lines as real-
time metering) or the retailer or customer were charged a very high fee for running short of
delivered electricity – would have created a significant cost for insufficient supply and likely
led to greater product differentiation along these lines, but these weren’t widely adopted.
The lack of retailer responsibility for reliability also undermines the incentive to implement
price-responsive demand, which could be a valuable tool for a retailer in balancing its supply
and demand while keeping costs down.
  Reliability differentiation also could extend to the ramifications of exit by the retailer. If
a retailer exits the market, what cost is borne by its customers? If customers can easily
switch to another supplier at a pre-determined rate, then a similar moral hazard problem
arises in which a retailer can procure short-term power at spot prices when that price is low,
but exit if the spot price rises, leaving the customer to switch to some default rate. If that
default rate is a price that reflects average procurement costs over a longer period, then once
again the variation in average versus marginal price drives behavior in the market. Enron
and some other retail providers in California took this path when prices in the California
wholesale market spiked in 2000. In Texas, which has the most extensive retail residential
competition (see figure 4), rules have been adjusted so that customers of a retail provider
that exits are moved, by default, to a tariff that reflects the contemporaneous marginal cost
of procuring power.

           III.   Electricity Market Performance Since Restructuring Began

  Electricity restructuring’s most consequential economic changes took place on the whole-
sale production and marketing sectors of the industry. We therefore begin by discussing
the evolution of the industry since 1997 at the wholesale level. As discussed above, formal
centralized markets only formed in the parts of the country that embraced the RTO/ISO
structure, which were also the areas with the highest prices and for which the average cost
exceeded marginal cost by the largest amount.

                                    A.   Wholesale Markets

  The regions with RTO/ISOs are also the markets for which the best data on wholesale
prices are available. Figure 5 summarizes annual average prices from two data sources.
For 1998 through 2001 we use data from Bushnell, Mansur and Saravia (2008), which are
drawn from ISO websites. For 2001 on, we report data from the Intercontinental Exchange
(ICE) for trading hubs in Southern California (SP15), western Pennsylvania (PJM) Mas-
sachusetts (ISO-NE) and the Pacific Northwest (Mid C) hubs. The dashed line in figure 5
14
summarizes the U.S. average city gate natural gas price, taken from the Energy Information
Administration.
10
100
8
80
Elec. Prices ($/MWh)
Nat. Gas ($/MCF)
6
40 60
4
20
2
0
0
1998 2000 2002 2004 2006 2008 2010 2012
Year
New England So. California
West Penn. Pac. northwest
Natural Gas
1998−2000 are ISO hourly average prices. 2001−2013 are ICE peak power contracts.
Figure 5. Wholesale Electricity and Citygate Natural Gas Prices
Since 1998, two facts are worth noting. First, although somewhat muted by the annual ag-
gregation in the data, the California market stands out as suffering from sustained extremely
high price levels during the 2000-2001 period. Both academic research and subsequent reg-
ulatory findings have determined that this market suffered from a lack of competition made
acute by a combination of tightening capacity and a near total absence of forward contract-
ing.18 Second, in the other markets wholesale power market prices are dominated by natural
gas prices, though somewhat less so in the Pacific Northwest. This is consistent with the
general fact that natural gas fired generation units are the marginal source of power in most
markets during most times, but the Pacific Northwest is influenced more by the availability
of hydro-electric power.
Because gas generation comprises a minority share in most electricity markets, under
average-cost based regulation it did not dominate rate making. Prices for deregulated
generation, however, are driven by the marginal producer, which is much more commonly
gas generation. Thus to a degree that was not appreciated at the time, restructuring of
generation greatly increased the exposure of electricity rates to natural gas costs, even if
a fairly small share of electricity was sourced from gas-fired plants. As natural gas prices
nearly tripled during the first half of the 2000s, the impact on retail rates and the rents
created for infra-marginal generation were far greater than they would have been under
18 See Borenstein (2002), Borenstein, Bushnell and Wolak (2002), Joskow and Kahn (2002), Wolak (2003a), Bush-
nell(2004) and Puller (2007).ELECTRICITY RESTRUCTURING 15
regulation.
During 2006 and 2008 the U.S. natural gas price peaked above $11/MMBTU. The higher
gas prices drove up generation costs and power market prices. By this time, the relationship
between marginal and average costs of power production had again reversed so that marginal
cost-based market prices were higher than the average costs of operating and producing
from a mixed generation portfolio. Many of the nuclear and coal-fired power plants in
restructured states, which had been considered “stranded” assets in the late 1990s, were
by 2007 tremendously profitable due to their low operating costs and the relatively high
market prices they earned for their output.
The combination of higher prices and healthy profits earned by power producers in restruc-
tured states contributed to a strong dissatisfaction with restructuring in several states.19
This mood of ex-post regret in restructured states peaked in 2007-2008. States such as
Illinois, Maryland and Maine initiated proceedings that were characterized as rolling back
deregulation.20 After 2009, however, with plummeting natural gas prices and increasing
reserve margins, momentum for significant changes dissipated.
B. Restructuring and Plant Operations
One aspect of restructuring that has been studied at a micro level has been its impact
on the performance and efficiency of power plants. Overall the results point to a positive
influence of restructuring on the operations of plants. Unfortunately, while cost data on
regulated plants are extensive, there is much less data available on the costs of non-utility
generation. Thus, studies of plant-level impacts of restructuring have either focused on its
impact on regulated plants or were limited to a focus on the few performance variables
that continue to be reported for deregulated plants. Fabrizio, Rose, and Wolfram (2007)
compared the performance of regulated plants in states that pursued restructuring (by the
Energy Information Administration’s definition, which we discuss further below) against
regulated plants in states that did not initiate restructuring, and against publicly owned
plants in both types of states. They find modest efficiency gains in the restructured states,
much of these focused on employment and labor productivity. There is some evidence
that the efficiency of fuel consumption, the largest single variable expense in power plants,
can be influenced by incentives and skill,21 but to date the evidence on fuel efficiency at
restructured plants has been inconclusive.
The most dramatic documented impact of restructuring on power plant operations has
been on the performance of nuclear plants, shown by Davis and Wolfram (2012). Almost
half of the nuclear generation plants in the U.S. were divested to non-utility producers since
1998.22 Davis and Wolfram show that industrywide U.S. nuclear power plants have greatly
increased capacity factors since 1998, but relative to their regulated counter-parts, output
at the restructured plants increased 10 percent between 1998 and 2010. They estimate this
19 See Johnston (2007).
20 See Sharp (2007) and Behr (2009).
21 See Bushnell and Wolfram (2009)
22 Since 1998, no new nuclear plants have come online.16
additional output has a market value of $2.5 billion dollars annually.23
C. Restructuring and Retail Prices
It is useful to begin a review of retail prices under deregulation by examining conditions
in 2007, when dissatisfaction with restructuring peaked. In 2007, the New York Times ran
a series of articles highlighting the fact that rates had risen faster in restructured states
than in regulated ones. The articles cited studies that relied upon average retail price data
reported to the Energy Information Administration and essentially performed a difference
in difference comparison between restructured and non-restructured states.24
A central challenge in studies like this is to identify what constitutes “restructured” in
order to assign a state to one category or the other. Many papers have relied upon the
Energy Information Administration’s definition, which is focused on the status of retail
competition. An alternative measure of restructured is based upon the fraction of energy
generated in a state that is produced by Independent Power Producers (IPP). Figure 2
illustrates these values for 2012, but we can apply the full panel of values to capture the
underlying points of transition in each state.
As one examines recent data on retail rates, it is clear that many of the conditions of 2007
have since dramatically reversed. Table 1 summarizes the average retail rates in states con-
sidered “restructured” according to two alternative measures against those that remained
under traditional regulation25 The first measure is the one used in a study by Showalter
(2007) for Power in the Public Interest (PPI) that is cited in the NY Times article. This
definition excludes from the restructured category states such as Illinois and Pennsylvania
which by 2012 have almost all of their energy provided from non-utility sources. As an
alternative measure, we assign states to the restructured category if they had more than
40% of their energy provided by non-utility sources in 2012.26
From Table 1 one can see that at this level of analysis the definition of restructured
makes only a small difference. The time period examined, however, makes an enormous
difference as rates in restructured states increased at a pace nearly 50% higher than those
in non-restructured states between 1997 and 2007 but have actually declined slightly since
2007. Average rates in states that did not restructure have continued to increase since
2007, though at a slightly lower pace than between 1998-2007. Overall there is almost
no difference in the change in average rates for the two groups over the full sample from
1998-2012.
Figure 6 illustrates the annual levels of rates in restructured and non-restructured states
using our generation-based definition, along with the national average city gate natural gas
23 Hausman (2014) concludes that the gains in utilization were not accompanied by degradation of safety among
deregulated plants.
24 See Showalter (2007) and Tierney (2007).
25 Retail price data come from the EIA form 861, which report sales and revenues by utility. We examine the
average rate across all major rate categories, including residential, industrial and commercial. Several previous
studies, including Showalter (2007) and Apt (2005) have focused on rates paid by industrial customers.
26 The NY Times article lists the restructured states as CA, CT, DC, DE, MA, MD, ME, MI, MT, NH, NJ, NY,
RI, and TX. Our generation-based definition puts CA, CT, DE, IL, MA, MD, ME, MT, NH, NJ, OH, PA, NY, RI,
TX, and VT into the restructured category.ELECTRICITY RESTRUCTURING 17
Table 1—Summary of Retail Price Changes
Definition Status
Average Retail Price Percent Change
1997 2007 2012 97 to 07 07 to 12 98 to 12
PPI Definition Not Restructured 5.89 7.44 8.72 0.21 0.15 0.32
Restructured 8.96 12.53 12.35 0.29 -0.01 0.27
At least 40% Not Restructured 5.67 7.23 8.57 0.22 0.16 0.34
IPP in 2012 Restructured 8.83 11.99 11.95 0.26 0.00 0.26
price. Restructured states experienced higher rates during the 1990s, a major factor in their
election to adopt restructuring. The gap between traditionally regulated and restructured
states narrows around 1998, reflecting the impact of legislation that required immediate rate
reductions accompany restructuring in several states. Since that time, rates in restructured
states more closely follow the trajectory of gas prices up during the early 2000s and back
down since then.
12
Retail Electric and Citygate Gas Price
2 4 6 0 8 10
1990 1995 2000 2005 2010
Year
Non−restructured States Restructured States
Elec. Price Difference Natural Gas Price ($/MCF)
Figure 6. U.S. Average Retail Rates and Natural Gas Prices
To further test this relationship between natural gas prices, restructuring and electricity
rates we estimate the following regression on state level annual changes in electricity prices
and city-gate natural gas prices.
(1) ∆Elecs,t = α + β1 F ractionIP Ps,t + β2 ∆N Gass,t + β3 F ractionIP Ps,t ∗ ∆N Gs,t ,18
where ∆Elecst = ln(Rates,t ) − ln(Rates,t−1 ) and ∆N Gass,t = ln(N G CityGates,t ) −
ln(N G CityGates,t−1 ) are the annual changes in log state average electricity rates, and log
state average city-gate natural gas prices, respectively. We estimate for 1998 (the change
from 1997) to 2012. Table 2 presents the summary statistics for these variables in the years
1997 and 2012.27 We estimate (1) clustering standard errors at the state level.
Table 2—Summary Statistics of Retail Electric and Natural Gas Prices
Variable Mean S.D. Min Max
Data for 1997
Variable Mean S.D. Min Max
Price 6.72 2.03 3.87 11.66
Fraction IPP 0.03 0.07 0.00 0.46
Nat. Gas 3.54 0.64 2.12 5.18
Data for 2012
Price 9.70 2.30 6.90 15.54
Fraction IPP 0.35 0.33 0.00 0.99
Nat. Gas 4.90 0.97 3.46 7.73
The results of regression (1) are reported in table 3. As table 1 suggests, restructuring,
which we are representing with fraction of energy generation from non-utility sources in
that year (F raction IP P ), has no statistically discernible effect on average changes in
rates over the 1997 to 2012 period. The point estimate implies that a state with 100%
merchant generation has a 0.6% higher average annual rate increase, but one cannot reject
no effect at conventional significance levels. Changes in local natural gas prices, however,
do influence rates. The second column of table 3 suggests that a 1% increase in natural
gas prices implies a 5% increase in electricity prices on its own. The third column in the
table yields greater clarity on the mechanism. When the change in natural gas price is
interacted with the F raction IP P , the results suggests that the effect of natural gas is
much greater in restructured states as the earlier discussion would suggest. The influence
of natural gas price on retail rates is estimated to be nearly twice as large in a state with all
merchant generation than in a state with none. The effect of natural gas prices in a state
with no merchant generation is not statistically significant, while the interacted effect with
F raction IP P is highly significant.
We do not intend this to be an exhaustive analysis of the drivers of retail prices.28 How-
ever these data are strongly supportive of the argument that, apart from the California
electricity crisis, any harm that electricity restructuring has done to consumers was a side-
effect of changes in the price of natural gas. In restructured markets, natural gas generation
27 Both time series are from the Energy Information Administration. Electricity rates are the
“Total Electric Industry” average price across all customer classes, per state, as reported at
http://www.eia.gov/electricity/data/state/ and derived from EIA form 861 data. Natural Gas prices are available at
http://www.eia.gov/dnav/ng/ng pri sum dcu nus a.htm, and derived from EIA form 857 data.
28 Others such as Apt (2005) and Taber, Chapman and Mount (2006) have performed more extensive exercises, but
only utilizing data during the early years of restructuring.ELECTRICITY RESTRUCTURING 19
Table 3—Analysis of Retail Price Changes
1 2 3
Pct IPP 0.006 0.007 0.006
(0.005) (0.005) (0.005)
Pct Change in 0.051 0.023
Nat. Gas (0.016) (0.016)
∆NGasxPctIPP NA 0.018
(0.005)
N 720 720 720
Dependent variable is change in log annual state-level average electric-
ity rates. Standard Errors are clustered by state.
determines market prices and therefore the remuneration for all the non-utility assets. The
more non-utility assets featured in a state’s generation mix, the more exposed that state is
to the natural gas market.
Simply put, restructuring in the U.S. was in hindsight very poorly timed. Assets that
were viewed as stranded in 1998 were sold as white elephants at prices far below what they
would have fetched in 2007. Conversely, large customers in the 1990s were motivated by low
wholesale prices to push for restructuring, but the switch to market pricing, which increased
their exposure to the natural gas market, came just as natural gas price increases starting
a long climb up to a peak in 2007. This timing is not coincidental: the same factors that
contributed to the low valuation of utility assets in the late 1990s (low wholesale prices)
were the ones that made the prospect of restructuring so appealing to customers and policy
makers.
D. The Evolution of Retail Price Structures
Unfortunately, data on retail price structures are much less available than data on average
retail price levels. Nonetheless, it is clear that there has been gradual movement towards
time-varying pricing, primarily for commercial and industrial customers. In the last decade
– partially in response to funding from the 2009 American Recovery and Reinvestment
Act (ARRA) – many utilities have rolled out so-called “smart meters” to even residential
customers. Estimates vary, but by 2013 it is likely that more than 40% of all customers in
the U.S. had smart meters.29
These meters record total electricity consumption in hourly or shorter periods, and can fa-
cilitate much wider use of pricing that changes frequently to reflect real-time supply/demand
balance, known as dynamic pricing.30 So far, such granular and timely pricing has appeared
for only a narrow slice of large industrial and commercial customers, but with smart meters
29 See FERC (2013).
30 The meters also communicate information to the utility without onsite visit by a meter reader. Savings on meter
reading labor have been the largest benefits projected by utility installing smart meters.20
now in place, most of the financial cost of dynamic pricing down to even residential cus-
tomers has been sunk. Still, there remains substantial resistance to dynamic pricing among
residential consumers and groups that represent them. Data from a 2012 EIA survey of
utilities suggest that only a few percent of customers are on tariffs that have any dynamic
pricing component.31
Of course, the efficiency gain from dynamic pricing depends on the ability and willingness
of customers to respond to those prices. Opponents have generally argued that households
won’t pay the attention necessary to adjust thermostat settings, washer/dryer use, and
other electricity-consuming activities in response to dynamic prices. Simple calculations,
such as in Borenstein (2013), show that the financial gain from paying attention to such
price fluctuations has been modest. Still, increased penetration of intermittent generation
resources (wind and solar) is likely to increase wholesale price volatility and raise the social
return to such attention, while automation is likely to continue lowering the cost of the
necessary attention.
A very large literature has now developed using randomized control trials, randomized
encouragement designs and quasi-experiments to analyze just how much consumers do re-
spond to dynamic pricing. The evidence is fairly consistent that even without automation,
customers respond significantly on average, though with a fairly small elasticity, generally
estimated to be in the -0.1 to -0.2 range.32 The research suggests that the larger elasticities
result from interventions that include technology to convey information, such as emails,
text messages, and in-home electricity usage displays.
The literature on elasticity with automated demand response is much thinner; it is pretty
much non-existent in economics outlets. But programmable controllable thermostats –
which can permit a person to automate response to a price or other warning signal or allow
an authorized third party to do so – have been in use for more than a decade. Industry
publications suggest these technologies greatly increase potential demand response.33
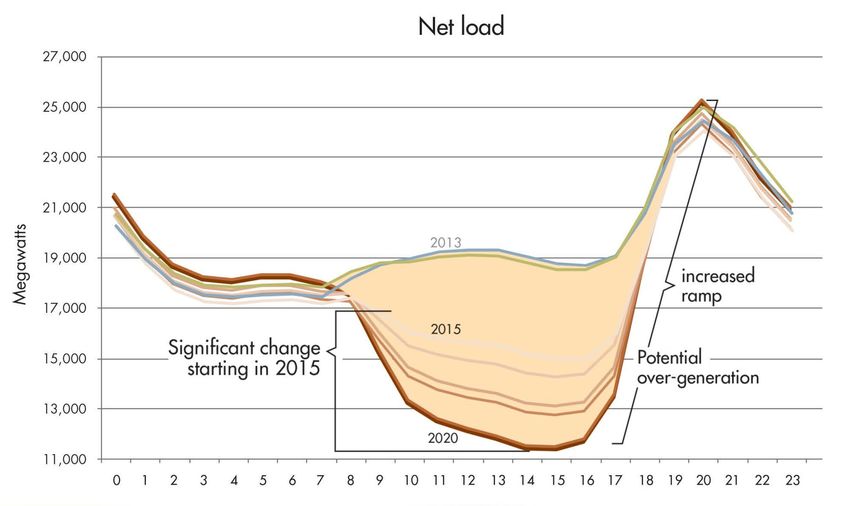
IV. The Next 20 Years
After a tumultuous period from 1996 to 2005, the regulatory/legal status of electricity
restructuring – in generation, transmission, distribution and retailing – has changed little
in the last decade. In recent years, however, the continuing evolution in technology and in
environmental concerns has disrupted the industry in new ways. These changes are ongoing
and are likely to continue for many years.
The greatest change occurring in electricity markets today – and likely going forward for
many years – is the increased recognition of environmental costs of electricity generation,
most notably (but not exclusively) greenhouse gas emissions. Environmental issues have
played a significant role in electricity for decades, but most of the emphasis in past years
was on limiting the local air and water pollution from traditional generation sources. Of
course, appropriate pricing of the environmental externalities – either through a tax or a
31 See FERC (2013) and EIA Form 861.
32 See Jessoe and Rapson (2014), Ito (2014), and Wolak (2011b).
33 See Faruqui and George (2002).You can also read