The macroeconomic impacts of alternative scenarios to meet Eskom's five-year revenue requirement - NERSA
←
→
Page content transcription
If your browser does not render page correctly, please read the page content below

The macroeconomic impacts of
alternative scenarios to meet Eskom’s
five-year revenue requirement

Report prepared for Eskom Holdings SOC Ltd
Date: 06 June 2017
Disclaimer
This Report is prepared by Deloitte Consulting Pty (Ltd). ‘Deloitte’ who was engaged by Eskom Holdings SOC Ltd.
‘Eskom’. Deloitte does not accept any duty of care, to any other person or entity other than Eskom. The Report has been
prepared for the purpose set out in the Engagement Letter between Deloitte and Eskom.

Deloitte understands that Eskom will potentially provide a copy of this Report to the National Energy Regulator of South
Africa (NERSA) in support of their upcoming tariff application. We agree that a copy of our Report can be provided to
NERSA and also released publicly on the basis that it is published for general information only and that we do not accept
any duty, liability, or responsibility to any person (other than Eskom) in relation to this Report.

Recipients of this Report should seek independent expert advice as this report was not prepared for them or for any other
purpose than that detailed in the engagement terms with Eskom and cannot be relied upon other than for this.

This report is based largely on publically available information. We have not audited the information, nor do we provide
any assurance on the underlying information or the analysis thereof.

Information contained in the Report is current as at the date of the Report, and may not reflect any event or circumstances
which occur after the date of the Report.

1
The macroeconomic impacts of alternative scenarios to meet Eskom’s five-year revenue requirement | Contents

Contents

Contents ..................................................................................................................................... 2
List of Tables .............................................................................................................................. 3
List of Figures ............................................................................................................................. 4
Executive summary .................................................................................................................... 5
     Introduction ...................................................................................................................... 18

    1.1      Background and context .............................................................................................           18
    1.2      Purpose of this study ..................................................................................................       20
    1.3      Contributors to the study ............................................................................................         21
    1.4      Structure of the report ................................................................................................       21

      Exploring the alternatives available to Eskom to meet its revenue requirement ................ 22

    2.1      Introduction................................................................................................................   22
    2.2      Options to meet the revenue requirement ..................................................................                     22
    2.3      Description of Option 1: Cost-reflective tariff increases .............................................                        22
    2.4      Option 2: Tariff increases together with government subsidies ..................................                               25

      Overview of model and approach ....................................................................................... 28

    3.1      Description of model ................................................................................................... 28
    3.2      Aim of the modelling exercise ..................................................................................... 29
    3.3      Description of the tariff scenarios modelled ................................................................ 29

      Simulation results .............................................................................................................. 35

    4.1      Comparative results – impact on GDP .........................................................................                  35
    4.2      Comparative results – impact on budget-deficit and debt-to-GDP ..............................                                  38
    4.3      Comparative results – impact on CPI inflation ............................................................                     40
    4.4      Comparative results – impact on total employment ....................................................                          42
    4.5      Interpreting results of model simulations post-downgrade ........................................                              45

      Key findings and conclusions ............................................................................................. 48

    5.1      Key findings ................................................................................................................ 48
    5.2      Concluding remarks .................................................................................................... 51

Appendix 1: Review of modelling approaches and recent literature .........................................                                  55
Appendix 2: Introduction to CGE modelling ..............................................................................                    69
Appendix 3: UPGEM database and production structure ...........................................................                             72
Appendix 4: Impact of downgrade on bond yields ....................................................................                         76
Reference List...........................................................................................................................   77

2
The macroeconomic impacts of alternative scenarios to meet Eskom’s five-year revenue requirement | List of Tables
List of Tables
Table 1: Rating equivalence across ‘Big 3’ rating agencies – long-term foreign currency rating ................. 9
Table 2: Change in South Africa and Eskom’s credit ratings from 2008 to 2017 by 3 major agencies ...... 15
Table 3: Change in South Africa Government’s key debt metrics between 2008 and 2017 ..................... 16
Table 4: Summary of scenarios modelled ........................................................................................ 30
Table 5: BAU forecast values assumed for selected exogenous macroeconomic variables (y/y%) ........... 33
Table 6: Average impact on GDP growth over periods ‘2017 to 2021’ and ‘2022 to 2030’ ...................... 37
Table 7: Average annual growth in budget deficit ............................................................................. 39
Table 8: Average impact CPI inflation in periods ‘2017 to 2021’ and ‘2022 to 2030’ .............................. 42
Table 9: Average impact CPI inflation in periods ‘2017 to 2021’ and ‘2022 to 2030’ .............................. 45
Table 10: Rating equivalence across ‘Big 3’ rating agencies – long-term foreign currency rating ............. 46
Table 11: Change in South Africa and Eskom’s credit ratings from 2008 to 2017 by 3 major agencies ..... 52
Table 12: Change in South Africa Government’s key debt metrics between 2008 and 2017 .................... 53
Table 13: Thee main characteristics and applications of different type of macroeconomic model ............. 58
Table 14: Summary of the advantages and disadvantages of different families of macroeconomic models 62
Table 15: Summary of recent South African literature on the macroeconomic impacts of rising energy
prices .......................................................................................................................... 64
Table 16: Summary of selected recent international literature on economic impacts of energy prices and/or
subsidy reform. ............................................................................................................. 67
3The macroeconomic impacts of alternative scenarios to meet Eskom’s five-year revenue requirement | List of Figures
List of Figures
Figure 1:Summary of scenarios modelled ......................................................................................... 8
Figure 2:Foreign currency rating vs. interest payment burden ........................................................... 10
Figure 3:Impact on trend in real GDP and employment growth – 1A, 1B, 3A relative to BAU1 and BAU2 11
Figure 4:Impact on government debt-to-GDP ratio - 1A, 1B, 3A relative to BAU1 and BAU2 .................. 12
Figure 5:Comparing impact of various scenarios to meet Eskom’s revenue requirement on GDP ............ 13
Figure 6:Trend in Average Electricity Prices realised by Eskom per kWh (1973 to 2015/16) .................. 19
Figure 7:Macroeconomic transmission of electricity price shock ......................................................... 24
Figure 8:Summary of options to meet Eskom’s revenue requirement if tariff increases are inadequate ... 25
Figure 9:Macroeconomic transmission of electricity price shock together with increased government
debt ............................................................................................................................ 27
Figure 10: Summary of scenarios modelled...................................................................................... 30
Figure 11: The electricity price path assumed relative to CPI inflation (2017 to 2030) ........................... 34
Figure 12: Impact on trend in real GDP growth – 1A, 1B, 3A relative to BAU1 and BAU2 ....................... 37
Figure 13: Average impact on GDP growth over periods ‘2017 to 2021’ and ‘2022 to 2030’ ................... 37
Figure 14: Cumulative impact on government’s general budget deficit - 1A, 1B, 3A relative to BAU1
and BAU2 ..................................................................................................................... 38
Figure 15: Cumulative deviation in government deficit from baseline in 2021 and 2030......................... 39
Figure 16: Impact on government debt-to-GDP ratio - 1A, 1B, 3A relative to BAU1 and BAU2 ................ 40
Figure 17: Impact on trend in CPI inflation – 1A, 1B, 3A relative to BAU1 and BAU2 ............................. 41
Figure 18: Average impact on annual CPI inflation over periods ‘2017 to 2021’ and ‘2022 to 2030’ ......... 41
Figure 19: Impact on trend in employment growth – 1A, 1B, 3A relative to BAU1 and BAU2 .................. 44
Figure 20: Impact on total employment (jobs in millions) – 1A, 1B, 3A relative to BAU1 and BAU2 ......... 44
Figure 21: Foreign currency rating vs. interest payment burden ......................................................... 47
Figure 22: Impact on trend in real GDP and employment growth – 1A, 1B, 3A relative to BAU1
and BAU2 ..................................................................................................................... 48
Figure 23: Impact on government debt-to-GDP ratio - 1A, 1B, 3A relative to BAU1 and BAU2 ................ 49
Figure 24: Trade-off between empirical and theoretical coherence across types of economic model ........ 59
Figure 25: Modelling of impact of a sub-investment grade downgrade on bond yields............................ 76
4The macroeconomic impacts of alternative scenarios to meet Eskom’s five-year revenue requirement | Executive summary Executive summary I. Background and context In the three decades between 1978 and 2004 government allowed real (inflation-adjusted) electricity prices in South Africa to decline to artificially low levels. During this period, the real average price of electricity1 fell by more than 40% to 30.1 c/kWh (in 2016 rands) in 2004/5 - at which point South Africa’s tariffs were among the lowest in the world. (Deloitte, 2017). In 2008, a power supply crisis that had been threatening to emerge for several years, reached a critical point and Eskom introduced nationwide loadshedding. As a result, Eskom was given the green light to embark on the massive build programme to increase power generation capacity. To enable Eskom to raise the capital it required, the National Energy Regulator of South Africa (NERSA) approved several sharp tariff increases. In the five years between 2008 and 2013, electricity prices more than doubled in real terms (inflation-adjusted) rising by a cumulative 114% while nominal prices rose by 191% over the same period (Figure 6). (Deloitte, 2017). The sharp increases in real electricity tariffs over this period prompted a public outcry, and NERSA subsequently decided to award Eskom revenue that would limit the increase in real electricity tariffs to ~2% per year for the 5-year period from 2013. This was much lower than Eskom’s requested increase of CPI plus ~10% per annum. The tariff increases that NERSA awarded Eskom over the MYPD3 period have proven to be inadequate, and Eskom’s financial position has deteriorated as its annual revenue shortfall has mounted. According to Eskom (2016) the revenue shortfall that the utility faced in 2014/15 alone, was R35 billion. At the time of finalising the modelling for this report in January 2017, we noted that the ongoing deterioration in Eskom’s financial position would have meaningful fiscal consequences (in the form of rising government debt and/or contingent liabilities), and that there was a significant risk that this would trigger a sub-investment downgrade (S-IG) of South Africa’s sovereign credit rating. On the 3rd of April 2017, shortly after this first version of this report was finalised, Standard & Poor’s downgraded South Africa's long-term foreign currency sovereign credit rating to sub-investment grade or "junk” and on the 7th of April 2017, Fitch ratings agency followed suit. S&P noted that the downgrade reflected their view that “contingent liabilities to the state, particularly in the energy sector [i.e. government guarantees on debt issued by Eskom] are on the rise and that previous plans to improve the underlying financial position of Eskom may not be implemented in a comprehensive and timely manner.” This indicates that the steady rise in government debt and contingent liabilities (guarantees of Eskom-issued debt) associated with Eskom’s lower-than-required electricity tariff increases contributed meaningfully to S&P’s recent decision to downgrade South Africa’s credit rating on foreign currency debt to ‘junk’. 1 Average prices are calculated as the total electricity revenue realised by Eskom divided by the total kWh produced in a given period, these are then adjusted for inflation to calculate real prices and expressed in 2016 rands. 5
The macroeconomic impacts of alternative scenarios to meet Eskom’s five-year revenue requirement | Executive summary
We argue in a recent analysis of the historical trends and policies in the electricity sector, Deloitte (2017),
that previous assessments of the macroeconomic impacts of rising electricity prices failed to acknowledge
the economic impacts of the implicit electricity subsidy Eskom requires from government when the
revenue it raises via the tariff is insufficient to cover its costs. This implicit subsidy usually takes the form
of an increase in debt (implicitly or explicitly guaranteed by government) or an additional equity injection
from government. Government in turn has three main ways to raise the funds required to support Eskom
– either by issuing more debt (borrowing) and/or by raising additional tax revenue or reducing / re-
prioritising expenditure away from other government services and functions.
In its ‘Reasons for decision on Eskom’s MYPD3 tariff application’, NERSA (2013) presented an economic
impact of rising electricity tariffs on GDP, inflation, and employment under low, medium, and high tariff
path scenarios. However, NERSA did not acknowledge or model the consequences of rising government /
Eskom debt associated with ‘low tariff path scenarios. Rather, in assessing the potential economic impact
of its tariff decisions NERSA, appears to implicitly assume that if Eskom is not able to recover sufficient
revenue to cover all its prudently and efficiency incurred costs, that those costs would not be incurred.
II. Aim of the study,
The aim of this study is to provide an understanding of the macroeconomic impacts of alternative
scenarios to meet Eskom’s five-year revenue requirement. While, like previous studies, the study should
show the impacts on GDP, employment, and inflation during the five-year period, it should also
demonstrate the impact on the fiscus (debt ratios and budget balance). We have also attempted to
demonstrate some of the broader or longer-term economic consequences of government debt
accumulation in scenarios where tariff increases generate insufficient revenue to cover Eskom’s costs –
this included a scenario where government debt accumulation associated with low tariff increases, triggers
a sub-investment grade credit rating downgrade.
III. Key scenario assumptions, and scenarios modelled
For this modelling exercise, Eskom advised Deloitte to model the impacts associated with three alternative
tariff scenarios – average annual increases over a five-year period of 8%, 13% and 19% respectively. In
November 2016, when this study commenced, Eskom had not yet finalised its forthcoming tariff
application nor had it decided whether it would submit a tariff application for a single-year or for a multi-
year period. As such official estimates of Eskom’s required revenue and sales forecasts over the next five
years were not available, the scenarios are therefore hypothetical and we have made the following key
assumptions:
We assume that the upper-bound annual average increase of 19% is what Eskom requires to reach
and maintain, a cost-reflective electricity tariff over the 5-year period from 2017 to 2021.
We assume, that Eskom’s total revenue requirement is the same across all tariff scenarios and that it
is equivalent to the revenue that would be raised if tariffs increased at an annual average rate of 19%.
For example, under the 8% tariff scenarios, Eskom experiences an annual revenue shortfall equivalent
to the difference between the total revenue raised under a compounded 19% tariff increase and the
6The macroeconomic impacts of alternative scenarios to meet Eskom’s five-year revenue requirement | Executive summary
compounded 8% increase. We then have further scenarios to model how the shortfall will ultimately
be recovered– e.g. by raising additional government debt (borrowing) or taxes.
Eskom has indicated that based on an analysis of their financial position as at May 2017, it seems unlikely
that the utility will require an annual nominal tariff increase as great as 19% to close the gap between
costs (prudently and efficiently incurred) and revenue over a five-year period. There are however some
upside risks to current estimates of Eskom’s future revenue requirement - these include:
Purchase of additional renewable energy capacity - current estimates of the revenue
requirement (and therefore tariff) are based on the assumption that Eskom will not purchase any
additional renewable energy capacity from IPPs (beyond that which is has already committed to). If
Eskom signs additional power purchase agreements (PPAs) under the renewable energy independent
power producers programme (REIPPP) the utility’s average cost of electricity provision will rise further.
According to data supplied to Eskom by the Department of Energy, the weighted average cost for
REIPP Bid Windows 4 and 4+ will be around 83 c/kWh (in 2015 rands) inflated by annual headline CPI
of 5.5% this would be 92c/kWh in 2017 rands. While accurate estimates of the LCOE (levelised cost of
energy)2 of Eskom’s existing generation fleet are not available Joubert (2017), notes that Eskom’s
average fuel cost (including peaking plants and excluding IPPS) will be around 30c/kWh in 2017 and
coal for its most marginal and expensive coals stations will be around 42 c/kWh in 2017. Since fuel
costs typically represent 45% of the total LCOE of coal-fired plants (according to the EIA 2016). we
estimate that Eskom’s average LCOE for its existing coal-dominated generation fleet would be in the
order of 66c/kWh (based on 30c/kWh average fuel cost). Furthermore, the LCOE measure does not
reflect the additional financial costs that are ultimately associated with delivery of energy from
renewable sources (these include the costs associated with higher intermittency of renewables relative
to coal and higher transmission costs), so it is clear that additional renewable capacity at an LCOE of
92c/kWh will drive up Eskom’s average generation costs (we estimate the LCOE is ~66c/kWh), its
overall revenue requirement and therefore average tariff.
Lower-than-anticipated electricity demand or sales – Analysts have revised their forecasts of
South Africa’s real GDP and fixed investment growth lower following the downgrade of South Africa’s
long-term foreign currency rating to sub-investment grade and are now generally expecting real GDP
growth of between 0% and 1% y/y in 2017. Given the strong positive relationship between electricity
sales and real economic activity, Eskom may face lower than expected demand which would reduce its
sales and increase the average tariff it requires to cover its costs.
New build programme – current estimates of the tariff required to close the revenue gap are based
on anticipated capital expenditure under the approved new build programme including the completion
of Medupi and Kusile and IPP capacity already procured. If, however Eskom initiates a further new
build programme within the next 5 years, such as the potential nuclear build, it is likely that real tariffs
2 LCOE includes fuel, capital cost and operating and maintenance costs for generation plant.
7The macroeconomic impacts of alternative scenarios to meet Eskom’s five-year revenue requirement | Executive summary
would need to rise faster than is currently anticipated to accommodate the additional costs associated
with the new build programme.
Three main categories of policy simulations were modelled, each with a different set of assumptions and
for three tariff path options – 8%, 13% and 19% (where applicable)3. This resulted in a total of five
simulations all of which represent an alternative potential solution to meet Eskom’s total revenue
requirement over a five-year period. The scenarios modelled included a ‘tariff-only’ option where electricity
tariffs increase at an annual rate of 19% over five years and a baseline scenario (BAU) where tariffs
increase at an average rate of 8% and the revenue shortfall is funded by raising additional government
debt. Further scenarios included a 13% annual tariff increases with a debt-funded shortfall, an 8%
increase with tax-hike funded shortfall and a downgrade scenario, explained further below. At the time,
the modelling was undertaken (January 2017) we judged that there was also a significant risk that steadily
rising government debt levels associated with the baseline tariff scenario of 8% would trigger a sub-
investment grade (S-IG) credit rating downgrade4.
To simulate the economic impacts of this downgrade risk materialising we ran an alternative baseline
simulation (BAU2) where a steadily rising debt-to-GDP ratio and deteriorating budget balance that is
associated with an 8% average tariff increase triggers a S-IG credit rating downgrade. A visual summary
of the five simulations modelled is provided in Figure 1.
Figure 1: Summary of scenarios modelled
3
In the interim modelling report produced by the University of Pretoria, another two groups of scenarios were considered – 1) a tax credit
reducing VAT and 2) a tax credit reducing production taxes. We have decided to omit these two scenarios as the added unnecessary
complexity and did not materially alter the findings. We have also re-labelled/re-coded the scenarios for the readers of the final report.
4
At the time of writing and finalisation of the modelling for this study, South Africa maintained an investment grade rating on both its
foreign- and domestic-currency denominated debt. On the 3rd of April 2017, Standard & Poor’s downgraded South Africa's long-term
foreign currency sovereign credit rating to sub-investment grade or "junk” and on the 7th of April 2017, Fitch ratings agency followed suit.
By 7th April 2017 the yields on 10-year government bonds had risen by nearly 1 percentage point or 100bps from their mid-March lows
from around 8.4% to just over 9%.
8The macroeconomic impacts of alternative scenarios to meet Eskom’s five-year revenue requirement | Executive summary
IV. Interpreting results of hypothetical scenarios – particularly post-
downgrade
As explained above, the tariff increases are hypothetical. In addition, the potential S-IG downgrade we
modelled under the ‘alternative baseline’ (BAU2:8%, debt) has, in effect, already transpired. While the
magnitude of the tariff increases chosen are hypothetical the scenarios still usefully illustrate the relative
macroeconomic impacts of the various options available to meet Eskom’s revenue requirement which
include 1) Increasing the tariff alone 2) a combination of low tariff increases and raising government debt
and 3) a combination of low tariff increases and tax hikes.
Furthermore, while the anticipated S-IG downgrade has already occurred, it does not mean that credit-
rating downgrade risk associated with debt accumulation under a ‘much lower-than-required’ tariff
increase is now irrelevant or even diminished. As RMB (2017) notes, countries that are downgraded to
sub-investment-grade typically experience a continual negative feedback loop. Following a SI-G event, as
sentiment sours and interest rates increase, the fiscal position deteriorates. As the fiscal position
deteriorates, interest rates rise and economic growth slows, further credit rating downgrades within ‘junk’
territory are triggered. As RMB (2017) notes, “countries take seven to nine years, on average, to recoup
their investment-grade rating, following a downgrade, to speculative grade”.
The risk now that the SI-G event has already occurred is that government debt accumulation under ‘much
lower-than-required’ tariff increases (e.g. 8% scenario) could (together with an ailing economy) trigger
further sovereign credit rating downgrades moving South Africa lower within ‘junk’ territory (Table 1).
Table 1: Rating equivalence across ‘Big 3’ rating agencies – long-term foreign currency rating
Standard & Fitch Moody’s Credit Quality
Poor’s
Investment Grade
AAA AAA Aaa Extremely strong capacity
AA AA Aa Very strong capacity
A A A Strong capacity
BBB+ BBB+ Baa1 Adequate capacity to meet financial commitment
BBB BBB Baa2 unless political/economic conditions worsen
BBB- BBB- Baa3
Sub-investment grade, junk
BB+ BB+ Ba1 There is a risk that major ongoing uncertainties or
BB BB Ba2 exposure to adverse economic & business conditions
BB- BB- Ba3 will reduce government’s capacity to meet its debt
obligations
B+ B+ B1 More vulnerable to non-payment, but can currently
B B B2 meet obligations
B- B- B3
CCC+ CCC Caa1 Currently vulnerable to non-payment, depends on
CCC Caa2 favourable external conditions to meet obligation.
CCC- Caa3
CC CC Ca Default imminent, inevitable
D DDD C
9The macroeconomic impacts of alternative scenarios to meet Eskom’s five-year revenue requirement | Executive summary
DD In default, bankruptcy, administration
D
South Africa's long-term foreign currency ratings as at 8 April 2017.
Source: Own analysis based on EU committee report on sovereign credit ratings 2011, S&P website and others.
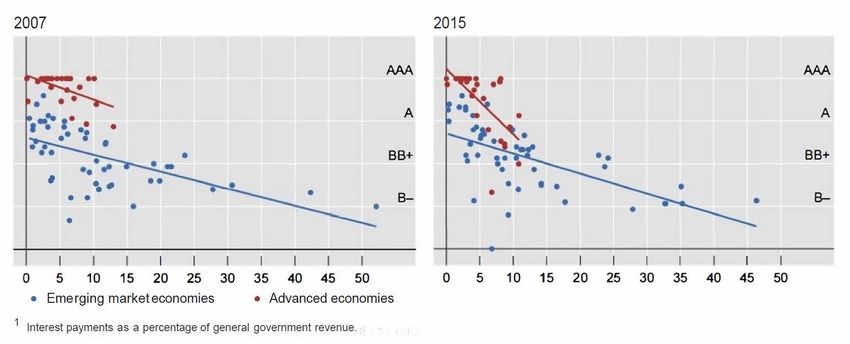
While there is no simple linear relationship between subsequent credit rating downgrades (post a SI-G
event) and interest rates the two are inversely correlated and as downgrades occur, interest rates tend to
rise. A graph presented in an analysis by the Bank of International Settlements (2015) illustrates how the
proportion of total revenue that Governments spend servicing interest on debt tends to rise sharply as the
foreign currency rating falls into sub-investment grade territory. As further credit rating downgrades take
place governments’ find they have less and less ‘fiscal space’ or flexibility in their spending choices and are
forced to focus on preserving and improving their financial position and trying to meet obligations to
deliver essential services (e.g. social grants, health and education).
Figure 2: Foreign currency rating vs. interest payment burden
Source: Bank of International Settlements (2015).
V. Approach
A brief review of the potential approaches to modelling the macroeconomic impacts of rising energy prices
or energy subsidy reform that informed the approach chosen for this study is provided in Appendix 1. The
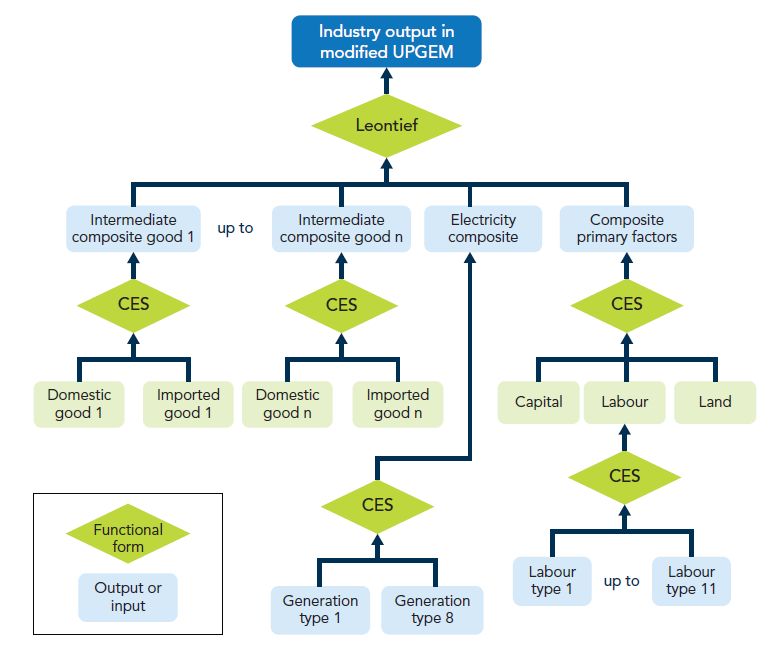
model selected for the simulation of the alternative scenarios to meet Eskom’s revenue requirement is the
University of Pretoria General Equilibrium Model (UPGEM) described in Bohlmann et al. (2015). UPGEM is
a flexible Computable general equilibrium (CGE) model that for purposes of this study is used in standard
recursive-dynamic mode.
10The macroeconomic impacts of alternative scenarios to meet Eskom’s five-year revenue requirement | Executive summary
VI. Key findings and results
The results show that an annual tariff increase of 19% is expected to have a slightly negative impact on
GDP and employment growth relative to the baseline scenario (where tariffs rise by 8% a year and
government borrows the shortfall). For example, under the 19% tariff scenario (1B), GDP is forecast to
expand at an average rate of 2.0% y/y, which is 0.3 percentage points lower than the 2.3% y/y growth
forecast in the baseline (BAU1) (Figure 3). Total employment is expected to grow at an average rate of
0.9% y/y under a 19% tariff increase compared to 1.2% y/y in BAU1 (Figure 3). This implies that under a
19% tariff increase scenario, 137000 fewer jobs will be created and sustained annually over the period
2017 to 2021, relative to BAU1. These results are consistent with those NERSA (2013) obtained when it
presented the economic impact of similar tariff scenarios in its reason for decision on Eskom’s MYPD3 tariff
application5.
Figure 3: Impact on trend in real GDP and employment growth – 1A, 1B, 3A relative to BAU1 and
BAU2
Real GDP growth Employment growth
3.5
1.8%
Growth in total employment (y/y%)
3.0
1.6%
2.5 1.4%
1.2%
2.0
y/y%
1.0%
1A: 13%, debt
1.5
0.8%
1B: 19%, tariff
1.0 0.6%
BAU2: 8%, downgrade
0.4%
0.5 3A: 8%, VAT
0.2%
BAU1: 8%, debt
0.0 0.0%
2016
2018
2020
2022
2024
2026
2028
2030
2018
2012
2014
2016
2020
2022
2024
2026
2028
2030
Our results however suggest that the impact of higher tariff increases on CPI inflation over the next five-
year period would be more muted than what NERSA (2013) previously indicated. The simulation results
suggest that scenarios with higher annual electricity price increases of 13% and 19% (1A and 1B
respectively) have very little impact on CPI inflation - inflation rises in both cases by less than 0.1
percentage point, averaging 5.8% y/y in the five-year period from 2017 to 2021 and 5.5% y/y thereafter.
While the low-CPI impact associated with relatively high tariff increases may seem counterintuitive, it can
be attributed to the fact that higher tariff increases are expected to have a negative impact on GDP growth
5
NERSA noted in its economic impact study that a 16% annual tariff increase over a five-year period was expected to lower average
annual GDP growth by 0.3 percentage points, reducing forecast GDP growth from 3.7% to 3.4%. NERSA also found that a series of five
16% tariff increases would compromise 652 654 jobs. We assume that NERSA was referring to the cumulative number of jobs that would
be foregone over 5 years in which case our results are similar. Our results suggest that 137000 fewer jobs will be created and sustained
annually under the 19% tariff scenario (1A) relative to the BAU1 over the five years to 2021. If this is expressed differently, the
cumulative deviation in the total employment from baseline (BAU1) in 2021 is 685 000 jobs.
11The macroeconomic impacts of alternative scenarios to meet Eskom’s five-year revenue requirement | Executive summary
and employment. Given that GDP growth was already expected to be relatively subdued over this period
(relatively to potential GDP growth of 3%), sluggish demand is likely to keep inflation in check.
We noted previously that in the economic analysis that NERSA presented in 2013, the regulator did not
acknowledge the fiscal consequences of ‘lower-than-required’ tariff increases. Our results show that under
the 8% tariff baseline scenario (BAU1) there is a steady and marked deterioration in government’s budget
balance and that the government debt-to-GDP ratio is expected to reach 75% by 2021 and 104% by 2030
(Figure 4). By contrast under the 19% tariff scenario, the debt-to-GDP ratio stabilises at ~66% (Figure
4). Given the sharp accumulation of government debt under a ‘much-lower-than-required tariff increase’,
we also noted that it was likely that BAU1: 8%, debt would trigger a sub-investment grade credit rating
downgrade and as such that it would be more accurate to compare the economic impacts of a 19% tariff
scenario with a scenario where an 8% tariff increase triggers a SI-G downgrade (BAU2:8%, downgrade).
Figure 4: Impact on government debt-to-GDP ratio - 1A, 1B, 3A relative to BAU1 and BAU2
120%
Government debt to GDP (%)
104%
100% 100%
88%
80%
55% 68%
60% 67%
1A: 13%, debt
40% 1B: 19%, tariff
BAU2: 8%, downgrade
20% 3A: 8%, VAT
BAU1: 8%, debt
0%
2014
2027
2012
2013
2015
2016
2017
2018
2019
2020
2021
2022
2023
2024
2025
2026
2028
2029
2030
As noted earlier, the risk of a S-IG downgrade that we modelled under the ‘alternative baseline’
(BAU2:8%, debt) has in effect, already materialised. On the 3rd of April 2017, Standard & Poor’s
announced the downgrade of South Africa's long-term foreign currency sovereign credit rating to sub-
investment grade.
The results of our downgrade scenario show that when the rise in government debt that is associated with
a ‘much-lower-than required’ tariff increase is sufficient (together with other economic and political risk
factors) to trigger a sovereign credit-rating downgrade (BAU2: 8%, debt), South African’s end up worse-
off than under a 19% annual tariff increase and the negative economic impacts are likely in aggregate to
be more severe6 for the following reasons:
6
The way in which the effects of a potential downgrade were modelled was conservative -we assumed that the key impact of a S-IG
event would be that interest rates (or the return required on capital investment) would rise by an average of 100 basis points over the five-
year period.
12The macroeconomic impacts of alternative scenarios to meet Eskom’s five-year revenue requirement | Executive summary
Firstly, our results show that under the ‘BAU2:8%, downgrade’ scenario, growth in GDP and employment
will slow by almost as much as they would under a 19% annual tariff increase. Simulation results
(summarised in Figure 5) show that under both the downgrade scenario (BAU2: 8% downgrade) and 19%
tariff scenario (1B:19%, debt) annual GDP growth will be 0.3 percentage points lower than in BAU1.
Similarly, under BAU2 and total employment growth is expected to average 1.0% y/y which is an average
of 0.2 percentage points lower than in BAU1, while under scenario 1B: 19%, tariff employment will
increase at an average rate of 0.9% y/y or 0.3 percentage points lower than BAU1.
Figure 5: Comparing impact of various scenarios to meet Eskom’s revenue requirement on GDP
2.35
BAU1:8%, debt, 2, 2.3
2.3
2.25
Avergae GDP growth
(2017 to 2021) (%)
2.2 1A:13%,debt, 7, 2.2
2.15
2.1
1B:19%,debt, 13, 2
2.05
BAU2:8% downgrade,
2
2, 2
1.95
0 2 4 6 8 10 12 14
Average annual real electricity tariff increase
(assuming 6% inflation)
Secondly, while our results suggest that the negative impact on GDP and employment that follow a
downgrade due to debt accumulation under a ‘much-lower-than-required’ tariff is almost equivalent to a
19% tariff increase, South Africans are likely to end up worse-off in aggregate under the downgrade
scenario because of a simultaneous rise in debt and interest rates that doesn’t occur under the tariff only
scenario. Borrowing costs (or the required return on investment) will rise by 1 percentage point (100bps)
under BAU2 relative to the 19% tariff scenario (1B) and the government debt-to-GDP ratio will rise
steadily reaching ~75% by 2021 and 100% by 2030 under BAU2, while under the 19% tariff scenario, the
debt-to-GDP ratio stabilises at ~66%.
Finally, under any scenario (including BAU1, BAU2 and 1B) where the revenue collected via the tariff is
insufficient to cover Eskom’s prudently and efficiently incurred costs, the price of electricity is being
implicitly subsidised. As the World Bank (2010:22) notes: “Subsidising energy use involves providing it at
a price below opportunity cost. This includes non‐collection or non‐payment, selling electricity at a cost
that does not reflect the long‐run marginal cost of supply including capital maintenance.”
The economic harm and distortions that are caused by energy subsidies, including artificially low electricity
prices, is well-documented in the international literature. Some of the potential macroeconomic,
environmental, and social consequences of energy subsidies, as documented by the IMF (2013) were
summarised in Deloitte (2017) as follows:
13The macroeconomic impacts of alternative scenarios to meet Eskom’s five-year revenue requirement | Executive summary
Energy subsidies crowd-out growth-enhancing or pro-poor public spending. Energy subsidies,
while often intended to protect consumers crowd-out other priority spending (such as on social
welfare, health, and education) and place an unnecessary burden on public finances. Energy subsidies
(unless specifically targeted) are a poor instrument for distributing wealth relative to other types of
public spending.
Energy subsidies discourage investment in the energy sector and can precipitate supply-
crises. Energy subsidies artificially depress the price of energy which results in lower profits for
producers or outright loses. This makes it difficult for state-owned enterprises to sustainably expand
production and removes the incentive for private sector investment. The result is often an
underinvestment in energy capacity by both the public and private sector that results in an energy
supply crisis which in turn hampers economic growth. These effects have been felt in SA.
Energy subsidies create harmful market distortions. By keeping the cost of energy artificially
low, they promote investment in capital-intensive and energy-intensive industries at the expense of
more labour-intensive and employment generating sectors.
Energy subsidies stimulate demand, encourage the inefficient use of energy and
unnecessary pollution. Subsidies on the consumption of energy derived from fossil fuels leads to the
wasteful consumption of energy and generate unnecessary pollution. Subsidies on fossil-fuel derived
energy also reduces the incentive for firms and households to invest in alternative more sustainable
forms of energy.
Energy subsidies have distributional impacts. Energy subsidies tend to disproportionately benefit
higher-income households who consume far more energy than lower income groups. Energy subsidies
directed at large industrial consumers of energy benefit the shareholders of these firms at the expense
of the average citizen.
In Deloitte (2017) goes on to give specific examples of the economic harm and distortions that can be
attributed to the historic under-pricing or implicit subsidisation of electricity in South Africa these is argued
include:
1. Artificially low electricity tariffs discouraged investment in the South Africa’s electricity supply industry
and helped to precipitate the 2008 power supply crisis. The subsidised tariffs frustrated attempts by
the government to attract private investment in the early 2000s and helped to precipitate the supply
crisis of 2008.
2. Subsidised electricity prices promoted investment in capital intensive industries in South Africa at the
expense of more labour-absorbing sectors. Kohler (2014) who traced the 40-year change in electricity
intensity across a number of countries and country groups and found that South Africa has amongst
the highest electricity intensity globally.
3. Subsidised electricity prices, encourage the inefficient use of energy and contributed South Africa to
becoming one of the single-largest contributors to global GHG emissions. Subsidies on the
14The macroeconomic impacts of alternative scenarios to meet Eskom’s five-year revenue requirement | Executive summary
consumption of electricity generated by Eskom which was mostly coal-based have arguably
contributed South Africa becoming the 18th largest country-level contributor to global CO2 emissions7.
VII. Concluding remarks
It may be tempting to conclude that by limiting electricity tariff increases to 8% per annum and requiring
that Eskom and/or government to borrow the revenue shortfall (and effectively implicitly subsidising the
price), it is possible to minimise the negative impacts of rising electricity prices on GDP and employment
growth in the short-term.
However, the results of the economy-wide impact analysis show that the fiscal and economic
consequences of awarding Eskom a tariff that is much lower than what it requires (to recover its prudently
and efficiently incurred costs), do eventually (and arguably have now) become evident. Our results show
that when the gap between the required and actual tariff increases is large (an 8% increase awarded over
five years when we assumed 19% was required) and the shortfall is covered by raising debt, there is a
steady and marked deterioration in government’s budget balance and debt-to-GDP ratio. For example,
under the baseline 8%, debt scenario government debt-to-GDP ratio is expected to reach 75% by 2021
and 104% by 2030. By contrast under the 19% tariff scenario, where all the required revenue is raised
via the tariff, the results show the debt-to-GDP ratio stabilising at ~66%.
Over the past 10-years there has been a marked deterioration in both the financial position of Eskom and
the fiscal health of the South African government and this is evident from the change in debt and credit
metrics summarised in Table 2 and Table 3. Since 2008, South Africa’s long-term foreign-currency rating
has been downgrade by 3 notches from lower-medium grade to speculative grade or ‘junk’ by two of the
three major rating agencies. Eskom’s long-term local-currency corporate bond rating has been
downgraded by between 5 and 10 notches, from upper-medium grade in 2008 is now rated ‘highly-
speculative’ by Standard and Poor’s.
Table 2: Change in South Africa and Eskom’s credit ratings from 2008 to 2017 by 3 major agencies
2008 2017 2017 (change
Credit metric (May-08) (Apr-17) in notches)
South Africa's long-term S&P Lower- BBB+ (stable) BB+ -3
foreign-currency rating medium
Fitch grade BBB+ (positive) Speculative BB+ -3
Lower-
Moody's Baa1 (positive) medium Baa2 (negative) -1
Eskom's long-term, local S&P Upper- A+, stable Highly speculative
B+ -10
currency, corporate bond medium
Moody's A1 Speculative Ba1- (review downgrade) -7
rating grade
Fitch A Speculative BB+ -5
Source: Own analysis based on reports on credit history by 3 rating agencies
A summary of key debt metrics in Table 3, shows that since 2008 (when Eskom embarked on its massive
capital expansion programme) the South African government’s capacity to meet its debt obligations (and
7
Based on data from the EDGAR – emissions databased for global atmospheric research. 2015. Available online at:
http://edgar.jrc.ec.europa.eu/overview.php?v=CO2ts1990-2015&sort=des9
15The macroeconomic impacts of alternative scenarios to meet Eskom’s five-year revenue requirement | Executive summary
to raise additional debt or issue guarantees on debt of state-owned enterprises) has become far more
constrained and as such vulnerability to eventual non-payment has increased. In terms of the National
Treasury broad risk management guidelines (updated in 2008) – net loan debt, provisions and contingent
liabilities should not exceed 50 per cent of GDP while the broader SADC macroeconomic convergence
target was to limit the metric to 60 of GDP (National Treasury, 2008). While this metric stood comfortably
within these prudential limits at 34.4% GDP in 2008, in 2017 it stands at 67% of GDP – exceeding both
the self-imposed risk guideline and broader SADC convergence target. Net loan debt (excluding provisions
and contingent liabilities) is expected to reach 47% of GDP in 2017/18 (up from 22.6% in 2007/8).
Government now spends 11.5% of its total revenue service the interest on debt (up from 8.9% in 2007/8)
illustrating how the fiscal space is becoming increasingly constrained.
It is also clear that substantial support provided by government to Eskom over the past 10 years both in
the form of equity and guarantees has contributed meaningfully to the deterioration in Government’s
overall debt metrics (and subsequent credit rating downgrades). Eskom initially received support from
government in the form R6bn shareholder loan which was converted into equity in 2015 and in the form of
a further R23bn equity injection completed in March 2016 (Moody’s Investor Service, 2017). Government
also approved R350bn worth of guarantees on Eskom’s debt of which Eskom had drawn on R218bn worth
by 2017/18 (the agreement is to be extend to 31 March 2023). Government guarantees of SOE debt rose
from R65bn in 2008 to a total of R445bn in 2017 and 77% of this is for the electricity sector which also
cover Eskom’s power purchase agreements with IPPs.
Table 3: Change in South Africa Government’s key debt metrics between 2008 and 2017
2008 2017 Change (2008 to 2017)
Net loan debt as % GDP 22.6% 2008/9 47% 2017/18 up to almost 50% of GDP
Net loan debt, provisions and contingent liabilities as % GDP 34.4% Mar-08 67% 2016/17 now over 60% of GDP
Debt service cost as % GDP 2.4% 2008/9 3.4% 2017/18 up 1 percentage point
Debt service cost as % general government revenue 8.9% 2008/9 11.5% 2017/18 up 2.6 percentage points
Government guarantees Eskom -exposure (Rbn) 26 2007/8 218 2016/17 192
Government guarantees IPPs - exposure (Rbn) 0 2007/8 126 2016/17 126
Government guarantees (Rbn) 65 2007/8 445 2016/17 381
Electricity sector as % of total govt. guarantees 40% 2007/8 77% 2016/17 37 percentage points higher
Source: Own Analysis based on data and statistical tables National Treasury’s National Budget Reviews - 2007,2008, 2016 & 2017
Following the sub-investment grade downgrade of South Africa’s long-term foreign currency in April 2017
and subsequent downgrade of Eskom’s corporate debt by S&P to ‘highly-speculative grade’, neither Eskom
nor the South African government will be in a position raise further debt to meet Eskom’s future revenue
requirement without the risk of triggering further sovereign credit rating downgrades.
In the present context, if Eskom is awarded much-lower-than-required tariff increases, it will put South
Africa at greater risk of remaining within the continual negative feedback loop that countries typically
experience following an SI-G event. Our analysis shows that under low tariff scenarios, Eskom’s revenue
shortfall grows, the fiscal position deteriorates, interest rates rise, sentiment sours, economic growth
slows, further credit rating downgrades within ‘junk’ territory are triggered and the toxic loop repeats. As
RMB (2017) notes, “countries take seven to nine years, on average, to recoup their investment-grade
rating, following a downgrade, to speculative grade”.
16The macroeconomic impacts of alternative scenarios to meet Eskom’s five-year revenue requirement | Executive summary Our simulation results show that in terms of the overall economic impacts - even a sharp 19% annual tariff increase over five-years (although current information suggests a 12% annual increase may be sufficient to close the gap) would be preferable to a scenario where rapid debt accumulation associated with a much-lower-than-required ‘8% tariff increase triggers further credit rating downgrades. While our results suggest that negative impact on GDP and employment that follow a downgrade due to debt accumulation under a ‘much-lower-than-required’ tariff is almost equivalent to a 19% tariff increase, South Africans are likely to end up worse-off in aggregate under the ‘low-tariff downgrade scenario’ because of a simultaneous rise in debt and interest rates triggered by a downgrade. In addition, in the low-tariff scenarios, the price of electricity remains implicitly subsidised, and outlined in detail in Deloitte (2017), energy price subsidies are associated with a wide-range of market distortions and economic harm. The following examples are discussed in Deloitte (2017), electricity price subsidies: discouraged private sector investment in the South African electricity supply industry and helped to precipitate the 2008 power supply crisis; have promoted investment in capital intensive industries at the expense of more labour- absorbing ones; and have encouraged the inefficient use of power leading to avoidable pollution. In conclusion, it would be ill-advised for the regulator to continue to limit Eskom’s tariff increases to 8% per year. It would also be incorrect given the current context and results of this analysis to assume that this will limit the negative impact on GDP and employment, even in the short-term. Our recommendation is that tariff increases should at least be sufficient to transition Eskom towards a more cost-reflective electricity tariff (prudently and efficiently incurred) over the next 5 years. This will reduce of the risk of South Africa being trapped for a prolonged period in the continual negative feedback loop that countries typically experience following an SI-G rating downgrade. Eskom has indicated that based on an analysis of their financial position as at May 2017, it seems unlikely that the utility will require an annual nominal tariff increase as great as 19% to close the gap between costs (prudently and efficiently incurred) and revenue over a five-year period. Eskom and its key stakeholders should also take care to ensure that the upside risks to forecasts of the tariff required to meet its revenue requirement over the next five years are carefully managed – these include obligations to purchase additional renewable energy capacity, risk of lower-than-anticipated electricity demand or sales and additional capital expenditure and associated costs that will be incurred if Eskom and the Department of Energy deems it prudent and necessary embark on a new build programme within the next five years. 17
The macroeconomic impacts of alternative scenarios to meet Eskom’s five-year revenue requirement | Introduction

          Introduction

1.1 Background and context
In the late 1970s and early 1980s Eskom embarked on a massive capacity expansion programme. Real
electricity prices rose sharply so that Eskom was in a financial position to raise the capital required to fund
the new build. However, the sharply rising electricity tariffs sparked a public outcry and a commission
appointed to investigate the situation, found that Eskom had substantially over-invested in capacity. In the
three decades between 1978 and 2008 government allowed real (inflation-adjusted) electricity prices in
South Africa to decline to artificially low levels. Between 1978 and 2004 the real average price of
electricity8 fell by more than 40% reaching a low of 30.1 c/kWh (in 2016 rands) in 2004/5. By 2004/5
electricity prices in South Africa, and particularly those faced by industrial consumers were among the
lowest in the world. (Deloitte, 2017).

From 2008, the trend in prices took a dramatic turn when the power supply crisis that had been
threatening for several years, reached a critical point and Eskom introduced loadshedding. As a result,
Eskom was given the green light embark on the massive build programme to increase power generation
capacity. But at this point, since electricity tariffs were at long-term-lows, Eskom had neither the cash
reserves nor the future potential revenue steam to cover the cost of the new build. To enable Eskom to
begin raising the capital it required, the National Energy Regulator of South Africa (NERSA) approved
several sharp increases in annual tariffs and in the 5 years between 2008 and 2013, electricity prices more
than doubled in real terms (inflation-adjusted) rising by a cumulative 114% while nominal prices rose by
191% over the same period (Figure 6). (Deloitte, 2017).

The sharp increases in real electricity tariffs over this period prompted a public outcry, and NERSA
subsequently decided to limit the increase in real electricity tariff to ~2% per year for the 5-year period
from 2013. This was much lower than Eskom’s requested increase of CPI plus ~10% per annum and as
such, NERSA disallowed a substantial proportion of Eskom’s budgeted costs across almost all operating
cost categories – “in assessing Eskom’s MYPD 3 Revenue Application the Energy Regulator disallowed over
R100 billion over 5 years” (Eskom, 2016).

In an overview of electricity consumption and pricing in South Africa (Deloitte, 2017), we noted that in the
context of the need for higher electricity tariffs, NERSA inevitably has to balance the concerns of the public
and with the requirement that it award Eskom a tariff that ensures that it raise sufficient revenue to
deliver on its new build and IPP procurement programmes, while remaining financially sustainable. But as
we argued in Deloitte (2017), it appears that the decision by NERSA to disallow Eskom more than R100
billion of the revenue it applied for over the MYPD3 period was influenced by concern about the negative
economic impact that sharp tariff increases would have on the economy.

8
  Average prices are calculated as the total electricity revenue realised by Eskom divided by the total kWh produced in a given period,
these are then adjusted for inflation to calculate real prices and expressed in 2016 rands.

18
The macroeconomic impacts of alternative scenarios to meet Eskom’s five-year revenue requirement | Introduction
Figure 6: Trend in Average Electricity Prices realised by Eskom per kWh (1973 to 2015/16)
90
80 2015/16, 76.24
70
cents (ZAR) per kWh
60
1978, 49.5
50
40
2007/8, 30.9
30
1973, 31.4 *2004/5, 30.1
20
10
0
2011/12
2009/10
2010/11
2012/13
2013/14
2014/14
2015/16
*2004/5
2005/6
2006/7
2007/8
2008/9
1975
1982
1973
1974
1976
1977
1978
1979
1980
1981
1983
1984
1985
1986
1987
1988
1989
1990
1991
1992
1993
1994
1995
1996
1997
1998
1999
2000
2001
2002
2003
Real electricity price (R/kWh) 2016 values Nominal price/C/kWh
Source: Deloitte Analysis, Eskom data and 2011 annual report
Note: In 2004/5 Eskom change financial year from calendar year (year-ending 31 December) to year-ending 31 March
The tariff increases NERSA awarded Eskom over the MYPD3 period have proved to be inadequate and
Eskom’s revenue shortfall has mounted. According to Eskom (2016) the revenue shortfall that the utility
faced in 2014/15 alone, was R35 billion (assuming that Eskom will not be able to recover some of this
shortfall via a future RCA application). In November 2016, Standard and Poor’s (S&P) downgraded
Eskom’s long-term corporate credit rating one notch further into sub-investment grade territory to 'BB'
with a negative outlook noting concerns that “Eskom's capital structure and free cash flow remain at
unsustainable levels, even if its liquidity position and operating performance should show some
improvement during the current fiscal year” (Linder, 2016).
At the time of finalising the modelling for this report in January 2017, we noted that the ongoing
deterioration in Eskom’s financial position would have meaningful fiscal consequences (in the form of rising
government debt and/or contingent liabilities), and that there was a significant risk that this would trigger
a sub-investment downgrade (S-IG) of South Africa’s sovereign credit rating. On the 3rd of April 2017,
shortly after this first version of this report was finalised, Standard & Poor’s downgraded South Africa's
long-term foreign currency sovereign credit rating to sub-investment grade or "junk” and on the 7th of
April 2017, Fitch ratings agency followed suit.
S&P noted that the downgrade reflected their view that “contingent liabilities to the state, particularly in
the energy sector [i.e. government guarantees on debt issued by Eskom] are on the rise and that previous
plans to improve the underlying financial position of Eskom may not be implemented in a comprehensive
and timely manner.” This indicates that the steady rise in government debt and contingent liabilities
(guarantees of Eskom-issued debt) associated with Eskom’s lower-than-required electricity tariff increases
19You can also read


