Perspectives on Climate-Related Scenarios - Risks and Opportunities October 2019 - Marathon ...
←
→
Page content transcription
If your browser does not render page correctly, please read the page content below

October 2019

Perspectives on
Climate-Related Scenarios
Risks and Opportunities

Table of Contents
3     Letter from the Chairman and CEO                        36 Metrics and Performance Data

4     About MPC                                               37   Managing Physical Risks to Our Facilities

6     Introduction                                            41   Conclusions

7     Governance and Risk Management                          43 Endnotes

10    Climate Scenario Planning                               43 Forward-looking Statements

30 Energy Strategy and Performance

     GLOSSARY OF TERMS

     barrel: 42 U.S. gallons — a common volume                ERM: Enterprise Risk Management
     measure for crude oil and petroleum products
                                                              GHGs: Greenhouse gases, such as carbon dioxide
     barrel of oil equivalent or boe: is a unit of energy     and methane
     based on the energy released by burning one barrel
                                                              IEA: International Energy Agency
     of crude oil or 5.8 million British thermal units.
                                                              IEA’s CPS: Current Policies Scenario
     bpcd: barrels per calendar day — the average of
     how much crude oil or other feedstock a refinery         IEA’s NPS: New Policies Scenario
     processes over a period of time, divided by the          IEA’s SDS: Sustainable Development Scenario
     number of days in that period, typically 365 days (a
                                                              LNG: Liquefied natural gas
     common rate measure for petroleum refineries)
                                                              LPG: Liquefied petroleum gases
     bpd: barrels per day — a common rate measure for
     crude oil and petroleum products                         Tonne or metric ton: 2,205 pounds

     CO2e: Carbon dioxide equivalent is a common unit         MPC: Marathon Petroleum Corporation
     of measurement converting all greenhouse gases           NGL: Natural gas liquid — a light hydrocarbon
     to carbon dioxide. MPC calculates CO2e emissions         liquid often produced with natural gas
     using the EPA factors identified in Equation A-1 in
                                                              Scope 1 Emissions: All direct GHG emissions by
     40 CFR Part 98.
                                                              a company. It includes fuel combustion, company
     EII®: Energy Intensity Index, a measure proprietary to   vehicles and fugitive emissions.
     energy consulting firm HSB Solomon Associates LLC
                                                              Scope 2 Emissions: Indirect GHG emissions from
     ENERGY STAR®: A program of the U.S.                      consumption of purchased electricity, heat or
     Environmental Protection Agency recognizing              steam
     energy efficiency. To achieve this status, applicants
                                                              TCFD: Task Force on Climate-Related Financial
     must perform in the top quartile for energy
                                                              Disclosures, formed by the Financial Stability
     efficiency and have no unresolved environmental
                                                              Board (an international body that monitors
     compliance actions from state or federal regulators.
                                                              and makes recommendations about the global
     EPA: The U.S. Environmental Protection Agency            financial system)

2
From the Chairman
and Chief Executive
Officer
Fellow shareholders,
It’s a pleasure for me to present the 2019
Perspectives on Climate-Related Scenarios, our
third report that adheres to guidelines from the Task
Force on Climate-related Financial Disclosures. This
report not only further enhances our transparency;
it also shows how we provide the many benefits
of reliable, affordable energy to millions of people
while also serving as responsible stewards of the air,
land and water we all share.
We accomplish this through high operational
standards across our entire business, and a
commitment to excellence that includes our Board
of Directors, executive leadership team, and the
employees whose dedication makes it possible for
us to achieve so much.
Having been a successful energy company for
more than 130 years, we have long believed in
the importance of providing our investors an
assessment of our company’s future. We take
this responsibility seriously, and in this report, we    many others throughout our enterprise — provide a
detail how we identify and manage climate-related        foundation for us to be successful, even in a future
challenges and opportunities. We evaluate our            characterized by carbon constraints and climate-
business plans and potential risks to our business       related risks.
using carbon-constrained scenarios established
                                                         In the decades ahead, our growing world population
by the International Energy Agency. Our Board of
                                                         will require more energy and petrochemicals to
Directors oversees these analyses, and our executive
                                                         continue to enhance life’s possibilities across the
leadership team manages the risks under the
                                                         globe. I invite you to read this report and learn
Board’s direction.
                                                         more about how we continue positioning Marathon
We carefully evaluate and manage climate-related         Petroleum to enhance life’s possibilities for our many
risks and opportunities in order to position Marathon    stakeholders long into the future.
Petroleum Corporation for long-term success. Our
efforts to continually enhance our energy efficiency,    Sincerely,
and to reduce emissions, our freshwater withdrawal
and greenhouse gas intensities, yield immediate
results in terms of lower operating costs and less       Gary R. Heminger
impact on the environment. These efforts — and           Chairman and Chief Executive Officer

                                                                                                             3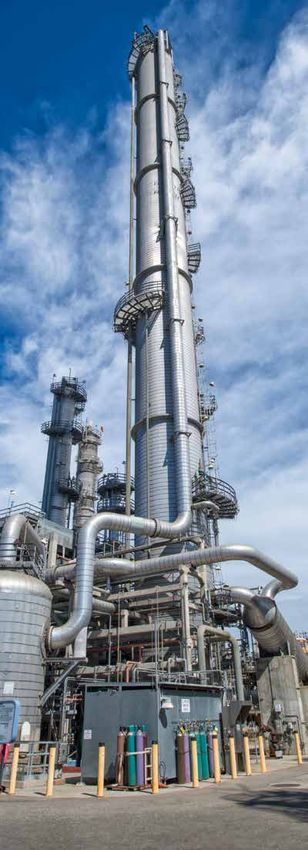
About MPC
Headquartered in Findlay, Ohio, Marathon Petroleum Corporation
(MPC) is a leading, nationwide, integrated energy company. MPC
is the nation’s largest refiner, with a capacity of more than 3
million barrels per day across its 16-refinery system. MPC owns the
general partner and majority limited partner interests in MPLX LP, a
midstream master limited partnership. MPC’s nationwide retail and
marketing businesses include company-owned and -operated stores
and branded locations.

Our Company
Refining and Marketing: MPC refines crude oil and other feedstocks
at our 16 refineries in the West Coast, Gulf Coast and Mid-Continent
regions of the United States, purchases refined products and
ethanol for resale, and distributes refined products through
transportation, storage and distribution services provided largely
by our Midstream segment. We sell refined products to wholesale
marketing customers domestically and internationally, buyers on
the spot market, our Retail business segment and independent
entrepreneurs who operate primarily Marathon® branded outlets.
Midstream: The Midstream segment transports, stores and
distributes crude oil and refined products principally for the
Refining and Marketing segment via refining logistics assets,
pipelines, terminals, towboats and barges; gathers, processes and
transports natural gas; and gathers, transports, fractionates, stores
and markets NGLs. The Midstream segment primarily reflects the
results of MPLX, our sponsored master limited partnership.
Retail: MPC sells transportation fuels and convenience products in
the retail market across the United States through company-owned
and -operated convenience stores, primarily at our approximately
4,000 Speedway® brand stores, and long-term fuel supply contracts
with direct dealers, who operate locations mainly under the ARCO®
brand.

Our Core Values
Our long-established core values are vital to our financial
performance and to our relationships with stakeholders. Under the
guidance and supervision of our Board of Directors, we pursue the
highest standards of corporate responsibility by embedding these
core values into our policies, practices and programs: Health and
Safety, Environmental Stewardship, Integrity, Corporate Citizenship,
and Inclusive Culture.

4    About MPC

®

                                                                                     Virent,
                                                                                      Inc.

    MEXICO                                                                      As of Aug. 2019.

    Domestic Marketing Area                      International Marketing Area         MPLX Owned and Part-Owned            MPC/MPLX Pipelines(a)
                                                                                      Light Product Terminals
    MPC Refineries                               MPC/MPLX Pipelines(a)                MPLX Owned Asphalt/Heavy             MPLX Refining
                                                                                      Oil Terminals                        Logistics Assets
    MPC Owned and Part-Owned                     Renewable Fuels
    Light Product Terminals                                                                                                MPLX Gathering
                                                 Ethanol Facility                     Barge Dock
    MPC Owned Asphalt/Heavy                                                                                                System
                                                 Biodiesel Facility
    Oil Terminals
                                                                                      Cavern                               MPLX Owned Marine
                     MPC Owned and Part-Owned                                                                              Facility
                     Marine Facility
                                                                                                      Natural Gas
                                                                                                      Processing Complex
Note: Illustrative representation of asset map
(a) Includes MPC/MPLX owned and operated lines, MPC/MPLX interest lines operated by others and MPC/MPLX operated lines owned by others.

                                                                                                                               About MPC           5
Introduction
Our annual Perspectives on Climate-Related                          meet the climate goals being modeled while
Scenarios report follows the reporting guidelines                   providing enough energy to fuel modern life.
established by the Task Force on Climate-                           We are doing our part through our dedication
Related Financial Disclosures (TCFD) formed                         to efficient, diversified, resilient operations. Our
by the Financial Stability Board, an international                  capacity to contribute to meeting the world’s
body of financial policymakers representing                         future energy needs has increased substantially
the world’s 20 largest economies. This report                       since our acquisition of Andeavor in 2018. This
provides our stakeholders with an easy-to-                          merger extended our integrated network of
read summary of how we identify and manage                          refining, midstream and retail assets from coast
climate-related challenges and opportunities,                       to coast and into Mexico. It also greatly increased
including an overview of our governance and                         the diversity of the businesses we operate, the
risk management structure and our strategy for                      people we employ and the communities where
dealing with potential transitional and climate-                    we are located. The acquisition also provides
related risks.                                                      significant synergies that we anticipate will make
This year, we have enhanced our metrics                             our company more competitive. And, it gives
reporting to include more granularity around our                    us access into new markets, such as California,
Scope 1 and Scope 2 emissions.1 We also provide                     where lower carbon technologies and renewable
the results of a review of our business against                     fuels are being deployed through policies that are
a “less than 2-degree” or “low-carbon” scenario                     consistent with the less than 2-degree scenarios.
using scenarios developed by the International                      We believe our investors, and other interested
Energy Agency (IEA).                                                stakeholders, will find that the extensive
This report outlines significant challenges to                      disclosures in this report, our Annual Report on
meeting the world’s growing energy needs.                           Form 10-K, Sustainability Report and website
A comprehensive strategy that incorporates                          align with the TCFD’s principles and demonstrate
efficient use of oil and natural gas, biofuels,                     MPC’s financial strength, adaptiveness and
nuclear and renewables will be needed to                            resilience to climate-related risks.

MPC’s Kenai Refinery, located on the Cook inlet in Kenai, Alaska.

6      Introduction

Board Oversight of Climate-Related
Governance and                                                           Risks and Opportunities
Risk Management                                                          Climate-related risks and opportunities represent a
MPC’s Board of Directors, its committees and                             key focus area for our Board. Our Board members
executive management work together to ensure                             have significant expertise and experience
effective corporate governance. This governance                          in the energy sector, finance, economics,
includes a mature enterprise risk management                             operations and public policy, which allows them
(ERM) program to identify and manage material                            to effectively analyze risks and the strategies
risks, including climate-related risks.                                  management employs to mitigate those risks.
                                                                         While management has primary responsibility for
                                                                         managing risk, the Board is responsible for risk
                                                                         oversight. The Board reviews key risks associated
                                                                         with our strategic plan, including emerging risks,
                                                                         at a designated strategy meeting annually and on
                                                                         an ongoing basis throughout the year. Our Board
                                                                         of Directors has four standing committees that
                                                                         provide oversight: Audit, Compensation, Corporate
                                                                         Governance and Nominating, and Sustainability.
                                                                         The Board formed the Sustainability Committee
                                                                         in 2018 to allow greater focus on climate change
                                                                         and other environmental, social and governance
                                                                         (ESG) topics that could have an impact on the
                                                                         company. More information on the Sustainability
                                                                         Committee and other Board committees is
                                                                         available at https://www.marathonpetroleum.
                                                                         com/About/Board-of-Directors/. The table below
                                                                         sets forth the principal oversight functions of
                                                                         each Board committee.
MPC’s 2019 Annual Meeting of Shareholders in Findlay, Ohio.

             Audit                            Compensation           Corporate Governance and                Sustainability
           Committee                           Committee              Nominating Committee                    Committee

  • Regularly reviews risks           • Reviews our compensation     • Develops and oversees          • Reviews and assesses
    associated with financial           programs to ensure they        our Corporate Governance         effectiveness of health,
    and accounting matters,             do not encourage excessive     Principles.                      environment, safety
    as well as those related to         risk-taking.                                                    and security programs,
                                                                     • Reviews shareholder
    financial reporting.                                                                                performance metrics and
                                      • Reviews our compensation       communications and other
                                                                                                        audits.
  • Monitors compliance with            programs and succession        initiatives, including those
    regulatory requirements             plans to confirm our           related to ESG issues.         • Reviews the company’s
    and internal control                practices are appropriate                                       strategy on climate change
                                                                     • Reviews the qualifications
    systems.                            to support the retention                                        and other ESG-related issues.
                                                                       and makeup of the Board
                                        and development of the
  • Oversees our enterprise                                            and candidates for the         • Oversees our Perspectives
                                        employees necessary to
    risk management (ERM)                                              Board.                           on Climate-Related
                                        achieve our business goals
    process.                                                                                            Scenarios report and our
                                        and objectives.
                                                                                                        annual Sustainability Report.

                                                                                             Governance and Risk Management         7
Executive Leadership’s
Role in Managing                               STRATEGIC STEERING COMMITTEE
Climate-Related Risks                          Provides a routine forum for presentations by
                                               subject matter experts (both internal and external)
Our executive leadership is responsible
                                               to executive leadership and discussion of topics that
for managing risk under the oversight of
                                               affect the long-term strategy of the company. Such
the Board. Our strong ERM process is our
                                               topics include business and market environment
primary tool for identifying, assessing and
                                               updates, political and regulatory trends, and
managing risk, as well as monitoring the
                                               potential market disruptors (technology or
performance of risk mitigation strategies.
                                               otherwise).
The ERM governance process starts with
the executive sponsorship of our chairman      HES&S MANAGEMENT COMMITTEE
and CEO and our executive vice president       Meets quarterly with key health, environmental,
and CFO. More importantly, all levels of       safety and security (HES&S) personnel and
the organization are accountable for risk      leadership from throughout our company to
management. For instance, we have an           evaluate performance and discuss strategic HES&S,
enterprise risk manager who works with         corporate citizenship and public policy issues. This
officers and senior managers to confirm        interactive forum ensures executive leadership
we have the necessary programs in place        remains informed and up to date on HES&S
to manage risk and identify emerging risks.    and corporate citizenship matters affecting the
The Board and the executive leadership         company, including climate-related matters, and
team frequently discuss various ERM topics.    provides a platform to discuss these issues with
Material risks to our company are disclosed    HES&S leadership.
in the Risk Factors section of our Annual
Report on Form 10-K that is filed with the     CLIMATE POLICY STEERING COMMITTEE
Securities and Exchange Commission.            Focuses on policy-related issues such as emerging
                                               environmental regulations, consumer mandates,
Carbon emissions policy and emerging
                                               biofuel mandates, methane regulations, cap and
technology have been identified as
                                               trade systems, carbon taxes and other stakeholder
enterprise-level risks that are regularly
                                               concerns that could affect our business.
reviewed as part of our ERM process and
with our executive management and the          EMERGING TECHNOLOGY STEERING COMMITTEE
Board’s Sustainability Committee. To aid       Focuses on technical issues surrounding emerging
in managing climate-related risks and          technologies that affect carbon emissions such
identifying opportunities, our executive       as automobile engine efficiency, carbon capture
leadership has established several internal    and sequestration, renewable energy and electric
committees that are developing integrated      vehicles to understand how technology is advancing
strategies to effectively predict and manage   and if or when a potential significant market
different aspects of climate-related risks     penetration could occur.
and opportunities.
                                               RENEWABLE ENERGY STRATEGY TEAM
                                               Focuses on business development opportunities
                                               associated with renewable fuels and renewable
                                               energy.

8    Governance and Risk Management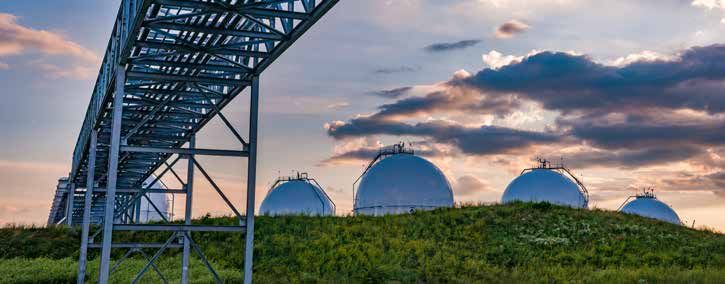
Climate-Related Risks, Business
Planning and Capital Allocation                            In 2018, our midstream facilities
Climate-related risks assessed through our                  processed 7.5 billion standard
ERM process are some of the many                             cubic feet per day of natural
considerations in our business planning                    gas, which represents 10.1% and
processes. Our economists use information                   2.1% of the natural gas demand
from our various internal committees, along
                                                             within the United States and
                                                                worldwide, respectively.
with market data and projections from sources
such as the IEA and U.S. Energy Information              Source: MPC 2018 Form 10-K and IEA, World Energy Outlook 2018

Administration (EIA), to develop various long-
term price forecasts that form the basis for
capital allocation. Using this data, we apply a      Within our Refining and Marketing segment we
risk-based capital allocation process with higher    are focusing investment on sustaining capital
return-on-investment (ROI) thresholds for            with an emphasis on upgrading capabilities,
business segments with the greatest financial and    yield flexibility and conversion capacity so that
regulatory uncertainty. Business segments that       we maintain flexibility to efficiently produce the
would be most affected by high carbon pricing,       refined products most in demand worldwide.
like our refineries, must achieve higher internal    Over the past five years our refineries have
ROI thresholds than segments that would be less      invested hundreds of millions of dollars on
affected by carbon pricing, like our midstream or    projects that have reduced the carbon intensity
retail assets.                                       of our operations and made our operations more
                                                     competitive worldwide. We are also allocating
Our capital allocation strategy is driving
                                                     roughly $450 million to convert our Dickinson
investment decisions that are consistent with
                                                     refinery into a renewable diesel refinery capable of
the IEA’s scenario projections, including the
                                                     producing up to 12,000 bpd of renewable diesel.
Sustainable Development Scenario (SDS). For
                                                     This project is ongoing with an expected start-up
instance, due to its lower carbon intensity as
                                                     date in late 2020. This investment strategy is also
compared to coal, the IEA projects a significant
                                                     consistent with IEA’s projections, which indicate
increase in natural gas production is needed
                                                     an increase in biofuels production and increased
over the next 10 years to quickly displace coal
                                                     competitiveness within the refining industry.
in the power sector. The IEA also projects
that natural gas will become the dominant
fuel used worldwide by 2040 in its SDS. Our
capital allocation strategy aligns well with these
projections. Since 2015 we have invested more
than $17 billion to acquire and organically grow
our natural gas and natural gas liquid (NGL)
assets. We are now one of the largest natural
gas gathering and processing companies in the
United States.

                                                     We are converting our Dickinson refinery to process corn and soybean
                                                     oil instead of crude oil.

                                                                           Governance and Risk Management                9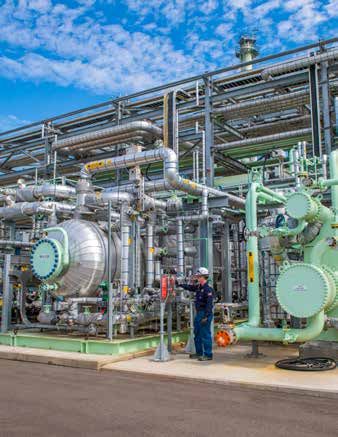
A process specialist at MPC’s refinery in Los Angeles, California.

Climate Scenario                                                     These scenarios provide our company with several
                                                                     versions of the future to consider so we can plan

Planning                                                             ahead and adjust appropriately as the future
                                                                     unfolds. In this year’s report, we apply the following
As part of our ERM process, we conduct a                             three hypothetical scenarios:3
review of our business portfolio against several                     • Current Policies Scenario (CPS) — considers only
future scenarios using projections from the                            those climate policies that have been formally
IEA. We also rely on data from HSB Solomon                             adopted by governments. This scenario provides
Associates2 to determine whether any of our                            a comparison point against which new policies
refining assets are at risk under the various                          can be assessed.
scenarios. The results of this review are reported
                                                                     • New Policies Scenario (NPS) — the central
to the Board’s Sustainability Committee and
                                                                       scenario from IEA that aims to provide a sense
presented in this report.
                                                                       of direction for the energy sector. It incorporates
Annually, the IEA publishes its World Energy                           existing energy policies, as well as an assessment
Outlook that includes several different scenarios.                     of the results likely to occur from implementation
These scenarios provide a glimpse at the                               of announced intentions, notably those in
possible future energy landscape, with the aim                         climate pledges submitted for the Paris Climate
of providing governments, companies and other                          Agreement (COP21).
stakeholders with a range of potential outcomes
                                                                     • Sustainable Development Scenario (SDS) —
to consider.
                                                                       an aspirational construct of policy-driven
The outcomes modeled by the IEA range from                             improvements with multiple goals, including:
business as usual to deep decarbonization.                             1) to ensure universal access to affordable,
They also model different sustainability goals,                        reliable, sustainable and modern energy services
such as limiting global temperature rise to below                      by 2030; 2) to substantially reduce air pollution;
2 degrees Celsius, ensuring all people have access                     and 3) to limit worldwide temperature increases
to affordable and reliable modern energy, and                          to less than 2 degrees Celsius.
curbing air pollution.

10       Climate Scenario Planning
Outlook for Energy through 2040
WORLD ENERGY DEMAND
In recent years, the world has significantly increased its energy efficiency. Importantly, this has been
accomplished while also providing access to energy for more people. The global energy landscape will
continue to evolve over the next 30 years as the population increases and standards of living rise in many
developing nations. An estimated 2 billion more people will create a need for additional energy to deliver
electric power to light and cool homes, gas to heat homes, clean cooking fuel to provide nourishment, and
fuel for transportation.
The IEA’s projections factor all these realities into its three principal scenarios while balancing carbon
emissions. The overall takeaway is that a diversified energy portfolio, along with continued advancements in
energy efficiency, will be required to meet future energy needs and the climate goals being modeled. While
oil and gas will remain the dominant sources of energy for the foreseeable future, the scenario projections
indicate that the oil markets will continue to become more competitive, favoring the most efficient producers.
The most dramatic shift is expected to involve moving from coal to gas, renewables and bioenergy.
IEA Energy Projections for 2040 at a Glance
The IEA projects a shift away from coal in favor of renewables and nuclear with oil and gas
providing approximately 50% of total energy demand under all three scenarios.
Sustainable
2017* Current Policies New Policies Development
Actuals Scenario Scenario Scenario
Crude Oil Crude Oil Crude Oil Gas
32% 29% 28% 25%
Coal Gas Gas Crude Oil
27% 25% 25% 23%
Gas Coal Coal Other Renewables
22% 25% 22% 16%
Bioenergy Bioenergy Bioenergy Coal
10% 9% 10% 12%
Nuclear Other Renewables Other Renewables Bioenergy
5% 5% 7% 11%
Hydro Nuclear Nuclear Nuclear
3% 5% 5% 9%
Other Renewables Hydro Hydro Hydro
2% 3% 3% 4%
Source: IEA, World Energy Outlook 2018 *Latest year available
Climate Scenario Planning 11SCENARIO PROJECTIONS FOR PETROLEUM-
BASED LIQUIDS
Worldwide Refined Petroleum-
The IEA projects that worldwide demand for Based Liquids Demand
petroleum-based liquids will remain strong
Actuals
through 2040, indicating a 27% increase under its
CPS and a 12% increase under its NPS. The SDS
speculates demand would remain flat through 2000
2025 followed by a 26% decline by 2040. The
following provides insight into each of the main 2017
economic sectors that influence refined liquids
demand:
Industry and Petrochemicals: Much of the Current Policies Scenario
expected efficiency gains in the global
transportation sector will come from reducing the 2025E
weight of vehicles, trucks, planes and ships. This
will be accomplished by increasing the amount of
2040E
lightweight and durable petroleum-based plastics
and composite materials in vehicles.
Electric vehicles, for example, have a high New Policies Scenario
percentage of petroleum-based materials to
offset the weight of the batteries.4 Petroleum-
2025E
based chemicals are also used in countless other
consumer products we use every day. As a result,
the demand for petrochemical feedstocks is 2040E
expected to increase by as much as 40% through
2040 even under the IEA’s carbon-constrained
SDS. Page 14 shows a few of the many Sustainable Development Scenario
petroleum-based products we use daily.
Aviation and Shipping: There are currently few 2025E
viable fuel substitution options that exist for oil
in aviation and shipping; thus, the IEA projects
2040E
an increased demand of approximately 5 million
bpd under its NPS. Due to the expected increases
in transportation miles traveled, this increase
0 25 50 75 100 125
would be much higher without planned efficiency million bpd
improvements. Efficiency improvements can be
Road transport
realized through engine and vehicle design along
with logistics optimization. The IEA also models Aviation and shipping
a slight reduction in oil demand from the sector Industry and petrochemicals
under its SDS. Other sectors
Source: IEA, World Energy Outlook 2018
12 Climate Scenario PlanningRoad Transport: Motor vehicle use is one of the main
drivers of future petroleum-based liquids demand.
Today there are approximately 1.1 billion passenger
vehicles on the road worldwide, nearly all fueled by
oil. The IEA expects the global passenger car fleet
could grow another 880 million vehicles by 2040.
With nearly 2 billion passenger vehicles on the road
in 2040, energy demand for transportation fuel will
grow significantly without further advances in fuel
efficiency. There are several factors that influence
future demand for gasoline and diesel that are
modeled in IEA’s projections: 1) worldwide fuel
efficiency of vehicles; 2) electric vehicle penetration;
and 3) advanced biofuels production breakthroughs.
The NPS assumes that there will be significant
increases in all three of these variables; however,
with the increase in the number of vehicles and miles
traveled, demand for petroleum-based fuels could
still see a slight increase. The carbon-constrained
SDS models a decline in gasoline and diesel demand
through 2040, based on even larger increases of
these three factors. However, even under the carbon-
constrained SDS, petroleum-based fuels would still
continue to provide 60% of the total energy for
transportation.5
IEA Transportation Energy The IEA indicates that oil will remain the dominant
energy source in the transportation, aviation and
Projections for 2040 at a Glance shipping sectors under all three scenarios.
Sustainable
2017 Current Policies New Policies Development
Actuals Scenario Scenario Scenario
Petroleum- Petroleum- Petroleum- Petroleum-
Based Fuels* Based Fuels* Based Fuels* Based Fuels*
92% 88% 82% 60%
Other Fuels** Other Fuels** Other Fuels** Electricity
4% 5% 8% 14%
Biofuels Biofuels Biofuels Biofuels
3% 4% 6% 13%
Electricity Electricity Electricity Other Fuels**
1% 2% 4% 13%
*Petroleum-based fuels includes gasoline, diesel, jet fuel and marine fuel.
**Other fuels include compressed natural gas and hydrogen. Source: IEA, World Energy Outlook 2018
Climate Scenario Planning 13Petroleum Makes
Modern Life Possible
Petroleum-based products are ubiquitous in modern life. These uses and more are
part of the reasons petrochemical feedstock demand is projected to rise over the next decades.
SUNGLASSES TOOTHBRUSHES SCRUBS GLUE
TENNIS SHOES CRAYONS PAINT
SOLAR PANELS WIND TURBINES AUTOMOBILES MEDICINE X-RAYS
BICYCLES PHONES AIRPLANES
COMPUTERS SPORTS EQUIPMENT BALLOONS CAR SEATS PROSTHETIC
LIMBS
14 Climate Scenario PlanningSCENARIO PROJECTIONS FOR NATURAL GAS
Natural Gas Demand
The IEA projects demand for natural gas will
Projections through 2040
increase under all three of its scenarios, even
the SDS. Increased demand comes primarily Actuals
from higher demand in the power, industrial and 2000
transportation sectors. The NPS also projects
U.S. natural gas production will increase by 41% 2017
through 2040, resulting from increased shale
gas production and liquefied natural gas (LNG)
New Policies Scenario
exports. During this same period, demand is
expected to increase significantly for non- 2025E
methane fractions of natural gas, such as ethane,
2040E
propane, butane, pentane, natural gasoline
and condensates. These NGLs are becoming
important feedstocks for the petrochemical Current Policies Scenario
industry (e.g., ethane cracking), while condensate 2025E
can be easily processed at refineries. Increased
fractionation of liquefied petroleum gases (LPGs), 2040E
like propane and butane for clean cooking fuel, is
also a key goal of the SDS. Developing economies Sustainable Development Scenario
in Asia and Africa represent the bulk of the
2025E
growth in residential LPG demand, but these
regions do not have sufficient refining capacity or 2040E
indigenous NGL production to meet their needs.
Thus, a large share of demand must be met by
0 1,000 2,000 3,000 4,000 5,000 6,000
imports from the United States.
billion cubic meters
Source: IEA, World Energy Outlook 2018
The Hopedale gas processing complex in Jewett, Ohio.
Climate Scenario Planning 15SCENARIO PROJECTIONS FOR BIOFUELS
Biofuels Demand
The advancement of renewable biofuels is a
Projections through 2040
key component of the IEA’s climate scenarios.
Biofuels are liquid fuels derived from biomass
Actuals
or waste feedstocks and include ethanol,
biogasoline, biodiesel and renewable diesel. 2000
Ethanol and biodiesel are typically blended
2017
with petroleum fuels (gasoline and diesel),
whereas renewable diesel can be used as a
drop-in substitute for conventional diesel. The Current Policies Scenario
IEA projects that biofuels demand will continue
2025E
to grow through 2040 under all three of its
scenarios. 2040E
Because biofuels are sourced from biomass
materials (e.g., corn, soybeans), the carbon
New Policies Scenario
released from burning these fuels is considered
to be offset by the carbon that was removed 2025E
from the atmosphere by the biomass used to
2040E
produce the fuel. However, biofuels are not net-
zero emission fuels because it takes energy to
turn biomass material into fuel. To produce corn Sustainable Development Scenario
ethanol, it takes energy to plant and harvest 2025E
corn, transport the kernels to the ethanol plant,
refine the material into ethanol, and transport 2040E
and deliver the final product to consumers. The
0 2 4 6 8
carbon emissions associated with each point in
Million barrels of oil equivalent per day
the value chain are added together to determine
the carbon intensity (CI) of the fuel. Biofuels Source: IEA, World Energy Outlook 2018
generally have a lower CI value than petroleum-
based fuels, but the CIs of fuels can vary widely
because of different levels of intensity in land
use practices and manufacturing processes6. An
example of this is provided on the following page.
Being more carbon efficient anywhere along the
life cycle continuum will result in a lower CI value
(e.g., more energy efficient refining or transport).
MPC’s biodiesel facility in Cincinnati, Ohio.
16 Climate Scenario PlanningComparing the Carbon
Intensity (CI) of Different Fuels
Oil Extraction Transportation Refining Transportation Combustion
Gasoline
101
gCO2e/MJ
Land use change Transportation/
and farming corn Transportation Biorefining Blending Combustion
Corn
Ethanol
53-86
gCO2e/MJ
Combustion emissions are considered offset by the carbon previously removed from atmosphere by the plant material.
Land use change Corn/soy oil
and farming collection and Transport of Transportation/
corn/soy transport oil to refinery Biorefining Blending Combustion
Renewable
Diesel
31-57
gCO2e/MJ
Combustion emissions are considered offset by the carbon previously removed from atmosphere by the plant material.
gCO2e/MJ = grams of carbon dioxide per megajoule of energy
Source: California Air Resources Board, Approved Pathways as of Aug. 12, 2019.
Climate Scenario Planning 17Summary of Climate-Related Risks and Opportunities
Part of performing the scenario analyses involves identifying relevant climate-related risks and opportunities.
POTENTIAL RISKS POTENTIAL OPPORTUNITIES
• The demand for traditional transportation fuels • Worldwide and domestic demand for natural
could decrease in many countries, including the gas and NGLs is expected to increase through
U.S., due to government regulation, increased 2040, even in the SDS. This higher demand
fuel efficiency of internal combustion engines, is driven by increased use in the power,
increased market share of electric vehicles7 petrochemical, industrial and transportation
and increased biofuels consumption in the sectors.
transportation fleet. • Worldwide demand for petrochemical
• Additional greenhouse gas (GHG) regulations feedstocks is expected to increase through
could be implemented, such as requirements 2040. The IEA notes there are few substitutes
to further reduce methane emissions from our for oil- and gas-based feedstocks for the
midstream assets or a carbon tax or similar petrochemical industry.
effort that increases the costs of our products, • Energy-efficiency requirements for facilities
thereby reducing demand. are projected to increase. We consider energy
• We could face increased climate-related efficiency to be a core business function and
litigation with respect to our operations or opportunity, because it reduces costs while
products. reducing GHG emissions, enhancing our
• Physical risks, such as intense weather patterns, competitiveness.
sea-level rise or water stress, have the potential • Through 2040, gasoline and diesel demand
to impact our facilities. is expected to increase in many developing
• Transitional risks could occur, such as a shift in countries. Our assets are favorably located for
consumer preferences that affect demand. export to these countries.
• While we do not conduct hydraulic fracturing • Worldwide and domestic demand for biofuels
operations, we do provide gathering, in the transportation fleet is expected to
processing, fractionation and logistics services increase through 2040, especially in the SDS.
for natural gas, oil and NGLs produced by
others. We also purchase crude oil and natural
gas as feedstocks and fuel for our refineries. As
a result, any prohibitions on hydraulic fracturing
or increased regulation of the upstream oil and
gas industry could affect our business.
• Increased regulations and litigation surrounding
pipeline construction and siting, including
consideration of GHG emissions downstream
of pipeline operations, could have a negative
impact on our ability to transport our feedstock
and products.
Ray Brooks, Executive Vice President of Refining, accepts the ENERGY
STAR Partner of the Year Award from the U.S. EPA.
18 Climate Scenario PlanningResults of the Climate-Related processing capacity in our Midstream segment, and
Scenario Analyses we target capital investment at our refineries toward
upgrading capabilities, yield flexibility and conversion
We conducted scenario analyses of climate risks and capacity so that we maintain flexibility to efficiently
opportunities across our three business segments. produce the refined products most in demand. As we
The detailed analyses below indicate our overall highlighted in the Governance and Risk Management
business strategy is consistent with the IEA’s section starting on Page 7, we also maintain higher
projections, and we are continuously evaluating return-on-investment thresholds within our Refining
risks for our business segments and implementing and Marketing segment, which naturally shifts an
strategies to effectively manage these risks. The increasing amount of capital toward midstream gas
significant growth we have accomplished over the projects that have lower thresholds. To date, we
past five years has diversified our company and have invested more than $17 billion to acquire and
provided an integrated, coast-to-coast network of organically grow natural gas and NGL assets primarily
refineries, gas plants, biofuels plants, logistics assets located in the Northeast and Southwest United States.
and retail outlets. Through our master limited partnership, MPLX, we
Each business segment has unique challenges and are now one of the largest natural gas gathering and
opportunities. For instance, natural gas and NGL processing companies in the United States.
demand are expected to grow even under the IEA’s This strategy has significantly decreased the carbon
carbon-constrained SDS, while demand for some intensity of our operations over the past five years
refinery products, such as gasoline, are expected to as more and more of our manufacturing inputs shift
decline and others, such as diesel and petrochemical toward lower carbon intensity fuels. For instance,
intermediates, are expected to grow. in 2014, natural gas gathering and processing was
In other words, IEA’s projections indicate an not part of our portfolio. By 2016, the throughput
expansion of the midstream sector and a of our natural gas processing plants made up 30%
potential contraction of the refining sector. Our of our total throughput on a normalized barrel of oil
capital investment strategy aligns well with both equivalent basis. Today, gas processing accounts for
possibilities. We continue to build new natural gas 35% of our total throughput.
MPC Manufacturing Inputs and GHG Intensity*
(direct and indirect GHG emissions)
100% 38
GHG Intensity (tonnes C02e/mboe
Manufacturing Input (boe %)
36
80% 34
32
processed)
60%
30
28
40%
26
20% 24
22
0 20
2014** 2015 2016 2017 2018
Refinery Inputs Gas Plant Inputs Direct and Indirect GHG Intensity
*Includes data from facilities that MPC may have not yet owned, so that performance can be compared across the same asset base over time. Assets
included are those that MPC owned/operated as of Dec. 31, 2018.
**2014 data includes emissions from gas gathering and processing operations that were not purchased until 2015.
Climate Scenario Planning 19REFINING AND MARKETING8 North American Refining Projections
Worldwide Refining Projections • North American refining is expected to experience a
• Net refining capacity is expected to increase by modest capacity decrease of 400,000 bpd through
another 12.8 million bpd through 2040. Most of 2040. Please note, however, that IEA made this
the capacity increases are expected to occur projection prior to Philadelphia Energy Solutions’
in the Middle East, China, India and Southeast announcement that it intended to permanently
Asia. The largest decreases in capacity are close its 335,000 bpd refinery in Philadelphia,
projected in Europe, Japan and Korea. Capacity Pennsylvania, in June 2019.
in the United States, the world’s largest refining • The IEA notes that despite the projected decline
center, is expected to remain relatively flat. in gasoline demand in the United States over the
• Demand for refined products is expected to long term, U.S. refiners benefit from a high level of
be approximately 91.6 million bpd, or 82% complexity, meaning they have a greater capability
of projected capacity in 2040. Considering to produce the refined products most in demand
required downtime, the IEA projects refining globally. U.S. refineries also have an ample supply
capacity could exceed demand by 14.2 million of domestic feedstock, lower energy costs and are
bpd in 2040, putting some refineries at risk of favorably situated such that they can readily export
closure. Europe has the highest percentage to regions with increased demands for imported
of capacity at risk (34%), followed by Japan transportation fuels and other refined products
and Korea (27%), Russia (22%), North America (Africa, Asia, Europe and Latin America).
(13%) and China (9%), according to the IEA’s • The IEA also notes an increasing gasoline surplus
projections. over the long term could cause higher cost refiners,
• Under the NPS, demand for gasoline is particularly those along the East Coast of the
expected to drop slightly, and heavy fuel oil United States, to face challenges in sustaining their
demand is expected to decrease substantially utilization rates.
as a result of the International Maritime
Refining — Potential Risks and Opportunities
Organization (IMO) sulfur regulations.
Demand for other refined products, such as The primary climate-related risk to our Refining and
petrochemical feedstocks and distillates, is Marketing segment is decreased consumer demand
expected to increase. This indicates a slight for traditional transportation fuels in many developed
increase in total refined product demand. countries, including the United States, due to higher
• Under the SDS, the IEA modeled reduced vehicle efficiency standards, increased market share
demand for all transportation fuels, assuming of electric vehicles, replacement with biofuels and
regulations and technology will increase the increased regulatory costs. As we demonstrate on
efficiency of the transport, maritime and the next page, we expect our Refining and Marketing
aviation sectors, along with a significant segment to remain strong even under the carbon-
increase in the use of advanced biofuels and constrained SDS. The integration of Andeavor’s
significant electric vehicle use. refineries into our asset base is providing significant
synergies that are expected to exceed $1.4 billion
annually by year-end 2021. The integration also brings
significant capability to increase exports of our refined
products to Africa, Latin America, Europe and Asia,
where imports are expected to grow.
20 Climate Scenario PlanningResiliency of U.S. Refining
Operating costs are critical to the financial viability of United States
a petroleum refinery. These operating costs depend Refining Cost Advantage
on a number of factors, including available feedstocks,
energy costs, refinery size and complexity, utilization 125 Latin America
Relative Cost to Produce Transportation Fuels (USD/bbl)
India/China
rates, maintenance costs and labor rates. Energy and
feedstock costs represent the largest share of overall 115 Middle East
Europe
operating costs. Other Asia U.S./Canada
The U.S. refining sector benefits from lower energy and 105
feedstock costs compared to its global competitors
due to robust domestic crude and natural gas
95
production. As reflected in the graph to the right,
lower energy and feedstock costs translate into lower
overall production costs per unit of product. These 85
favorable macroeconomic differentials are greater than
the regional transportation costs, enabling the U.S. 75
refining sector to export products to other countries
and regions, including Asia, Latin America, Africa and
65
Europe. As shown to the right, this is confirmed by 0 2 4 6 8 10 12 14 16 18 20 22
steadily increasing exports of U.S. transportation fuels. Cumulative Crude Oil Distillation Capacity (million BPD)
Consistent with our internal forecasts, the IEA projects
Proprietary and Confidential © HSB Solomon Associates LLC
the United States will continue to maintain lower
energy prices through 2040 compared to other global
regions, even in the SDS. As a result, we believe the
U.S. refining sector is positioned to maintain a cost U.S. Exports of Petroleum-
advantage over other regions of the world. Based Transportation Fuels
The U.S. refining sector has the further advantage of
a higher level of technological complexity compared 2014
to other regions of the world. This provides the
2015
U.S. refining sector with greater capability to adjust
output to the products most in demand worldwide.
This is a competitive advantage because extensive 2016
capital deployment is not required to begin producing
different refined products (such as distillates and 2017
petrochemical feedstocks vs. gasoline). Further, U.S.
refineries are generally located near petrochemical 2018
facilities, providing synergies for easy delivery of
0 500 1,000 1,500 2,000 2,500
petrochemical feedstocks, reducing transportation
thousand barrels per day
costs and emissions. As a result, we expect U.S. refining
capacity utilization to remain relatively high compared
Gasoline Diesel Kerosene - Jet Fuel
to other regions as the global refining sector adjusts
output to match the reductions in transportation fuels Source: U.S. Energy Information Administration
projected by the NPS and SDS.
Climate Scenario Planning 21Resiliency of MPC Refining
The IEA notes that U.S. We retained HSB Solomon Associates LLC
refiners benefit from a (Solomon) to evaluate the resiliency of our
refineries against the projections in the IEA’s
high level of complexity, NPS and SDS, as they were presented in the
have an ample supply World Energy Outlook 2018. Solomon is uniquely
of domestic feedstock, qualified to perform this analysis because it has
lower energy costs and cost and production data for approximately 85%
of worldwide refineries through its biennial Fuels
are favorably situated Studies.9 Solomon considered the following key
such that they can readily assumptions in its analysis:
export to regions with • Refineries with high operating costs, low
increased demands for utilization and low net cash margins would cease
imported transportation operation in lieu of the entire refining sector
operating at lower utilization rates.
fuels and other refined
• Regional trade flows of transportation fuels would
products (Africa, Asia, favor certain regions over others. Other factors,
Europe and Latin such as refineries serving niche markets, were
America). also considered.
• Refinery-specific production costs and other
Source: IEA, World Energy Outlook 2017
performance data were utilized from Solomon
Associates’ 2018 worldwide Fuels Study.
• The transportation fuel demands projected in the
NPS and SDS from the World Energy Outlook
2018 were used.
• Consideration was also given to refineries in
countries that may receive government subsidies
to stay running regardless of economic pressures.
Solomon’s analysis indicates that MPC’s Refining
and Marketing segment would remain cost
competitive, even in the carbon-constrained SDS.
This is due to the U.S. cost advantages discussed
in the previous section, the location of assets
and the markets they serve, as well as our cost
competitiveness and integrated business model
relative to other U.S. refiners. As shown on the
graph on Page 21, there is a wide variation in
refinery costs within North America and worldwide.
We will continue to evaluate each of our refineries
as the future unfolds to identify further risks and
opportunities that could affect viability.
MPC’s refinery in Robinson, Illinois.
22 Climate Scenario PlanningWe will continue to implement strategies that • With the highest resid upgrading and distillate
complement the IEA’s demand projections. hydrotreating capacity of all U.S. refiners,
Some examples of commitment include: we believe we are well positioned to take
• The acquisition of Andeavor resulted advantage of producing IMO-compliant fuels
in a nationwide interconnected footprint beginning in 2020, when the IMO reduces
with significant synergies for procuring the sulfur specification of bunker fuel from
advantageous feedstocks and product 3.5% to 0.5%.
placement domestically and internationally, • Our overall weighted Nelson Complexity Index
resulting in maximum refinery utilization. score is higher than the world average, and
Our refining utilization rates are higher than by operating our refineries as an integrated
the United States and world averages. We system, we are able to optimize this complexity
expect this trend will continue as other regions, to target output toward higher-demand
such as Latin America and Europe, continue products where they are most cost effective to
to curtail production expanding our export produce within our system.
opportunities. We believe our analysis shows that our refining
• We have invested hundreds of millions of operations are in a superior position, as compared
dollars to expand our capabilities to export to other regions of the world, leading to further
from our U.S. Gulf Coast and West Coast exports as the global refining sector adjusts
refineries and terminals. Currently, we are able output to match the reductions in transportation
to export approximately 520,000 bpd of light fuels projected by the NPS and SDS. Given the
products. Future planned export expansion projected viability of our refining operations in
projects will increase our capability up to a hypothetical lower-carbon economy, other
720,000 bpd of light product, which is about facets of our operations stand to similarly benefit.
one quarter of our light product production. For example, our logistics assets — including
This capability provides us with added flexibility the storage and transportation assets in our
to market more of our gasoline and distillate in Midstream segment — would continue to be
other regions such as Mexico, Asia, Central and integral to our refining business, even in the SDS.
South America, Europe and Africa.
Extensive Light Product Export Capabilities
(Expanding markets to maintain high refinery utilization rates)
Anacortes
Light Product Export Export Volume
Capability by Location (thousand bpd)
International
Anacortes 20 Markets
Martinez 60
Los Angeles 60 Martinez
El Paso 20
Garyville 205
Los Angeles
Galveston Bay 155
Current Total 520 International El Paso
Markets
FUTURE PROJECTS Garyville
200 Mexico Galveston
(EST. 2020) Bay
Future Total 720 Other
International
Mexico
Markets
Climate Scenario Planning 23MPC’s Renewable Fuels Program For instance, approximately 20% of our refining
capacity and marketed transportation fuels are
The advancement of biofuels and other lower-
subject to the California Cap-and-Trade program
carbon fuels is a substantial market shift projected
(AB 32) and California LCFS program. To meet
by the IEA. This is because biofuels generally have
these regulatory requirements, we are making
a lower carbon intensity (CI) than petroleum-
investments to reduce the carbon intensity of
based fuels. As a result, an equal amount of energy
our California refineries, along with significant
produced from biofuels will generally release less
investments in biofuels production to manufacture
carbon to the atmosphere than the same amount
lower-carbon transportation fuels. Elements of
of energy from fossil fuels when the full life cycle
our strategy include:
of the fuel is considered. Demand projections
indicate biofuels production could increase by Ethanol: A joint venture between MPC and The
more than 300% over the next 20 years. Andersons produces more than 410 million gallons
of ethanol each year, and we blend more than
The U.S. is the world leader in the production and
2 billion gallons of ethanol into the gasoline that
use of biofuels, currently accounting for 48% of
we market and sell. In addition, we also capture
biofuels used worldwide. The primary reasons for
over 175,000 tonnes of carbon dioxide per year
biofuels demand in the United States have been
from these ethanol plants that are sold for use in
the federal Renewable Fuel Standard (RFS), which
industrial applications and the beverage industry.10
mandates volumes of different types of biofuels to
be placed into the overall U.S. fuel market, and the Biodiesel: MPC produces 80 million gallons of
California Low Carbon Fuel Standard (LCFS), which biodiesel annually at our Cincinnati biodiesel plant,
mandates an overall reduction of carbon intensity and we blend more than 95 million gallons of
across all transportation fuels sold within the state. biodiesel into the diesel fuel that we market and sell.
Compliance is achieved by blending or replacing a Renewable Diesel: We are investing roughly
portion of the traditional transportation fuel pool $450 million to convert our Dickinson, North
with renewable fuels, or by obtaining credits to Dakota, refinery into a 12,000 bpd biorefinery
meet the regulatory targets. Tax credits are also that will process corn and soybean oil to produce
available in the United States to offset the higher renewable diesel. We intend to sell the renewable
production costs of certain biofuels. For instance, diesel into the California market to comply with
biodiesel on average is around $0.80 per gallon the California LCFS.
more to produce than conventional diesel based on Biocrude: In 2020, we plan to begin purchasing a
the price of feedstocks (e.g., soybeans). crude oil substitute from Fulcrum BioEnergy, Inc.
The opportunities associated with advancing that is derived from gasifying presorted separated
renewable fuels are an extensive part of our short- municipal solid waste. We are investing more than
and long-term business strategy. We have made $9 million in our Martinez
significant investments in the production, research refinery to allow us to
and development of biofuels, along with related store the feedstock on-
wholesale marketing and retail strategies. In 2018, site and feed it into our
we delivered nearly 2.2 billion gallons of biofuels to existing fluid catalytic cracking (FCC) unit. The
consumers. project will result in a carbon intensity reduction
Much of our strategy relates to compliance with and can generate LCFS credits.
existing regulations that are consistent with those
modeled in the SDS, a less than 2-degree scenario.
24 Climate Scenario Planning®
Advanced Biofuels Research: The IEA notes that The company achieved a significant milestone
advanced biofuels created from waste oils, animal in 2018 by completing a year-long run of its
fats and lignocellulosic material, such as agricultural demonstration plant — converting sugar from
and forestry residues or municipal wastes, will sugarcane into BioFormate. Components of
need to be produced at scale to match the biofuel the BioFormate are now being used for jet fuel
volumes modeled in the SDS. We are proud to certification and to produce polyester for market
be supporting advanced biofuels research and development. Virent also previously achieved EPA
development through our subsidiary, Virent, Inc. certification of its biogasoline as a blending product
Virent is a wholly-owned subsidiary of MPC working in petroleum-based fuels and has provided fuel
to commercialize a novel process — referred to as components for use by Scuderia Ferrari in Formula
the BioForming® process — for converting biobased One racing.
feedstocks into renewable fuels and chemicals. The We continue to make progress on our demonstration
company was founded in 2002 and acquired in 2016. unit to further develop the Virent technology
Since its inception, Virent has invested over $150 toward a full-scale application. Fuels produced
million in research and development of advanced through Virent’s process have carbon intensities
biofuels and we continue to invest over $10 million about half the levels of traditional petroleum-based
per year on further development of the technology. fuels and chemicals. Virent’s fuels are also unique
One of its products, BioFormate®, is similar to in the biofuels space because Virent’s hydrocarbon
petroleum reformate, albeit derived from biomass. molecules are the same as those found in today’s
It can be processed into biorenewable products, petroleum products, but from renewable feedstocks.
including gasoline and jet fuel blending components, These molecules can be dropped into existing
bioparaxylene (a key raw material for the production infrastructure for the production of chemicals or
of polyester fibers and packaging), and biobenzene blended in high concentrations to make premium
for use in renewable plastics. quality gasoline, diesel or jet fuel.
Climate Scenario Planning 25You can also read


