2017 ENVIRONMENTAL REPORT - ENVIRONMENTAL WORK BY THE OIL AND GAS INDUSTRY FACTS AND DEVELOPMENT TRENDS - Norsk olje og gass
←
→
Page content transcription
If your browser does not render page correctly, please read the page content below
2017   ENVIRONMENTAL
       REPORT
       ENVIRONMENTAL WORK BY THE
       OIL AND GAS INDUSTRY
       FACTS AND DEVELOPMENT TRENDS
1           FOREWORD                                                                 04

    2           SUMMARY                                                                  06

    3           LEVEL OF ACTIVITY
                ON THE NCS                                                               10

    4           DISCHARGES
                TO THE SEA

    4.1         Discharges from drilling . . . . . . . . . . . . . . . . 15
    4.2         Discharges of oily water . . . . . . . . . . . . . . . . . . 17
    4.3         Treatment of oily water . . . . . . . . . . . . . . . . . . 20
    4.4         Chemical discharges . . . . . . . . . . . . . . . . . . . . . . . . 22
    4.5         Unintentional spills. . . . . . . . . . . . . . . . . . . . . . . . . . 24

                OFFSHORE OPERATIONS

    5           AND THE MARINE
                ENVIRONMENT                                                              26

    5.1         Environmental monitoring . . . . . . . . . . . 27
    5.2         Environmental risk and the . . . . . . . . . . . . . . .
                precautionary principle . . . . . . . . . . . . . . . . . 30

    6           EMISSIONS
                TO THE AIR                                                               32

    6.1  Emission sources. . . . . . . . . . . . . . . . . . . . . . . . . . . . . . . 33
    6.2  Emissions of greenhouse gases . . . 34
         6.2.1. Roadmap for the NCS . . . . . . . . . . 35
         6.2.2. The KonKraft 2020 goal . . . . . . . . . .
         and greater attention to energy . . . . . . .
         management and efficiency . . . . . . . . . . 36
    6.3 Greenhouse gas emissions . . . . . . . . . . . . . . . . .
         from Norwegian and international. . .
         petroleum operations . . . . . . . . . . . . . . . . . . . . . 37
    6.4 Direct emissions of CO2 . . . . . . . . . . . . . . . . . . 40
    6.5 Short-lived climate forcers . . . . . . . . . . . 42
    6.6 Emissions of CH4 . . . . . . . . . . . . . . . . . . . . . . . . . . . . . . . . 43
    6.7 Emissions of nmVOC . . . . . . . . . . . . . . . . . . . . . . . . 44
    6.8 The NO x agreement and . . . . . . . . . . . . . . . . . . . . . . .
         international obligations . . . . . . . . . . . . . . . 45
    6.9 Emissions of NO x . . . . . . . . . . . . . . . . . . . . . . . . . . . . . . . 46
    6.10 Emissions of SO x . . . . . . . . . . . . . . . . . . . . . . . . . . . . . . . . . 47

    7           WASTE                                                                    48

                 EFFECTS OF SEISMIC
    8            SURVEYS ON FISH
                 AND FISH STOCKS                                                         52
                                                                                                  The Norwegian Oil and Gas Association (formerly
                                                                                                  the Norwegian Oil Industry Association) is an interest
                                                                                                  organisation and employer’s association for oil and

    9           TABLES                                                                   56
                                                                                                  supplier companies related to exploration for and
                                                                                                  production of oil and gas on the Norwegian continental
                                                                                                  shelf (NCS). It represents just over 100 member
                                                                                                  companies, and is a national association in the

    10          TERMS AND                                                                         Confederation of Norwegian Enterprise (NHO).
2               ABBREVIATIONS                                                            76
2017
       ENVIRONMENTAL REPORT
       ENVIRONMENTAL WORK BY THE
       OIL AND GAS INDUSTRY
       FACTS AND DEVELOPMENT TRENDS
1   FOREWORD
    THE NORWEGIAN OIL AND GAS ASSOCIATION PUBLISHES
    AN ANNUAL ENVIRONMENTAL REPORT CONTAINING
    A DETAILED OVERVIEW OF ALL EMISSIONS/DISCHARGES
    FROM THE PETROLEUM INDUSTRY IN THE PREVIOUS YEAR.
    ITS PURPOSE INCLUDES IMPARTING EMISSION/DISCHARGE
    DATA AS WELL AS INFORMATION ON THE INDUSTRY’S
    WORK AND RESULTS IN THE ENVIRONMENTAL AREA.
The Norwegian petroleum industry has a clear ambition: it will be a world leader
in the environmental sphere. That calls for constant improvement. Detailed reporting
of emissions and discharges is essential for measuring progress and how far
goals are met.

This report derives its information from the       This environmental report contains a synthe-
Epim Environment Hub (EEH), a joint data-          sis of all emissions/discharges, as well as
base for Norwegian Oil and Gas, the Norwegian      a summary of results from research projects
Environment Agency (NEA), the Norwegian            related to the marine environment and emis-
Radiation Protection Authority and the             sions to the air.
Norwegian Petroleum Directorate (NPD).
Pursuant to the Environment Act, all operators     The definition of the petroleum industry
on the Norwegian continental shelf (NCS) must      accords with the one provided in the Norwegian
submit annual emission/discharge reports           Petroleum Tax Act. Emissions/discharges from
in accordance with the requirements specified      the construction and installation phase, on-
in the management regulations and set out          shore plants outside the scope of the Petroleum
in detail in the NEA guidelines for reporting      Tax Act, maritime support services and heli-
from offshore petroleum activities (M-107).        copter traffic are therefore excluded from
Where the operator companies are concerned,        this report.
these requirements mean that all emissions/
discharges and all waste generated from            This English version is a translation of
operations on the Norwegian continental shelf      the Norwegian report. Electronic versions
(NCS) must be reported in detail on an annual      in both English and Norwegian are published
basis. In addition to sending the emission/        on the Norwegian Oil and Gas website at
discharge report for each field to the NEA,        www.norskoljeoggass.no. The field-specific
all the data are posted to the EEH. That applies   emission/discharge reports submitted to the
both to planned and officially approved            NEA can also be downloaded from the site.
operational emissions/discharges and
to those which occur accidentally. Common
parameters ensure consistent emission/
discharge reporting from all production
licences.

                                                                                                     5
2   SUMMARY
    OVERALL DIRECT CO2 EMISSIONS FROM OPERATIONS ON
    THE NCS IN 2016 WERE DOWN SLIGHTLY FROM THE YEAR
    BEFORE. THIS DECLINE PRIMARILY REFLECTED A LOWER
    LEVEL OF ACTIVITY AND REDUCED QUANTITIES EMITTED
    FROM A NUMBER OF EXISTING FIELDS ON THE NCS.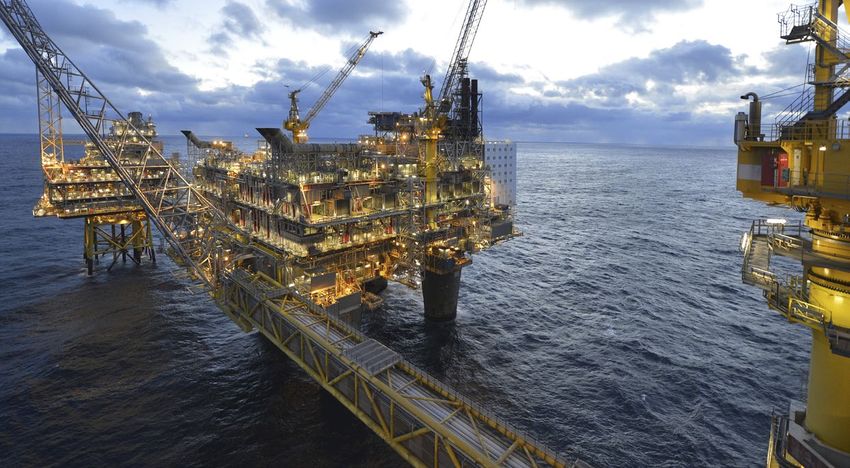
The Norwegian petroleum sector had another demanding year in 2016. Oil prices appear to have bottomed
out at the beginning of 2017, followed by a moderate upturn. Production is up somewhat because new fields
have come on stream. At the same time, greenhouse gas (GHG) emissions have fallen a little and CO2 intensity
is down. Produced water discharges were reduced and a larger proportion of produced water was being injected
in 2016, so that the quantity of oil released to the sea also fell.

Overall direct CO2 emissions from opera-        The results show that the most significant     Further reductions from earlier years also
tions on the NCS and land-based plants          factor for CO2 emissions is the types of       occurred with emissions of NOx and SOx
subject to the Petroleum Tax Act amounted       hydrocarbons in the reservoir. Technology      in 2016. This decline reflects lower use of
to 13.34 million tonnes in 2016 – a slight      development and regulatory manage-             diesel engines owing to reduced employ-
reduction from the year before. This decline    ment also play a part, along with the extent   ment of mobile units. The present envi-
primarily reflected a lower level of activity   of flaring and power from shore as well        ronment agreement under the Business
related to mobile rigs, reduced emissions       as the maturity of the continental shelf.      Fund for Nitrogen Oxides expires at the
from existing NCS fields and a fall in the      Rystad’s calculations confirm that CO2         end of 2017. Both industry and the govern-
quantity of CH4 released because the            intensity on the NCS is half the world         ment want the agreement to continue
emission factors previously utilised had        average.                                       from 2018. The 15 industry associations
been too conservative. That meant the                                                          affiliated to the fund signed a new agree-
actual emissions were lower than earlier        A roadmap for the NCS was drawn up             ment in May 2017 for 2018-25.
assumed. At the same time, total NCS            by the petroleum industry in 2016 which
production grew because new fields              sets specific goals and ambitions for          Discharges to the sea derive primarily
such as Goliat and Edvard Grieg came            further cuts in GHG emissions from oil         from drilling wells and from the produced
on stream. Emissions from such develop-         and gas production. It has been compiled       water which comes up with the oil. On new
ments are relatively lower than on older        by Norwegian Oil and Gas and the               fields, produced water consists exclusively
fields. Specific CO2 emissions per unit         Federation of Norwegian Industries             of the amount already present in the
produced (CO2 intensity) on the NCS             through KonKraft, a collaboration arena        reservoirs. However, its quantity increases
therefore declined.                             for these two organisations as well as         as the field ages because water is injected
                                                the Norwegian Shipowners Association           to maintain reservoir pressure and improve
Over the past two years, Norwegian Oil          and the Norwegian Confederation                the oil recovery factor. Treated seawater
and Gas has also implemented a joint            of Trade Unions (LO).                          is primarily used. Annual produced water
industry project on energy management                                                          discharges peaked in 2007 at around 162
and enhancing energy efficiency. This           Emissions of short-lived climate forcers       million standard cubic metres (scm).
work has focused greater attention on           from production on the NCS, with CH4           They have subsequently varied between
finding and implementing measures for           and nmVOC as the most important sources,       130-150 million scm and amounted to 138
more efficient energy use which reduces         are already low in international terms.        million scm in 2016.
GHG emissions.                                  A joint project with the Norwegian
                                                Environment Agency (NEA) revealed              On certain fields where conditions are
Rystad Energy has been commissioned             that the emission factors previously           appropriate, all or part of the produced
by Norwegian Oil and Gas to obtain              applied on the NCS have been conservative,     water is injected back into the sub-surface.
a more detailed comparison of petroleum         and that the actual figures are lower than     Such injection increased substantially
output and associated CO2 emissions             earlier assumed. According to a recent         in 2002 and has been around 20 per cent
by the world’s leading oil producers.           study, the overall proportion of CH4           of the total quantity in recent years. Just
This consultancy has developed a method         emitted on the NCS from the whole gas          over 24 per cent was injected in 2016.
for assessing emissions from every field        value chain – including the transmission       Produced water represents the most
which embraces not only production              and distribution network – comes to about      important source of oil discharges on
but also refining and combustion                0.3 per cent. This is lower than earlier
of oil and gas.                                 estimates.

                                                                                                                                              7
the NCS. The water is treated before release      Extensive substitution of chemicals has
    with the aid of technologies which differ         reduced the release of the most environ-
    between the various fields.                       mentally harmful substances to a fraction     Production from the NCS
                                                      of what it was only 10 years ago. However,    increased somewhat
    The oil content in produced water aver-           a marked increase in reported discharges
    aged 12.3 milligrams per litre across             of black chemicals occurred in 2011-14.       because of new fields.
    the NCS in 2016 – unchanged from the              This primarily reflects changed reporting     Total emissions never-
    year before. The regulatory threshold             requirements and work on substitution.
    is 30 mg/l.                                       Discharges of fire-extinguishing foam
                                                                                                    theless declined and the
                                                      were not reported earlier because this        amount of CO2 released
    Drilling discharges primarily comprise            was a safety chemical with no alternative     per unit produced
    rock particles (drill cuttings) from the          products able to offer satisfactory extin-
    borehole and drilling fluid. Discharges           guishing properties. Alternatives with
                                                                                                    was reduced.
    are only permitted from wells drilled             less environmentally harmful properties
    with water-based fluid, or when contami-          are now available. These are currently
    nation from oil-based fluid is less than          being phased in, but it will be several
    10 grams of oil per kilogram of cuttings.         years before all fields on the NCS have
    Drilling activity in 2016 declined some-          replaced the old types with new versions.
    what from the year before, particularly           As a result, mandatory fire drills and
    for exploration wells (36 compared with           system tests will mean continued foam
    56 in 2015). Despite this decline, the            discharges for several years to come.
    number of production wells remained               Discharges of black chemicals in 2016
    historically high, at 177 compared with           were less than a third of the 2014 figure.
    an average of 153 over the past 10 years.
                                                      New fire-extinguishing foams still contain
    The use and discharge of chemicals is             components which fall into the red cate-
    strictly regulated in Norway. Chemicals           gory. This contributed significantly to
    are assessed on the basis of their envi-          a marked increase in red chemical dis-
    ronmental properties and criteria laid            charges in 2013-16, which amounted
    down in the HSE regulations with associ-          to 103 tonnes in the latter year. A further
    ated guidelines. Chemical additives               contribution was made by reclassification
    are divided into four categories (green,          of certain chemicals from yellow to red.
    yellow, red and black), where green
    substances have no or very limited envi-          Extensive preventive work by the opera-
    ronmental impact while black can only             tors to avoid unintentional discharges
    be discharged in special circumstances –          has led to a continued decline in the
    where this is crucial for safety, for instance.   number of spills. Totalling 39 instances,
    The operators are required to make                acute oil discharges in 2016 were at
    regular assessments of which chemicals            a record low. Only two crude oil discharges
    can be replaced with less environmen-             larger than one cubic metre occurred
    tally harmful alternatives – known                during the year, compared with three
    as the substitution duty.                         in 2015.

8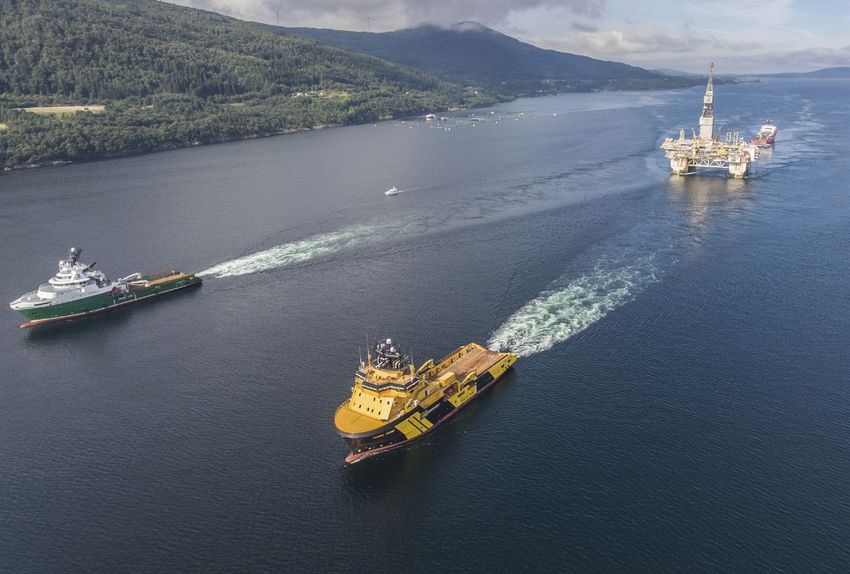
9

3   LEVEL OF ACTIVITY
     ON THE NCS
     NORWAY’S PETROLEUM SECTOR HAS BEEN THROUGH
     ANOTHER DEMANDING YEAR. COSTS ARE BEING CUT
     TO ADAPT TO LOWER OIL PRICES, AND SOME 50 000
     EMPLOYEES HAVE HAD TO LEAVE THE INDUSTRY SO FAR.

10
At the beginning of 2017, the signs are that the slump in oil prices is over and has been followed
by a moderate upturn. Continued attention will nevertheless need to be paid to cost developments
in the industry.
The oil and gas industry on the NCS has With continued attention devoted to cost in 2016. That was up 2.5 million scm oe
experienced another demanding year. trends, the role of the petroleum sector or 1.1 per cent from the year before, which
Substantial cost cuts have been required in the Norwegian economy will be reflects several new fields coming on stream
to restore profitability in the sector after expanding again. The industry is well in recent years. Total petroleum output in
the sharp drop in oil prices which began equipped for the future. 2017 is expected to be 229.5 million scm
in the summer of 2014. The result so far oe. This moderate decline must be viewed
is that 50 000 people have had to leave PRODUCTION TREND POSITIVE in relation to good regularity on the fields
the industry, while the level of capital DESPITE LOWER OIL PRICES and to the various efficiency improvement
spending has been substantially reduced. Despite low oil prices and declining invest- measures which have also significantly
At the same time, decisions on cutting ment, crude output has been rising over reduced operational and exploration costs.
petroleum output by Opec and other the past three years. At the same time, Overall production from the NCS in 2016
producer countries have helped to gas sales have remained at the same high was nevertheless down by 11.9 per cent
halt the price decline and produce level as in 2015. Final figures show that from the 2004 peak. The NPD expects total
a moderate rise since 2016. 232.7 million standard cubic metres output to rise somewhat again over the
of oil equivalent (scm oe) were sold coming five-year period.
01
Source: NPD
FIGURE
ACTUAL AND FORECAST SALES OF PETROLEUM 1971-2021
(MILL SCM OE)
Million scm oe
300
250
200
150
100
50
0
70 71 72 73 74 75 76 77 78 79 80 81 82 83 84 85 86 87 88 89 90 91 92 93 94 95 96 97 98 99 00 01 02 03 04 05 06 07 08 09 10 11 12 13 14 15 16 17 18 19 20 21
Oil Condensate NGL Gas
11Oil production could fall a little over the At the same time, the decline in output Europe. The NPD’s prediction for gas
next couple of years, and is then expected from fields long on stream was smaller sales over the next five years shows
to increase again. Natural gas liquids (NGL) than expected. The most important reasons a relatively stable level, with only
and condensate are expected to show were high regularity and the substantial small changes from year to year.
a moderate decline over the next five number of new production wells drilled.
years, while gas output could rise weakly. The NPD assumes that oil output in 2017 NGL/CONDENSATE SET TO DECLINE
Uncertainty over production forecasts will remain on a par with the 2016 figure. NGL output totalled 20.2 million scm oe
relates to further energy price trends It is expected to decline somewhat (by 2.8 in 2016, up by 0.6 million scm oe or 2.9
as well as to the number of exploration per cent) until 2020 (see figure 1), with per cent from the year before. The NPD
wells drilled on the NCS. Thirty-six of the the contribution from Johan Sverdrup estimates that this figure will decline by
latter were spudded in 2016 at a total again expected to boost production. 14.3 per cent up to 2021, which means
cost of NOK 22 billion. That was 20 wells Uncertainty relates particularly to the a reversal of the weakly rising trend seen
down from the year before, while explo- drilling of new wells, bringing new fields in recent years. Condensate production
ration costs were about 35 per cent lower. on stream, reservoir deliverability and has been declining over the past few years.
The NPD estimates that these costs will the regularity of producing fields. It amounted in 2016 to 1.9 million scm
fall by a further 15 per cent from 2016 oe, down by 23.9 per cent from the year
to 2017, and then gradually rise. FLAT TREND LIKELY FOR GAS SALES before. The NPD expects a further 15.8
Sales of gas from the NCS totalled 116.6 per cent fall in condensate output up
OIL – MODERATE DECLINE UNTIL JOHAN billion scm in 2016, down slightly by to 2021. Overall, this means NGL and
SVERDRUP COMES ON STREAM 0.5 billion scm or 0.4 per cent from the condensate production could decline by
Oil production in 2016 came to 94 million year before. Gas output has exceeded oil roughly 14.5 per cent from 2016 to 2021.
scm or 1.62 million barrels per day (b/d), production since 2010. The level of gas
compared with 91 million scm (1.56 sales is difficult to predict, even in the LIMITED BOOST TO FLUIDS OUTPUT
million b/d) the year before – an increase short term. It proved about nine per cent Fluids production (oil, NGL and conden-
of 3.3 per cent. New fields coming on higher in 2016 than the NPD forecast sate) amounted to 116 million scm oe
stream contributed more than five million the year before. That partly reflects in 2016, and may decline even further in
scm of oil in 2016. a continued high level of demand from the next few years. According to the NPD,
02
Source: NPD
FIGURE
RESOURCE GROWTH AND PRODUCTION ON THE NCS
(MILL SCM OE)
500
400
300
200
100
0
1995 1996 1997 1998 1999 2000 2001 2002 2003 2004 2005 2006 2007 2008 2009 2010 2011 2012 2013 2014 2015 2016
Resource growth Total petroleum production
12this could be reversed in 2020-21 because to be produced. Proven resources ac- Sea and 93 in the Barents Sea. Plans call
of prospects for higher oil output. Estimates counted for 4.6 billion scm oe of the latter for applications to be invited in the second
therefore indicate a possible increase figure, while estimated undiscovered quarter of 2017, with a deadline in the last
of 1.6 per cent in fluids production resources came to 2.9 billion or roughly quarter. While the North and Norwegian
from 2016 to 2021. 39 per cent of total remaining resources. Seas have so far been the most important
areas for the petroleum sector, the Barents
Forecasts for overall NCS production 24TH LICENSING ROUND Sea’s role will become increasingly
show a relatively flat trend up to the The government invited the oil companies significant in coming years.
mid-2020s. Compared with the NPD’s on 29 August 2016 to nominate blocks
previous prediction, output is now for possible inclusion in the 24th licensing INVESTMENT DECLINE CONTINUING
expected to remain higher until 2027. round. Numbered licensing rounds cover Capital spending on oil and gas operations,
That partly reflects expectations of the opened frontier areas of the NCS, including pipeline transport, totalled NOK
greater drilling activity, improved where the potential for making big 163.3 billion in 2016 and was down by
regularity for fields on stream, and discoveries is at its greatest. NOK 37.9 billion or 18.8 per cent from the
a lower level of costs which contributes year before. While cutbacks occurred in
to a faster phasing-in of new projects With each licensing round, the Ministry all investment categories, the biggest were
than was previously assumed. of Petroleum and Energy decides which from fields on stream, exploration and
areas should be incorporated when plans field development. Ongoing investment
48 PER CENT OF RESOURCES for inviting applications are drawn up. rose by no less than 70 per cent from 2010
SOLD AND DELIVERED As with the work on the 23rd round and to 2014, but fell by more than 27 per cent
The main goal of Norwegian petroleum the annual awards in predefined areas from 2014 to 2016 measured in current
policy is to facilitate profitable production (APA), the government’s commitments value. An important role was played in this
of oil and gas in a long-term perspective. to its supporting parties and the limita- development by a substantial fall in invest-
At 31 December 2016, the NPD’s resource tions imposed by the management plans ment-related costs, as illustrated in figure 3.
accounts had risen by 0.1 billion scm oe will form the basis for announcing the
from a year earlier to 14.3 billion. Of this, 24th round. The ministry proposes to In the investment survey for the first
6.9 billion or 48 per cent had been sold offer a total of 102 blocks in this round, quarter of 2017, licensees on the NCS
and delivered, while 7.4 billion remained broken down into nine in the Norwegian estimate that capital spending on oil and
gas production – including pipeline trans-
port – will come to NOK 149.4 billion for
the full year. This figure is marginally higher
03
than in the previous quarter, and reflects
FIGURE
COST PROGRESS FOR SELECTED FIELD DEVELOPMENTS
(NOK BN, 2016 VALUE) somewhat higher estimates for field devel-
opment, fields on stream, and cessation
Source: NPD
and removal. The improvement from the
250
previous quarter has been moderated by
a further reduction in estimated explora-
200 tion spending, which is expected to decline
by 13 per cent from 2016.
150
100
50
0
Autumn 2014 Autumn 2015 Autumn 2016
(Johan Sverdrup phase II, Johan Castberg, Utgard, Oda, Trestakk, Dvalin and Snilehorn).
134 DISCHARGES
TO THE SEA
DISCHARGES TO THE SEA DERIVE PRIMARILY FROM DRILLING WELLS
AND FROM THE PRODUCED WATER WHICH COMES UP FROM THE
RESERVOIR WITH THE OIL. PRODUCED WATER DISCHARGES PEAKED
AT JUST OVER 160 MILLION SCM IN 2007. THE OVERALL AMOUNT
DISCHARGED IN 2016 CAME TO 138 MILLION SCM.4.1 DISCHARGES FROM DRILLING
Drilling discharges primarily comprise rock particles (drill cuttings) from the borehole and drilling fluid.
Discharges are only permitted from wells drilled with water-based fluid, or with permission from the NEA
where contamination from oil-based fluid is less than 10 grams of base oil per kilogram of cuttings. Even
with a somewhat lower level of both exploration and production drilling, discharges were roughly on a par
with 2015.
Despite lower oil prices, drilling activity The industry primarily utilises two types treatment or injected in dedicated wells
in 2016 was relatively high (see figure 4). of drilling fluids today: oil- and water-based. beneath the seabed.
A total of 177 new production wells were Ether-, ester- or olefin-based “synthetic”
drilled during the year, the second largest fluids were also utilised earlier, but have Consumption of oil-based drilling fluid
number since 2000 but a slight decline been little used in recent years. in 2016 was on a par with the year before.
from 2015. However, exploration drilling
showed a marked decline to just 36 wells Discharging oil-based or synthetic drilling The proportion of drilling fluid injected
in 2016 compared with 56 and 57 wells fluids, or cuttings contaminated with these, was also stable, at about 29 per cent.
in the two preceding years. is prohibited if the oil concentration Injection wells have been established
exceeds one per cent by weight – in other on a number of new fields, while injec-
The fluid used when drilling wells has words, 10 grams of oil per kilogram of tion wells on certain older fields found
many functions. These include bringing cuttings. Cuttings contaminated with in 2007-09 to contain fractures and
up drill cuttings, lubricating and cooling less than one per cent of oil-based or leaks have not been replaced.
the drill bit, preventing the borehole synthetic drilling fluids may only be
from collapsing and, not least, keeping discharged with permission from the
pressure in the well under control to NEA. Spent oil-based drilling fluids and
prevent an uncontrolled blowout of contaminated cuttings are either shipped
oil and gas. ashore as hazardous waste for acceptable
04 05
FIGURE
FIGURE
DISPOSAL OF OIL-BASED DRILLING FLUID
WELLS DRILLED ON THE NCS AFTER 2000
(TONNES)
300 140 000
120 000
250
100 000
200
80 000
150
60 000
59%
72%
60%
55%
100
50%
40 000
39%
39%
50
29%
29%
31%
33%
20 000
25%
21%
0 0
00 01 02 03 04 05 06 07 08 09 10 11 12 13 14 15 16 04 05 06 07 08 09 10 11 12 13 14 15 16
Production Exploration Source: NPD Drilling fluid injected Drilling fluid sent ashore
Drilling fluid discharged
15A thermomechanical cuttings cleaner recorded as being delivered to land in Discharges of cuttings drilled out with
(TCC) technology for dealing with oil- the form of hazardous waste is substan- water-based fluids in 2016 were roughly
contaminated cuttings was adopted on tially larger. This is because cuttings from on a par with the year before at 105 000
one offshore platform in 2015. In that many fields are slurrified by adding water tonnes. Water-based fluids consist prima-
context, 9.4 tonnes of oil-based fluid so that they can be handled more easily to rily of natural components such as clay or
was discharged as contamination on and from the vessels shipping them to land. salts, which are classed as green chemi-
2 460 tonnes of cuttings. No such dis- Oil-contaminated cuttings delivered as cals in the NEA’s classification system.
charges occurred in 2016, but a number waste totalled just over 50 000 tonnes In line with Ospar, they pose little or no
of them are likely in the future under in 2013, rising to 77 000 in 2014 and risk to the marine environment when
permits from the NEA. Statoil, for example, almost 106 000 in 2015. Deliveries in discharged. The possible impact of these
has wished to utilise this technology 2016 totalled 118 000 tonnes. Water and discharges is followed up by extensive en-
on Johan Sverdrup. cuttings are separated on land, with the vironmental monitoring (see section 5.1).
former treated and discharged to sea
The quantities of cuttings presented while the latter are subject to further
above are based on calculations of the treatment in accordance with the ap-
rock drilled out. However, the amount plicable regulations.
06 07
FIGURE
FIGURE
DISPOSAL OF DRILL CUTTINGS CONTAMINATED DISCHARGE OF DRILL CUTTINGS FROM WELLS
WITH OIL-BASED DRILLING FLUID (TONNES) DRILLED WITH WATER-BASED FLUID (TONNES)
120 000 250 000
100 000
200 000
80 000
150 000
60 000
100 000
40 000
50 000
20 000
0 0
2004 2005 2006 2007 2008 2009 2010 2011 2012 2013 2014 2015 2016 2004 2005 2006 2007 2008 2009 2010 2011 2012 2013 2014 2015 2016
Cuttings Cuttings Cuttings Cuttings sent ashore Cuttings injected
sent ashore injected discharged
Cuttings discharged Cuttings exported to other fields
164.2 DISCHARGES OF OILY WATER
Discharges of oily water from petroleum operations on the NCS derive from three main sources,
with produced water accounting for the biggest contribution. Smaller contributors are displacement
and drainage water as well as jetting.
Produced water: This has been in contact in the cells, this water must be treated remains on the particles after the water
with geological formations as well as with before discharge. The seawater has has been treated in accordance with the
any oil in these, and accompanies the crude a limited contact area with the crude, regulations. The quantity of oily water
up to the platform where it is treated so the quantity of dispersed oil is usually discharged is marginal.
before being discharged to the sea. The small. The volume discharged depends
water contains dispersed oil, various on the level of oil production. Oily water can also derive from cleaning
inorganic salts, heavy metals and organic process equipment, from accidents,
compounds as well as naturally occurring Drain water: Water falling as rain or or from the deposition of oil droplets
radioactive substances. Various treatment used to wash down decks may contain released by flaring in connection with
technologies help to get its oil content chemical residues and oil. Drain water well testing and workovers.
as low as possible. The regulatory thresh- forms only a small proportion of the
old for the oil concentration in produced total quantity discharged. PRODUCED WATER DISCHARGES
water discharged to the sea is 30 milli- A continuous rise in discharges of
grams per litre (mg/l). Jetting may also form an additional produced water on the NCS was fore-
category. Particles and oily sand which cast for many years, with the volume
Displacement water: Seawater is used accumulate in the separators must be expected to exceed 200 million scm
as ballast in the storage cells on some flushed out by water jetting from time in 2012-14. However, it peaked at 160
platforms. When oil is to be stored to time. Some oil contamination million scm in 2007 and has declined
substantially since. Annual discharges
rose to almost 150 million scm in
2012-15, but declined again in 2016
to just over 138 million scm.
08 On certain fields where conditions are
FIGURE
PRODUCED WATER DISCHARGED TO THE SEA
OR INJECTED BELOW GROUND (MILL SCM) appropriate, all or part of the produced
water is injected back into the sub-surface.
200 Such injection rose substantially from
2002, and has been about 20 per cent
22%
14%
180
of the total quantity in recent years.
22%
24%
18%
17%
18%
17%
160 Twenty-four per cent, or a little over
23%
18%
20%
20%
19%
14%
140 43 million scm, was injected in 2016.
120
Produced water in new fields consists
100
exclusively of the amount already present
80 in the reservoirs. However, its quantity
60 increases as the field ages because water
is injected to maintain reservoir pressure
40
and improve the oil recovery factor.
20 Treated seawater is normally used. Oil
0 recovery factors for fields on the NCS are
2003 2004 2005 2006 2007 2008 2009 2010 2011 2012 2013 2014 2015 2016 generally well above the global average.
Water volume to the sea Produced water injected
17Despite this, discharges on the NCS are somewhat in 2016, when sources other DISCHARGES OF OTHER SUBSTANCES
comparable with international figures. than produced water accounted for WITH PRODUCED WATER
just over 32 million scm of discharges. Produced water has been in contact
The growing proportion of older fields with the sub-surface for a long time, and
means that produced water as a share DISCHARGES OF OILY WATER therefore contains a number of naturally
of the total output of oil and water has Water is treated before discharge with occurring substances. In addition to oil,
shown a rising tendency. However, it the aid of different technologies on the these typically include monocyclic and
declined somewhat in 2016 – probably various fields. The average oil content polycyclic aromatic hydrocarbons (PAH),
because a number of new fields came of produced water for the whole NCS alkylphenols, heavy metals, natural
on stream. was 12.3 mg/l in 2016, compared with radioactive materials, organic substances,
the official requirement of 30 mg/l. organic acids, inorganic salts, mineral
Monitoring has not identified any envi- That was on a par with the year before particles, sulphur and sulphides. Their
ronmental effects from releasing produced and a slight decline from 2014. composition will vary from field to field,
water (see section 5.1). depending on sub-surface properties.
The quantity of oil in produced water The content of environmentally hazardous
DISCHARGES OF OTHER WATER TYPES discharged to the sea fell from just over substances is generally low, close to the
Displacement water dominates discharges 1 800 tonnes in 2015 to 1 697 (see figure natural background level in seawater.
of other water types. The volume discharged 12). A total of 1 805 tonnes of oil was
declined steadily up to 2009-11 and there- released in water on the whole NCS
after rose slightly. However, it declined in 2016.
09 10
FIGURE
RATIO BETWEEN PRODUCED WATER AND OIL
FIGURE
DISCHARGES TO THE SEA OF OTHER
PRODUCTION ON THE NCS (CU.M) OILY WATER TYPES (MILL CU.M)
2.5 90
80
2.0
70
60
1.5
50
40
1.0
30
20
0.5
10
0.0 0
93 94 95 96 97 98 99 00 01 02 03 04 05 06 07 08 09 10 11 12 13 14 15 16 97 98 99 00 01 02 03 04 05 06 07 08 09 10 11 12 13 14 15 16
Produced water/oil Drain Displacement
1811 12
FIGURE
OIL CONCENTRATION IN PRODUCED WATER
FIGURE
OIL CONTENT IN WATER DISCHARGED
DISCHARGED TO THE SEA (MG/L) ON THE NCS (TONNES)
35 2 000
1 800
30
1 600
25 1 400
1 200
20
1 000
15
800
10 600
400
5
200
0 0
03 04 05 06 07 08 09 10 11 12 13 14 15 16 03 04 05 06 07 08 09 10 11 12 13 14 15 16
Regulatory requirement Oil concentration Jetting Drain Displacement Produced
194.3 TREATMENT OF OILY WATER
The strategy of zero harmful discharges on the NCS is pursued using a risk-based approach, where risk
assessments ensure that measures are applied where they have the biggest environmental effect while
also providing a sensible cost/benefit balance. These efforts have led to a substantial reduction in oil
released to the sea by injecting produced water below ground or treating it before discharge.
Research as well as environmental impact ■ A good treatment effect can be achieved
factor (EIF) calculations show that certain on some fields with simple techniques,
chemical additives and natural compo- while others face more challenging Substantial investment
nents from the sub-surface discharged conditions and require additional has been made in treat-
together with produced water can have measures. Even when the latter are
harmful effects on aquatic organisms. implemented, variations in conditions ment technology and
However, this relates to concentrations can lead to significant fluctuations investment to reduce oil
only found close to the discharge point – in the treatment effect.
discharged in produced
within a distance of a few hundred metres. ■ Different treatment techniques have
Chemical additives which contribute to limitations related to operational condi- water. Injection is always
the environmental risk are subject to sub- tions, including oil type, water quality considered on new fields
stitution (see section 4.4). Water-column and volume, pressure changes, use of
monitoring on the NCS confirms that no chemicals, phasing in wellstreams from
as a possible strategy for
negative effects can be demonstrated from other fields and so forth. handling produced water.
the discharges beyond the immediate ■ A technique which works well in one
vicinity (see chapter 5). Effects relate location can accordingly be less suitable
primarily to outcomes in biomarkers. or inappropriate elsewhere.
■ The success of treatment can fluctuate
Substantial investment has been made substantially over time – from one month
in treatment technology and injection to another and from year to year – as
in order to reduce oil discharged with a result of varying operating conditions.
produced water. On some fields, several
billion kroner have been spent on treat- The best available techniques (BAT) are
ment solutions for oily water. Running assessed when evaluating a solution for
such facilities also costs from a few to the individual field. Such assessments
several tens of millions of kroner per extend far beyond simply looking at dis-
annum. New treatment technology and persed oil in water. Energy consumption
improved operation have reduced the and cost are other key subjects, for example.
concentration of oil in produced water Where new fields on the NCS are concerned,
on a number of fields. While most fields injection is always assessed as a possible
have discharges far below the regulatory strategy for handling produced water.
ceiling of 30 mg/l, some experience However, not all fields have reservoirs
problems for various reasons in achieving with the right properties for injecting
stable operation of injection facilities produced water. Where conditions are
and treatment processes. appropriate for injection, this is often
a preferred option based on environmental
On behalf of Norwegian Oil and Gas, DNV assessments. The volume of produced
GL has reviewed discharge data and treat- water discharged to the sea declined in
ment technologies on the NCS. Its findings 2016, and the latest forecasts from the
emphasise facts which have also been NPD indicate that it will fall even further.
reported earlier by the environmental
authorities:
2021
4.4 CHEMICAL DISCHARGES
     Chemicals are assessed on the basis of their environmental properties, including persistence, potential
     for bioaccumulation and toxicity (PBT). The Norwegian government has also specified criteria in the activities
     regulations and in guidelines for reporting from offshore petroleum operations.

     Chemical additives covered by require-        The NEA’s table for classifying and         tion of chemicals has reduced the release
     ments in emission/discharge permits           reporting chemicals is presented in         of the most environmentally harmful
     are divided into four categories (green,      table 1. A more detailed description is     substances to a fraction of the level
     yellow, red and black) in accordance          provided in the NEA’s M-107 guideline       only 10 years ago.
     with the classification in the activities     on reporting from offshore petroleum
     regulations:                                  operations (in Norwegian only).             A marked increase in reported discharges
                                                                                               of black chemicals occurred in 2011-14,
        1) GREENChemicals considered to            Discharges of chemical additives from       but this trend has been reversed in the
     have no or very limited environmental         Norwegian petroleum operations totalled     past couple of years. Where red chemicals
     impact. Can be discharged without             just over 152 000 tonnes in 2016. Overall   are concerned, a steady rise has occurred
     special conditions.                           discharges have declined steadily since     since 2013. Discharges fell from 6.6
                                                   2013. Green chemicals accounted for         tonnes in 2015 to 3.6 tonnes for black
      2) YELLOW Chemicals in use, but not          almost 91 per cent of the total, while      chemicals and rose from 67 tonnes
     covered by any of the other categories.       the red and black categories accounted      to 103 tonnes for the red category.
     Can normally be discharged without            jointly for some 0.047 per cent of dis-
     specified conditions.                         charges. Yellow chemicals represented       Complex factors underlie the variations
                                                   9.4 per cent.                               in recent years, but changed requirements
      3) RED Chemicals which must be given                                                     for both reporting and substitution work
     priority for substitution, but which can      Replacing chemicals with less environ-      are the most important. An important
     be discharged with government permis-         mentally harmful alternatives – known       contribution has been that discharges
     sion.                                         as the substitution duty – represents       of fire-extinguishing foam were not
                                                   an important part of efforts to reduce      reported earlier because this was a safety
      4) BLACK Chemicals which the govern-         possible environmental effects from         chemical with no alternative products
     ment can permit to be discharged              offshore discharges. Operators regularly    able to offer satisfactory extinguishing
     in special circumstance – where this          assess the chemicals used to see if they    properties (see the HSE regulations).
     is crucial for safety, for instance.          can be substituted. Extensive substitu-     Alternatives with less environmentally
                                                                                               harmful properties are now available.
                                                                                               These are now being phased in, but it will
                                                                                               be several years before all fields on the

              13
     FIGURE

                   BREAKDOWN OF DISCHARGES OF CHEMICAL ADDITIVES                               NCS have replaced the old types with new
                   FROM THE NCS BY THE NEA’S CATEGORIES (2016)                                 versions. Mandatory drills and system
                                                                                               tests will therefore lead to discharges
                                                                                               of black chemicals for a number of years
                                                                                               to come. The new alternatives still contain
                                                                                               components categorised as red. That ex-
                                                      YELLOW                                   plains the marked increase in discharges
                                            9.4%                    BLACK   0.002%
                                                                                               for this category of chemicals. A further
                                                                                               contribution has been made by reclassi-
                                                                      RED   0.07%              fying certain chemicals from yellow
                                                                                               to red categories.

                   GREEN     90.6%

22
01 THE NEA’S TABLE FOR CLASSIFYING AND REPORTING CHEMICALS.
TABLE
SEE THE M-107 GUIDELINE FOR EXPLANATIONS WITH CHAPTER REFERENCES.
NEA colour NEA colour
Discharge Category1 category Discharge Category1 category
Vann Substances in yellow category:
Substances on Ospar’s Plonor list 201 Green Substances with biodegradability > 60% 100 Yellow
Substances covered by Reach annex IV 2 204 Green Substances with biodegradability 20-60%
Certain substances covered by Reach annex V 3 205 Green Sub-category 1:
101 Yellow
expected to biodegrade fully
Substances with no test data 0 Black
Sub-category 2:
expected to biodegrade to environ- 102 Yellow
Substances thought to be,
mentally non-hazardous substances
or which are, hazardous to genes 1.1 Black
or reproduction 4
Sub-category 3:
expected to biodegrade to substances 103 Yellow
List of prioritised substances in result which could be environmentally hazardous
2 Black
objective 1 (priority list)
1
A description of the category 3
Substances hazardous to genes 5
Removed from the red category
Biodegradability < 20% and log Pow ≥ 5 5, 4 3 Black is provided in the flow diagram.
Category in table 5-1 has been
or reproduction are understood
to mean mutagen categories (Mut)
in the activities regulations.
related to category in table 6-1 1 and 2 and reproduction categories 6
Commission regulation
to ensure correspondence with (Rep) 1 and 2, see appendix 1 987/2008. The NEA must
Biodegradability < 20% and toxicity reported figures in the two tables. to the regulations on labelling, assess whether the substance
4 Black
EC50 or LC50 ≤ 10 mg/l 4 etc, of hazardous chemicals is covered by annex V.
2
Removed from the black category or self-classification.
in the activities regulations.
4
Data for degradability and bio-
Two out of three categories: accumulation must accord with
approved tests for offshore
biodegradability < 60%, log Pow ≥ 3, 6 Red chemicals.
EC50 or LC50 ≤ 10 mg/l 4
Green Chemicals considered to have no or very limited environmental impact.
Can be discharged without special conditions.
Inorganic and EC50 or LC50 ≤ 1 mg/l 7 Red Yellow Chemicals in use, but not covered by any of the other categories.
Can normally be discharged without specified conditions.
Red Chemicals which must be given priority for substitution, but which
can be discharged with government permission.
Biodegradability < 20% 4 8 Red Black Chemicals which the government can permit to be discharged in special circumstance
– where this is crucial for safety, for instance.
14
FIGURE
DISCHARGES OF CHEMICAL ADDITIVES FROM THE NCS
BY THE NEA’S CATEGORIES (TONNES)
200 000 16 000 3 000 50
180 000 45
14 000
2 500
160 000 40
12 000
140 000 35
2 000
10 000
120 000 30
100 000 8 000 1 500 25
80 000 20
6 000
1 000
60 000 15
4 000
40 000 10
500
2 000
20 000 5
0 0 0 0
98 99 00 01 02 03 04 05 06 07 08 09 10 11 12 13 14 15 16 98 99 00 01 02 03 04 05 06 07 08 09 10 11 12 13 14 15 16 98 99 00 01 02 03 04 05 06 07 08 09 10 11 12 13 14 15 16 98 99 00 01 02 03 04 05 06 07 08 09 10 11 12 13 14 15 16
Green chemicals Yellow chemicals Red chemicals Black chemicals
234.5 UNINTENTIONAL SPILLS
Unintentional spills are defined as unplanned emissions/discharges which occur
suddenly and are not covered by a permit. Possible environmental consequences
of such releases will depend on the properties and quantity of the substance
emitted/spilt, and when and where the incident occurred.
Unintentional spills are classified 4 000 cubic metres, the second largest Unintentional chemical spills had an
in three principal categories: oil spill on the NCS occurred in 2007. overall volume of 351 cubic metres
■ oil: diesel, heating, crude, waste The combined volume in 2016 was in 2016, including 367 tonnes of green
and others 17 cubic metres. chemicals, 113 tonnes of yellow, just
■ chemicals and drilling fluid under three tonnes of red and 0.5
■ emissions to the air. UNINTENTIONAL CHEMICAL SPILLS tonnes of black.
No similar declining trend can be seen
Norway’s oil and gas industry pays great for unintentional chemical spills. These Discharged volumes were dominated
attention to adopting measures to reduce have generally lain around 150-160 inci- in 2007-10 by individual years when
incidents which cause unintentional dents annually over the past six-seven leaks from injection wells were discov-
spills. All spills down to less than a litre years, but rose substantially in 2014 to ered. These are now shut in. The biggest
are reported to the NEA in the annual 237 spills. Most of this increase occurred leak in 2016 was just under 75 cubic
emission/discharge reports. in the size category below 50 litres, where metres from a tank holding monoeth-
the number doubled as a result of clarifi- ylene glycol (MEG), which mainly
UNINTENTIONAL OIL SPILLS cations to the regulations which led comprises green chemicals.
Unintentional oil spills have generally to fewer spills being classed as oil and
declined in number over the past 20 years, more grouped as chemicals. Just over
with a clear downward trend since 2008. 160 spills occurred in 2016.
The marked fall in the number of spills
from 2013 to 2014 reflects a clarification
of the regulations which reduced oil dis-
15
FIGURE
charges but correspondingly increased UNINTENTIONAL OIL SPILLS TO THE SEA
ON THE NCS
unintentional releases of chemicals
smaller than 50 litres. Thirty-nine inci-
dents involving spillage of oil occurred 300
in 2016, compared with 47 the year
before. Spills larger than 50 litres have 250
become steadily less frequent since
1997. There were nine of these in 2016,
200
compared with 23 the year before.
A similar long-term decline can be 150
observed for crude oil spills alone. There
were 13 of these in 2016, including 100
10 smaller than 50 litres, one in the
range from 0.05 to one cubic metre 50
and two above one cubic metre.
0
The total volume of oil unintentionally
97 98 99 00 01 02 03 04 05 06 07 08 09 10 11 12 13 14 15 16
spilt varies substantially from year to
year, with the statistics affected by large Larger than 50 litres Total
single incidents. Totalling more than
2416 17
FIGURE
UNINTENTIONAL CRUDE OIL SPILLS
FIGURE
VOLUME OF UNINTENTIONAL OIL SPILLS
TO THE SEA ON THE NCS ON THE NCS (CU.M)
140 5 000
4 500
120
4 000
100 3 500
3 000
80
2 500
60
2 000
40 1 500
1 000
20
500
0 0
97 98 99 00 01 02 03 04 05 06 07 08 09 10 11 12 13 14 15 16 97 98 99 00 01 02 03 04 05 06 07 08 09 10 11 12 13 14 15 16
Smaller than 0.05-1 cu.m Larger than
0.05 cu.m 1 cu.m
18 19
FIGURE
UNINTENTIONAL CHEMICAL SPILLS ON THE NCS
FIGURE
TOTAL VOLUME OF UNINTENTIONAL
BY THREE SIZES OF SPILL CHEMICAL SPILLS (CU.M)
250 14 000
12 000
200
10 000
150
8 000
6 000
100
4 000
50
2 000
0 0
97 98 99 00 01 02 03 04 05 06 07 08 09 10 11 12 13 14 15 16 97 98 99 00 01 02 03 04 05 06 07 08 09 10 11 12 13 14 15 16
Smaller than 0.05-1 cu.m Larger than
0.05 cu.m 1 cu.m
255
OFFSHORE OPERATIONS
AND THE MARINE
ENVIRONMENT
LIKE ALL OTHER HUMAN ACTIVITY, OIL AND GAS PRODUCTION
INVOLVES A RISK OF AFFECTING THE ENVIRONMENT.
SUCH EFFECTS CAN BE CAUSED BY BOTH OPERATIONAL
DISCHARGES AND ACUTE (UNINTENTIONAL) INCIDENTS
WHICH LEAD TO DISCHARGES TO THE SEA.5.1 ENVIRONMENTAL MONITORING
The industry has worked systematically to reduce and prevent discharges. Substantial resources have
also been devoted to understanding which discharges could cause effects, so that the most effective
measures can be implemented. This commitment covers mapping and monitoring of the climate to assess
its condition, developing better methods for environmental monitoring, and research. Both preventive
and consequence-reducing measures are utilised, such as replacing chemicals (see section 4.4)
and oil spill clean-up.
The oil and gas sector conducts extensive in the intervening periods, while each of this surveillance work. It concluded
environmental monitoring of the NCS on survey will acquire more data. The next that theoretically possible toxic concen-
an annual basis. This aims to document major survey is scheduled for 2017. trations extend no more than 1 000-2 000
the condition of the environment and its Surveillance will continue to be based on metres from the release point, and that
development as a result of both human investigating caged mussels at increasing significant biological effects are limited
impacts and natural variations. Substantial distances (500, 1 000 and 2 000 metres) to a distance of less than 1 000 metres.
research work is also being pursued by from the installations and on wild fish
individual companies as well as through caught around the discharge sites. The SEDIMENT MONITORING – SEABED
funding from Norwegian Oil and Gas to research institutions which will conduct INVESTIGATIONS
such bodies as the Research Council of the water column monitoring are the Environmental monitoring has been under
Norway. These activities cover both the International Research Institute of way since the early 1970s. A major meeting
development of monitoring methods Stavanger (Iris), the Norwegian Institute of scientists, civil servants and industry
and improved understanding of the im- for Water Research (Niva), Sintef and the representatives in the late 1980s laid
pact of petroleum industry discharges Norwegian Institute of Marine Research. the basis for more systematic conduct
on the marine environment. The programme is designed to identify of sediment surveillance.
possible effects in the immediate vicinity
Monitoring covers investigations of the of a discharge as well as regional impacts. A regional approach, with monitoring
water column and benthic sediments of each region every three years, was
and fauna, as well as visual inspection This year’s survey will concentrate on introduced in 1996. In addition, a base-
of the seabed in areas where species the immediate vicinity of Statfjord A and line investigation must be conducted
assumed to be particularly vulnerable on regional stations in the Tampen area, for each field before it comes on stream
to discharges (corals, sponges and so the Egersund Bank and the southern end to document its natural environmental
forth) are present. of the NCS. Attention will be focused on condition. The NCS is divided into 11 geo-
produced water and possible links with graphic regions for seabed monitoring,
WATER-COLUMN MONITORING the drill cuttings pile at Statfjord A. which is conducted in accordance with
Produced water discharged to the sea standards described in the NEA’s guide-
contains chemical compounds which Discharges of produced water from all lines. Carried out by independent consult-
could be toxic for marine organisms. fields on the NCS totalled roughly 138 ants, the scale of this work must be related
Possible effects of discharges are million cubic metres in 2016, down to offshore petroleum activities in each
assessed with the aid of both risk anal- by about seven per cent from the year region. Scope, methods used and results
yses (EIF, see section 4.3) and environ- before. Some 1 700 tonnes of dispersed are reviewed and quality assured by
mental monitoring. oil were discharged in produced water a panel of experts on behalf of the NEA.
during 2016, spread across all dis-
Extensive changes to procedures for charge points. Monitoring of benthic habitats involves
water column monitoring have been sampling the seabed – usually with the
made by the NEA. The recommended Produced water is rapidly diluted by aid of a grab – followed by sediment
approach is now to conduct a large-scale ocean currents after discharge from the analyses to establish its physical, chem-
survey every three years, rather than the installations. This has been verified by ical and biological condition. Some stations
smaller annual inspections carried out water column monitoring. An independ- have been investigated regularly for more
previously. This will provide better time ent panel of experts reviewed both than 30 years, and the data are therefore
for further development of methods monitoring techniques and the results
27very valuable to scientists and govern- A number of major research projects Since these publications appeared, the
ment in assessing both natural and and programmes have been pursued Barents Sea drill cuttings research initi-
anthropogenic changes to the environ- by independent scientists to study ative has begun. Initiated by Eni Norge,
ment over time. Great interest there- possible effects of oil and gas industry this project has a time frame of five years.
fore exists in applying this material to discharges to the sea. These include the It aims to provide information about
the government’s administrative work, Research Council of Norway’s Marinforsk the extent of effects from drill cutting
along with data from the big Mareano programme, launched in 2015, and the discharges over time through studies
mapping programme. A project has earlier Oceans and Coastal Areas (Proof/ of seabed biology and ecology, geology
accordingly been pursued in 2016-17 Proofny) which has run for more than and oceanography. The initiative is
to assess the comparability of the two a decade. Surveillance results have been a collaboration between the University
data sets. Its findings will be published used in a number of scientific papers. of Tromsø, Akvaplan-Niva and the
during 2017. Both Proofny and the environmental Northern Research Institute (Norut).
monitoring data have been presented Wells drilled from 1989 to 2015 are
The monitoring programme is one of in review articles or reports where all being investigated. Samples were taken
the most extensive conducted regularly results and earlier papers are reviewed. 1, 2 in a straight line from the discharge
on the North Atlantic seabed, and covers point to distances of 30, 60, 125 and
an estimated 1 000 stations on the NCS. Both reviews conclude that the poten- 250 metres. This is closer than regular
Of these, about 700 are in the North Sea. tial for environmental harm from the sediment monitoring, where samples
Once the production phase has ceased, discharges is generally moderate, and are not taken at distances of less than
two further rounds of investigations that the concentrations which have 250 metres.
are conducted at three-year intervals. yielded effects in laboratory studies
do not normally occur more than about The preliminary conclusion is that
All data are stored in the MOD database, a kilometre from the discharge sources drilling operations which involve dis-
which can be accessed by scientists and and usually only a few hundred metres charging drill cuttings cause local effects,
government agencies. The MOD was from the installations. The impact of such as reduced oxygen levels and
modernised and transferred to an discharges from drilling operations is a smaller number of faunal species.
improved software platform in 2016, only detectable in the immediate vicinity However, their scope is limited to the
and the new version is now available. of the well site. Effects on benthic organ- immediate vicinity of the discharges
Its information can also be exchanged isms primarily derive from physical (less than 300 metres) and their impact
with the Norwegian Maritime Data Centre factors (particle discharges) and often is greatest in the first three years after
(NMDC), which has a large number cannot be distinguished from the impact their release. The area where visual
of partners (www.nmdc.no). Updated of the actual structure (platform) on effects can be seen is within 100-200
reports will be issued in the autumn currents and thereby on particle size metres for new wells. Older wells show
of 2017, when the final environmental in the sediment. such impacts at a distance of only 10-30
monitoring results from 2016 also metres, which indicates a rapid re-
become available. establishment of normal fauna.
Bakke et al, 2013. “Environmental impacts of produced water and drilling waste discharges from the
1
Norwegian offshore petroleum industry”. Marine Environmental Research, vol 92, pp 154–169.
Bakke et al, 2012, Langtidsvirkninger av utslipp til sjø fra petroleumsvirksomheten. Resultater fra ti års
2
forskning. Report from the Research Council of Norway (ISBN 978-82-12-03027).
28VISUAL INSPECTIONS DNV GL presented a collation of results
Visual inspections are carried out before from many studies of areas with vulner-
planned exploration drilling can begin able benthic habitats, with the emphasis The Norwegian Institute
in areas which may contain organisms on sponges, to the 2016 Environmental of Marine Research has
regarded, on the basis of the precau- Monitoring Forum. This work was based
tionary principle, as particularly vulner- on Ospar’s regional divisions from Spain concluded that no harm
able to drilling discharges. The industry in the south (region V) to region I, which to coral reefs from petro-
has developed guidelines for such embraces the Norwegian coast from the
leum activities has been
surveys where deepwater corals are 62nd parallel to north of Spitsbergen.
present. At the same time, substantial Particularly important sponge commu- demonstrated. This work
work is being devoted to developing nities with high densities of genera such is now being extended to
methods and procedures for preliminary as Geodia are found on the Tromsø Patch.
investigations to avoid physical damage Sponges are sensitive to physical stress
cover sponge communi-
to coral reefs, sponge communities from such activities as mooring rigs, ties and various sponge
and the like. The Norwegian Institute installing structures on the seabed or species.
of Marine Research has concluded that fishing – particularly with bottom trawls.
no harm to coral reefs from petroleum The results suggest that trawling is the
activities has ever been demonstrated. most important source of stress for
This work is now being extended to sponge communities. Some areas expe-
cover sponge communities and rience up to 27 000 trawling hours per
various sponge species. annum at peak, and trawl-door tracks
were registered – as frequently as every
25 metres in some areas – on the seabed
where dead sponges could be found.
29You can also read