Costs and Benefits of Data Provision - Centre for Strategic Economic Studies Victoria University
←
→
Page content transcription
If your browser does not render page correctly, please read the page content below
Costs and Benefits of Data Provision
         Report to the Australian National Data Service

                              By

                      John Houghton

                       September 2011

       Centre for Strategic Economic Studies
                 Victoria University
Costs and Benefits of Data Provision
Acknowledgements
The author would like to acknowledge the support of The Australian National Data Service
(ANDS), and thank Dr. Greg Laughlin of ANDS for all his efforts during the project, and all
those from the case study agencies who provided the necessary data for the study and
generously gave their time for interviews and questions.
Disclaimer
While every effort has been made to ensure its accuracy, neither Victoria University nor the
Centre for Strategic Economic Studies make any representations or warranties (express or
implied) as to the accuracy or completeness of the information contained in this report. Victoria
University and the Centre for Strategic Economic Studies, their employees and agents accept no
liability in negligence for the information (or the use of such information) provided in this
report.
September 2011
This work is licensed under the Creative Commons Attribution 2.5
Australia License.
To view a copy of this license, visit http://creativecommons.org/licenses/by/2.5/au/ or send a letter to Creative
Commons, 444 Castro Street, Suite 900, Mountain View, California, 94041, USA.
IICosts and Benefits of Data Provision
Summary of findings
Over the last decade there has been increasing awareness of the potential benefits of more open
access to Public Sector Information (PSI) and the findings of publicly funded research. That
awareness is based on economic principles and evidence, and it finds expression in policy at
institutional, national and international levels.
Public Sector Information (PSI) policies seek to optimise innovation by making data available
for use and re-use with minimal barriers in the form of cost or inconvenience. They place three
responsibilities on publicly funded agencies: (i) to arrange stewardship and curation of their
data; (ii) to make their data readily discoverable and available for use and re-use with minimal
restrictions; and (iii) to forgo fees wherever practical.
This report presents case studies exploring the costs and benefits that PSI producing agencies
and their users experience in making information freely available, and preliminary estimates of
the wider economic impacts of open access to PSI. In doing so, it outlines a possibly method for
cost-benefit analysis at the agency level and explores the data requirements for such an analysis
– recognising that few agencies will have all of the data required.
There are many ways in which the provision of more open access to PSI can impact upon the
costs faced by the government agency producers and the many existing and potential users of
the information. This study focuses on three main elements:
• The costs and cost savings experienced by PSI producing agencies involved in the
provision of free and open access to information;
• The costs and cost savings experienced by the users of PSI in accessing, using and re-
using the information; and
• The potential wider economic and social impacts of freely accessible PSI.
It is always more difficult to identify benefits than costs. Benefits may accrue in a variety of
ways, including cost savings, efficiency gains, and new opportunities to create value through
doing things in new ways and doing new things. These are, successively, more difficult to
quantify: not least because they often emerge over time and can only be realised in the future.
An obvious approach is to begin with the most direct and directly measurable benefits, namely
agency and user cost savings. Wider benefits are more difficult, and in some cases impossible,
to measure. In this study, we explore impacts on consumer welfare and attempt to estimate the
impacts of increased access and use, as measured by increased downloads, on returns to
expenditure on data production.
While there are some one-off costs involved in the change to open access, most are recurring
annual costs (e.g. agency IT and hosting costs, revenues foregone, etc.). Hence, both the agency
and user costs that are modelled are annual costs, and the cost savings annual savings. In terms
of the wider benefits of open access to PSI, returns to investment in data production are
recurring annual returns, lagged and discounted over the useful life of the data – using a
perpetual inventory method. Consequently, the cost-benefit comparisons presented in this study
IIICosts and Benefits of Data Provision include annual agency and user costs and cost savings as well as the wider benefits arising from increased returns to annual expenditure on data production (Figure 1). They compare the costs and benefits at the time of the transition to open access (i.e. at the prices and levels of activity of the time). Figure 1 A framework for estimating cost-benefit Source: Author’s analysis. It is clear from the case studies presented that even the subset of benefits that can be measured outweigh the costs of making PSI more freely and openly available. It is also clear that it is not simply about access prices, but also about the transaction costs involved. Standardised and unrestrictive licensing, such as Creative Commons, and data standards are crucial in enabling access that is truly open (i.e. free, immediate and unrestricted). For example, we find that the net cost to the Australian Bureau of Statistics (ABS) of making publications and statistics freely available online and adopting Creative Commons licensing was likely to have been around $3.5 million per annum at 2005-06 prices and levels of activity, but the immediate cost savings for users were likely to have been around $5 million per annum. The wider impacts in terms of additional use and uses bring substantial additional returns, with our estimates suggesting overall costs associated with free online access to ABS publications and data online and unrestrictive standard licensing of around $4.6 million per annum and measurable annualised benefits of perhaps $25 million (i.e. more than five times the costs). IV
Costs and Benefits of Data Provision

While data are more limited, there appears to have been an even more compelling case for
making fundamental geospatial data freely available. Of course, the relative cost-benefits apply
to the form of PSI involved and do not reflect in any way on the performance of the producing
agencies. Some forms of PSI underpin major industries and contribute to their growth and
prosperity. Other forms of PSI may have an important influence on policy decisions, but the
economic impacts may be more limited and difficult to trace.

The publications and data arising from publicly funded research differ somewhat from other
forms of PSI. Consequently, it is difficult to draw direct lessons for the research sector from the
case studies explored in this report. Nevertheless, it is clear that many of the same issues arise
when attempting to measure the value of the information and/or the costs and benefits
associated with providing open access to it.

The evidence from previous studies suggests that individual cases vary greatly, making
generalisation extremely difficult. Perhaps, what could more usefully be generalised are the
methods of analysis. For example, it would be useful to combine the frameworks and models
into a tool that could be applied in assessing the costs and benefits of research data curation and
sharing, and to further develop the framework for estimating cost-benefits outlined in this study
to produce a tool tailored to the analysis of the costs and benefits of providing open access to
PSI. These tools might consist of a template for data collection, a draft questionnaire outlining
the questions needed to elicit the necessary information, and a simple spreadsheet-based online
model that people could use to perform a cost-benefit analysis. The models should include all
possible quantifiable costs and benefits, but must also include qualitative issues to help to
prioritise data preservation, access and curation projects (e.g. incorporate a balanced scorecard
approach to weighing the more intangible benefits).

What this study demonstrates is that the direct and measurable benefits of making PSI available
freely and without restrictions on use typically outweigh the costs. When one adds the longer-
term benefits that we cannot fully measure, and may not even foresee, the case for open access
appears to be strong.

                                                ---

                                                                                                  V
Costs and Benefits of Data Provision
Contents
SUMMARY OF FINDINGS ................................................................................................................... III
1 BACKGROUND AND CONTEXT ................................................................................................. 1
1.1 ECONOMIC PRINCIPLES ............................................................................................................... 1
1.2 ECONOMIC EVIDENCE ................................................................................................................. 2
1.3 POLICY RESPONSES ..................................................................................................................... 3
1.4 MEASURING VALUE, COSTS AND BENEFITS ................................................................................. 5
2 A FRAMEWORK FOR ESTIMATING COST-BENEFIT .......................................................... 7
2.1 AGENCY COSTS AND COST SAVINGS............................................................................................ 8
2.2 USER COSTS AND COST SAVINGS ............................................................................................... 10
2.3 EFFICIENCY AND PRODUCTIVITY IMPACTS ................................................................................ 10
2.4 WIDER ECONOMIC IMPACTS AND BENEFITS .............................................................................. 11
2.5 A COST-BENEFIT MODEL ........................................................................................................... 12
2.6 GUIDE TO DATA REQUIREMENTS ............................................................................................... 13
3 PUBLIC SECTOR INFORMATION CASE STUDIES .............................................................. 16
3.1 NATIONAL STATISTICS (AUSTRALIAN BUREAU OF STATISTICS).............................................. 18
3.1.1 Agency costs and benefits.................................................................................................... 19
3.1.2 User costs and benefits........................................................................................................ 22
3.1.3 Indicators of use (web statistics)......................................................................................... 23
3.1.4 Wider impacts of use ........................................................................................................... 28
3.1.5 Summary of impacts ............................................................................................................ 31
3.2 SPATIAL DATA (OFFICE OF SPATIAL DATA MANAGEMENT & GEOSCIENCE AUSTRALIA)........ 32
3.2.1 Agency and user costs and benefits..................................................................................... 33
3.2.2 Indicators of use (web statistics)......................................................................................... 34
3.2.3 Wider impacts of use ........................................................................................................... 37
3.2.4 Summary of impacts ............................................................................................................ 39
3.3 HYDROLOGICAL DATA (NATIONAL WATER COMMISSION & BUREAU OF METEOROLOGY) ..... 40
3.3.1 Agency and user costs and benefits..................................................................................... 41
3.3.2 Indicators of use (web statistics)......................................................................................... 42
3.3.3 Wider impacts of use ........................................................................................................... 44
4 WIDER IMPACTS OF OPEN ACCESS TO PSI ........................................................................ 46
4.1 REPORTED IMPACTS OF SPATIAL DATA IN AUSTRALIA .............................................................. 46
4.2 IMPACTS OF PSI MORE BROADLY .............................................................................................. 48
5 LESSONS FOR THE RESEARCH SECTOR.............................................................................. 49
5.1 COST-BENEFIT ANALYSES OF RESEARCH DATA CURATION AND SHARING ................................. 50
5.2 LESSONS FOR THE RESEARCH SECTOR AND NEXT STEPS ........................................................... 52
ENDNOTES AND REFERENCES ......................................................................................................... 54
VICosts and Benefits of Data Provision
Figures and Tables
Figure 1 A framework for estimating cost-benefit ......................................................................... 7
Figure 2 PSI and public content domains with examples ............................................................. 17
Figure 3 ABS moves towards open access ................................................................................... 18
Figure 4 Estimated annual savings from FPOW/FSOW (Circa 2006-07).................................... 19
Figure 5 Estimated ongoing annual loss in revenue due to FPOW/FSOW (Circa 2006-07) ....... 20
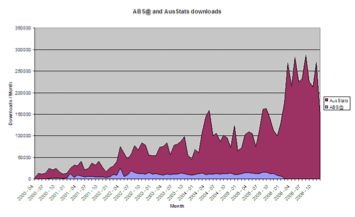
Figure 6 ABS@ and Ausstats downloads..................................................................................... 24
Figure 7 ABS website usage, 2003-04 through 2009-10 (re-based)............................................. 26
Figure 8 Downloads per page view, page published and release, 2003-04 through 2009-10 ..... 27
Figure 9 Scheduled spatial datasets delivered by government agencies, 2001-02 to 2005-06..... 36
Figure 10 Total page views or ‘hits’ reported by ASDD, 1999-2010 ............................................ 37
Figure 11 Data use and re-use from the Victorian Water Resources Data Warehouse ................. 43
Figure 12 The KRDS2 benefits taxonomy ..................................................................................... 51
Table 1 Activity cost impacts for producers and users.................................................................. 9
Table 2 Estimated net position for ABS from FPOW/FSOW and CC licensing (per annum) ... 22
Table 3 Estimated annual user cost savings from free online and standardised CC licensing.... 23
Table 4 ABS website usage, 2003-04 through 2008-09.............................................................. 25
Table 5 ABS website usage, 2003-04 through 2009-10 (re-based)............................................. 25
Table 6 Downloads per page view, page published and release, 2003-04 through 2009-10 ...... 27
Table 7 Estimates of consumer surplus from ABS free online ................................................... 29
Table 8 Estimates of increase in returns to annual spending from ABS free online................... 30
Table 9 Summary of ABS case study annual costs and benefits (circa 2005-06) ....................... 31
Table 10 Spatial datasets delivered by Australian government agencies, 2001-02 to 2005-06 .... 35
Table 11 Australian government revenue from sales of spatial data, 2001-02 to 2005-06 .......... 36
Table 12 Estimates of annual consumer surplus and increase in returns to annual spending ....... 38
Table 13 Summary of spatial data case study annual costs and benefits (circa 2005-06)............. 39
Table 14 Data use and re-use from the Victorian Water Resources Data Warehouse ................. 44
Box 1 Maximising the value of PSI through enabling maximum use ......................................... 6
Box 2 Environmental impact assessments in Europe ................................................................ 12
Box 3 Method: Welfare impacts and returns to expenditure..................................................... 28
Box 4 The Victorian Water Resources Data Warehouse........................................................... 42
Box 5 Australia’s Water Market................................................................................................ 45
Box 6 Benefits of curating and sharing publicly funded research data ..................................... 49
VIICosts and Benefits of Data Provision
1 Background and context
Over the last decade there has been increasing awareness of the potential benefits of more open
access to Public Sector Information (PSI), research publications (e.g. journal articles) and
research data. That awareness is based on economic principles and evidence, and it finds
expression in policy at institutional, national and international levels. In this section we briefly
explore the economic principles, evidence and policy responses, before turning attention to the
issue of measuring the value of enhanced access.
1.1 Economic principles
Information has public good characteristics (i.e. being non-rivalrous and non-excludable), as
one person’s consumption of a piece of information does not prevent others from consuming it
and it is difficult to prevent information spreading to others. While information can be made
more or less excludable through intellectual property rights, such as copyright, it is still difficult
to stop people sharing information. In general, the private sector will tend to under-produce such
goods as it is difficult to realise the full value. It is this that justifies public sector supply of
information (Nilsen 2007; 2009).1 Indeed, Stiglitz et al. (2000) concluded that the theoretical
underpinnings of the private versus public trade-off shifts as the economy moves toward a
digital one, with a larger public role in the digital economy.2
Economists argue that pricing above the marginal cost of dissemination is inefficient because it
results in a deadweight loss and eliminates some of the consumer surplus – some people will be
prevented from enjoying the benefit of the good even though their consumption of the good
would come at little or no marginal cost to the producer. The marginal cost of online
dissemination is close to zero. Cost recovery through such mechanisms as user fees is never
welfare enhancing (Nilsen 2007; 2009).3 For most PSI, marginal cost pricing will be the
preferable option (Pollock 2009, p40).4
Referring to Statistics Canada’s shift from cost recovery to free online access, Nilsen (2009,
p43) concluded that:
While one can predict that the agency’s sales and licensing revenues will decrease, it is
also true that usage and reuse will increase. Increased usage would have positive
externalities in terms of information dissemination and the uses to which people will put
the data, and it will also have a positive economic impact for the country as a whole,
ultimately leading to increased tax revenues that are generated by the use and reuse of
PSI.
At the same time, the agency's transaction and opportunity costs will decrease. A great
deal of money and time is currently spent determining prices, negotiating and
administering licenses, and monitoring where sales revenues are coming from, who is
paying, and who has not paid. Furthermore, much time and money is spent negotiating
with other government departments over cost recovery charges for information, which
generates a great deal of wasted transaction costs and produces no new revenues for
1Costs and Benefits of Data Provision
the government as a whole. That money could be put to other uses. I conclude that the
decreases in transaction and opportunity cost will more than compensate for the
revenue decrease; meanwhile, there will be a positive economic impact for the country
from increased use of the data and the tax revenue increases resulting from private
sector reuse. Overall this outcome will result in increased economic efficiency and a
greater net social benefit.5
Some public sector agencies retain copyright on the information they produce to enable them to
control access and the conditions of use, so that they can impose a toll on that access and use
and prevent uses that would result in the loss of control. However, economists have concluded
that government or “Crown” copyright has social costs and a negative economic impact (Nilsen
2009).6 Moreover, if the price is set to the marginal cost of online dissemination (zero), there is
no purpose to be served by retaining copyright. Indeed, as the costs of disseminating and
accessing information have declined, the transaction costs associated with charging for access to
information have come to constitute a major barrier to access in themselves (Quiggin 2010).7
Studies of transaction costs relating to information suggest that they are significant (Poplin [nee
Krek] 2010).8 Hence the efficient economic solution for the dissemination of PSI is likely to be
free libre and free gratis (i.e. making it freely available online and using unrestrictive licensing,
such as Creative Commons).
1.2 Economic evidence
Evidence suggests that PSI plays an increasingly important role in knowledge-based economies.
A number of studies have attempted to put a value on PSI, but they have used a variety of
approaches and produced a variety of answers.9
By generalising from case studies and scaling up, PIRA (2000) estimated investment value of
PSI (i.e. what governments invest in the acquisition of PSI) and economic value of PSI (i.e. the
national income attributable to activities built on the exploitation of PSI) in the European Union,
putting the former at around EUR 9.5 billion per annum in 1999 and the latter at around EUR 68
billion (equivalent to approximately 1.4% of EU GDP – a seven-fold return on investment).10
By comparison, they put PSI investment in the United States at EUR 19 billion per annum and
economic value at EUR 750 billion, suggesting that the EU could reach US levels with more
open access regimes, but would only need to double the value of PSI for governments to recoup
the lost revenues from PSI sales in increased tax receipts. The PIRA report was popularised by
Peter Weiss (2002) in the widely cited “Borders in Cyber-Space” report.11
Employing a large survey of PSI producers and users, Dekkers et al. (2006) sought to estimate
the size of the PSI market in Europe (i.e. the MEPSIR study). Based on the estimates of re-users
they put the overall market for PSI in the EU plus Norway at around EUR 27 billion
(approximately 0.25% of aggregated GDP).12 This is a much lower number than suggested by
the PIRA study, despite it being market size rather than value added and coming five years
latter. Making some adjustments with the benefit of hindsight, te Velde (2009) suggested that
the value might drop further from EUR 27 to EUR 5 billion or even EUR 3 billion13 – only
around 5% of the PIRA study estimate, and less than PIRA’s estimate of investment value.
2Costs and Benefits of Data Provision
DotEcon (2006) produced a report for the UK Office of Fair Trading (OFT) in which they
developed a bottom-up approach to estimating the economic value of PSI products and services
in the UK, seeing the net economic value of PSI as the willingness to pay for PSI minus the cost
of supplying it (essentially, the net consumer surplus). They also looked at the costs (detriment)
of barriers to use, including: unduly high prices, distortion of downstream competition, and
failure to exploit PSI.14 The results indicated that the net value of PSI in the UK was around
GBP 590 million per annum in 2005. The costs of the three types of detriment were estimated to
be GBP 20 million from high pricing, GBP 140 million from restriction of downstream
competition, and GBP 360 million from failure to exploit PSI – suggesting that the value of PSI
could be doubled by resolving the problems identified.15
Looking at spatial information in Australia, ACIL Tasman (2008) estimated that industry
revenue in 2006-07 could have been of the order of $1.37 billion and industry gross value added
around $682 million. Using a General Equilibrium (GE) modelling approach, they concluded
that the economic footprint of the spatial information industry was larger. Accumulated impacts:
• Contributed to a cumulative gain of between $6.43 billion and $12.57 billion in Gross
Domestic Product (GDP) – equivalent to 0.6% and 1.2% of GDP, respectively;
• Increased household consumption by between $3.57 billion and $6.87 billion on a
cumulative basis;
• Increased investment by between $1.73 billion and $3.69 billion on a cumulative
basis;
• Had a positive impact on the trade balance – as exports were between $1.26 billion
and $2.30 billion higher than they would otherwise have been, and imports were
between $1.18 billion and $2.23 billion higher than they would otherwise have been;
and
• Real wages were between 0.60% and 1.12% higher than they would otherwise have
been.16
What these example studies show is that different approaches to estimating the value of PSI
produce very different answers, but the common feature of these and many other studies is that
the economic and social value can be high, often far outweighing the costs of collection and
dissemination.
1.3 Policy responses
Defining PSI as “including information products and services, generated, created, collected,
processed, preserved, maintained, disseminated, or funded by or for the Government or public
institution,” OECD (2005) explored the economic issues and provided an overview of
developments within OECD countries at that time. They concluded that access, pricing and
licensing policies make a substantial difference in the levels of access to, use and re-use of
PSI.17
The OECD Recommendation on Public Sector Information, adopted by the OECD Council on
30 April 2008, provided policy guidelines designed to improve access and increase use of PSI
3Costs and Benefits of Data Provision
through greater transparency, enhanced competition and more competitive pricing.18 Inter alia,
it recommended:
• Maximising the availability of PSI for use and re-use based upon the presumption of
openness as the default rule;
• Strengthening awareness of what PSI is available;
• Ensuring methodical data collection and curation practices to enhance quality and
reliability; and
• Maximising the integrity and availability of PSI through the use of best practices in
information management.
These principles were derived from existing best practice and became the basis for further
developments in PSI access regimes in OECD countries and elsewhere around the world.
Similar principles were reflected in the recommendations of the Australian Government 2.0
Taskforce, which concluded that government should make PSI open, accessible and reusable,
suggesting that by default PSI should be: free, based on open standards, easily discoverable,
understandable, machine-readable, and freely reusable and transformable.19 In turn, these
principles were embodied in last year’s Declaration of Open Government and given force in the
passage of legislation reforming the Freedom of Information (FOI) Act and establishing the
Office of the Australian Information Commissioner, the Government’s response to the
Government 2.0 Taskforce report and its response to the Ahead of the Game: Blueprint for the
Reform of Australian Government Administration report.20
Similar principles underpin policies on research publications and research data. Around the
world, more and more research institutions and funders are introducing Open Access (OA)
policies that request and sometimes demand that research publications and, increasingly,
research data be made available in OA journals and/or repositories. Examples include major
research funders, such as the US National Institutes of Health (NIH) and the UK’s Wellcome
Trust, and such institutions as Massachusetts Institute of Technology (MIT) and CERN. In
Australia, the Australian Research Council (ARC) and National Health and Medical Research
Council (NHMRC) both mandate Open Access to the results of their funded research, and a
number of universities mandate Open Access to research performed at the institution (including
one of the world’s earliest adopters of an OA mandate, Queensland University of
Technology).21 Some countries are going one step further with what amounts to a national OA
mandate (e.g. Brazil and the proposed US Federal Research Public Access Act).
In all cases, the underlying principles are that PSI, research publications and data should be:
• Freely available at no cost, or no more than the marginal cost of distribution;
• Easily discoverable and readily accessible; and
• Open to unrestricted use and re-use on conditions that are readily discoverable and
understandable.22
4Costs and Benefits of Data Provision
As Eves (2009) put it: if it can’t be spidered or indexed, it doesn’t exist; if it isn’t available in
open and machine readable format, it can’t engage; and if a legal framework doesn’t allow it to
be re-purposed, it doesn’t empower.23
1.4 Measuring value, costs and benefits
As noted, there have been a number of approaches to measuring the value of PSI and estimating
the potential benefits of access and re-use. These have included top-down econometric
modelling, extrapolations based on surveys of PSI producers and users scaled to national or
regional markets, estimates based on agency costs and consumers’ willingness to pay, and
estimates of elasticities and multipliers.
PIRA (2000) combined measures of the investment cost (i.e. the amount spent on the
collection/generation of the PSI) and expenditure on PSI by users and re-users, then: for final
users, estimated value as expenditure on PSI or, where the PSI was freely available, as the
investment cost of its collection/generation; and for intermediaries who add value to the data
and re-sell, ascribed a proportion of their value added to the PSI used. A simplifying assumption
was that the value of the information accrued in the year that is collected/generated. This is
reasonable for some PSI, such as weather forecasts, less so for mapping information and entirely
inappropriate for research publications and data, which may take years to realise value in
application and commercialisation (and were excluded from the PIRA study). Aside from the
many difficulties in estimation and attribution, a potential problem with the PIRA approach is
that it may overestimate the value of PSI because it does not account for the possibility of the
use of alternatives.
In the MEPSIR study of Dekkers et al. (2006), demand and economic performance were
measured in an extensive survey by directly asking both public content holders and re-users for
key economic data, such as total turnover against turnover related to PSI, total number of staff
against the number of staff dedicated to handling PSI, and estimates of domestic market for a
particular type of PSI. The European PSI market value was then estimated from the average
revenues multiplied by the average number of re-users per PSI domain, minus the cost of PSI
collection/generation. For country estimates, this was distributed according to GDP. With the
benefit of hindsight, te Velde (2009) suggested that the estimates were high, perhaps 5 to 9
times too high.
DotEcon (2006) adopted a bottom-up approach to estimating the economic value of PSI
products and services in the UK, seeing the net economic value of PSI as the willingness to pay
for PSI minus the cost of supplying it. Using a survey and published sources, this was estimated
from: (i) the net consumer surplus from PSI (i.e. the amount that customers might be prepared to
pay over and above what they do pay to have access); and (ii) the total producer surplus that
arises from the provision of PSI (i.e. the extent to which revenues exceed the costs of supplying
the product or service). Adding these two estimates gave the net economic value of PSI. While
much less subject to over-estimating the value of PSI, a potential weakness of this approach lay
in estimating price elasticities of demand, especially where the PSI was supplied free of charge.
ACIL Tasman (2008) used a value-added approach based on General Equilibrium (GE)
modelling, with input data derived from case studies, which were used as a guide to estimating
5Costs and Benefits of Data Provision
the direct impacts of spatial information on selected sectors in the Australian economy, and a
GE approach to modelling economy-wide impacts. A potential issue with this approach is how
to scale from case studies to sector-wide impacts (i.e. understanding the relationship between
the cases and the sector).
Box 1 Maximising the value of PSI through enabling maximum use
The Earth’s atmosphere, oceans and landscapes are changing rapidly, with human activities
being a major driver. Monitoring and modelling these changes are critical to enabling
governments, civil society and the private sector to make informed decisions about climate,
energy, food security, natural hazard, health and other challenges.
Many empirical studies of the dissemination of public sector data and information (as well as
publicly funded data in academia) have repeatedly demonstrated the value of open access to
such information online. The lack of restrictions on their re-use provides much greater economic
and social returns than proprietary dissemination systems with access costs and re-use
restrictions. Real life cases studies mirror some of the conclusions of the empirical studies:
• CBERS (China Brazil Earth Resources Satellite) removal of imagery charges resulted in
increased access from 1,000 images per year to 10,000 images per month with more than
10,000 new users registered in the first year. Ninety-eight per cent of users surveyed
agreed with the policy of open data access and reported the creation of many new jobs, the
creation of new SMEs and improved research and teaching;
• The US Geological Survey achieved similarly impressive results following removal of
Landsat’s charges for Internet users, which resulted in more Landsat data (more than l.l
million images) being processed and distributed in FY 2009 than in the whole 38 year
mission history combined;
• Conversely, the ASTER Global Digital Elevation Model (GDEM) saw a reversal in
fortunes following the introduction of charges in January 2006, with a substantial reduction
in data distribution. A reversal in policy to no charge in June 2009 again provided a clear
indication of dramatically increased usage of ASTER data worldwide (with over 6.5
million tiles distributed in FY 2009);
• The Argo program’s public data access policy has enabled the provision of near real-time
access to the first continuous global monitoring array of ocean temperature, salinity and
velocity for use in oceanographic and climate forecasting models; and
• GBIF’s aims to make scientific biodiversity data the common property of everyone has
resulted in the publication online of nearly 200 million biodiversity records from 300 data
publishers in 54 countries.
Improving data access and sharing systems significantly increases data value by reducing the
cost and re-use restrictions for users.
Source: GEO (2010) GEOSS Data Sharing Action Plan. GEO-VII Plenary.
While all approaches have their limitations, such studies suggest that bottom-up and top-down
approaches, macroeconomic and microeconomic approaches are all feasible. Perhaps the best
approach is to try to combine them, and estimate the value of PSI and of making PSI more
openly accessible by means of triangulation.
6Costs and Benefits of Data Provision
2 A framework for estimating cost-benefit
There are many ways in which the provision of more open access to PSI can impact upon the
costs of government agency producers and the many existing and potential users of the
information. This study focuses on three main elements:
• The costs and cost savings experienced by the PSI producing agencies involved in
provision of free and open access to information;
• The costs and cost savings experienced by the users of PSI that relate to accessing,
using and re-using the information; and
• The potential wider economic and social impacts of freely accessible PSI, measured in
terms of returns to investment in its production.
Hence, the cost-benefit model outlined in this study compares the costs and benefits of
providing and gaining open access to PSI against alternative models for provision (e.g. cost
recovery). It includes: PSI producing agency costs and cost savings; PSI user costs and cost
savings; and wider economic impacts in the form of increased returns to expenditure on PSI
production.
Figure 1 A framework for estimating cost-benefit
Source: Author’s analysis.
7Costs and Benefits of Data Provision While there are some, typically relatively minor, one-off costs for agencies involved in the change to open access, most are recurring annual costs (e.g. agency IT and hosting costs, revenues foregone, etc.). Hence, the agency and user costs that are modelled are annual costs, and the cost savings annual savings. In terms of the wider benefits of open access to PSI, returns to investment in data production are recurring annual returns, lagged and discounted over the useful life of the data using a perpetual inventory method. Consequently, the cost-benefit comparisons outlined herein include annual agency and user costs and cost savings as well as the wider benefits arising from increased returns to annual expenditure on data production. They compare the costs and benefits at the time of the transition to open access (i.e. at the prices and levels of activity at the time). Looking first at PSI producers and users, we suggest that it can be useful to think about possible cost impacts in terms of agency and user activities (i.e. an activity cost model). Table 1 shows some of the main areas in which the activity costs of PSI producers and users may be effected by providing data free (i.e. at zero cost or at the marginal cost of transfer), using standardised licensing that is as unrestrictive as possible (e.g. Creative Commons), and using standard (open) data formats. 2.1 Agency costs and cost savings Agency costs and cost savings will vary from case-to-case, but there are many common elements. Collection / Creation: In general, making data freely available will have little or no impact on the activities and costs associated with data collection / creation. However, there can be some impacts on what is collected if making information freely available reduces the feedback from users as to what is of most value to them. Agencies may also collect / create less if they lose revenue from data sales and need to manage costs. Standardised licensing and data formats are unlikely to have any material impacts on agency collection costs once the standard systems are in place. Data Assurance (e.g. quality, privacy, etc.): Making information freely available may impact data quality positively or negatively: positively if greater exposure and use raises awareness of the importance of quality; negatively if the loss of revenue from data sales puts downward pressure on costs. Free access may increase the costs associated with managing privacy and confidentiality as access and use increases. Standardised licensing is unlikely to have any substantial impact on data assurance, although it may be somewhat easier to make data fit for purpose when it is more clearly understood ahead of time what purposes will and will not be ‘allowed’. Standardised data formats are likely to make data quality easier to handle. Curation (agency): Data curation costs are unlikely to be affected by making information freely available or standardised licensing, although associating licensing conditions and licenses to particular datasets would be somewhat easier. Standardisation of data formats would be likely to make digital curation easier and reduce curation costs. 8
Costs and Benefits of Data Provision

Table 1              Activity cost impacts for producers and users
Activity                          Free               CC standard licensing          Data standard

Collection /           May impact what and how                 ..                          ..
Creation                much is collected if less
                         revenue from sales.

Data assurance          May impact quality if no               ..                May make it easier to
(quality, privacy,            revenue.                                                handle.
etc.)
                        May be more difficult to
                        manage privacy if made
                           freely available.

Curation                           ..                          ..                May make it easier to
(agency)                                                                              curate.

Dissemination             Will reduce agency            Reduces license           May reduce hosting
(agency)              transaction costs for sales.     transaction costs.               costs.

                         Hosting costs may be          User support may           User support costs
                        greater if use increases.          decline.                 may decline.

                        User support costs may
                       increase if use increases.

Permission                         ..                   Reduces license                    ..
(users)                                                transaction costs.

Access                 Reduces cost of access.                 ..                          ..
(users)

Use                   Encourages/increases use.                ..               May reduce cost of use.

Re-use                             ..                   Enables re-use.       May reduce cost of re-use.

Source: Author’s analysis.

Dissemination (agency): Making information freely available is likely to have substantial
impacts on agency dissemination costs. Agency transaction costs associated with data sales will
be reduced/eliminated (e.g. operation of sales outlets or e-commerce functions, banking charges
associated with sales transactions, operation of access controls, etc.). Data hosting costs may
decrease with reduced access control and purchase association and tracking, and/or they may
increase if use increases. User support costs may also decrease with fewer access issues, and/or
increase if use increases.

Standardised licensing is likely to reduce agency costs associated with developing and
managing licensing, and reduce license related user enquiry and support costs. Standardised data
formats are likely to reduce hosting and user support costs.

                                                                                                          9
Costs and Benefits of Data Provision
2.2 User costs and cost savings
There will be differences in user cost impacts from case-to-case and the dividing line between
agency and user cost issues will vary. Nevertheless, there are likely to be common elements.
Permission (users): Standardised licensing is likely to reduce the user costs related to licensing
(e.g. easier to understand licenses, standardisation across datasets and agencies, fewer license
related enquiries, reduced transaction cost in accessing / obtaining licenses, etc.). Free access
and standardised data formats are unlikely to have any material impact of user permission
related costs.
Access (users): Free access obviously reduces the users’ cost of access in terms of the prices
paid and the transaction costs involved in each transaction/use. Standardised licensing and data
formats may also reduce user access and transaction-related costs.
Use: Free access is likely to encourage greater use of the information, while standardised
licensing and data formats are also likely to reduce the cost of, and thereby encourage greater
use.
Re-use: Similarly, as another form of use, free access is likely to encourage greater re-use of the
information, while standardised licensing and data formats are also likely to reduce the cost of,
and thereby encourage greater re-use.
2.3 Efficiency and productivity impacts
In addition to the more direct agency and user costs and cost savings, there is a number of
possible efficiency and productivity impacts arising from free access and standardised licensing
and data formats.
For agencies, potential efficiency and productivity impacts include:
• An increase in the level of use and uses per funding dollar;
• Enhanced performance against key performance indicators;
• Enhanced agency profile from greater use and exposure, which can result in greater
appreciation and central funding, and/or bring greater demand for enhanced products
and services, thereby increasing revenue; and
• Greater focus on core business activities (e.g. reduced shopfront and e-commerce
operations).
For users, potential efficiency and productivity impacts include:
• The purchase price savings and savings in handling and transaction costs noted above,
enabling cost reduction and efficiency gains;
• Greater licensing certainty / reduced uncertainty and freedom to use leading to more
predicable investment decisions, as well as savings in licensing enquiry efforts; and
• Use of better / fuller / more detailed data, rather than settling for a lesser / cheaper
substitute.
10Costs and Benefits of Data Provision
There are also some important dynamics affecting the costs and benefits of more open access to
PSI. For example:
• There may be first mover costs for agencies and users, making more open access,
standardised licensing and data formats less cost-effective for the pioneers that it is for
the followers who can learn from the pioneers. There may also be first mover
advantages, such as the kudos of being a leader. This may mean that the costs and
benefits experienced by first movers will tend to understate the advantages.
• There may be efficiency curve effects, with initiatives expensive to start with but
efficiency improving over time. This may mean that the costs and benefits experienced
in the early years of implementation tend to understate the longer-term advantages.
• There may be timing impacts and costs, as it is important how quickly data are
available and how quickly licensing can be understood and affected (e.g. immediacy
of access is important in use and avoids potentially costly delays and
workflow/decision making interruptions).
• There may also be timing impacts relating to learning, as understanding of the
conditions of access and licensing become more familiar to users over time and as
more agencies embrace more open access and standardised licensing and data formats.
Again, this may mean that the costs and benefits experienced in the early years of
implementation tend to understate the longer-term advantages.
• There may also be scale economies, with greater benefits accruing as an agency’s
and/or user’s suite of activities fall under the more open access and standardised
regime. These can be significant, and may mean that the costs and benefits
experienced in the early years of implementation tend to understate the longer-term
advantages.
2.4 Wider economic impacts and benefits
Wider economic and social impacts relate to what Beagrie et al. (2010) referred to as investors
and society or the public at large.24 Clearly the funders of the data collection (investors) have a
strong interest in protecting and maximising the return on their investment in the data collection
/ creation activity through ready availability and increased use. Where the activity is taxpayer-
funded, that interest is society wide.
In the longer term, there may also be unforseen uses and re-uses that simply cannot be
accounted for, and again this may mean that the costs and benefits experienced in the early
years of implementation tend to understate the longer-term advantages. Use and re-use can also
have wider impacts, in terms of innovation and the development and introduction of new
products, services and processes that, in turn, generate new economic activity, new business
opportunities, better informed and potentially better government and business decisions.
11Costs and Benefits of Data Provision
Box 2 Environmental impact assessments in Europe
Implementation of the European directives on Environmental Impact Assessment (EIA) and
Strategic Environmental Assessment (SEA) provides an example of the potential benefits to be
gained through full and open data sharing. A recent report published by the Joint Research
Centre of the European Commission reported that:
• The key findings of the 2002 survey revealed that the most frequent problem that
practitioners faced when using spatial data related to access (70%), followed by difficulties
with finding out which data is available (56%) and unavailability of the data needed (51%).
These problems were felt to increase both the time needed to prepare environmental
reports by 7% to 8% and their cost by 5% to 6%. Vanderhaegen and Muro (2005)
estimated that between 20,000 and 38,000 EIAs and 6,000 to 10,000 SEAs were carried
out every year in the EU-25 countries. Based on this assumption and on the above
mentioned results, in terms of turnover and time per study, it was estimated that annual
savings of EUR 100 million to EUR 230 million per annum would be achieved if
additional costs and time due to problems with the use of spatial data were removed.
• The 2009 survey found that many EIA (37%) and SEA (40%) practitioners, declared that
data acquisition costs represent between 5% and 10% of the total cost to produce an EIA or
SEA report. The most frequent problems practitioners face with the use of spatial data
relate to finding the data (59%) and low quality (58%). These problems were followed by
accessing the data (53%), integrating it (53%) and its high cost (48%). The most common
concern faced by respondents was that more time was needed to prepare EIA/SEA reports
(68%), followed by higher uncertainty of impacts (50%), lower accuracy and higher cost
(both at 47%). The results were that practitioners needed more time to prepare EIA/SEA
reports and were less certain of the impacts. The increase in costs and time caused by
problems connected with the use of spatial data was between l0% and 20% which, based
upon an average study cost of EUR 40,000, could lead to conservative savings in the order
of EUR 150 million per annum in the countries of the European Union.
Source: Craglia, M. et al. (2010) The Use of Spatial Data for the Preparation of Environmental Reports in
Europe, JRC-IES, EUR24327 EN – 2010; and GEO (2010) GEOSS Data Sharing Action Plan. GEO-VII
Plenary.
2.5 A cost-benefit model
Cost-benefit analysis of PSI case studies can be founded on an activity cost model, adjusted for
the specific case, which relates to the situation before the data were made freely available and
afterwards, highlighting activity and cost differences for both the PSI producing agency and its
users.
For the PSI producing agency, it is necessary to explore: the costs involved in data provision
(i.e. looking at the current costs and the costs of the previous system, exploring the differences,
where the costs fall and how they are met); and the agency’s perceived and/or measured benefits
from open provision (i.e. looking at the direct activity costs and/or cost savings, and cost and
other impacts on the agency, as well as cost differences and where savings arise and who
benefits).
For users of the PSI producing agency’s data, it is necessary to explore: the access and use costs
involved currently and in the previous system (i.e. indicative user costs of access and use in the
12Costs and Benefits of Data Provision
current and previous systems); and extrapolate from these, based on previous and current user
counts.
While there are a number of approaches to assessing the wider benefits of enhanced access to
PSI, here we focus on two. The first uses a simple microeconomic welfare approach and might
be interpreted as indicative of the lower bound impact, and the second uses a macroeconomic
approach in an attempt to include the multiplier impacts that are not captured in the first. While
no more than exploratory, both have the merit of simplicity and being relatively undemanding in
terms of data requirements. Briefly, they can be described as follows.
The Welfare Approach: Consumer surplus is the difference between the price that the consumer
is willing to pay and the price actually paid (i.e. the net economic benefit to consumers). The
level of consumer surplus depends on the price elasticity of demand, which is the percentage
change in demand resulting from a percentage change in price. While there are many limitations
when the price change is large and the price approaches zero, consumer surplus can be
estimated from data on revenue and the elasticity of demand (i.e. the demand response to
changes in price).25
The Returns Approach: There are similarities between some forms of observation and survey-
based PSI and the publications and data arising from publicly funded research. To that extent, in
some cases, it may be possible to use methods relating to returns to R&D to explore the wider
impacts of making some forms of PSI freely available online (Houghton 2009).26 The standard
Solow-Swan model makes some key simplifying assumptions, including the assumption that all
knowledge is equally accessible to all entities that could make productive use of it. Obviously,
this is not realistic. In the real world, there are limits and barriers to access. Houghton and
Sheehan (2009) developed and applied a modified Solow-Swan model in which they introduced
accessibility as a negative or friction variable, and then looked at the impact on returns to R&D
of reducing the friction by increasing accessibility.27 While there are limitations when applying
average returns to specific forms of data, indicative changes in return on investment can be
estimated from expenditure data and the elasticity of demand.
These approaches are further described in Box 3 and used in the case study analyses (below).
2.6 Guide to data requirements
Background information required for analysis includes an understanding the PSI producing
agency. For example, it may be important to:
• Clarify exactly what is and what is not freely available (free gratis and free libre), and
to understand the mix and shares of each, costs of and revenues from each;
• Consider the issue of incentives for the agency of the various charging policies and
agency funding (e.g. is revenue foregone lost or will government increase funding to
compensate?);
• Explore agency revenue models (e.g. ‘freemium’ – free basic and charged premium),
and what the relationship is between free and priced products and services (e.g. is
‘freemium’ revenue maximising?); and
13Costs and Benefits of Data Provision
• Examine agency revenue trends from all possible sources.
For costs, it is necessary to get a full costing of all the relevant PSI-related activities of the
producing agency and of (typical) users, seeing costs as including the money and time spent on
the activities, materials and overheads. For example, this might include:
• Costs of data and access to the data for users (use) and for the providing agency
(provision);
• Costs of data and data access related activities for users (use) and for the providing
agency (provision);
• Costs of a paid and/or licensing system, including: time spent on licensing requests
(users and providers), and the number of requests processed, time spent and
transaction costs of priced access (users and providers), and the number of
transactions;
• Revenues gained and/or foregone, for the data directly and for other agency and/or
related products and services;
• Impacts on business (e.g. freemium issues, such as to what extent making the PSI
freely available affects priced business lines); and
• Agency incentives (e.g. level of collection if supporting revenue is lost, possible
impacts on quality, etc.).
For use, it is necessary to understand how the change to making the PSI freely available affected
demand and use. The key data required will be usage trends, in terms of visits, inquiries,
purchases, datasets accessed, downloads, hits, etc. It will be necessary to:
• Tease out the issues of format (print versus digital online) from those of revenue
model (priced versus free), so it is necessary to know use trends of both online and
print materials and priced and free materials (i.e. longer-term usage trends);
• Consider adjusting these usage data for other factors and wider trends, such as:
o The impacts of online volumes on use to explore intensification versus
extension of use (e.g. adjust for downloads per item available);
o The context of increasing downloads of everything (e.g. national or other trends
in the volume of data downloaded by Internet users); and
o The influence of information cycles on usage trends, such as special PSI data
release cycles (e.g. ABS Census release cycles), government cycles (e.g.
pre/post elections), general business cycles, policy topic cycles, etc.; and
• Understand the use and uses of the data, such as:
o Whether its value realised in the year of its production or over a longer time,
and if over time, how long and how is the use/value distributed;
o What share of PSI sales/downloads go to government versus the share to private
sector users/re-users;
14You can also read