Data and datasets for coastal adaptation - Information Manual 3 - National Climate ...
←
→
Page content transcription
If your browser does not render page correctly, please read the page content below
Data and datasets
for coastal adaptation

Information Manual 3
Published by the National Climate Change
Adaptation Research Facility 2016

ISBN: 978-0-9946053-2-0
© 2016
Australian copyright law applies.
For permission to reproduce any part of this document,
please approach the authors.

Please cite this Manual as:
Mummery, J.C., 2016: Available data, datasets and derived
information to support coastal hazard assessment and
adaptation planning. CoastAdapt Information Manual 3,
National Climate Change Adaptation Research Facility,
Gold Coast.

Acknowledgement
This work was carried out with financial
support from the Australian Government
(Department of the Environment and Energy).

Disclaimer
The views expressed herein are not necessarily the
views of the Commonwealth or NCCARF, and neither the
Commonwealth nor NCCARF accept responsibility for
information or advice contained herein.
Available data, datasets
and derived information
to support coastal
hazard assessment and
adaptation planning

Information Manual 3

Jo Mummery
National Climate Change
Adaptation Research Facility

Acknowledgements
Thanks to the following people for the technical discussions, which assisted
in the drafting of this information manual: Matt Eliot (Damara WA); Tony Webb
(Environmental Hydraulics); Professor Ron Cox (UNSW); Kevin Hennessy, John
Clarke, Kathy McInnes, Ron Hoeke and Mark Hemer (CSIRO); Martine Woolf,
Jane Sexton, Mark Edwards, Shane Martin, Russell Hay and Mark Dunford
(Geoscience Australia); Professor Bruce Thom (Wentworth Group of Concerned
Scientists); Professor Nick Harvey (University of Adelaide); and Neil Plummer
(Bureau of Meteorology).
IM3: Available datasets
IM3: Available datasets

  Contents
   Preface...................................................................................................................................................................1
   Executive summary .............................................................................................................................................2
   1        Introduction .............................................................................................................................................7
            1.1       Why has this information manual been written?............................................................................7
            1.2       Data in CoastAdapt...........................................................................................................................7
   2        Why are data important?............................................................................................................................9
            2.1       Climate data are embedded in decision-making............................................................................9
            2.2       Need for new data with climate change.........................................................................................10
            2.3       Data management...........................................................................................................................12
            2.4       References ......................................................................................................................................12
            2.5       Further reading...............................................................................................................................12
   3        Available data: coastal processes.............................................................................................................13
            3.1       Coastal landforms and geomorphology.......................................................................................13
            3.2       Sea levels.........................................................................................................................................17
            3.3       Waves ...........................................................................................................................................20
            3.4       Wind         ...........................................................................................................................................24
            3.5       Summary table of datasets on coastal processes.........................................................................25
            3.6       References ......................................................................................................................................26
            3.7       Further reading ...............................................................................................................................27
   4        Available data: current climate.................................................................................................................28
            4.1       Temperature...................................................................................................................................28
            4.2       Rainfall.............................................................................................................................................28
            4.3       Tropical cyclones and East Coast Lows.........................................................................................31
            4.4       Fire weather....................................................................................................................................31
            4.5       References ......................................................................................................................................32
            4.6       Further reading...............................................................................................................................32
   5        Available data: future climate change......................................................................................................33
            5.1       Climate change projections...........................................................................................................33
            5.2       Sea-level rise projections...............................................................................................................40
            5.3       References......................................................................................................................................41
            5.4       Further reading ...............................................................................................................................41
   6        Data for coastal hazard assessment.........................................................................................................42
            6.1       Aligning data needs with type of hazard assessment...................................................................42
            6.2       Design events and hazard likelihoods...........................................................................................44
IM3: Available datasets

         6.3      Inundation hazard...........................................................................................................................44
         6.4      Erosion and recession hazard........................................................................................................48
         6.5      References ......................................................................................................................................53
         6.6      Further reading...............................................................................................................................54
   7     Data for risk and vulnerability assessment and adaptation planning.....................................................56
         7.1      Types of data relevant to local vulnerability assessment.............................................................56
         7.2      National social, economic and environmental datasets...............................................................57
         7.3      References......................................................................................................................................57
   8     Tips and traps............................................................................................................................................60
   Annex A         Illustrative use of NEXIS to identify assets in defined area..........................................................62
   Annex B        Key datasets for a more detailed third-pass risk assessment.......................................................65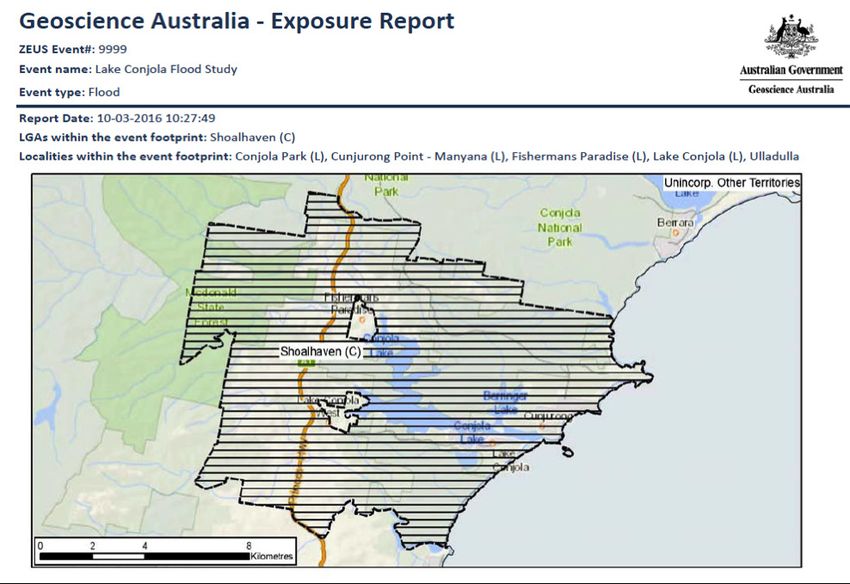
IM3: Available datasets

  Figures
   Figure 2.1   Map of Peron Naturaliste Partnership region ...............................................................................11
   Figure 3.1   Coastal compartments scales, uses and timeframes....................................................................14
   Figure 3.2   Aerial photographs of Beachport, South Australia.......................................................................15
   Figure 3.3   Coastal stability in Pittwater–Narrabeen area from Smartline......................................................16
   Figure 3.4   Spring tidal range showing the geographic variation in tides around Australia..........................18
   Figure 3.5   Australian array of sea-level monitoring stations.........................................................................18
   Figure 3.6   Historical sea levels from tide gauge and satellite altimeter data................................................19
   Figure 3.7   The 1-in-100-year storm tide height in metres relative to mean sea level..................................20
   Figure 3.8   100-year ARI significant wave height.............................................................................................22
   Figure 3.9   Components of wave set-up and run-up......................................................................................24
   Figure 4.1   Time series of anomalies in temperature over Australia..............................................................29
   Figure 4.2   Northern wet season (October–April) rainfall compared to average levels since 1995–96........30
   Figure 4.3   Intensity-Frequency-Duration graphic for rainfall in Brisbane....................................................30
   Figure 5.1   Projected changes in rainfall for Australian regions.....................................................................36
   Figure 5.2   Wet Tropics (Queensland) climate futures showing model consensus for RCP8.5 in 2090......38
   Figure 5.3   Compilation of paleo sea-level data, tide gauge data, altimeter data and central
   		           estimates and likely ranges for projections of global mean sea-level rise..................................40
   Figure 5.4   Observed and projected sea-level rise for the Gold Coast..........................................................40
   Figure 6.1   Example of Coastal Risk Australia scenarios.................................................................................46
   Figure 6.2   Illustration of closed and leaky beaches in a coastal compartments context.............................49
IM3: Available datasets

  Tables
  Table ES 1 Available datasets suitable for first-pass risk assessments and for contribution
  		         to more detailed assessment...........................................................................................................3
  Table ES 2 Additional available datasets suitable for more detailed coastal risk assessment........................4
  Table 1.1       Physical coastal datasets available in CoastAdapt..........................................................................8
  Table 3.1       Smartline data types.......................................................................................................................16
  Table 3.2       Accessible datasets from wave buoys...........................................................................................21
  Table 3.3       Available wave datasets from models...........................................................................................22
  Table 3.5       Summary table of accessible datasets on coastal processes.......................................................25
  Table 5.1       Projected climate change data available from Climate Change in Australia ...............................35
  Table 5.2       Application-ready future climate data for 30-year periods
  		              centred on 2030, 2050, 2070 and 2090. ..........................................................................................37
  Table 5.3       Climate change projection data sources in Australia....................................................................39
  Table 6.1       Data required for type of risk assessment.....................................................................................43
  Table 6.2       Design ocean still-water levels at Sydney Harbour for 2010 and predicted
  		              levels for 2050 and 2100 incorporating sea-level rise...................................................................44
  Table 6.3       State government mapping or datasets on coastal inundation hazard.......................................45
  Table 6.4       State government mapping or datasets of coastal erosion hazard areas....................................49
  Table 6.5       Monitoring studies that have generated long-term datasets on beach change or erosion.......50
  Table 6.6       Suggested design erosion volumes and generic setbacks based on SBEACH,
  		              XBeach and engineering judgement.............................................................................................52
  Table 7.1       Publicly available national social, economic and environmental datasets
  		              relevant to risk and vulnerability assessment...............................................................................58
  Table AB        Key data requirements for third-pass erosion and inundation hazard assessment ...................65
  Table AB        Key data requirements for third-pass erosion and inundation hazard assessment ...................66

  Boxes
  Box 2.1         Peron Naturaliste Partnership Regional Coastal Monitoring Program........................................11
  Box 6.1         Coastal Risk Australia – visualising inundation from sea-level rise.............................................46
  Box 6.2         SBEACH application to Clarence, Tasmania..................................................................................51
IM3: Available datasets                                                                                     Preface

   Preface
   In 2014, the National Climate Change Adaptation Research Facility (NCCARF) was commissioned by
   the Australian Government to produce a coastal climate risk management tool in support of coastal
   managers adapting to climate change and sea-level rise. This online tool, known as CoastAdapt,
   provides information on all aspects of coastal adaptation as well as a decision support framework.
   It can be accessed at www.coastadapt.com.au.
   Coastal adaptation encompasses many disciplines ranging from engineering through to economics and
   the law. Necessarily, therefore, CoastAdapt provides information and guidance at a level that is readily
   accessible to non-specialists. In order to provide further detail and greater insights, the decision was made
   to produce a set of Information Manuals, which would provide the scientific and technical underpinning
   and authoritativeness of CoastAdapt. The topics for these Manuals were identified in consultation with
   potential users of CoastAdapt.

   There are ten Information Manuals, covering all aspects of coastal adaptation, as follows:

   1.    Building the knowledge base for adaptation action
   2.    Understanding sea-level rise and climate change, and associated impacts on the coastal zone
   3.    Available data, datasets and derived information to support
         coastal hazard assessment and adaptation planning
   4.    Assessing the costs and benefits of coastal climate adaptation
   5.    Adapting to long term coastal climate risks through planning approaches and instruments
   6.    Legal risk. A guide to legal decision making in the face of climate change for coastal decision makers
   7.    Engineering solutions for coastal infrastructure
   8.    Coastal sediments, beaches and other soft shores
   9.    Community engagement
   10. Climate change adaptation planning for protection of coastal ecosystems

   The Information Manuals have been written and reviewed by experts in their field from around Australia
   and overseas. They are extensively referenced from within CoastAdapt to provide users with further
   information and evidence.
   NCCARF would like to express its gratitude to all who contributed to the production of these Information
   Manuals for their support in ensuring that CoastAdapt has a foundation in robust, comprehensive and
   up-to-date information.

                                                            1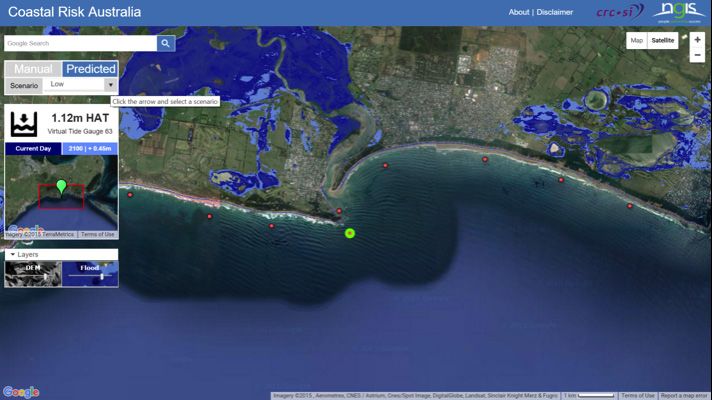
IM3: Available datasets                                                                             Executive summary

   Executive summary                                           wave buoys, data on coastal sediment budgets and
                                                               sediment transport and data to calibrate and verify
                                                               coastal models to ensure that they are relevant to
                                                               local conditions and properly reproduce reality.
   Importance of datasets for                                  A priority is to address data gaps in areas showing
   coastal management                                          signs now of vulnerability to shoreline recession.
   Coastal management, particularly in a changing              Coastal and climate modelling tools help address
   climate, rests on information from both the analysis        data deficiencies and gaps in understanding how
   of data and the modelling of coastal processes and          the coast may change in the future. Modelling
   the climate system. Data and information on coastal         approaches underpin a range of coastal
   behaviour and on climate variables are to be found          management decisions; however, in many areas
   in many disparate sources and are embedded in               data are inadequate to ensure that model results are
   a wide range of policies and decisions that relate          locally accurate.
   to the coast. These data are used, for example, in
                                                               Given the size of Australia’s coastline, the largest
   tools to predict inundation and erosion, in planning
                                                               opportunity for the provision of cost-effective
   guidelines about coastal setbacks, in engineering
                                                               data to manage growing coastal risks will come
   specifications for jetties and coastal protection
                                                               from satellites and remote-sensing techniques.
   works, in catastrophe models used by insurance
                                                               Satellite data have already proved invaluable in
   companies and to plan evacuation routes in low-
                                                               the measurement of sea levels, waves, inundation
   lying areas.
                                                               risks and beach profiles. There is an opportunity,
   With climate change, careful consideration is               with effective national coordination, for such
   needed where historic data are no longer adequate           approaches to generate data needed to monitor
   for planning and decision-making. Over time,                and manage changes to the shoreline that will
   climate change can increase the impacts of current          result from sea-level rise and possibly more
   hazards and can bring new hazards to a local area,          intense storms.
   such as in a shift from a stable to a receding beach.
   Increasingly, data on future climate and how that           Available datasets to
   climate could affect the coast will need to be              assess coastal risks
   incorporated in hazard and risk assessments and
   coastal management policies and in how those                Existing national and state datasets are adequate to
   policies are implemented by local councils.                 support first-pass screening of coastal risks from
                                                               climate change. The following tables outline useful
   Adequacy of available datasets                              datasets for coastal risk assessment and where to
                                                               find further information in this manual. National
   Australia has a number of very good datasets                managers of datasets are also identified where
   that can inform coastal hazard assessment                   appropriate.
   and climate change adaptation. These include
   long-term records of weather variables and                  Table ES 1 datasets are readily accessible, easy to
   tides by the Bureau of Meteorology (BoM) and                use and suited to first-pass risk assessments. In
   state governments, high-quality elevation data,             many instances, more detailed risk assessments
   nationally coordinated geomorphology datasets               will be possible through contribution from
   and regional sea-level rise projections information.        these datasets, for example the climate
                                                               change projections, coastal compartments,
   However, significant work is required to develop            geomorphology, infrastructure and satellite
   and make available all the datasets needed for              imagery datasets.
   coastal management in a changing climate. There
   is need for stronger coordination, including a              Datasets in Table ES 2 contain more technical
   networked repository to ensure that important               data and are better suited to more detailed risk
   coastal datasets are developed, accessible and              assessments involving qualitative analysis and
   designed for multiple purposes. Areas where                 hazard modelling.
   further work is needed on coastal datasets include
   development of accessible long-term datasets from

                                                           2
IM3: Available datasets Executive summary
Table ES 1 Available datasets suitable for first-pass risk assessments and for contribution
to more detailed assessment.
Coastal For further
Available dataset
element information
Climate and Climate change projections. Climate Change in Australia website Section 5.1.1
climate change contains regional projections for a range of climate variables,
projections including sea-level rise (CSIRO and BoM)
Tropical cyclones and East Coast Lows (ECLs). Datasets on Section 4.3
cyclone tracks, behaviour and impacts (BoM), dataset on East
Coast Lows (BoM)
Tides and sea level. The Australian Baseline Sea Level Monitoring Section 3.2.1
Project (BoM)
Coastal Coastal compartments (primary and secondary) and implications Section 3.1.1
geomorphology for scale of assessments and management (NCCARF CoastAdapt
and Geoscience Australia)
Smartline Coastal Geomorphology maps on extents of shore Section 3.1.2
types and their susceptibility to erosion (NCCARF CoastAdapt and
Geoscience Australia)
Beach change. Aerial photography and photogrammetry data Section 3.1.1
repository (Geoscience Australia)
Coastal Inundation-prone areas. State government mapping of Section 6.3.1
inundation and inundation-prone areas
erosion hazard-
prone areas Inundation risk from sea-level rise. Coastal Risk Australia – Section 6.3.1
shows inundation from sea-level rise scenarios and allows users
to explore inundation with own data (Cooperative Research Centre
for Spatial Information)
Local government high-risk areas. National Coastal Risk Section 7.2
Assessment identifies local governments with areas at high risk of
inundation and erosion (Department of the Environment)
Erosion hazard areas. State government mapping of erosion Table 6.4,
hazard areas Section 6.4.1
Regional generic erosion setbacks. Derived dataset of generic Table 6.6,
erosion setbacks for 30 regions around the Australian coast Section 6.4.2
(Antarctic Climate and Ecosystems Cooperative Research Centre)
Coastal assets Buildings and infrastructure. National Exposure Information Table 7.1,
System (NEXIS) providing location and metadata for buildings and Section 7.2
some infrastructure (Geoscience Australia)
Transport infrastructure. National Map contains location dataset Table 7.1,
of transport infrastructure (Australian Government) Section 7.2
Satellite imagery, such as from Google Maps, enables visual Section 7.1
identification of settlements and other assets in a local area
3IM3: Available datasets Executive summary
Table ES 2 Additional available datasets suitable for more detailed coastal risk assessment.
For further
Coastal element Additional available dataset
information
Climate and Climate change projections. The Climate Change in Australia Section 5.1.1
climate change website contains tools that can be used to generate tailored
projections (also regional projections for a range of climate variables, including
see datasets in sea-level rise (CSIRO and BoM)
Table ES 1)
Wind speed (daily, monthly) long-term records (BoM) Section 3.4
Temperature and rainfall. Climate Data Online – Long-term Section 4.1,
daily and monthly records (BoM) Section 4.2
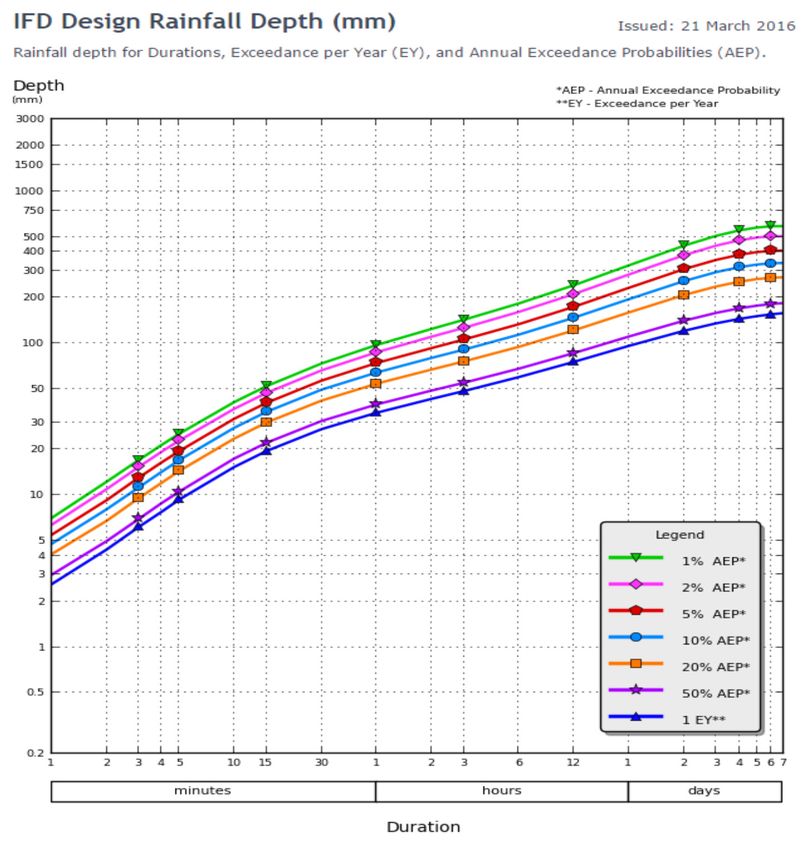
Extreme rainfall. Design rainfall data developed by BoM for Section 4.2.1
engineering (Engineers Australia)
Tropical cyclone model suitable for damage assessment Section 4.3
(Geoscience Australia)
Elevation Topographic and bathymetry data. Elevation Information Section 3.1.3
(topography and System (ELVIS). Users can download the 1 second (~30 m) and 5
bathymetry) m elevation data (Geoscience Australia)
Compiled bathymetric dataset (Geoscience Australia)
Also see state government data portals Section 7.1
Geomorphology Smartline Coastal Geomorphology on extents of shore types Section 3.1.2
(also see datasets and their susceptibility to erosion (NCCARF CoastAdapt and
in Table ES 1) Geoscience Australia)
Beaches. The Australian Beach Safety & Management Program Section 3.1.2
database of over 12,000 beaches
Beach change. Aerial photography, satellite data and Section 3.1.1
photogrammetry data repository (Geoscience Australia)
Sea level and Storm tide. Derived map dataset for 1-in-100-year storm tide Figure 3.8,
ocean height (CSIRO) section 3.2.2
Wave buoys. Wave buoy data on significant wave height, period Table 3.2,
and direction (near-term data) section 3.3.1
Wave model datasets (longer term and suitable for modelling), Table 3.3,
including from combined satellite data and historic sea records section 3.3.1
Extreme waves. Derived map dataset for 1-in-100-year Figure 3.9,
significant wave height (Antarctic Climate and Ecosystems section 3.3.2
Cooperative Research Centre)
Ocean data. The Australian Ocean Data Network Portal contains Section 3.5
a variety of ocean and coastal datasets (Integrated Marine
Observing System)
4IM3: Available datasets Executive summary
Table ES 2 Additional available datasets suitable for more detailed coastal risk assessment - continued.
For further
Coastal element Additional available dataset
information
Coastal hazards Inundation. Coastal Risk Australia – tool allows users to explore Section 6.3.1
(also see datasets inundation from sea-level rise, including from input of local data
in Table ES 1) (Cooperative Research Centre for Spatial Information)
Setback for sea-level rise. Climate Change in Australia web tool Section 5.2
provides allowances information for extreme sea-level and sea-
level rise for sites around the coastline (CSIRO)
Catchment flooding. Australian Flood Risk Information Portal Section 6.3.1
(AFRIP), which contains information and studies on catchment
floods (Geoscience Australia)
Historic flooding. Water Observations from Space – historic Section 6.3.1
extent of flooding captured through Landsat record (Geoscience
Australia)
Design erosion. Derived dataset of suggested design erosion Table 6.6, section
volumes (2 x 100-year average recurrence interval [ARI] storms) 6.4.2
for 30 regions around Australian coast (Antarctic Climate and
Ecosystems Cooperative Research Centre)
Coastal assets Ecosystems. National Map dataset on vegetation types Section 7.2
(also see datasets (Australian Government) and datasets on environments of
in Table ES 1) national significance (Department of the Environment)
Population. Range of datasets and information on population Section 7.2
location, growth and demography (Australian Bureau of
Statistics)
Buildings and infrastructure. National Exposure Information Section 7.2
System (NEXIS) providing location and metadata for buildings and Annex A
and some infrastructure in precise areas affected by hazards
(Geoscience Australia)
Satellite imagery, such as from NearMap, enables identification Section 7.1
of settlements and other assets in a local area, with emerging
analytic and trend identification capabilities
5IM3: Available datasets Executive summary
For a number of coastal decisions, for example Accessing, using and acquiring datasets
those with a short asset life, detailed modelling and
Many of the accessible datasets are not easy to
data acquisition are not required. Experience has
interpret or use, and some are not straightforward to
shown that coastal setbacks and foreshore reserves
access. Decision-makers will often need technical
provide a buffer from many coastal hazards and
assistance in the acquisition, ongoing management
protect assets located landward.
and storage of data. Data management planning is
However, detailed studies will be required where useful to ensure that datasets meet needs and are
decisions are essentially irreversible, critical assets accessible and fit for purpose.
for human safety are involved and/or there is
Section 2.3 provides a number of tips to follow when
significant investment, where there is a history of
data need to be procured, including ensuring that
inundation or erosion, and in areas that could be
there are no licensing constraints to the multiple use
significantly affected by climate change. Further
of data, describing data specifications to enable easy
information on datasets useful for risk modelling
linkage to current GIS and seeking clear and detailed
can be found in section 6.
metadata covering when and how the data were
collected and any limits to their use.
This Information Manual includes links to several
online resources. All links have been accessed 1
June 2016.
6IM3: Available datasets 1. Introduction
1 Introduction 1.2 Data in CoastAdapt
The CoastAdapt tool is supported by a number of
information manuals that provide more technical
1.1 Why has this information details on key areas of coastal adaptation,
manual been written? including relevant data sources. For example,
the information manuals Information Manual 1:
This information manual has been written because
Building the adaptation case, Information Manual
stakeholder feedback has emphasised the
2: Understanding sea-level rise, and Information
significant challenges that many decision-makers
Manual 8: Coastal sediments and beaches include
face in accessing and using data for climate change
sections on where to access relevant data.
risk assessments and to support adaptation. The
purpose of this information manual is to: In addition, CoastAdapt provides a number of
datasets that support coastal adaptation. Table 1.1
• inform decision-makers on the importance
provides an overview of these datasets and a link to
of engaging with the scientific data on climate
where they can be accessed.
change and the coast that has relevance to their
decision-making
• empower decision-makers to confidently access
and use climate change data in adaptation
planning and action.
The manual provides an overview of why data are
important, what data are available and how data
can be used in first-pass risk screening and hazard
assessments. The focus is primarily on biophysical
data and information relating to coastal processes,
climate and climate change, elevation and
geomorphology. These data are used in models
that help us understand the coast, its dynamics
and how it is changing. In addition, the manual
identifies national datasets on social, economic and
environmental factors relevant to understanding
the consequences of coastal climate change.
The manual is intended to provide introductory
information on data relevant to understanding
coastal climate change risks and the need for
adaptation. A number of links are provided to
sources of more detailed information, and high-
cost local decisions will require expert use of data
and models that go beyond the scope of what can
be provided here.
The manual generally uses the term ‘data’ to cover
measured or quantitative estimates of variables and
derived information, that is, data that are processed
or refined to a form that can be useful.
7IM3: Available datasets 1. Introduction
Table 1.1 Physical coastal datasets available in CoastAdapt.
Dataset Link Comments
Inundation risk
Sea-level rise Sea Level rise and you Projected SLR for each coastal local
projections council in Australia up to 2100
http://coastadapt.com.au/sea-level-
rise-information-all-australian-
coastal-councils
Inundation Sea Level rise and you Projected inundation mapping for
mapping coastal local councils in Australia with
http://coastadapt.com.au/sea-level-
LiDAR, for mid and end-century and
rise-information-all-australian-
two greenhouse gas scenarios
coastal-councils
Water Shoreline Explorer An indication of the present-day
observations from flooding risk, based on satellite
http://coastadapt.com.au/
space observations
coastadapt-interactive-map
Erosion risk
Secondary coastal Shoreline Explorer A basis for further analysis – not
compartments especially useful in itself
http://coastadapt.com.au/
map
coastadapt-interactive-map
Expert knowledge Shoreline Explorer Qualitative expert description of each
on coastal secondary compartment on landform,
http://coastadapt.com.au/
compartments stability etc.
coastadapt-interactive-map
Smartline Shoreline Explorer Geomorphology map of the Australian
coastline presented as a segmented
http://coastadapt.com.au/
line tagged with attributes such as
coastadapt-interactive-map
underlying geology and stability
8IM3: Available datasets 2. Why are data important?
2 Why are data important? Climate data are embedded in a wide range of
decisions in the coastal zone:
• Coastal setbacks in planning guidelines are
Key points: informed by historic data on storm surges and
beach recession.
• Climate and coastal data are embedded in a
range of policy settings and decisions, and • The engineering specifications for ports and
climate change will require new data to enable jetties and of coastal protection measures, such
consideration of changing risks to society and as seawalls, draw on local wave climate and
the environment. storm data.
• The use of data to understand hazard behaviour • Models used by insurance companies to
and likely coastal responses to sea-level rise determine the coverage and cost of insurance
is a necessary precursor to understanding and for coastal properties are based on the frequency
managing coastal flood and erosion risks. and severity of historic extreme weather events.
• However, for many local decisions, particularly • The productivity of many fisheries is determined
where the planning horizon isIM3: Available datasets 2. Why are data important?
Many state governments employ coastal setback 2.2 Need for new data with
policies as a primary mechanism to manage coastal
climate change
erosion and inundation hazards. Such setbacks are
generally informed by data on historic extremes Climate change will need to be considered across
from monitoring programs. For many decisions, the range of decisions underpinned by historic
compliance with state policy on coastal setbacks climate data. Of particular concern to planners
is adequate for hazard management, and further and decision-makers, climate change can alter the
consideration of data acquisition and analysis is not type of climate hazards experienced in a local area,
required. Where significant investment is planned their spatial extent and the expected frequency
in long-life coastal assets, such as protection and intensity of impacts on developed and natural
works, or where risks are large, data are needed to: assets. With climate change, decision-making
• define and understand the current coastal cannot rely solely on historical hazards data;
processes that will act upon the infrastructure ongoing investment in data is required to properly
track and manage changes in the coast.
• inform the design specifications of the
infrastructure to ensure that it is resilient in a With the increasingly uncertain future due to
changing climate climate change, the need for long-term coastal
datasets has been significantly increased. Data from
• input to and calibrate models to test the regular monitoring allow identification of trends,
sensitivity of the proposed construction to provide the basis to test possible scenarios and to
various climate and coastal conditions explore how complex coastal interactions could
• monitor the outcomes of construction, change with sea-level rise, and help identify future
management and planning actions. at-risk areas. Use of monitoring data to provide
insights into how risks will change in the future can
reduce the potential for assets to be inadvertently
placed in harm’s way (NCCOE 2012).
Of particular concern is the risk that climate
change could trigger a change of state in the
shoreline; that is, in the medium to longer term,
accreting beaches can switch to becoming
receding beaches. The site-specific nature of such
beach responses emphasises the importance of
local data and long-term monitoring studies to
properly track beach changes, support decisions
with a long asset life and assess the effectiveness
of coastal protection measures.
10IM3: Available datasets 2. Why are data important?
Box 2.1 Peron Naturaliste Partnership Regional Coastal Monitoring Program
The Peron Naturaliste Partnership (PNP) is an
incorporated collective group of nine local
governments in the south-west of Western
Australia: Bunbury, Busselton, Capel, Dardanup,
Harvey, Mandurah, Murray, Rockingham and
Waroona. The partnership region is vulnerable
to the impacts of coastal climate change, with
low-lying sandy coastal and shallow estuarine
environments and high residential, commercial,
recreational and ecological significance.
The PNP is delivering a regional coastal
monitoring program (covering approximately
200 km of coast and estuarine areas) to generate
the data and understanding needed to manage
erosion and inundation hazards in the region. It
includes consolidation of datasets, monitoring
guidelines, and a 10-year action plan.
The program recognises that one size does not
fit all. Monitoring activity needs to be tailored
and informed by local development and other
objectives, hazard areas, available resources
and the capacity to upscale or downscale in
response to coastal change. For example,
the active management goals for Mandurah’s Figure 2.1. Map of Peron Naturaliste Partnership
northern beaches require annual surveys and region Source: Peron Naturaliste Partnership
beach profiles and monthly field photographs. (http://www.peronnaturaliste.org.au).
In contrast, the setbacks and coastal protection
works in Busselton allow for less frequent
monitoring activity. • Managing datasets will be costly and time
consuming, and training and council buy-in
A number of lessons have been learned in the are required for implementing the
development of the monitoring program: monitoring action plan.
• It is not economically or logistically feasible Asset management systems within each
to monitor all coastal and estuarine areas, council could be updated to include coastal
and areas that require more frequent and risk information and monitoring data.
finer scale monitoring need to be identified.
Further information on the PNP can be found
• Coastal sediment compartments (see section at http://www.peronnaturaliste.org.au.
3.1.1) can inform monitoring programs and
priorities and enable local approaches to be
nested within a regional approach.
11IM3: Available datasets 2. Why are data important?
Finally, in an increasingly litigious society, With data increasingly being in a digital form, there
understanding key science findings and appropriate are a range of data storage and backup options.
input data is important for professional practice Incorporating data in existing GIS tools and asset
and accountability. The potentially uncertain future registers facilitates access and reflection in decision-
projected by climate change only heightens the making. Additional data storage may also be required,
need for data as a duty-of-care obligation (Baker and there are many cloud providers offering some
and Mackenzie 2011). We have already seen amount of free space with additional capacity
legal actions brought against councils and state available for purchase. Most include apps to enable
governments with respect to decisions taken in synchronisation between the cloud, desktop, laptop
light of potential climate change impacts, including and mobile devices. These include but are not limited
where it was argued that climate change impacts to Dropbox (http://dropbox.com with 2GB for
on low-lying coastal land had not been considered. free); Google Drive (http://drive.google.com with
The advice of coastal experts can assist decision- 15GB free across Google Drive, Gmail and Google+
makers where there is uncertainty. Photos); iCloud (http://www.icloud.com with 5GB
for free); ADrive (http://www.adrive.com with 50GB
2.3 Data management for free but also with lots of advertisements); and
Bitcasa Infinite Drive (http://www.bitcasa.com with
Data are assets – potentially costly to obtain, but able 20GB for free).
to deliver considerable and ongoing benefits. With
the rapid recent growth in digital data, mapping and 2.4 References
data storage options, data management planning
is important. A data management plan identifies Baker and McKenzie, 2011: Local council risk of
how data and associated materials will be obtained, liability in the face of climate change – resolving
documented, stored, shared and disposed of. It can uncertainties, 132 pp. Accessed 1 June 2016.
assist decision-makers through ensuring that data [Available online at https://www.environment.gov.
are well organised and accessible, that risks of data au/system/files/resources/d9b2f9cf-d7ab-4fa0-
being misused are reduced, that data can be re-used ab0e-483036079dc7/files/alga-report.pdf.]
appropriately and that relevant people can access the
NCCOE (National Committee on Coastal and Ocean
data they need.
Engineering), 2012: Guidelines for responding to
The procurement of data can be complex, and in a the effects of climate change in coastal and ocean
climate change risk assessment or adaptation options engineering. Vol. 1 of Guideline Series, Engineers
analysis it is useful to consider whether any data will Australia, 3rd edition. 75 pp. Accessed 1 June 2016.
be generated that need to be managed. There are [Available online at http://www.engineersaustralia.
some key points relevant to data procurement that org.au/coastal-ocean-engineering/publications.]
should be considered:
• Datasets that can be used repeatedly or by 2.5 Further reading
multiple users in an organisation can often justify Webb, R., and J. Beh, 2013: Leading adaptation
the additional cost of procurement. It is useful to practices and support strategies for Australia: An
ensure that there are no constraints to multiple use international and Australian review of products
in a licensing contract. and tools, National Climate Change Adaptation
• Specification of the resolution and formatting of Research Facility, Gold Coast, 105 pp. Accessed
data sought is important, as is understanding where 1 June 2016. [Available online at http://www.
it can be readily overlaid with or linked to existing nccarf.edu.au/sites/default/files/attached_files_
datasets and GIS tools. publications/Webb_2013_Leading_adaptation_
practices_support.pdf.]
• Metadata are important. A dataset with no metadata
is like a tin can with no label. Metadata should
describe the overall dataset, the time and location
of collection, any points about the method of
collection that impact on its use and any quality
standards met. This ensures that it can readily be
identified for future use when needed.
12IM3: Available datasets 3. Available data: coastal processes
3 Available data: 3.1 Coastal landforms and
geomorphology
coastal processes
Coastal geomorphology encompasses the study of
“While some long term wind (BoM; 60 year) and coastal landforms and the processes that form them,
wave datasets (for example NSW and Queensland especially those from waves, tides and currents
Governments; 35 year) exist and are of immense that lead to the erosion, transport and deposition of
value, much collected data around Australia is sediments. It is underpinned by regional geology,
sparse, incomplete, random and unintegrated. which determines the orientation of the coastline, the
Urgent action is required to establish or expand width and slope of the continental shelf and the type
engineering-related coastal and ocean data and location of coastal landforms such as headlands,
collection programs around Australia.” (NCCOE reefs and beaches.
2012, p. 44) Geomorphology can have a significant
Key points: influence on the response of a particular shore
to sea-level rise or other coastal hazards. Data
• The coastal zone is a dynamic area where air, available on geomorphology relevant to coastal
water and land interact, sometimes with high hazard assessment include geomorphological
energy. Coastal processes, which describe classification data, information on coastal
elements of these interactions, can lead to compartments that reflect dynamic sediment
changes in the coast at short-, medium- and processes, and land and nearshore elevation data.
longer term time horizons. The main sources of data on coastal landforms
• Data across all components of the Earth– and geomorphology are state and territory
atmosphere system are needed to understand governments, particularly land information
coastal behaviour and change and to support agencies, and Geoscience Australia.
coastal management.
3.1.1 Coastal compartments
• Australia has a number of good datasets on
coastal processes, including on geomorphology, and shoreline change
tides and elevation (see Table 3.5). Coastal compartments have been identified around
• However, there are still gaps in datasets that Australia to inform risk and erosion assessments.
will be important to fill in order to understand The compartments are defined by natural coastal
coastal behaviour. These include gaps in long- landforms and by patterns of sediment (for
term datasets on wave direction, derived datasets example, beach sand) movement. There are three
on design events (or frequency) and datasets to levels of compartments (see Figure 3.1), each
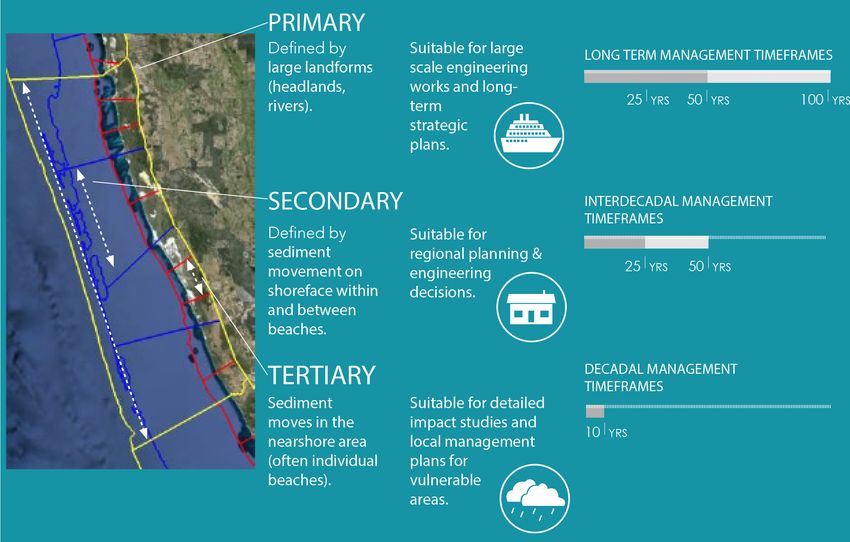
detect morphological change. suitable for different types of decision-making:
• Models can help in areas where the data are • primary level, based on the influence of large
poor, including through generation of long-term landforms and offshore processes; suitable for
synthetic datasets. However, to reduce uncertainty regional planning or large-scale engineering,
and produce accurate results, models need to be such as ports
calibrated and verified using data. • secondary level, based on medium landforms
• Typically, important datasets to understand and regional sediment processes; useful for
coastal processes and drivers span smaller engineering or local planning decisions
meteorological-oceanic variables (wind, waves • tertiary level, based on individual beaches;
and tides), geomorphology and morphological suitable for very small projects unlikely to restrict
change and elevation. sediment movement, such as deciding the exact
location of a groyne or seawall within a broader
management plan.
13IM3: Available datasets 3. Available data: coastal processes
Figure 3.1 Coastal compartments scales, uses and timeframes. Source: Thom 2015 © Commonwealth of
Australia 2016.
The coastal compartments approach was piloted Understanding the rate of sediment transport is
in four areas with diverse morphologies: beaches important for decisions that could interfere with
around Perth, the Pilbara region in Western Australia, transport processes, such as the construction of
and Avoca Beach and Cabarita Beach in New South breakwaters, groynes or jetties. While there is
Wales (Eliot 2013; Mariani et al. 2013). It was found to not a consolidated dataset of sediment transport
be useful to inform risk studies, as it links processes information, a number of studies have reported
operating at different scales and draws attention to this information, for example in the Coffs Harbour
the potential longshore consequences (erosion and region of New South Wales (75,000 m3/yr, BMT
accretion) of shore construction where sediment WBM 2011), the New South Wales and Queensland
transport is interrupted. border region (500,000 m3/yr, Short and Woodroffe
2009), along the Gold Coast (400,000–800,000 m3/
CoastAdapt includes information (which can be found
yr depending on wave climate, Splinter 2010),
at “Guidelines on using Expert knowledge on coastal
Adelaide beaches (30,000–70,000 m3/y, DEH 2005)
compartments” ) on the susceptibility to change of
and beaches around Clarence, Tasmania (60,000–
each secondary compartment. Further information
90,000 m3/yr, Carley et al. 2008).
on the use of coastal compartments is in Information
Manual 8: Coastal sediments and beaches, and on the Aerial photography provides a key source of
mapping of coastal compartments at http://www. information on shoreline change (see Figure 3.2).
ga.gov.au/metadata-gateway/metadata/record/ Photogrammetry involves the analysis of aerial
gcat_76502 and http://www.environment.gov.au/ photographs, which can be accessed from state
climate-change/adaptation/publications/coastal- governments and Geoscience Australia (http://www.
compartments-project-summary-policy-makers. ga.gov.au/scientific-topics/earth-obs/accessing-
satellite-imagery/aerial-photography), with tools
such as a stereocope to measure common points and
changes between the photographs.
14IM3: Available datasets 3. Available data: coastal processes
a) b)
Figure 3.2 Aerial photographs of Beachport, South Australia, from (a) 1946 and (b) 2013, illustrating
increased coastal development and natural revegetation of sand dunes, and other changes such as lake
sedimentation, erosion, and loss of seagrass beds adjacent to the town resulting in the need for active
management of the town foreshore eg. installation of a groyne field. Source: © Government of South
Australia, Department of Environment, Water and Natural Resources.
There are limitations to the use of photogrammetric 3.1.2 Geomorphology
data for determining shoreline change (Kinsela
mapping and datasets
and Hanslow 2013). The dates and coverage of air
photography of beaches vary, and the extent to Smartline is a national geomorphology map,
which dates align with storm events may affect how developed to facilitate access to consistent
useful photographs are in looking at longer term information on coastal geomorphology and to
trends. Older photography often has lower vertical inform large-scale assessment of coastal risks.
and horizontal accuracy. Furthermore, it is difficult The map is derived from over 200 maps and
to accurately detect changes in the nearshore datasets (examples shown in Table 3.1) spanning
seabed from photographs. backshore profile and constituent materials,
underlying geology and intertidal attributes.
Satellite and remote-sensed data are a growing
It allows users to discover information about
resource for tracking and understanding coastal
geomorphological features down to 50 m in size.
change. Baseline imagery can be obtained from
Data are presented as a segmented line, tagged
sources such as Google Earth, and Geoscience
with multiple attributes, which can be queried
Australia has Landsat data over all of Australia
and analysed using GIS software.
since 1987 (http://www.ga.gov.au/scientific-
topics/earth-obs/satellites-and-sensors/
landsat). With continued improvements in
the precision and coverage of satellite data,
and emerging analytic capabilities, there is the
potential for more regular imagery and cost-
effective mapping of shoreline change.
15IM3: Available datasets 3. Available data: coastal processes
Table 3.1 Smartline data types.
Dataset Description
Backshore The dominant landform type in the backshore zone extending 500 m inland of the upper
zone limits of normal high tide wave wash; the first distinctive landform type immediately inland
of the upper limits of normal high tide wave wash
Intertidal The dominant and subordinate significant landform types or components in the zone
zone between high-water mark and low-water mark
Subtidal The dominant and subordinate significant landform type or component in the zone below
zone low-water mark
Geology Two categories describing the bedrock type underlying or exposed on the shore or
underlying the subtidal and intertidal zones. Geology types are classified by lithology (rock
type) and structure (e.g. deformation or fracturing)
Exposure Four broad categories defined by the degree to which they are exposed to open ocean swell
attribute wave energies
Stability Stability classes are characterised by particular landform types or groupings that have
class potential to physically respond to sea-level rise and other coastal processes in distinctive
ways (including differing styles of erosion, accretion or stability). The main classes are
muddy shores, sandy shores, sand-dune and beach-ridge coasts, coarse-sediment shores,
undifferentiated soft-sediment shores, soft-rock shores, hard-rock shores and coral coasts
Metadata Scale and source of data
Simplified data layers from Smartline which
show the main landform types around the coast,
supported by information on their susceptibility
to erosion, can be accessed in CoastAdapt at link
DS8. The more detailed Smartline mapping tool
and datasets are available on the OzCoasts website,
which is managed by Geoscience Australia (http://
www.ozcoasts.org.au). Metadata and reports are
also available, and users can also identify the source
datasets for the Smartline maps. Information from
Smartline, particularly on exposure to ocean swell
waves and stability classes, can inform first-pass
and second-pass risk assessments. The spatial
and segmented format of Smartline also allows
for linkage with other environmental, social or
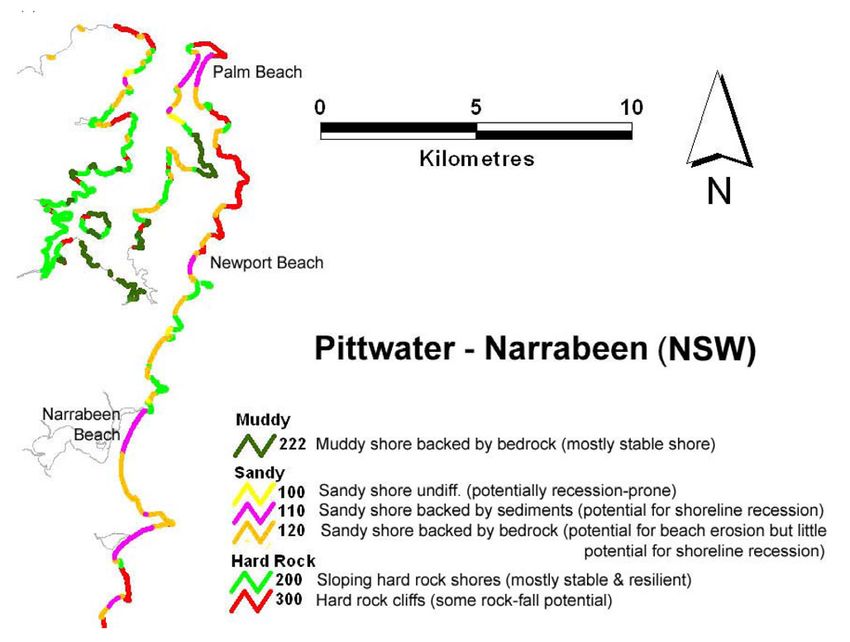
economic information relating to the coast. Figure 3.3. Coastal stability in Pittwater–Narrabeen
Figure 3.3 shows an example of a coastal landform area from Smartline. Source: Sharples et al. 2009.
stability class map for the Pittwater–Narrabeen area
of the New South Wales coast. It has been derived The Australian Beach Safety & Management
from Smartline by querying a range of landform Program (ABSAMP) database (https://researchdata.
attributes to generate a map showing attributes ands.org.au/australian-beach-safety-program-
relevant to coastal stability in the region. absamp/428811) contains information on 12,219
beach systems, 2,615 barriers and 2,433 coastal
drainage systems around the Australian coast. The
ABSAMP database has been linked to the Smartline
map via a common beach number field.
16IM3: Available datasets 3. Available data: coastal processes
3.1 3 Elevation data – bathymetry 3.2 Sea levels
and topography Water levels consist of regular tides, which
Digital elevation data that describe Australia's arise largely from astronomical motions and are
landforms and seabed are essential for addressing predictable; tidal anomalies from wind events and
issues relating to changes in sea level, including major storms; and sea-level rise. Sea levels are also
from climate change. The data are also important influenced by larger climate processes such as the
for disaster management, water security, El Niño–Southern Oscillation (ENSO) and tend to
environmental management, urban planning and be higher during La Niña and lower during El Niño
infrastructure design. In particular, elevation data conditions.
are critical to the identification of low-lying coastal
lands at risk of inundation from sea-level rise and 3.2.1 Average sea levels and tides
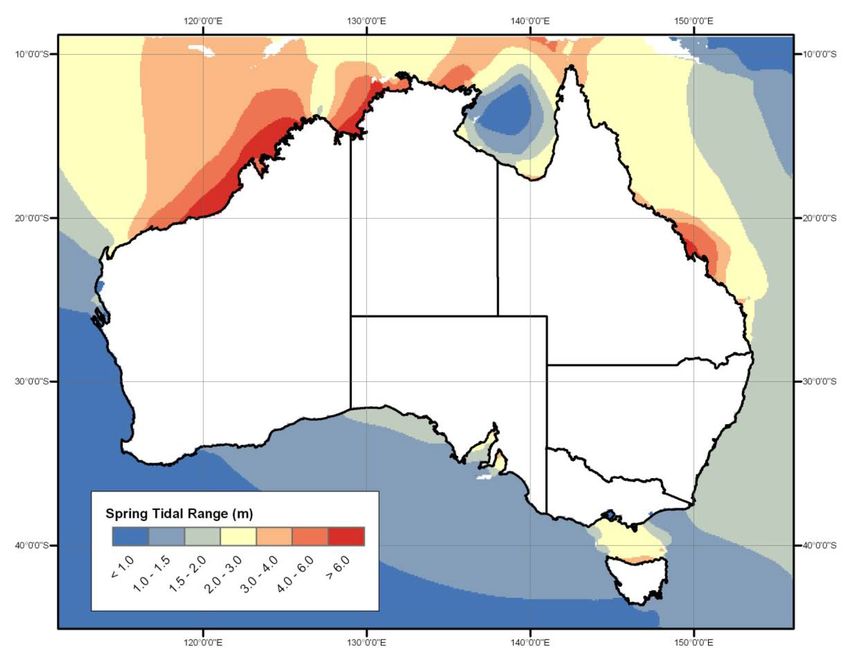
storm surge. Along ocean coasts, tides produce a regular daily
High-resolution elevation data have been rise and fall of sea level that may range from a few
collected by state governments and the Australian centimetres to more than 10 m. Tidal fluctuations
Government for developed parts of the Australian are important in the coastal zone and they affect,
coast. Through the Elevation Information System for example, the shoreward extent of wave action
(ELVIS) at http://www.ga.gov.au/elvis/, users and the flushing of waters in estuaries, lagoons and
can download a high-quality 1 second and 5 m bays. Figure 3.4 illustrates the large geographic
elevation dataset, which is licensed under Creative variation in tides in Australia.
Commons. An example of the use of this dataset in The Australian Baseline Sea Level Monitoring
a tool to explore inundation from sea-level rise is Project, managed by the BoM, is designed
provided in Box 6.1. Many local councils also have to monitor sea level around the coastline of
data on local landforms, including topographic Australia and to identify long-period sea-level
data, contour mapping in GIS systems and land changes. The project is supported by an array of
survey information. SEAFRAME stations, which measure sea level very
Bathymetric data describe the depths and shapes of accurately and record meteorological parameters.
underwater terrain and are important for maritime The array consists of 14 standard stations and
transportation and for studies about the long-term two supplementary stations (Lorne and Stony
effects of climate change on the coast. Bathymetric Point), which are owned by port operators.
surveys can alert scientists to ongoing and potential Figure 3.5 shows the location of the array. Data
beach erosion, sea-level rise and subsidence (land can be accessed from http://www.bom.gov.au/
sinking). Scientists also use bathymetric data to oceanography/projects/abslmp/abslmp.shtml.
create hydrodynamic models. State governments have installed a number of other
Bathymetry data are collected by state agencies tide gauges, often to support harbour operations
responsible for ports, maritime transportation or and navigation for shipping.
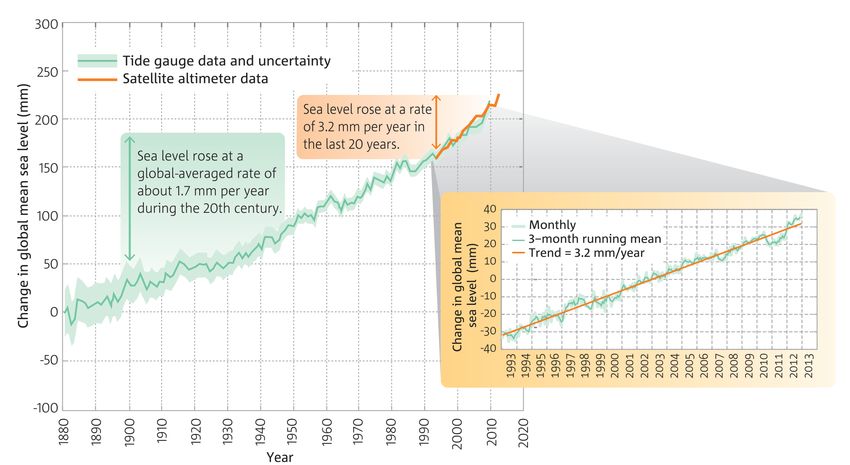
fisheries. Geoscience Australia maintain a compiled Data from the tide gauge array and from satellite
record of bathymetric data, which can be accessed altimeters show that sea levels have been
at http://www.ga.gov.au/scientific-topics/marine/ rising around Australia since at least the middle
bathymetry. of last century. This is consistent with global
measurements. Figure 3.6 shows historical sea-
level measurements from Australia and the globe.
Since the early 1990s, high-resolution satellite
altimeter data has also been used to measure
sea levels. Further information on observed
changes in sea level can be found at http://www.
climatechangeinaustralia.gov.au/en/climate-
campus/australian-climate-change/australian-
trends/.
17You can also read