HITTING HOME: THE COMPOUNDING COSTS OF CLIMATE INACTION - CLIMATECOUNCIL.ORG.AU - Climate Council
←
→
Page content transcription
If your browser does not render page correctly, please read the page content below
HITTING HOME:
THE COMPOUNDING
COSTS OF CLIMATE
INACTION

CLIMATECOUNCIL.ORG.AU

Thank you for
supporting the
Climate Council.
The Climate Council is an independent, crowd-funded organisation
providing quality information on climate change to the Australian public.

    Published by the Climate Council of Australia Limited.
    ISBN:    978-1-922404-13-8 (print)
             978-1-922404-12-1 (digital)
                                                                                       Professor Will Steffen
    © Climate Council of Australia Ltd 2021.                                           Climate Councillor
    This work is copyright the Climate Council of Australia Ltd. All material
    contained in this work is copyright the Climate Council of Australia Ltd except
    where a third party source is indicated.
    Climate Council of Australia Ltd copyright material is licensed under the
    Creative Commons Attribution 3.0 Australia License. To view a copy of this
    license visit http://creativecommons.org.au.
                                                                                       Dr Simon Bradshaw
    You are free to copy, communicate and adapt the Climate Council of Australia       Researcher
    Ltd copyright material so long as you attribute the Climate Council of Australia
    Ltd and the authors in the following manner: Hitting home: The compounding
    costs of climate inaction.
    Authors: Will Steffen and Simon Bradshaw.

    —
    Cover image: Townsville Floods. Andrew Rankin / Australian Associated Press.
    This report is printed on 100% recycled paper.

         facebook.com/climatecouncil                 info@climatecouncil.org.au

         twitter.com/climatecouncil                  climatecouncil.org.au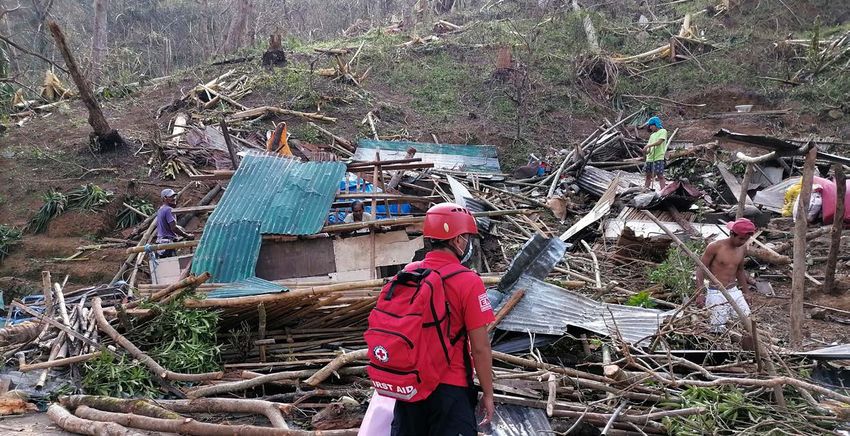
CLIMATE COUNCIL                      i

Contents
Key findings...................................................................................................................................................................................... ii

1.     Introduction...............................................................................................................................................................................1

2.     Extreme weather fuelled by climate change................................................................................................................... 3
       2.1        Extreme heat                                                                                                                                                                    4
                  CASE STUDY: Extreme heat in western Sydney                                                                                                                                      8
                  CASE STUDY: 2020 Siberian heatwave                                                                                                                                              9
                  CASE STUDY: Coral mortality                                                                                                                                                    10
       2.2        Intense rainfall                                                                                                                                                               11
                  CASE STUDY: 2020 Asian monsoon floods                                                                                                                                          12
       2.3        Storms and cyclones                                                                                                                                                            13
                  CASE STUDY: 2020 North Atlantic hurricane season                                                                                                                               16
       2.4        Fire                                                                                                                                                                           17
                  CASE STUDY: 2020 US West Coast fires                                                                                                                                           18
       2.5        Drought                                                                                                                                                                       19
                  CASE STUDY: Flash drought                                                                                                                                                     20
                  BOX 1: Compound disasters                                                                                                                                                      21

3.     Abrupt, nonlinear extreme events.................................................................................................................................... 22
       3.1        Coral reefs                                                                                                                                                                   23
       3.2        2019-20 bushfire season                                                                                                                                                       24

4.     The cost of inaction – Where we are now compared to ten years ago.................................................................. 27
                  BOX 2: Hitting home – Intensifying disasters and cascading impacts                                                                                                             31

5.     By the numbers...................................................................................................................................................................... 33
       5.1        2019-20                                                                                                                                                                       33
       5.2        Long-term trends                                                                                                                                                              35

6.     Major events in Australia and around the world...........................................................................................................41

7.     We must act with more urgency....................................................................................................................................... 45

References....................................................................................................................................................................................... 49

Image credits.................................................................................................................................................................................. 54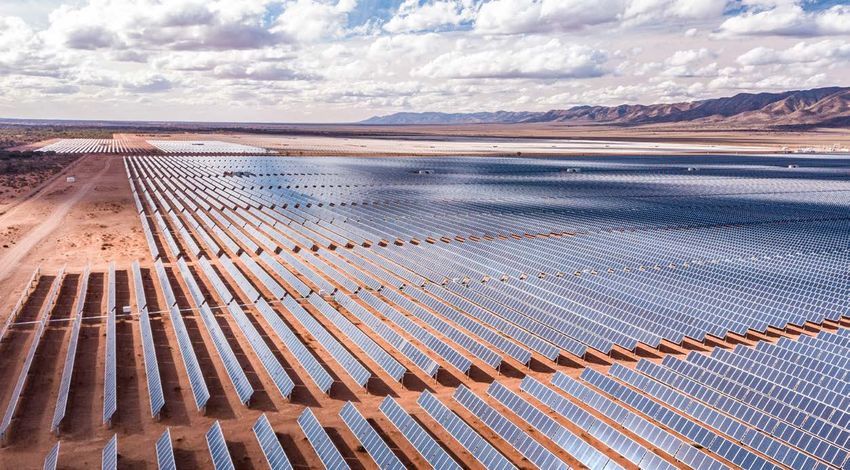
ii    HITTING HOME:
      THE COMPOUNDING COSTS OF CLIMATE INACTION

     Key findings
     1            2
     2019-20 was an exceptionally intense period for         Some extreme weather events show ‘tipping
     climate-fuelled extreme weather, with heavy             point’ behaviour when a critical level of heat or
     costs felt in Australia and around the world.           drought triggers a massive, devastating event.

     › An extraordinary run of events, including             › In 2019-20, we ushered in a new and dangerous era
       unprecedented fire seasons in Australia and the US,     of megafires that ravaged Australia, Brazil, Siberia
       a record-breaking North Atlantic hurricane season,      and the US West Coast. During the massive Black
       and an astonishing series of heat records, paint a      Summer bushfires, we likely crossed a tipping point
       sobering portrait of our escalating climate crisis.     for Australia’s temperate broadleaf and mixed forests.
                                                               In any typical fire season, 2-3 percent of these forests
     › Extreme heat events are rapidly on the rise both        burn, but in the Black Summer 21 percent burned.
       here, and overseas. The latest science projects
       that by 2100, annual deaths from extreme heat         › Around half of all hard corals along the Great Barrier
       worldwide will outstrip all COVID-19 deaths             Reef perished during successive mass bleaching
       recorded in 2020.                                       events in the past five years. We are on track to
                                                               eliminate all of Australia’s and the world’s tropical
     › The cost of extreme weather disasters in Australia      coral reefs.
       has more than doubled since the 1970s, reaching
       $35 billion for the decade 2010-2019.

     › Australians are five times more likely to be
       displaced by a climate-fuelled disaster than
       someone living in Europe. In the Pacific, that risk
       is 100 times higher.

     › Australia is surrounded by many countries that
       are acutely vulnerable to climate impacts. Those
       unfolding regional impacts may soon become
       as damaging to Australia as those that strike us
       directly.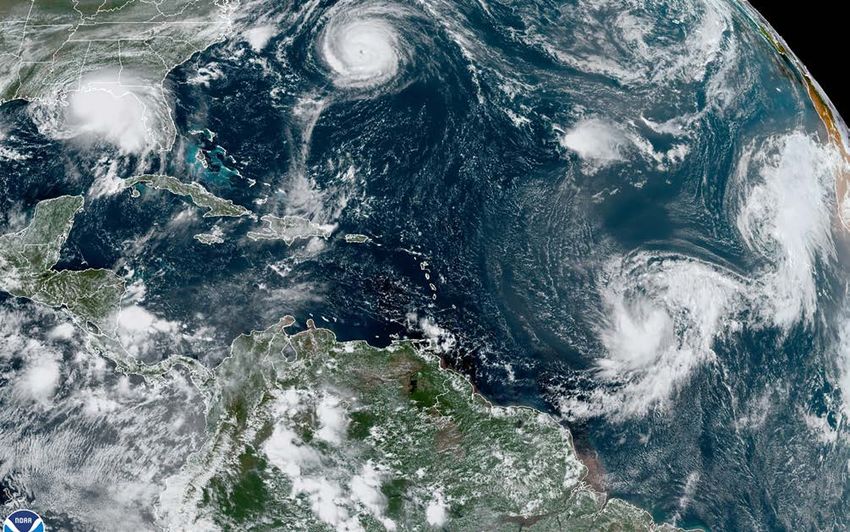
KEY FINDINGS      iii

3                                                       4
Ignoring climate change is deadly. Australians          No developed country has more to lose from
are now paying the price for our own and the            climate change-fuelled extreme weather, or
world’s failure to reduce emissions quickly             more to gain as the world transforms to a zero-
enough or deeply enough.                                carbon economy, than Australia does.

› Governments, like the Australian Government,          › We need bold, concerted action across all levels of
  which have failed to substantially reduce emissions     government, business, industry and community
  over the past decade have sentenced Australians,        to reduce Australia’s emissions to net zero as soon
  and communities worldwide, to a far more                as possible, and prepare for worsening extreme
  dangerous future than if they had responded to          weather events.
  repeated warnings from scientists.
                                                        › Almost all of Australia’s major trading partners
› Due to this past inaction, gradual, measured steps      and strategic allies, as well as Australian state
  are not enough to avoid catastrophe. At this point,     and territories, are now committed to net zero
  only truly transformative action is required. That      emissions by around mid-century. This includes
  means at least halving global emissions over the        countries that buy more than 70% of our coal and
  coming decade, and reaching net zero emissions          gas exports.
  globally by 2040 at the latest.
                                                        › Australia can position itself as a global powerhouse
                                                          of renewable energy and clean industries, ensuring
                                                          our prosperity and security in a post-carbon world.

                                                                                    climatecouncil.org.au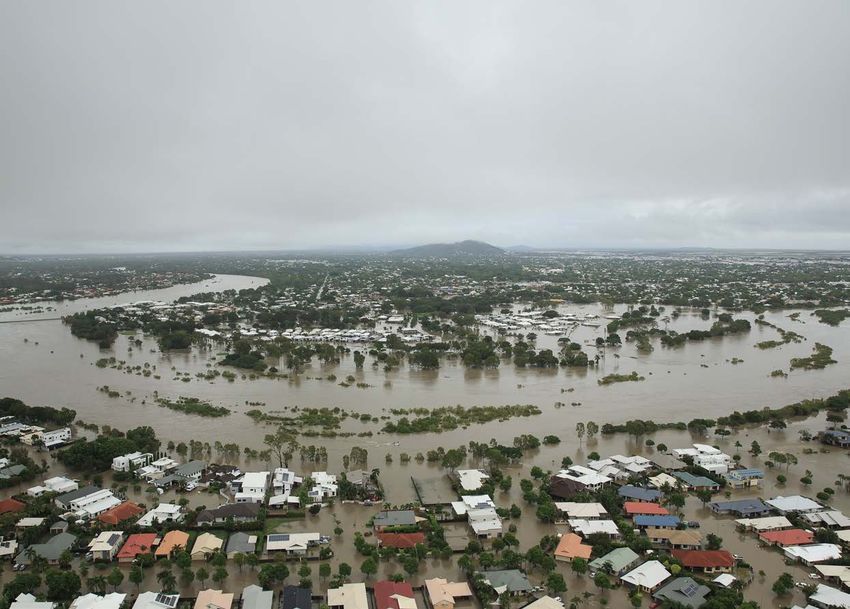
1   HITTING HOME:
    THE COMPOUNDING COSTS OF CLIMATE INACTION

    1.          Introduction
                Many will remember 2020 as the year      Unprecedented fires, extreme heat, powerful
                of the COVID-19 pandemic. Yet for        cyclones and devastating floods all occurred
                millions of people around the world      in 2019-20, capping off a decade in which
                the virus served as a backdrop to        the climate crisis hit hard.
                another battle as we lived through the
                most intense period yet of climate-      This report outlines the latest science on how
                fuelled extreme weather.                 climate change is driving more destructive
                                                         heatwaves, downpours, cyclones, droughts,
                                                         fires and other extreme weather events. It
                                                         highlights significant events in Australia
                                                         and around the world from the past two
                                                         years. Taken alone, any one of the events
                                                         described in this report – from Australia’s
                                                         Black Summer bushfires to the record-
                                                         breaking North Atlantic hurricane season, or
                                                         the remarkable Siberian heatwave – would
                                                         mark the year as unusual. Taken together,
                                                         they paint a disturbing portrait of our rapidly
                                                         escalating climate emergency.

                                                         There is no doubt that we have entered an
                                                         era of consequences arising from decades
                                                         of climate inaction and delay. We are all
                                                         paying dearly for the failure of governments
                                                         to respond adequately to repeated warnings
                                                         from scientists and those on the frontlines of
                                                         this unfolding crisis. It is now clear that we
                                                         must learn to live in a new age of megafires
                                                         and other climate impacts that are locked in
                                                         over the coming years. It is equally clear that
                                                         far greater dangers lie ahead if we fail to act
                                                         with the urgency and determination that the
                                                         science demands.
CHAPTER 01   2
                                                                                                  INTRODUCTION

As this report shows, communities here           The global community could have taken
and abroad are already reeling from              credible climate action much earlier.
unprecedented disasters occurring under a        Beginning a decade or two ago, we could
temperature rise of around 1.1°C above pre-      have taken more gradual, measured steps
industrial levels. Every fraction of a degree    that avoided the worsening impacts to come.
more will result in even more extreme events.    That time has passed. At this point, only
                                                 truly, transformative action will avoid us
For Australia, the devastating Black Summer      slipping from a crisis towards a full-blown
fires, a crippling drought, and yet another      catastrophe. That means at least halving
mass bleaching of the Great Barrier Reef         global emissions over the coming decade,
affirmed our acute vulnerability to climate      and reaching net zero emissions globally by
impacts. Similarly, as the world’s third         2040 at the latest (Steffen et al. 2020).
largest exporter of fossil fuels, behind only
Russia and Saudi Arabia (Office of the Chief     Given the immediate, rapidly escalating risks
Economist 2020), we are highly exposed to        of climate change that we now face, every
economic losses and job cuts as the world        0.1°C of warming matters, and every gigaton
shifts towards a new, clean economy. Yet we      of carbon left in the ground will be measured
could still pivot, and prosper in the emerging   in lives and livelihoods saved. Even taking
renewables-driven economy with natural           into account the series of strengthened
advantages that are the envy of countries        commitments made by the world’s biggest
around the globe.                                emitters in 2020, optimistic assessments say
                                                 we are still on track for heating of well over
It is no exaggeration to say that decisions      2°C (Climate Action Tracker 2020), and a
made over the coming year, as governments        barely survivable future.
aim to reboot their economies from the
COVID-19 crisis and we head toward the           The events of 2019-20 have provided us with
next critical round of international climate     the clearest picture yet of why far stronger
negotiations, may represent our last chance      and more urgent action is required.
to secure a future in which our children can
survive and thrive.                              .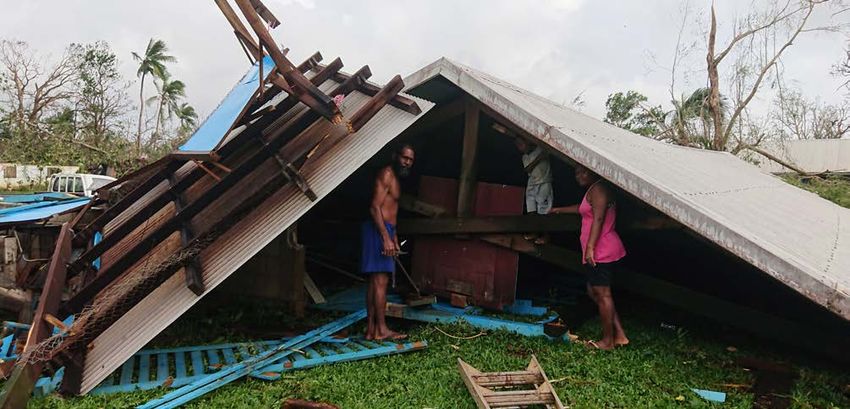
3   HITTING HOME:
    THE COMPOUNDING COSTS OF CLIMATE INACTION

    2. Extreme weather fuelled
       by climate change
                When we change the climate, we               Over the past few years, attribution science
                change the conditions under which            has made significant progress. It tells us, with
                all shorter-term weather events form.        increasing confidence, the likelihood that
                Global emissions of greenhouse gases         a given event could have occurred without
                are making our climate system hotter         climate change, or the extent to which an
                and more energetic. This is leading to a     event may have worsened due to climate
                marked increase in the frequency and/        change. For example, Australia’s record
                or severity of destructive weather events:   hot spring in 2020 was deemed “virtually
                extreme heat, intense downpours,             impossible” without the influence of human-
                powerful cyclones, crippling droughts,       induced climate change (Karoly 2020).
                and dangerous fire weather. While
                no country is immune to the climate          The following sections examine the influence
                crisis, its impacts are not shared evenly.   of a warming climate on different types of
                Already a land of extremes, Australia is     extreme weather events, and include case
                perhaps the most vulnerable among all        studies of some of the unprecedented events
                developed countries.                         that took place in 2019-20.

    Australia’s record hot spring in 2020
    was deemed “virtually impossible”
    without climate change.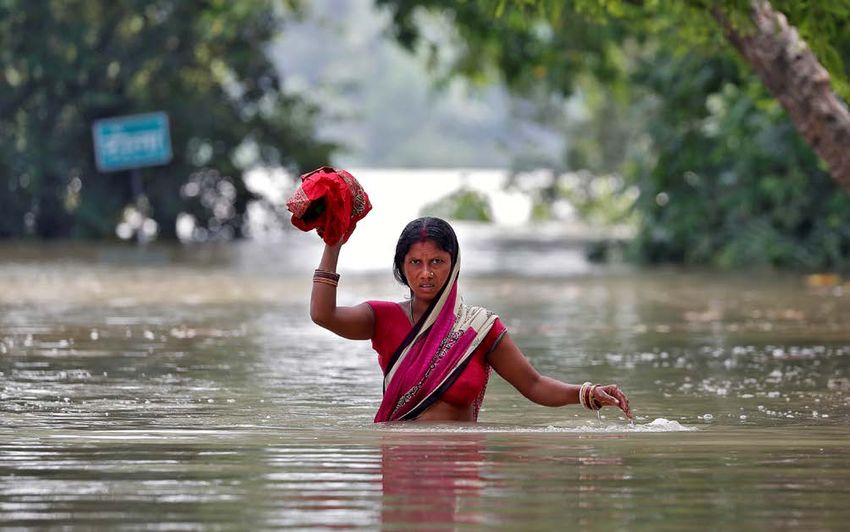
CHAPTER 02                   4
                                                                                 EXTREME WEATHER FUELLED BY CLIMATE CHANGE

2.1                  Extreme heat
                      The seven hottest years on record globally                        Today the world has warmed by
                      all occurred in the past seven years. In other                    around 1.1°C since pre-industrial times.
                      words, each year between 2014-2020 was                            However, this warming is not spread
                      warmer than any year recorded in history                          evenly, and many land areas are already
                      prior to 2014. In decadal terms, the 2010s                        significantly hotter than the global
                      were warmer than any preceding decade;                            average. For example, Australia has
                      a full 0.2°C warmer than 2000-2009,                               warmed on average by 1.44°C since
                      representing a sharp acceleration in the rate                     national records began in 1910 (CSIRO
                      of temperature increase.1                                         and BoM 2020). 2

In a single year (2019), Australia recorded
33 days above 39 degrees – that’s more
than all such days recorded over the
previous 60 years (1960-2018).

1 The global temperature has increased at an average rate of 0.07°C per decade since the 1880s. Most warming has occurred since the 1950s.
2 If using a pre-industrial baseline rather than 1910, then by 2019 Australia had warmed by more than 1.5°C.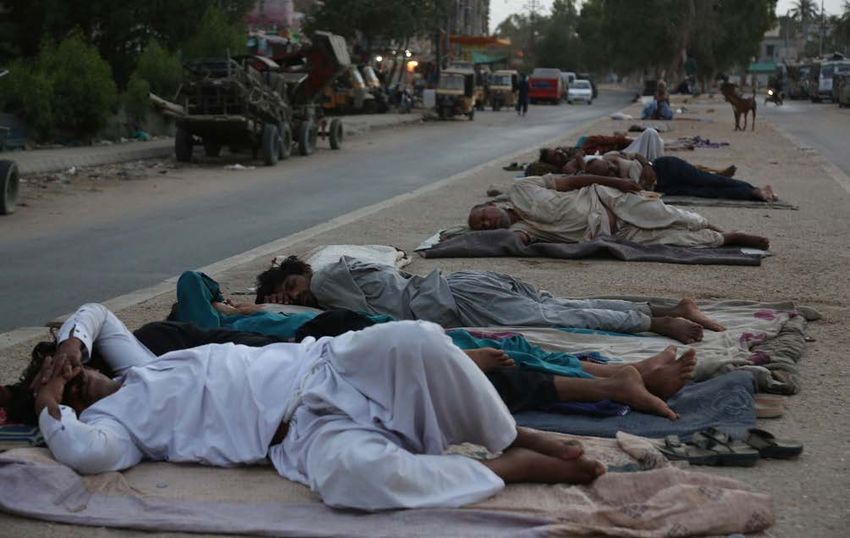
5    HITTING HOME:
     THE COMPOUNDING COSTS OF CLIMATE INACTION

                                      As illustrated by Figure 1, an increase in      Heatwaves are by far the most lethal extreme
                                      global average temperatures means a marked      weather risk facing Australians. Since 1890,
                                      increase in the probability of extreme and      heatwaves have killed more Australians than
                                      record-breaking hot weather, and a decrease     bushfires, cyclones, earthquakes, floods, and
                                      in the probability of extreme cold weather.     severe storms combined (DIT 2013). Extreme
                                      Climate change is creating more record          heat can also be deadly for Australian
                                      hot days, and making heatwaves longer,          animals. In late 2018, more than a third of
                                      more intense and more frequent (Steffen         the county’s population of spectacled flying
                                      et al. 2019). In 2019, Australia experienced    foxes died in a single heatwave (Welbergen
                                      43 “extremely warm days”, more than             2019). In January 2019, extreme heat led to
                                      triple the number recorded in any year last     the death of more than 90 wild horses near
                                      century (CSIRO and BoM 2020). Even more         Alice Springs (BBC 2019).
                                      strikingly, in terms of the average maximum
                                      temperature recorded across Australia, there    In 2020, the US-based National Bureau
                                      were 33 days that exceeded 39°C – more than     of Economic Research published new
                                      the total number observed in the entire 1960-   projections for the number of people likely
                                      2018 period (CSIRO and BoM 2020).               to die from climate change-fuelled extreme

    Figure 1: When average temperatures increase and the curve showing the distribution of temperatures moves to the right,
    there is a significantly greater probability of experiencing very hot, and record hot, weather.

                                                             Increase of average temperature

                                                PREVIOUS                                       NEW
                                                 CLIMATE                                       CLIMATE
           Probability of occurance

                                                                                                  More hot weather

                                       Less cold weather
                                                                                                          More record
                                                                                                          hot weather

                                            COLD                       AVERAGE                            HOT

                                                                                        Previous record         New record
CHAPTER 02 6
EXTREME WEATHER FUELLED BY CLIMATE CHANGE
heat. It concluded that if no action is taken,
on average there would be 221 additional
Scientists expect that by
deaths per 100,000 people globally each year
by 2100 – roughly equivalent to all deaths
2100, climate change-
from cardiovascular disease today. Even after fuelled extreme heat will
factoring in efforts to adapt to a changing
climate, the study still projects an extra 73 kill more people across
deaths per 100,000 people annually by 2100
– which is greater than the number of all the globe annually than
people who died from COVID-19 in 2020.
While climate change affects all countries COVID-19 did in 2020.
and communities, the study reaffirmed the
stark inequity of the climate crisis, with poor
communities – the same people who have
contributed the least to global greenhouse
gas emissions – likely to suffer far more
deaths (Carleton et al. 2020).
Figure 2: Poor communities in developing countries are likely to suffer far more deaths from climate change, despite having
contributed the least to the problem.7 HITTING HOME:
THE COMPOUNDING COSTS OF CLIMATE INACTION
The oceans also provide evidence for more than doubled (IPCC 2019). In 2019,
climate-fuelled temperature extremes. The the world’s oceans were their warmest in
vast majority of the excess heat trapped by recorded history. Oceans around Australia
greenhouse gas emissions – more than 90 have warmed by more than 1°C since 1910.
percent – is absorbed by oceans. Today this Marine heatwaves are becoming more
is an amount of energy equivalent to around intense and occurring more often, causing
five Hiroshima atomic bombs every second extensive and permanent damage to many
(Cheng et al. 2020). marine ecosystems, including coral reefs
(See CASE STUDY: Coral mortality), kelp
The rise in ocean temperatures has been forests and sea grass. (CSIRO and BoM 2020.)
accelerating significantly since the 1990s;
since 1993 the rate of ocean warming has
Figure 3: Marine heatwaves are causing extensive damage to coral reefs.CHAPTER 02 8
EXTREME WEATHER FUELLED BY CLIMATE CHANGE
CASE STUDY: EXTREME HEAT IN WESTERN SYDNEY
On 4 January 2020, Penrith was officially socio-economic divide between Sydney’s affluent
the hottest place on Earth at 48.9°C. Such east and the fast-growing western suburbs,
temperatures are already pushing the limits with incomes, job opportunities, and access to
of human endurance, and people in urban education all split along the so-called “latte line”
settings like Penrith may be regularly exposed that divides the cities’ eastern suburbs and north
to even higher temperatures than those officially shore from the west (Gladstone 2018).
recorded due to amplifying factors such as
concrete and asphalt (Thompson 2020) - the Very high temperatures in schools make it harder
‘urban heat island’ effect. In particular, extreme for students to concentrate, contributing to
heat endangers children, the elderly, people with reduced learning outcomes (Pfautsch et al. 2020).
existing health conditions and other vulnerable Research from the University of Western Sydney
groups (Climate Council 2016). revealed that for students in Sydney’s western
suburbs, extreme summer heat in schools is often
Extreme heat in Sydney demonstrates how compounded by the poor design of buildings,
climate change can exacerbate existing inadequate shade and surfaces that absorb much
socio-economic inequalities. Western Sydney heat (Pfautsch et al. 2020).
experiences higher summer temperatures than
suburbs nearer the coast. For example, over the Without far stronger action to address climate
2019-20 summer, western Sydney recorded 37 change and support communities to adapt to new
days over 35°C compared to six in the east of extremes, we risk further entrenching inequalities.
the city (Amin 2020). This matches the marked
On 4 January 2020, Penrith was
officially the hottest place on Earth.
Western Sydney is suffering more than
eastern Sydney under climate change.9 HITTING HOME:
THE COMPOUNDING COSTS OF CLIMATE INACTION
CASE STUDY: 2020 SIBERIAN HEATWAVE
In the first six months of 2020, an intense, In July, an attribution study concluded that
persistent and widespread heatwave across the 2020 Siberian heatwave would have been
Siberia broke temperature records, fuelled “almost impossible” in the absence of climate
large fires, and thawed permafrost. Overall, change, showing with high confidence that the
temperatures for the region were more the event “was made at least 600 times more likely
5°C above average from January to June. as a result of human-induced climate change”
This extraordinary extreme heat event made (Ciavarella et al. 2020).
global headlines when the Russian town of
Verkhoyansk recorded a temperature of 38°C Siberia is one region where global warming has
in June, likely the highest temperature ever a particularly devastating effect, not only on
recorded in the Arctic (Dunne 2020). local ecosystems and communities, but also on
the climate system as a whole as the release of
Also in June, satellite images detected greenhouse gases through thawing permafrost
signatures of “zombie fires”, remnants and large fires contributes to further warming.
from the previous season’s record fires that
had continued smouldering underground
throughout winter in the carbon-rich
peat and had flared up again with warm
temperatures. Pyrocumulonimbus clouds, or
“fire thunderstorms” – a rare phenomenon
anywhere and especially unusual at such high
latitudes – were also detected (Deacon 2020).CHAPTER 02 10
EXTREME WEATHER FUELLED BY CLIMATE CHANGE
CASE STUDY: CORAL MORTALITY
Just as we are experiencing more frequent and temperature rise is held to 1.5°C, coral reefs
severe heatwaves on land, climate change is will decline by a further 70-90 percent. At 2°C,
also driving deadly marine heatwaves that are tropical reef-building corals are expected to
devastating ocean ecosystems. “mostly disappear”, with the loss of more than
99% of the corals.
There can be no more striking illustration of
the frightening pace of climate change and its While we often communicate the price of
profound impacts on living systems than the these losses in terms of the estimated $6 billion
plight of Australia’s Great Barrier Reef (GBR). value of the GBR to the Australian economy
The GBR is the world’s largest coral reef system, and the 64,000 jobs it supports (Deloitte Access
and in its current form is about 8,000 years old. Economics 2017), in reality these numbers do
Between 1995 and 2017 – a mere blink of an eye little to convey the gravity of the crisis unfolding
compared to its age – the GBR lost more than before our eyes. As Chief Councillor Tim Flannery
half its hard corals due to warmer seas driven notes in his 2020 book The Climate Cure:
by the greenhouse gas emissions from burning
coal, oil and gas (Dietzel et al. 2020). “[Coral] reefs are home to the greatest
biodiversity in the oceans, and their loss would
Back-to-back bleaching events in 2016 and reverberate throughout Earth’s ecosystems,
2017 damaged two thirds of the reef. In March both marine and terrestrial. And the human
2020, as Australia was scrambling to contain impacts would be immense. Entire nations
the COVID-19 outbreak, news emerged of the (the coral atoll nations) depend upon them for
third mass bleaching event within five years food and protection against erosion. Many
(GBRMPA 2020). The marine heatwave that consequences of the loss of coral reefs are
caused widespread bleaching of the GBR in 2016 probably not conceivable until they eventuate.”
was made 175 times more likely due to climate
change (King et al. 2016). In 2020 the International Union for Conservation
of Nature, advisory body to the UNESCO World
In its Special Report on 1.5°C, the Heritage Committee, escalated its conservation
Intergovernmental Panel on Climate Change outlook for the Great Barrier Reef from “significant
(IPCC) projected that even if the global average concern” to “critical” (IUCN 2020).
There’s no more striking illustration of the
frightening pace of climate change and its
profound impacts on living systems than
the plight of the Great Barrier Reef.11 HITTING HOME:
THE COMPOUNDING COSTS OF CLIMATE INACTION
2.2 Intense rainfall
A warmer atmosphere can hold more water often associated with flash flooding,
vapour – approximately 7 percent more has increased by around 10 percent
for every degree of warming (Trenberth in some regions, with particularly
2011). A warmer and wetter atmosphere large increases observed in the north.
also provides more energy for weather These short-duration events are
systems that generate intense precipitation often associated with thunderstorms,
(rain, snow, hail). So, while climate cyclones, and east coast lows, and there
change may mean only a modest increase has been an observed increase in the
in the overall amount of precipitation rainfall associated with these systems
globally – limited by the moisture holding since 1979 (CSIRO and BoM 2020).
capacity of the atmosphere – it’s leading
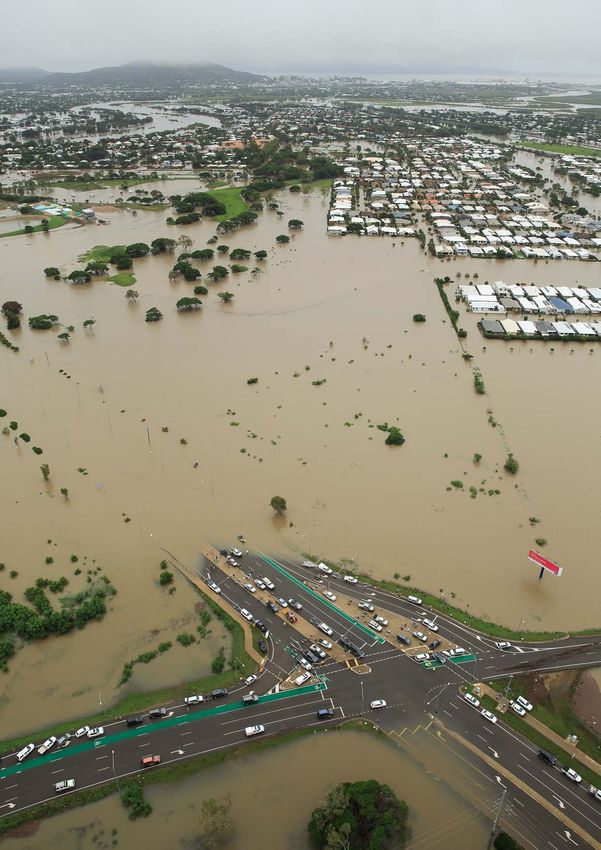
to a marked increase in the heaviest and In January/February 2019, heavy
most damaging storm events. In other rainfall caused widespread flooding
words, more of our rain is falling in fewer across north and far north Queensland,
extreme downpours, often interspersed affecting more than half of the state.
with prolonged dry periods. If the current It was one of the worst disasters in
trend continues, the frequency of today’s the region’s history. The total social
most intense precipitation events is likely to and economic costs were estimated at
almost double with each degree of further $5.68 billion, or around 14 percent of
warming (Myhre et al. 2019). the region’s annual economic output.
This included damage to homes and
The pattern of more intense, heavy rainfall infrastructure, impacts on health and
events is well established in Australia. In wellbeing, and the loss of half a million
recent decades, the intensity of short- cattle (Deloitte Access Economics 2017).
duration extreme rainfall events, which are
Australia is experiencing more intense,
heavy rainfall. In 2019, heavy rainfall
caused widespread flooding affecting
more than half of Queensland – one of
the worst disasters in the region’s history.CHAPTER 02 12
EXTREME WEATHER FUELLED BY CLIMATE CHANGE
CASE STUDY: 2020 ASIAN MONSOON FLOODS
Billions of people across the populous countries India, Bangladesh, Nepal, China, and Pakistan
of south and east Asia depend upon the Indian all suffered heavy losses in severe floods in 2020
and East Asian monsoons. While seasonal following intense monsoon rains. The worst
monsoon rains are fundamental to food and flooding along the Yangtze River for decades
water security, they can also cause catastrophic occurred in June, killing hundreds of people in
flooding. Consistent with shifting rainfall China, destroying croplands, and testing the
patterns globally, the Indian monsoon is limits of the giant Three Gorges Dam (Patel 2020).
becoming more extreme, with prolonged dry In July, flooding in India (Assam) and Nepal
spells punctuated by intense downpours (Singh killed at least 200 people and displaced millions,
2014). A recent review of current knowledge hindering efforts to slow the spread of COVID-19
on how climate change is affecting monsoons (Ellis-Petersen 2020). In Bangladesh, no stranger
globally concluded with high confidence that to floods, the worst monsoon flooding for many
climate change “has already caused a significant years left around a third of the country submerged
rise in the intensity and frequency of extreme (Hasina 2020). Pakistan set a new monthly rainfall
rainfall events in all monsoon regions” (Wang et record in August, and the military was deployed
al. 2020). to rescue people from flooded areas of Karachi
(Qayum and Dilawar 2020).
Figure 4: The Indian monsoon is becoming more extreme.13 HITTING HOME:
THE COMPOUNDING COSTS OF CLIMATE INACTION
2.3 Storms and cyclones
Tropical cyclones, known as hurricanes in (Bhatia et al. 2019), the speed at which a
the north Atlantic and northeast Pacific, system moves (known as translation speed)
typhoons in the northwest Pacific, and (Kossin 2018), how much strength is retained
cyclones in the South Pacific and Indian after reaching land (Li and Chakraborty
Oceans, are among the most destructive 2020), the duration of cyclone seasons, and
extreme weather events. the geographic range of tropical cyclones
(Kossin et al. 2014).
Many Pacific Island Countries, including
Fiji, Vanuatu, Solomon Islands and Tonga, Cyclones form most readily when there
lie within the South Pacific cyclone basin. is a very warm ocean surface and a
In recent years, a run of extraordinarily strong temperature gradient through the
damaging cyclones in the Pacific has atmosphere – i.e. a big difference in the
taken a heavy toll on local economies. In temperature of the air at the surface and the
2015, Category Five Cyclone Pam, then the air higher up. A warming climate means that
strongest South Pacific cyclone on record,3 the temperature gradient is likely to decrease,
caused damages equivalent to 64 percent so the conditions in which cyclones form
of Vanuatu’s Gross Domestic Product may occur less often. This means that the
(GDP). A year later, Cyclone Winston, an overall number of cyclones that form will
even stronger cyclone, devastated Fiji likely decrease. However, rising ocean
with damages amounting to 31 percent surface temperatures and a warmer, wetter
of GDP. In 2018, Cyclone Gita hit Tonga, atmosphere provide a larger source of energy
causing losses equivalent to 38 percent for cyclones to draw on once they do form.
of GDP. Most recently, in 2020, Cyclone It is thus likely that tropical cyclones will
Harold – the second strongest cyclone to become more intense with climate change
hit Vanuatu after Cyclone Pam – severely in terms of maximum wind speed and the
affected Vanuatu, Solomon Islands, Fiji and amount of rainfall they produce (IPCC 2012).
Tonga, compounding the economic impact For example, the amount of rainfall in two of
of COVID-19 (Taylor 2020.) In Australia, 2017’s most destructive hurricanes – Irma
Cyclone Yasi in 2011 and Cyclone Debbie in and Maria – was likely six percent and nine
2017 remain two of our most costly disasters. percent higher, respectively, compared to a
world without climate change (Patricola and
Climate change is affecting the conditions Wehner 2019).
in which tropical cyclones form and develop.
Climate change is linked to many different In summary, there are likely to be fewer
aspects of cyclone formation and behaviour, cyclones overall but a higher number of
including how often they form, maximum those that do form will likely be more intense
windspeed and amount of rainfall (IPCC and destructive.
2012), the speed at which a system intensifies
3 Measured in terms of peak 10-minute sustained windspeed.Figure 5: Typhoon Goni, which struck the Philippines in November 2020, was the strongest landfalling cyclone on record.
Until recently, with the exception of the as an increase in wind strength of at least 35
North Atlantic basin where records show a mph (56 kmh) within 24 hours. In the 2020
clear increase in the intensity of cyclones North Atlantic hurricane season (see CASE
over recent decades,4 there has not been STUDY: 2020 North Atlantic hurricane season)
enough historical data of sufficient quality a record-equalling ten storms exhibited rapid
to discern clear real-world trends in cyclone intensification. Two of 2020’s record number
activity. However, in 2020 an analysis of of North Atlantic hurricanes, Eta and Iota,
nearly 40 years of satellite imagery concluded strengthened by 80mph (129 kmh) in 24 hours,
that maximum wind speeds are getting an intensification rate observed only eight
stronger for cyclones in almost every region times before and never so late in the season.
where they form, affirming what models had In the early 1980s, the chance of a hurricane
long predicted (Kossin et al. 2020). rapidly intensifying were 1-in-100. Those
odds have now shortened to less than 1-in-
As well as reaching higher intensity, it is also 20 (Bhatia et al. 2018). Rapid intensification
possible that a warming climate is enabling can lead to disastrous outcomes, as coastal
cyclones to strengthen more quickly (Bhatia communities may not be given adequate
et al. 2019). “Rapid intensification” is a term warning to prepare for an intense cyclone
used to describe the dramatic strengthening (Bhatia et al. 2019).
of cyclones over a short period of time. The
US National Hurricane Center defines this
We should prepare for more intense and
destructive cyclones due to climate change.
4 Since 1980, the number of North Atlantic hurricanes with winds stronger than 200 km/h have doubled, and those with winds stronger than 250
km/h have tripled (Rahmstorf et al. 2018).15 HITTING HOME:
THE COMPOUNDING COSTS OF CLIMATE INACTION
Based on recent observations, it is also While there may be differences in the
possible that cyclones are staying stronger state of knowledge about these various
after making landfall. A cyclone, which trends and their links to climate change,
derives its strength from warm ocean there is little doubt that, overall, climate
surfaces, begins to lose strength on change is increasing the destructive power
reaching land. However, climate change of tropical cyclones. This is especially
may slow down this effect, thus allowing true when considering other impacts of
the cyclone to wreak more destruction and climate change that, while not directly
reach communities further inland (Li and affecting cyclone behaviour, are nonetheless
Chakraborty 2020). It thus appears that increasing the dangers. For example,
on a warming planet, cyclones are both cyclones are now riding upon higher sea
powering up more quickly and winding levels, meaning that storm surges – often
down more gradually. the deadliest aspect of a cyclone – are higher
and penetrate further inland than they would
Lastly, there is evidence that cyclones are otherwise (Climate Council 2017). Climate
moving more slowly. That is the rate at which change is also damaging many natural
a system tracks across the ocean and land, coastal defences, including coral reefs and
known as translation speed as opposed to mangroves, which leave communities
its maximum wind speed, is decreasing. On and infrastructure more exposed to the
average, it appears that translation speed destructive power of cyclones.
decreased by 10 percent between 1949 and
2016 (Kossin 2018). This may be the result of a
slowdown in atmospheric circulation (Zhang
et al. 2020). Slow-moving cyclones, such
as Hurricane Maria in 2017, can be hugely
destructive, dumping immense amounts of
rain over a small area, while also sustaining
damaging windspeeds for a longer period
(Resnick 2017).CHAPTER 02 16
EXTREME WEATHER FUELLED BY CLIMATE CHANGE
CASE STUDY: 2020 NORTH ATLANTIC HURRICANE SEASON
While the US West Coast burned, the East Coast, moved very slowly, lingering for three days over
Caribbean and Central America were pummelled Central America, producing immense amounts of
by a record-breaking Atlantic hurricane season. rain and killing at least 215 people. Just two weeks
Between May and November, the region later, the last and strongest storm of the season,
recorded 30 named tropical storms, including Hurricane Iota, rapidly intensified into a category
13 hurricanes and six major hurricanes – more five system before hitting Colombia, Nicaragua,
than double the number experienced during Honduras and other countries of Central America,
an average season (WMO 2020). Twelve named including areas already hit two weeks earlier by
storms hit the US mainland, beating the previous Hurricane Eta (Masters 2020).
record of nine. For only the second time, the US
National Hurricane Centre had to use names The damage from this year’s unprecedented
from the Greek alphabet, as the standard list of Atlantic hurricane season is likely to increase
alphabetical names had been exhausted. pressure on people in Central America to migrate
out of harm’s way, including across borders
The most destructive storm of the season was (Palencia and Lopez 2020).
Hurricane Eta, which made landfall in Nicaragua
on 3 November as a category four storm. Eta
Figure 6: September 2020 saw five tropical cyclones churning in the Atlantic baisin at the same time.17 HITTING HOME:
THE COMPOUNDING COSTS OF CLIMATE INACTION
2.4 Fire
In 2019-20, astonishing fire seasons across
several continents, from Australia to the
Amazon, Siberia and the US West Coast, For a full account of
ushered in a new and dangerous era of Australia’s Black Summer
megafires. Tens of millions of hectares of fires, see Climate Council’s
forest were razed by fire, hundreds of lives report: Summer of Crisis
and thousands of homes lost, billions of
animals killed, and critical ecosystems
pushed to or over the brink.
In terms of the size of area burned, the the smoke that blanketed large parts of the
US West Coast fires broke almost every country (Johnson et al. 2020).5
conceivable record for the region, eclipsing
California’s then record-breaking and deadly Higher temperatures and shifting rainfall
2018 season (See CASE STUDY: 2020 US West patterns are driving increased fire risk in
Coast fires). Australia’s Black Summer of many of the world’s great forest and grassland
2019-20 was similarly unprecedented in its ecosystems, from the boreal zone to the tropics.
scale and harm with 21 percent or more of
eastern Australian temperate broadleaf and In Australia, extremely hot, dry conditions,
mixed forests burned. Typically, less than underpinned by years of reduced rainfall
2-3 percent of these forests burns annually, and a severe drought, set the scene for the
even during more extreme fire seasons (Boer Black Summer fires (Hughes et al. 2020).
et al. 2020). Large parts of the Gondwana Extreme fire weather and the length of the
rainforest – a living link to the former fire season across large parts of Australia have
Gondwana supercontinent and a wellspring increased since the 1950s (CSIRO and BoM
of unique Australian flora and fauna – were 2020). In some regions of southern Australia
razed. This unique and ancient ecosystem there is an increasing risk of more extreme
was previously considered too wet to burn. bushfires that can generate thunderstorms
Further south, the Gospers Mountain fire within their smoke plumes (CSIRO and BoM
became the largest forest fire ever recorded 2020). Such fires are very dangerous and
in Australia, burning through more than half unpredictable. Lightning strikes from these
a million hectares including a large part of pyrocumulonimbus clouds can spawn new
Wollemi National Park. A staggering 81% of fires well ahead of the main fire front.
the nearby Blue Mountains World Heritage
Area also burned. Around three billion “Climate change has pushed Australia into
animals are likely to have perished or been a new era of unprecedented bushfire risk,
displaced by the Black Summer fires (WWF and our governments have underestimated
2020), 33 human lives were lost directly to the threat.” Greg Mullins (2020)
the fires, and an estimated 429 more from
5 Research by Johnson et al. (2020) estimated the smoke-related health costs of the Black Summer fires at AUD$1.95 billion, driven largely by “an
estimated 429 smoke-related premature deaths in addition to 3,230 hospital admissions for cardiovascular and respiratory disorders and 1,523
emergency attendances for asthma”.CHAPTER 02 18
EXTREME WEATHER FUELLED BY CLIMATE CHANGE
CASE STUDY: 2020 US WEST COAST FIRES
Australia was not the only place to experience The parallels between the 2020 US West Coast
truly unprecedented fires in 2019-20. fires and Australia’s Black Summer of 2019-20 are
hard to miss. Both were unequivocally driven by
By the end of 2020, fires had burned more climate change, following long dry periods and
than four million acres (1.6 million hectares) of record heat. Both set records for the largest fires
California, more than double the record set in ever recorded in each country. Both left large
2018 (CalFire 2020). Five of the six largest fires on population centres blanketed in smoke, creating
record for the state occurred in 2020. California eery images of national icons like the Sydney
recorded its first “gigafire” in modern history – a Harbour Bridge and San Francisco’s Golden Gate
fire of over a million acres (Milman and Ho 2020). Bridge bathed in an orange hue. Events once
considered very rare, including fire tornados and
“We have never seen this amount of pyrocumulonimbus clouds, were observed many
uncontained fire across the state... This will times. Both exposed failures of national leadership
not be a one-time event. Unfortunately, it is and tensions between state and federal authorities
the bellwether of the future. We’re feeling the over climate inaction. Both spawned renewed
acute impacts of climate change.” Oregon interest in Indigenous land and fire management,
Governor Kate Brown and recognition that supporting the leadership
of First Nations people is an essential part of
Other states also suffered one of their most responding to the climate crisis (Commonwealth
destructive fires seasons. In Oregon, fires burned of Australia 2020, Singh 2020).
over a million acres (400,000 hectares), more
than twice the average for a season and at one
point threatened Portland’s suburbs; prompting
mass evacuations (McGrath 2020). Washington
state recorded more fires than in any other year
(O’Sullivan 2020). Colorado experienced its
largest single fire on record (Lytle 2020).
We have ushered in a new and
dangerous era of megafires.19 HITTING HOME:
THE COMPOUNDING COSTS OF CLIMATE INACTION
2.5 Drought
Climate change has likely brought an Climate change has already had a
increase in the frequency and/or severity significant impact on rainfall over parts
of drought in some regions due to shifting of Australia, in particular the southeast
rainfall patterns and higher temperatures. and southwest. In the southeast, rainfall
The Mediterranean, western US, West during the cool season (April to October)
Africa and northeast China are among the has declined by 12 percent since the late
regions to have observed a reduction in 1990s. In the southwest rainfall during the
rainfall over recent decades (IPCC 2013). cool season (April to October) has declined
Based on the IPCC’s Special Report on 1.5°C by around 16 percent since 1970, and by 20
(2018), twice as many people worldwide percent between May and July. A continued
would be exposed to water scarcity at decrease in cool season rainfall is expected
2°C of warming compared to 1.5°C. The across many regions of southern and
Mediterranean and Caribbean would be eastern Australia (CSIRO and BoM 2020).
among the areas hit particularly hard.
Figure 7: Climate change has likely brought an increase in the frequency and/or severity of drought in some regions.CHAPTER 02 20
EXTREME WEATHER FUELLED BY CLIMATE CHANGE
CASE STUDY: FLASH DROUGHT
In mid-2019 much of inland New South Wales The impacts of flash droughts can be severe, as
found itself in what meteorologists have started the rapid onset can mean little time for farmers
terming a ‘flash drought’ (Doyle 2020). A flash to prepare and for common coping mechanisms
drought is characterised by the sudden onset to be deployed (Nguyen 2019). While existing
and rapid intensification of drought conditions, dry conditions naturally leave an area at greater
over a period of weeks or months. A similar risk, flash droughts can even occur when prior
situation occurred along much of Australia’s conditions did not appear conducive to drought
east coast during the last months of 2017 and development (Christian 2019). Recent research
into 2018. has aimed at better predicting flash droughts
(Nguyen et al. 2019, Pendergrass et al. 2020).
Flash droughts occur when there is a very fast
reduction in soil moisture, typically resulting
from a lack of rainfall alongside factors
that increase evaporation including high
temperatures, low humidity, and strong winds
(Otkin et al. 2018). Acting together, these factors
can quickly turn a manageable situation into
severe drought conditions.
Scientists have had to coin a new
phrase ‘flash drought’ to capture
the sudden onset of such events
that can catch farmers and
communities unprepared.21 HITTING HOME:
THE COMPOUNDING COSTS OF CLIMATE INACTION
BOX 1: COMPOUND DISASTERS
Climate change, by increasing the frequency Compound extremes may also be caused by a
and/or severity of destructive weather events combination of events or elements that are not in
as well as the background conditions such themselves extreme, but when combined prove
as average temperature and sea level, is very destructive - for example, a moderate storm
increasing the risk of ‘compound extremes’: combined with very high tide. Another example
instances where multiple destructive events is a series of coastal erosion events that occur in
or elements occur at the same time or in close quick succession, with little time in between for
succession, exacerbating one another such the coast to be replenished, such as happened
that the overall impact is worse than if each along parts of the NSW coast in July 2020
had occurred in isolation. (Hannam 2020).
Events making up a compound extreme Compound extremes can inflict immense
may be similar in nature. For example, two human suffering, economic costs and
tropical cyclones hitting the same area in close environmental damage. Climate-related
succession, as for communities in Central disasters may also exacerbate non-climate-
America that were hit by both Cyclone Eta and related challenges and vice versa. For example,
Iota within the span of only two weeks (See when Cyclone Harold – the strongest cyclone
CASE STUDY: 2020 North Atlantic hurricane to hit Vanuatu since record-breaking Cyclone
season). In other instances, events may be Pam in 2015 – caused widespread destruction,
different in nature. For example, heavy rainfall urgent relief efforts had to be managed alongside
falling on a landscape charred by bushfires necessary measures to prevent the spread of
may mean a high likelihood of landslides COVID-19 (Masivei 2020, Pringle 2020).
(Rengers et al. 2020).
Figure 8: Vanuatu and other Pacific Island Countries had to deal with the impacts of Cyclone Harold and
COVID-19 simultaneously.CHAPTER 03 22
ABRUPT, NONLINEAR EXTREME EVENTS
3. Abrupt, nonlinear
extreme events
Many changes in the climate system Figure 9: NSW Farmer Rob Lee, New
appear as smooth curves in which the Year’s Eve 2019. The Black Summer was an
esxample of an extreme event that can be
response of the system is proportional explained by tipping point behaviour.
to the level of pressure applied – that
is, straight-forward cause-effect logic.
An example is the rise in global average
surface temperature in response to
human emission of greenhouse gases.
However, nonlinear changes can occur
when a small increase in pressure on
the system reaches a critical level. The
result is often an unexpectedly large
and, in some cases, irreversible change
in the system.
Features of the Earth System that can exhibit
abrupt, nonlinear, and and/or irreversible
behaviour are called ‘tipping elements’, and
the level of the external pressure required
to trigger the response is often called the
‘tipping point’ (Lenton et al. 2008). Some, but
not all, extreme weather events can show
tipping point behaviour when a critical level
of pressure - e.g., rising temperature, rainfall
reduction, or both - trigger a surprising
large, abrupt response. Below we describe
two recent Australian examples of extreme
events that display tipping point/abrupt
change behaviour.23 HITTING HOME:
THE COMPOUNDING COSTS OF CLIMATE INACTION
3.1 Coral reefs
(See also CASE STUDY: Coral mortality). Coral Projections from the IPCC Special Report
bleaching is a classic example of a tipping on 1.5°C warming (IPCC 2018) warn that
point being transgressed. Corals exist in a the majority of the world’s coral reefs would
fairly narrow band of water temperature and be eliminated by a 1.5°C temperature and
have thrived in the relatively stable climatic virtually all – more than 99% - would be
conditions of the Holocene, the 11,700-year eliminated by a 2°C rise. The band of global
epoch up to about 1950. Since then, surface average temperature rise between 1°C and
ocean temperatures have risen steadily 2°C above pre-industrial thus represents
towards the upper limit within which corals a tipping point for coral reefs, with the
can thrive. There were virtually no bleaching precise temperature depending on the
events up until the 1990s, when the Great local conditions of the reef and short-term
Barrier Reef (GBR) suffered significant climate variability. Given the approximately
bleaching in 1998 and 2002 (Hughes et al. 10,000-year history of coral reefs in the
2018). This was a warning sign that coral Holocene, a 50-year period (2000-2050)
reefs were approaching their tolerable and a narrow temperature window (1°C-2°C
temperature limit. above pre-industrial) represent a very sharp
tipping point.
Not surprisingly, even more severe bleaching
followed as temperatures continued to Bleaching of coral reefs would be largely
rise. As described earlier, extensive and irreversible in human timeframes given
damaging mass bleaching events occurred that global average temperature will remain
on the GBR in 2016 and 2017, and these were at elevated levels for centuries even after
followed by another such event in March we finally eliminate human emissions of
2020. The latest event was the first time greenhouse gases (Collins et al. 2013).
that significant bleaching occurred along
the entire 2,300-km length of the GBR.
The result of these increasingly frequent
and severe bleaching events was the loss
of about half of all hard corals on the GBR.
When the critical temperature was breached,
the corals did not just suffer a proportional
increase in bleaching but suffered mass
bleaching, typical of tipping point/abrupt
change behaviour.CHAPTER 03 24
ABRUPT, NONLINEAR EXTREME EVENTS
3.2 2019-20 bushfire season
(See also 2.4 Fire). The massive bushfires about 21% of the entire area of the biome
that burned much of eastern Australia when typically, about 2-3 percent of
during the 2019-20 summer are another these forests burn in a season. This
example of an extreme event that can be extreme event clearly shows abrupt
explained by tipping point behaviour. and unprecedented change behaviour,
Figure 10 below shows the annual burned and the analysis of the antecedent
area of various forest types. climatic conditions strongly supports
the conclusion that a tipping point
For Australian temperate broad-leafed had been crossed. In fact, Boer et al.
and mixed forests, which cover about (2020) describe the highly nonlinear
27 million hectares in eastern Australia, relationship between fires and
the 2019-20 fires were unprecedented, antecedent climate conditions as an
both for Australia and globally. The fires ‘on-off’ switch, another description of
burned about 5.8 million hectares or tipping point-abrupt change behaviour.
In the 2019-20 bushfires,
a tipping point was
likely crossed, with the
burning of one fifth of
Australia’s temperate
broad-leafed forests.25 HITTING HOME:
THE COMPOUNDING COSTS OF CLIMATE INACTION
Figure 10: Annual burned area percentages for continental forest biomes (2000-2019). Source: Boer et al. 2020.
The boxes represent the 25th to 75th percentiles, with the line in the middle the median. The vertical lines extend to 1.5 times
this middle 50%, and the dots are outliers. The numbers connote different biome types from a classification scheme used
by WWF: 1. tropical and subtropical moist broadleaf forests | 2. tropical and subtropical dry broadleaf forests | 3. tropical and
subtropical coniferous forests | 4. temperate broadleaf and mixed forests | 5. temperate conifer forests | 6. boreal forests/
taiga | 12. Mediterranean forests, woodlands and scrub. The red horizontal line indicates the area of Australia’s temperate
broadleaf and mixed forest that burned in 2019-20.
ANNUAL BURNED AREA PERCENTAGES FOR CONTINENTAL FOREST BIOMES (2000-2019)
Australia Asia Europe N America S America Africa Oceania
20
15
Burned area (%)
10
5
0
1 2 3 4 5 6 12 1 2 3 4 5 6 12 1 2 3 4 5 6 12 1 2 3 4 5 6 12 1 2 3 4 5 6 12 1 2 3 4 5 6 12 1 2 3 4 5 6 12
Biome
1 2 3 4 5 6 12CHAPTER 03 26
ABRUPT, NONLINEAR EXTREME EVENTS
Figure 11 below shows the other factor in the fell to -2 standard deviations. However,
bushfire tipping point - the changes in forest over the past few years, the area of forest in
conditions for the 20 years leading up to the a critically dry fuel state has risen rapidly,
2019-20 bushfire disaster. Up until 2017 the breaching the +2 standard deviations from
area of forest in a critically dry condition the mean in 2019. This can be interpreted
- caused by a combination of low rainfall as the crossing of a critical tipping point in
and high temperature – remained within 2019 in terms of extreme fire conditions,
+/- one standard deviation of the average resulting in very violent fires and a massive
state (30-year mean) and only occasionally area burnt.
Figure 11: Forest area in critically dry fuel state, eastern Australia (1990-2019). Source: Boer et al. (2020).
FOREST AREA IN CRITICALLY DRY FUEL STATE, EASTERN AUSTRALIA (1990-2019)
7,000
Forest area in critically dry fuel state (Mha x days)
6,000
5,000
4,000
3,000
1990 1993 1996 1999 2002 2005 2008 2011 2014 2017 2020
Year27 HITTING HOME:
THE COMPOUNDING COSTS OF CLIMATE INACTION
4. The cost of inaction
– Where we are now
compared to ten
years ago
We are paying dearly for past inaction, Based on the momentum in the climate
not only in terms of the extreme system, primarily due to the massive amount
weather we’ve already experienced but of heat that is being stored in the ocean, and
also for the lost opportunity to prevent the fact that it is now impossible to achieve
much worse. what science said we should - net-zero
emissions within a decade - there is worse
to come. Figure 12 shows the temperature
trajectories for the four IPCC emission
scenarios, from RCP2.6 (the lowest) to RCP8.5
(the highest) from 2005 to 2100. There is
very little difference in the temperature
trajectories to at least 2025 and no trajectory
We are paying dearly begins to flatten until 2040-2050. As stated
in the IPCC report: “Temperature increases
for past inaction, not are almost the same for all the RCP scenarios
during the first two decades after 2005”
only in terms of the (Collins et al. 2013).
extreme weather we’re Emissions have continued to climb through
the 2010-2019 decade. Based on the range
experiencing but also of emission scenarios beginning from 2020
onwards, we cannot expect a significant
for the lost opportunity difference in the rise in global average
temperature until at least 2040. This implies
to prevent worse. that worsening extreme weather is locked in
for the next decade at least, and very likely
until 2040. Looking backwards, the extreme
weather we will experience in 2030 was
locked in by 2010 regardless of the emission
trajectory we followed over the past decade
(Collins et al.2013).CHAPTER 04 28
THE COST OF INACTION – WHERE WE ARE NOW COMPARED TO TEN YEARS AGO
The message from this analysis is clear:
climate inaction is costly us dearly. Such
inaction is critical because it significantly
reduces our chances of staying under the
Paris temperature targets and it pushes
back the likely time when the climate is
eventually stabilised, now around mid-
century at the earliest.
Figure 12: Projected temperature rises to 2100 based on four emission scenarios analysed in the IPCC Fifth Assessment
Report. Key: Dark blue: RCP2.6; light blue: RCP4.5; orange: RCP6.0; red: RCP8.5. Source: Collins et al. (2013).
PROJECTED TEMPERATURE RISES TO 2100 BASED ON FOUR EMISSION
SCENARIOS ANALYSED IN THE IPCC FIFTH ASSESSMENT REPORT
6.0
4.0
(°C)
2.0
0.0
-2.0
1900 1950 2000 2050 2100
Year
Model mean global mean temperature change for high emission scenario RCP8.5
Model mean global mean temperature change for low emission scenario RCP2.629 HITTING HOME:
THE COMPOUNDING COSTS OF CLIMATE INACTION
Australians are paying the price for
countries ‘including Australia’ not cutting
emissions fast enough, or deep enough.
In 2011, the newly formed Climate emissions at a maximum rate of 3.7% per
Commission (the forerunner of the Climate year and avoid the worst climate impacts.
Council) published its first Critical Decade Climate inaction has delayed that peak for at
report, looking ahead towards 2020. A key least a decade and now requires a maximum
feature of that report – and one that gave it the 9% emissions reduction per year as well
title – was the analysis of emissions trajectories as reaching net zero emissions no later
that were required to have a 67% probability of than 2040. Even doing that will only keep
staying under a 2°C target (Figure 13). temperatures under 2°C, not the lower and
safer 1.5°C Paris target.
Two startling things stand out. First, we
clearly knew back in 2011 how important Second, note the magnitude of the emissions
the peaking date of our emission trajectory assumed in the three trajectories of Figure
was as well as the level of emissions at that 13. It was assumed that by 2020, emissions
peak. Had our emissions peaked back in would have peaked well under 40 Gt CO2 ,
2011, we would have been able to reduce our possibly around 37 Gt CO2 , and fallen
thereafter. In reality, global emissions were
ns (contin ue d) just under 43 Gt CO2 in 2019 (Friedlingstein
sion reductio
of th e sc ience for emis et al. 2019), significantly higher than
plications
Chapter 3: Im the value assumed in the 2009 analysis
described in Figure 13. This is important
because Figure 13 is based on a carbon
Figure 13: From the 2011 Climate Commission ‘Critical frowhich -term
m a longcumulative
budget approach,n be takenin
Decade’ report. us , inve st m ent decisions ca dg et is m os t
bu key indicator. So, peaking
Th emissions are itedthe
es based on owing that a lim that
e em is si on trajectori ility perspective, kn vest in ne infrastructure
w of
Figure 37. Th
re a 67% pr ob ab ly al loca at
te datohigher
in rate emissions
by m id entury, that the
-cmeans
ap pr oa ch and giving efficient
ve ry low or no emissions
the budg et er s s aimed at curves must
e 2 °C guardrai
l. eventually deliv subsequent sh
emission
orter-term mea
surereduction
th in
of m ee ti ng
rather than to in ve st
be even steeper. s less effective
that are perhap
terim target
duction rate
Maximum re meeting an in sion reductions
.
20 20 3.7 % pe r year
de liv er in g longer-term emis
40 Peak year
5.3% per year
in et
enting the budg
35 2015
9.0% per year
gg es t ch al lenge to implem al
Perhaps the bi individu
obal budget to
locating the gl
Gt CO2
30 2011
approach is al beco m e im po rtant. This
tries , w he re equity issues tion, whereas the
25 coun
an a sc ientific ques science.
ions
th er th
is a political ra related to the
20 dg et is more directly , but also
Global emiss
ob al bu oa ch
overall gl budget appr
15
pr ob le m is no t unique to the an d- tim et ab les
The un der the targets-
tia tio ns di fficult
10 bedevils nego e single most
an d ha s pe rhaps been th ag reem en t
5 approach international
e to reso lv e to achieve an
issu n plan.
2030 2035 20
40 2045 2050 ission reductio
10 20 15 2020 2025 on a global em
20 05 20
ological
fossil and bi
hip between
3.3 Relations take
(2009). sions and up
Source: WBGU carbon emis from
itters of CO2
bu dg et ap pr oach and the on “o ff se ts ”, in which em r em is si on
Carb ei
n between the s approach is
clear mbustion ca
n meet th
The connectio d tim et ab le fo ss il fu el co an eq ui va lent
targets an on a nation’s buying
more familiar blished based ligations by systems,
re d trajector y is esta ith in the reduction ob ta ke by ecological
once a de si ct or y to st ay w of ca rb on up in g rapid
je ou nt ev
on budget. The tra
a specific am as a way of achi
over al l ca rb targ et s w ith in
are often pr op os ed er, although
sets a series of t cost. Howev
get, in effect, e flexibility is uctions at leas cYou can also read