Assessing connectivity in South Australia's Marine Parks Network
←
→
Page content transcription
If your browser does not render page correctly, please read the page content below
The University of Adelaide

       Assessing
       connectivity in
       South Australia’s
       Marine Parks
       Network
       Report prepared for the Department of Environment Water and
       Natural Resources

Dr Alice Jones, Prof. Michelle Waycott, Dr Simon Bryars, Alison Wright &
Prof. Bronwyn Gillanders
University of Adelaide & DEWNR
21st March 2018F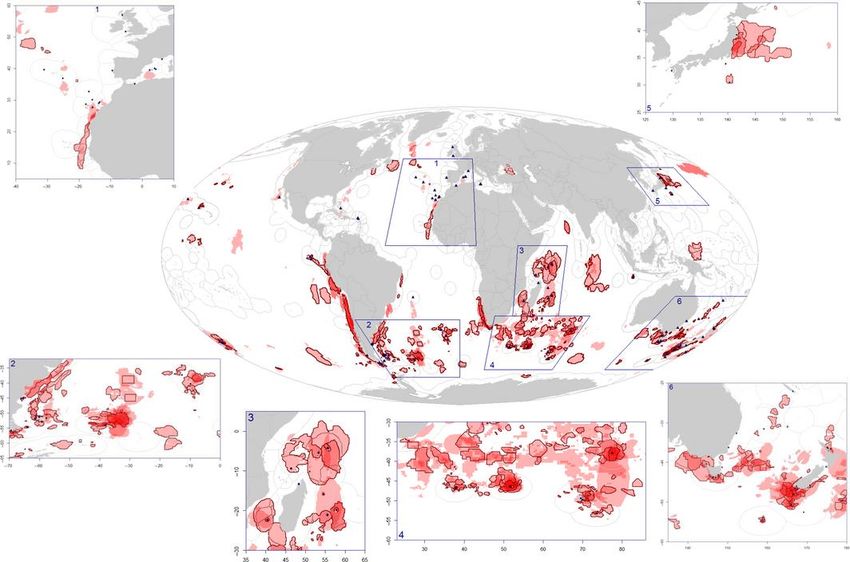
SA Marine Parks Network – connectivity review

Table of Contents

    1. Executive summary ............................................................................................. 2

    2. Introduction ........................................................................................................ 3
        2.1. Connectivity............................................................................................................. 3
        2.2. The South Australian marine parks........................................................................... 5
        2.3. Need........................................................................................................................ 6
        2.4. Objectives and scope ............................................................................................... 8

    3. Review of current knowledge.............................................................................. 9
        3.1. Overview ................................................................................................................. 9
        3.2. Literature review ................................................................................................... 12

    4. Summary, knowledge gaps and recommendations ........................................... 36
        4.1. Summary of the exisiting literature ........................................................................ 36
        4.2. Key knowledge gaps............................................................................................... 42
        4.3. Recommendations for future research ................................................................... 44

    5. References ......................................................................................................... 53

    Assessing connectivity in South Australia’s Marine Parks Network, v. 3.                                                        Page 1 of 61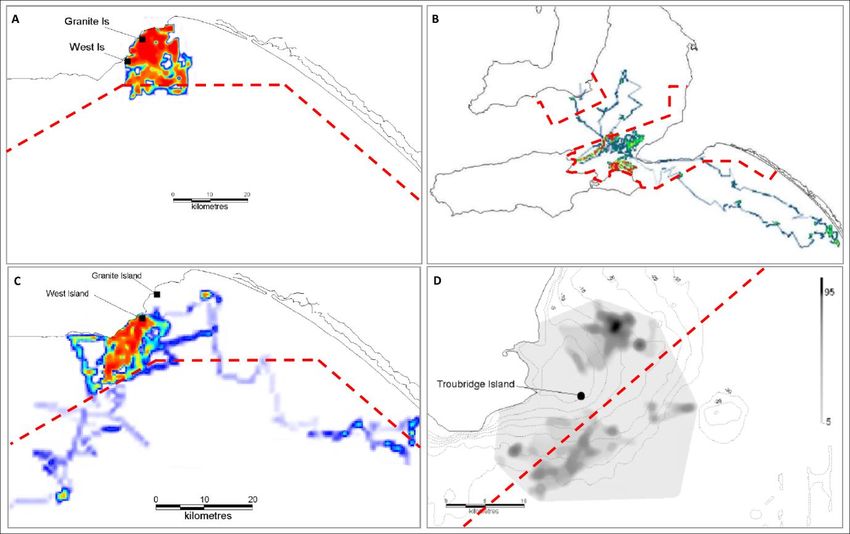
SA Marine Parks Network – connectivity review

1. Executive summary

This report and the associated literature database reviews existing studies relating to connectivity of
marine species and habitats within South Australian waters. It was undertaken in response to a need
for information to support an assessment of the adequacy and effectiveness of the South Australian
state marine parks network. We found 131 studies that contained information of some relevance to
aspects of connectivity in South Australian waters, however only six of these were specifically focussed
on marine parks, and those that were focused on single species within single marine parks. This lack
of focussed, broad coverage studies of connectivity and population structure across the marine parks
network limits the utility of the available data for assessing questions of connectivity specifically
related to the network.

In summarising the available literature, we have found data on 47 species relevant to the assessment
of connectivity across the South Australian marine parks network. The majority of studies were on
bony fish (teleost) and invertebrate species with commercial or recreational fishing value. There was
a notable lack of studies on habitat forming species such as mangroves, seagrasses and macroalgae.
There were only two multi-species studies, and few that combined multiple approaches in an
integrated way (i.e. combining genetic, otolith, morphological, growth and/or bio-physical data);
which is increasingly recommended in the broader literature on connectivity.

Based on our findings we have identified key knowledge gaps around the distribution of habitats,
species life-history data (particularly for non-fished species) and an issue of scale mismatch; in that
most studies either have broad coverage but poor spatial and temporal resolution, or have high
resolution but over very limited spatial scales. In order to undertake a robust assessment of the
connectivity of populations and habitats throughout the SA marine parks network, studies will need
to be focussed at the scale of the network, but have high resolution. Such studies could provide
specific information about connections within and between parks, across the entire network. As such,
we have made recommendations that future work be multidisciplinary and combine broad scale (well-
resolved) bio-physical modelling approaches with genetic and tracking (telemetry and bio-markers)
data to simulate validated, whole-of-network connectivity patterns. These types of assessments are
complex, and it is not feasible that they be undertaken for all species, therefore some prioritisation
and generalisation will be required in order to highlight key species, or life-history ‘types’ to focus
future work on.

Assessing connectivity in South Australia’s Marine Parks Network, v. 3.                  Page 2 of 61
SA Marine Parks Network – connectivity review

2. Introduction

2.1. Connectivity

The movement of individual organisms has a strong influence on their species’ population structure
and dynamics. The term ‘connectivity’ can refer to the extent to which populations of the same
species in different areas are linked by exchanges of individuals (Palumbi 2003). It can also refer to
the movement of individuals or materials (e.g. organic matter) between areas of the same or different
habitats (Olds et al. 2012). In the context of marine parks, sites can be viewed as connected if
organisms move between them; if they are used by different life stages of the same species; or if
materials (e.g. sources of carbon) that support the food web are moved between them (DEH 2008). A
network of marine protected areas should therefore aim to maximise connectivity between
designated sites to support ecological function and productivity (Palumbi 2003).

Populations of marine organisms are generally structured such that separate sub-populations are
connected to each other through exchange of individuals to create a meta-population (Cowen et al.
2009; Calò et al. 2013). The level of connectivity between sub-populations defines the overall meta-
population structure for a species within a given region. This structure affects many critical processes
such as population dynamics (including the persistence of populations), local adaptation and resilience
to disturbance or exploitation. As a result, connectivity between populations also has implications for
the maintenance of biodiversity, community structure and ecosystem function, and is thus integral to
the success of management measures such as marine protected areas (Palumbi 2003; Cowen et al.
2007).

For the purposes of this review, when we refer to connectivity of populations, we focus predominantly
on demographic connectivity, which is the effect of dispersal processes on population growth, vital
rates and the persistence of populations of marine species (Lowe et al. 2010). Genetic connectivity
can also be important and is defined by Lowe et al. (2010) as “the degree to which gene flow affects
evolutionary processes within populations”. Whilst genetic connectivity is important, it can be
misleading if not properly presented or understood. For example, individuals from one population
may supply enough migrants to another population to prevent significant genetic divergence (i.e. the
two populations would be genetically connected); however, the levels of migration may not influence
population persistence and therefore are not demographically relevant (Palumbi 2003; Lowe et al.
2010).

Assessing connectivity in South Australia’s Marine Parks Network, v. 3.                 Page 3 of 61
SA Marine Parks Network – connectivity review

Marine species populations have historically been considered demographically ‘open’ (i.e. highly
connected) due to many of them having a pelagic and broadly dispersive early life history stage and a
relatively sedentary adult life stage (for example most fish, invertebrates and macroalgae (Cowen et
al. 2007). However, research over recent decades has demonstrated great variability and
unpredictability in the structure of marine species’ populations. This structuring is due in a large part
to biological traits (such as life history, dispersal capacity, habitat associations etc.) and oceanographic
processes, which both influence connectivity between sub-populations over a variety of scales
(Palumbi 2003; Palumbi 2004).

Connectivity of habitats may refer to connections between patches of habitat used by individuals (e.g.
availability of key foraging habitats for mobile species (Grüss et al. 2011; Babcock et al. 2012);
connections between areas of different habitats required during different life stages of a species
(Gillanders et al. 2003; Nagelkerken et al. 2015; Weeks 2017); or connections between different types
of habitat through trophic transfer (the movement of carbon or other nutrients between different
habitats (Heck et al. 2008; Hyndes et al. 2014). Connectivity between habitats is affected by proximity
and fragmentation/isolation of patches. The connectivity of fragmented landscapes is theoretically a
function of distance between patches of suitable habitat and the characteristics of the habitat through
which individuals/material moves between patches (the ‘matrix’). However, the effect of the matrix
in marine systems includes both the habitat type and the physical water column properties
(temperature, salinity, depth, hydrodynamics), which may assist or hinder the movement of
individuals and materials. The connectivity of habitats is directly linked to demographic connectivity
processes because dispersal and successful settlement of individuals (and subsequent reproduction
or assimilation into the food web) will depend on the availability and accessibility of habitats and
potentially the matrix that separates habitat patches.

Assessing connectivity in South Australia’s Marine Parks Network, v. 3.                     Page 4 of 61
SA Marine Parks Network – connectivity review

2.2. The South Australian marine parks network

South Australian state waters are divided into eight marine bioregions, within which the Government
of South Australia has developed the South Australian Representative System of 19 Marine Protected
Areas (SARSMPA), which is part of the broader National Representative System of Marine Protected
Areas (NRSMPA; Figure 1). The SA network was based on seven biophysical design principles, which
include ensuring continuance of natural processes that are characteristic of the State’s marine
bioregions (DEH 2008) and, where possible, ensuring that connectivity was considered in a theoretical
and/or surrogate manner, taking into consideration objectives such as linkages between habitats and
bioregional zoning (DEH 2008).

The SA marine parks network covers an area of 26,655 km2 (44 %) of State waters and 267 km2 of
coastal lands and islands (DEH 2008; Bryars et al. 2017a). The marine parks are multiple-use and have
different levels of zoning throughout, which afford varying levels of protection and limits on the
activities allowed inside each zone. The zones range from General Managed Use Zones (GMUZ, the
lowest level of restriction, covering 30 % of the network area) through to Habitat Protection Zones
(HPZ; 56 % of the total area), Sanctuary Zones (SZ; 5 % of the total area) and Restricted Access Zones
(RAZ, the highest level of restriction, covering 1 % of the total area). In addition, there are different
types of Special Purpose Area (SPA), which allow selected activities (such as shore-based recreational
line fishing, transhipment, or harbour activities) that would otherwise be restricted as a consequence
of the zoning (Bryars et al. 2017a; Bryars et al. 2017b).

Assessing connectivity in South Australia’s Marine Parks Network, v. 3.                  Page 5 of 61
SA Marine Parks Network – connectivity review

Figure 1 from Bryars et al. (2017b): Map of the bioregions and the outer boundaries of South
Australia’s network of marine parks.

2.3. Need

Assessing the spatial structure and dynamics of marine species populations, as well as seascape
connectivity (connections between different types of habitats) is critical to assessing the effectiveness
of the South Australian Representative System of Marine Protected Areas (SARSMPA). The Marine
Parks Act 2007 requires that “the Minister must review a management plan at least once in every 10
years”. DEWNR are the responsible authority required to undertake this assessment, which must be
completed within 10-years of the proclamation of the marine parks (i.e. by 2022).

The biological effectiveness of the marine parks network will be assessed by DEWNR using a range of
indicators and measures including the marine parks design principles of: Comprehensiveness,
Adequacy and Representativeness (CAR) (DEH 2008; Bryars et al. 2017b). To achieve
comprehensiveness, the network of marine parks should have comprehensive coverage of the full
range of ecosystems and habitats that are characteristic of South Australia’s marine environment.
Therefore, for comprehensiveness to be attained, each marine park should establish or improve the
coverage of the full range of ecosystems and habitats occurring within each bioregion.

Assessing connectivity in South Australia’s Marine Parks Network, v. 3.                  Page 6 of 61
SA Marine Parks Network – connectivity review

For the network of marine parks to be representative, it must reflect the biodiversity and variability
naturally present in our marine environment. As there is still much to learn about the biodiversity of
the marine environment, the ecosystems and habitat types that characterise the marine environment
are included as a substitute or ‘surrogate’ for biodiversity. To achieve representativeness, the marine
parks network was designed to include large, uniform areas of each of the ecosystems and habitats
that are typically found in each bioregion (and their borders). By incorporating multiple marine parks
within each bioregion, altogether the marine parks network should reflect and encapsulate the
environmental variability within each bioregion. In turn, by developing marine parks within and across
each bioregion the network of marine parks should represent the biodiversity and variability across
the state.

For the marine parks network to be adequate, it should provide for the maintenance of the ecological
viability and integrity of populations, species and communities. To create an adequate network of
marine parks, selected areas must ensure the continuance of natural processes that are characteristic
of the bioregion they are representing, which is inherently dependent on connectivity. For a marine
park network to achieve adequacy, whole areas of representative habitats need to be encapsulated
within marine park boundaries. Two of the main factors contributing to adequacy for marine park
design are the size of marine parks and the connectivity within and between bioregions, parks and
zones.

Connectivity is critical to safeguarding the integrity of ecological processes and viability, thus
sustaining populations and habitats. As such ‘connectivity and linkages’ were also specifically noted
as a biophysical design principle for the SARSMPA and the NRSMPA (DEH 2008) and will be an essential
part of achieving its primary objective to “protect and conserve biological diversity and marine
habitats……. and to assist in the maintenance of the ecological viability and integrity of populations,
species and communities” (DEH 2008; Bryars et al. 2017b). Currently our limited understanding of
connectivity throughout the SA marine parks network impacts on DEWNR’s ability to monitor and
assess whether the network adequately provides for the connectivity and linkages underpinning viable
populations and biodiversity from broad (national, state and bioregional) to fine (sanctuary zone)
scales. This has been highlighted as an area where a review of existing literature and
recommendations for targeted research would be valuable to support the CAR assessment of the
network (Bryars et al. 2017b).

This report describes a desktop review, which assessed the current state of knowledge and highlights
knowledge gaps around connectivity in the SARSMPA. We also summarise some of the potential

Assessing connectivity in South Australia’s Marine Parks Network, v. 3.                 Page 7 of 61
SA Marine Parks Network – connectivity review

methods that can be employed to assess marine parks connectivity in the future. The report can be
used by DEWNR to help focus marine parks research to fill key gaps in knowledge and prevent
duplication of existing research. This will enable a more effective assessment of the network’s overall
adequacy into the future.

2.4. Objectives and scope

The objectives of this work were threefold:

     1) To collate available information on connectivity that is relevant to the SA Marine Parks
          Program and deliver this information in the form of a database (in Excel), with PDF copies of
          all documents (and if relevant hyperlinks to online sources of information or data).
     2) To prepare a section that summarises the current state of knowledge around connectivity,
          which may aid with DEWNR’s assessment of the adequacy of the marine parks.
     3) Based on the current state of knowledge, to focus the scope of future DEWNR-funded
          research and prevent duplication of previous studies in future DEWNR-funded research
          projects. This will be done by highlighting key knowledge gaps and making recommendations
          for addressing these using current best-practice methods for assessing connectivity of marine
          park networks.

Assessing connectivity in South Australia’s Marine Parks Network, v. 3.                  Page 8 of 61
SA Marine Parks Network – connectivity review

3. Review of current knowledge

3.1. Overview

Through a comprehensive literature review, we have collated and synthesised 131 research papers,
reports and theses containing information on 47 different marine species relevant to the assessment
of connectivity across the South Australian Marine Parks Network (Table 1). The majority of studies
were on bony fish (teleost) species (n = 43) with most of these studies being on commercial or
recreational fishing value. Invertebrates (n = 26) and marine mammals (n = 17) were also relatively
well represented groups, with a paucity of studies on macroalgae (n = 6) and multi-species
assessments (n = 2). Survey methods (e.g. observations, fisheries catch data and tag-recapture) were
the most commonly employed approach used in the reviewed studies (n = 46), followed by genetic
assessments (n = 37). There were 16 studies that combined multiple approaches, such as using both
bio-markers and acoustic telemetry (e.g. Fowler 2016 on snapper), or satellite telemetry and genetics
(e.g. Rogers et al. 2015a on shortfin mako). One study, by Izzo et al. (2017), integrated genetic, otolith,
morphological, growth and fishery data from a 60-year long dataset to determine population structure
for the Australian sardine throughout Australian waters. Another recent study by McLeay et al. (2016)
in Spencer Gulf coupled a biophysical model with fisheries data on western king prawn catch rates (i.e.
relative abundances) and reproductive output to generate spatially resolved model estimates of the
sources and sinks of larval recruitment.

Most of the studies we reviewed were not specifically focussed on the marine parks network and not
all of them were equally informative. We discovered only six studies that were undertaken within SA
marine parks, and just one of these which looked at multiple species (Edgar et al. 2009; Bryars et al.
2012; Rogers et al. 2014a; Teske et al. 2015; Bryars et al. 2016; Rogers et al. 2016). As a result, many
studies were not ideal for the purposes of assessing marine parks connectivity. However, it has been
possible to extract useful information from most studies, which demonstrates the possibility of
applying research undertaken with a different primary focus to the marine parks connectivity
question.

The following review is a summary of the main findings related to connectivity for each species based
on the literature we have collated. Not all papers contained in the excel database are referred to in
the text (for example if they did not contribute anything in addition to the references cited). There is
also a high likelihood that there are unpublished studies and datasets being held by SA (and other)
research, Government and management bodies, which we have not been able to include. Over 40 %

Assessing connectivity in South Australia’s Marine Parks Network, v. 3.                    Page 9 of 61
SA Marine Parks Network – connectivity review

of the studies in our database have been published in or after 2013. This shows that marine species
population structuring and connectivity are popular research areas and relevant studies are likely to
continue to become available in the near future.

Assessing connectivity in South Australia’s Marine Parks Network, v. 3.                  Page 10 of 61
SA Marine Parks Network – connectivity review

Table 1: Summary of the literature reviewed, detailing the number of studies collated, split by the methodological approach used and the type of organism
studied. ‘Genetic’ approaches included mitochondrial DNA, microsatellite DNA, and allozymes. ‘Modelling’ approaches are those that incorporated some
aspect of biophysical, oceanographic or larval transport modelling. Note that some studies used multiple approaches and were therefore included in the
count for all methods that were relevant (meaning the sum of the method column sub-totals is greater than the overall number of studies). The full database
of all relevant studies is provided in the excel file associated with this review document (‘Connectivity_database_v1.xlsx’, sheet name ‘Literature_database’).

                                                                                                Methodology used
                          Total
                         number          Tracking            Biomarkers (otolith,                    Lab-based            Modelling
 Type of organism                                                                                                                        Survey/observations/
                            of        (satellite/GPS/         chemistry, stable     Genetics   experiments/controlled     (dispersal/                           Review
                         studies                                                                                                             tag-recapture
                                       acoustic tags)      isotopes/morphology)                    manipulation         hydrodynamics)

 Seagrass                   12                                            1            4                 4                                        4               1
 Macroalgae                  6                                                         4                 1                    2                   1
 Marine mammal              17                2                                        9                                      1                   6               1
 Elasmobranch               12                7                           1            4                                                          3
 Teleost                    43                6                           18           7                                      5                  16               4
 Invertebrate               26                2                           1            7                 2                    6                  10               3
 Multispecies                2                                                                                                                    2
 Seabirds                   13                4                           1            2                                      1                   4               2
 Total                     131               21                           22          37                 7                   15                  46               11

Assessing connectivity in South Australia’s Marine Parks Network, v. 3.                                                                                    Page 11 of 61
SA Marine Parks Network – connectivity review 3.2. Literature review Habitat forming species (seagrass and macroalgae): Sinclair et al. (2016) built hydrodynamic models of seed dispersal for Posidonia australis, which indicate relatively high levels of demographic connectivity between meadows surrounding two SA sites (Nora Creina on the south-east coast and north-eastern Kangaroo Island). This local and regional scale connectivity is maintained by floating fruit that acts to disperse seeds (see Figure 2). These theoretical connectivity model outputs could be validated using genetic approaches, which would provide information on the successful settlement, colonisation and reproduction of dispersing individuals (for example see Kendrick et al. 2017). Figure 2 from Sinclair et al, (2016): Maps of Posidonia australis settlement probability based on hydrodynamic models of seed dispersal from two SA sites. Journal of Biogeography, 43, 2209–2222. © John Wiley and Sons Ltd, used under a creative commons license. Ticli (2015) carried out the first study of genetic diversity, structure and connectivity of Zostera muelleri seagrass populations across the species’ entire range in Australia. When looking across the whole range of the species, there was clear isolation by distance with populations from West, South and all of Eastern Australia showing genetic differences. Within South Australia isolation by distance was also detected. However, these finer-scale patterns were complex, with varying levels of genetic relatedness between sampled meadows in SA (Figure 3). The importance of the availability of suitable physical habitat for recruitment of the seagrass Amphibolis antarctica was studied by Irving et al. (2014), who deployed artificial substrate to aid recovery of seagrass meadows in Gulf St Vincent. They found that recruitment of seagrass seedlings to artificial habitat patches (in this case sand/rubble filled hessian bags) declined with distance from established ‘donor’ meadows. It was also influenced by the weave of the hessian bags, what the bags were filled with (i.e. the ‘substrate type’) and their spatial arrangement (single bags retained more Assessing connectivity in South Australia’s Marine Parks Network, v. 3. Page 12 of 61
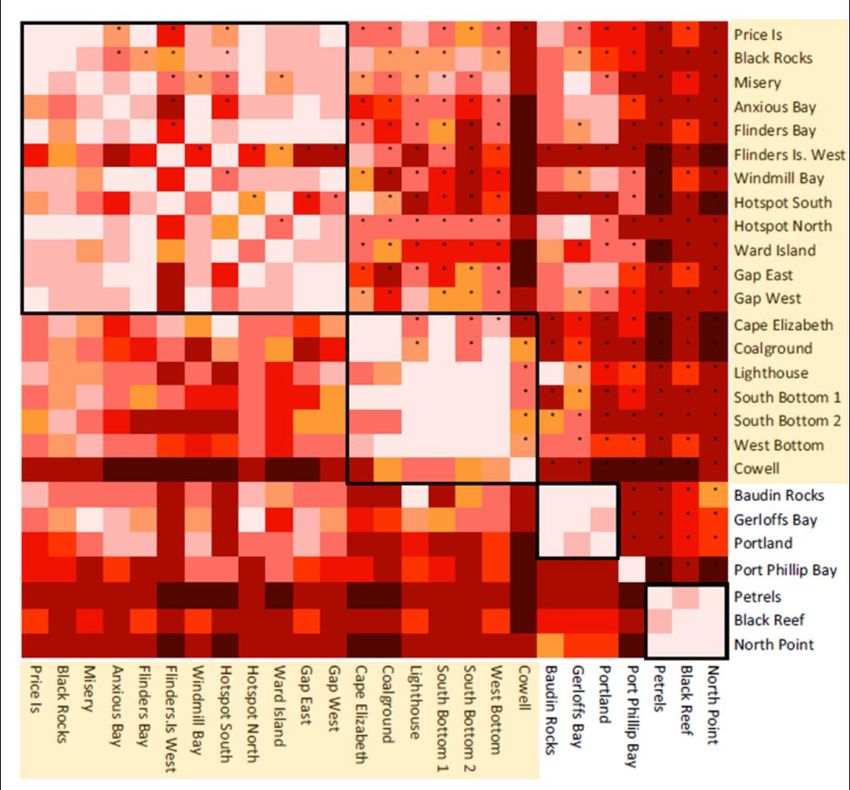
SA Marine Parks Network – connectivity review

seedlings than grouped bags) (Irving et al. 2014). Goodsell and Connell (2008) also found that the
distance between patches of fragmented habitats (kelp holdfasts) had a negative relationship with
connectivity. They also demonstrated an effect of the ‘matrix’ of habitats in between target habitat
patches, showing significant differences in the assemblages of invertebrates colonising kelp holdfasts
when there were different habitats in between them. Tanner (2006) found similar effects of matrix
habitats on the invertebrate assemblages in seagrass patches in SA waters. The inference from these
studies is that matrix habitat type influences successful movement, and thus connectivity between
seagrass habitat fragments. These findings warrant further investigation as they suggest that parks
containing patches of the same habitat type may need to be within a threshold distance of each other,
and have favourable matrix habitats between them in order to facilitate successful movement events.
However, the generality of these findings is uncertain, and the threshold distances between parks and
the suitability of the intervening habitat matrices will be organism specific.

Figure 3 from Ticli, (2015): Diagrams of connectivity estimates for Gulf St Vincent populations of
Zostera muelleri. Estimates are for number of migrants per generation (Nm) based on two different
measures of gene flow: 1) Rare alleles and 2) FST. Line weight is proportional to Nm with solid lines
showing estimated Nm > 0.5 (Rare) and >1.0 (FST). The relationships between Stansbury–Port Parham
and Port Wakefield–Sandy Point were statistically significant.

Assessing connectivity in South Australia’s Marine Parks Network, v. 3.               Page 13 of 61
SA Marine Parks Network – connectivity review

Coleman et al (2009) sampled kelp (Ecklonia radiata) at five populations in SA waters, ranging from
Streaky Bay in the west, to Robe in the East. They found high levels of genetic structuring between
populations at moderate (10s km) to large scales (100s km), with almost all sites being significantly
different from each other (Coleman et al. 2009), suggesting that there is low genetic connectivity
between them. Number of migrants per generation was estimated at ~ 1 across populations sampled
in SA, based on an FST value of 0.211 (Coleman et al. 2013). The amount of genetic differentiation
between pairs of populations was correlated with the geographic distance between them, despite the
existence of the Flinders Current which was expected to act as an aid to dispersal (Coleman et al. 2009;
Coleman et al. 2013). These results are likely to be reflective of the connectivity patterns between
kelp populations on rocky reef habitats within the SA Marine Parks Network (i.e. a model of isolation
by distance).

We have not found any literature on other key marine habitat forming species in SA, such as
mangroves and saltmarshes. In terms of movement of materials and connectivity through trophic
transfer, we have found one study in SA that demonstrates that animals living in both seagrass and
mudflats were reliant on seagrass-derived carbon sources for food (Connolly et al. 2005).

Teleosts:

Most studies on teleosts that are relevant to connectivity have focussed on the stock structure of
commercially important taxa (32 %), with comprehensive knowledge for a few of these species (see
detailed below). There are also some studies on iconic species, or species of conservation concern,
such as western blue groper (Bryars et al. 2012), harlequin fish (Bryars et al. 2016) and leafy sea dragon
(Stiller et al. 2017). However, these studies are focused on the highly philopatric adult life stages and
although these data are useful, they do not provide information on population connectivity (although
see below for a description of the genetic relatedness of leafy sea dragons across SA from Stiller et al.
2017).

Izzo et al. (2017) investigated population structure of the Australian sardine (Sardinops sagax) across
its entire Australian range using otolith structure and microchemistry. They found evidence of some
separation between regions across Australia, although sub-structure between neighbouring groups
was low, indicative of an overall meta-population throughout the entire species range. However,
there was enough separation over large geographic distances for the authors to suggest that the
species should be managed as four broad stocks: south western coast (off WA); Great Australian Bight
and Spencer Gulf; Bass Strait and Port Phillip Bay (off Victoria and Tasmania); and eastern Australia
(Izzo et al. 2017). At a finer scale, Izzo et al. (2012) also suggest some spatial structuring within the

Assessing connectivity in South Australia’s Marine Parks Network, v. 3.                  Page 14 of 61
SA Marine Parks Network – connectivity review

GAB. The overall outcome of this work indicates that population structuring of the Australian sardine
is complex and mixing between neighbouring populations can vary from year to year, but there is
unlikely to be significant separation between sub-populations within SA waters (Izzo et al. 2017).

King George whiting have been shown to separate spatially on the basis of age with distinct SA
spawning (offshore) and nursery areas (Gulfs) (Fowler et al. 2000; Fowler et al. 2003). These discrete
locations are connected by predominantly south-to-north advection of larvae into the Gulfs (Fowler
et al. 2000), followed by north-to-south movement of adults out of nursery areas into deeper waters
offshore where they reside and spawn (Fowler et al. 2003). Tag recapture studies and age-class
reconstructions using fisheries data inferred some level of east-west divergence, with Eyre and Yorke
Peninsulas proposed as barriers to dispersal/movement (Fowler et al. 2003; Fowler et al. 2011).
However, more recent genetic studies (using msatDNA and SNPs) show that genetic diversity does not
vary significantly between populations or regions across the entire southern Australian range of the
species. Although some distance-based differences in genetic similarity were detected at a large
spatial scale (e.g. between WA and SA/Vic), overall estimates of the number of migrants between
populations per generation were relatively high (11.146 ± 1.252), which suggests that genes are well
mixed (Jenkins et al. 2016), although this does not necessarily mean that sub-populations are
demographically connected. Current work being undertaken at SARDI and the University of Adelaide
is investigating the connectivity of populations in SA using otolith microstructure and chemistry, as
well as oceanographic modelling (as part of an FRDC-funded project).

Observational surveys and telemetry studies of the leafy sea dragon report a relatively small home
range and strong site-fidelity in SA waters (Connolly et al. 2002a; Connolly et al. 2002b), indicating
potential for demographically discrete sub-populations. This is supported by a recent genetic study
by Stiller et al. (2017) which indicates substructure based on significantly different allele frequencies
between many of the sampled bays in SA waters, with genetically distinct groups in Encounter Bay, on
both shores of Gulf St Vincent, and in Spencer Gulf. This fine-scale population structuring indicates a
high level of adult site-fidelity and self-recruitment in this charismatic species (Stiller et al. 2017),
which suggests that populations contained within marine parks should be well protected. This is
particularly the case for sanctuary and habitat protection zones, where the seagrass and rocky reef
habitats that the species lives within are relatively undisturbed by human activities.

The marine parks network, particularly the sanctuary zones around rocky reefs, are also likely to offer
significant benefits to other fish species with high site fidelity, which are threatened by human
activities such as fishing and habitat degradation. Examples include the southern blue devil, harlequin

Assessing connectivity in South Australia’s Marine Parks Network, v. 3.                  Page 15 of 61
SA Marine Parks Network – connectivity review

fish and western blue groper, which have been demonstrated to be strongly site attached and have
small adult home ranges (< 50 m, < 200 m and < 1.1km respectively) that could be fully encompassed
within marine park sanctuary zones (Bryars 2011; Bryars et al. 2012). Although it is known that these
species are broadcast spawners with pelagic larval phases (Coulson et al. 2009; Bryars 2013; French et
al. 2014), there are no data available regarding the details of larval dispersal (e.g. pelagic larval
duration, spatial dynamics of dispersal) or the genetic and demographic connectivity of these species;
so it is unclear how reliant they are on propagule dispersal or retention, or how well protected they
are by the marine parks network throughout earlier life stages. Shepherd and Brook (2007) found that
the habitat of juvenile and adult western blue groper did overlap, with both age classes being
dependent on subtidal rocky ecosystems. However, there was a transition along depth and exposure
gradients with juveniles found more commonly in shallower, sheltered locations; and adults dominant
on rocky reefs in deeper, exposed locations. This indicates that, at a minimum, rocky reefs in both
these settings need to be protected in marine parks in order to ensure protection of, and connectivity
between, potential juvenile and adult habitats. However, further research is required to demonstrate
the realised value of the existing marine parks network for the species. Examples of such studies
include larval dispersal modelling, tagging juveniles to elucidate movements to final settlement
habitats, and genetic connectivity studies between reef-attached sub-populations.

Combined genetic and natural tagging (otolith shape, structure and microchemistry) studies suggest
some east-west structuring of mulloway populations in SA, with a separation of the fish in the south-
east of the state (the Coorong estuary and surrounding coastal waters) from the far west of the state
(Barnes et al. 2014; Barnes 2015), supporting an earlier otolith study by Ferguson et al (2011) that
indicated some level of sub-structuring of populations within SA waters. There is limited evidence
that fish sampled from Gulf St Vincent may be grouped with the south-eastern sub-population, and
fish from the GAB region may be grouped with the western sub population (Barnes et al. 2014; Rogers
et al. 2014a); however, the spatial resolution of these studies was not able to effectively delineate
fine-scale structuring within SA waters and there appears to be occasional migration between these
sub-populations (Rogers et al. 2014a). Satellite telemetry studies of adult mulloway in the State’s Far
West Coast Marine Park suggested that this park may provide some protection for the mature fish of
this species for at least part of the year (Rogers et al. 2014a; Barnes 2015), however recreational
fishing from the shore of this marine park is allowed year-round in some areas of the park (outside
the sanctuary and restricted access zones), so the level of protection may be limited.

Early genetic studies of snapper indicated connectivity (i.e. no structuring) between eastern WA and
SA and no sub-structuring within SA waters (Donnellan et al. 1996). This result was supported by

Assessing connectivity in South Australia’s Marine Parks Network, v. 3.                  Page 16 of 61
SA Marine Parks Network – connectivity review

studies of adult movement using otolith chemistry, which suggested that fish sampled from along
2000km of the SA coast originated from only one or two nursery areas (and subsequently dispersed
throughout SA waters to become resident in new regions) (Fowler et al. 2005). However, more recent
work by Fowler et al (2016; 2017) showed regional differences in physical and chemical otolith
characteristics (size, shape, chemistry), as well as population-based demographic characteristics (size
at age, growth rates etc.) in different parts of SA. These results suggest that northern Gulf St Vincent
and northern Spencer Gulf may be self-sustaining populations that do not receive any recruits from
elsewhere, but are critical sources of recruits to many other regions in SA (Figure 4). The potential
isolation of these northern Gulf areas, in terms of emigration, suggests that sanctuary zones in these
regions could play an important role in protecting source populations whose export of recruits sustains
the broader meta-population within SA waters (Fowler 2016; Fowler et al. 2017).

Figure 4 from Fowler et al (2016): Map of population structure and connectivity between sub-
populations of snapper in coastal areas of eastern SA. Arrows show the direction of movement of
recruits (emigration) from the three main nursey areas in northern Gulf St Vincent, northern Spencer
Gulf and Port Phillip Bay in Victoria. © Fisheries Research and Development Corporation and South
Australian Research and Development Institute, reproduced under a creative commons license.

Southern sea garfish populations in SA were demonstrated to be genetically different from those in
Victoria, Tasmania and WA by Jones et al (2002). Further fine-scale spatial structuring was
demonstrated within SA waters using both otolith chemistry (Steer et al. 2009) and stable isotopes
(Steer et al. 2010). They showed that garfish in SA waters can be separated into 6 regional populations
with varying levels of mixing: Northern Gulf St Vincent, South West Gulf St Vincent, Kangaroo Island,
Northern Spencer Gulf, South West Spencer Gulf and the West Coast of Eyre Peninsula. In some
locations it was possible to separate sites that were < 60 km apart based on the chemical signatures
in the sampled fish otoliths (Steer et al. 2009).

Assessing connectivity in South Australia’s Marine Parks Network, v. 3.                 Page 17 of 61
SA Marine Parks Network – connectivity review

Elasmobranches:

Izzo et al (2016) used elemental analyses of bronze whaler shark vertebrae samples from Spencer Gulf
and Gulf St Vincent to look at fine scale population structuring, over long and short timescales, within
the sampled regions. They found some indication of small differences over short timescales (weeks
to months) between samples from Spencer Gulf and those from Gulf St Vincent and other sampled
regions. This suggests seasonal structuring, which may be related to pupping in Gulf waters (Izzo et
al. 2016). Huveneers et al (2010) demonstrated that 43 % of (predominantly juvenile) bronze whaler
and dusky sharks implanted with acoustic transmitters in northern Gulf St Vincent remained in the
same region for over a year. Rogers et al (2013) also note that SA gulf waters are likely to be a
significant habitat for juvenile dusky and bronze whaler sharks; they found that 75 % of those tagged
by recreational anglers in these areas were juvenile, and that > 50 % of these were recaptured within
50 km of their tagging location. These results indicate medium-term residency for juveniles of these
two species in Gulf waters. However, the elemental chemistry analysis of larger bronze whaler sharks
showed strong evidence of connectivity across SA regions over the sharks’ full lifetime (Izzo et al.,
2016). This is supported by long-term tag-recapture data and telemetry studies on adult dusky and
bronze whaler sharks, which report some long-distance movements within SA, as well as into to WA,
Victoria and Tasmania. (Goldsworthy et al. 2010; figures 5 & 6; Rogers et al. 2013). These studies
highlight the potential importance of Marine Parks sanctuary zones in Spencer Gulf and Gulf St Vincent
to young sharks of these two species (which are particularly vulnerable to overexploitation; Rogers et
al. 2013), as well as the connectivity between Gulf waters and offshore areas within and outside SA
(including connectivity through the NRSMPA).

Figure 5 from Huveneers et al. (2014): Maps of movements of tracked sharks from tag attachment
sites (black dots). Green dots (track) and orange dot (observation) = dusky (adult male). Red dot =
dusky (adult female). Blue dot = bronze whaler (adult female). © South Australian Research and
Development Institute, reproduced with permission.

Assessing connectivity in South Australia’s Marine Parks Network, v. 3.                 Page 18 of 61
SA Marine Parks Network – connectivity review

Figure 6 reproduced from Rogers P.J. et al. (2013) with permission from CSIRO publishing: Maps of
reconstructed ‘movements’ of tagged and recaptured bronze whaler and dusky sharks (1977 – 2008).
A) Regional scale movements of < 374 km within the Gulfs and GAB. B) Long-distance movements
from SA to WA, Vic and Tas. Filled arrow head represent capture locations of sharks recaptured < 5km
from the tag attachment sites.

School shark population structure was assessed at a broad-scale (global) level by Chabot et al. (2009)
who found genetic separation between the populations around each continent. The population in
Australian waters is genetically distinct from those in the waters around other Africa, North and South
America and Europe, probably because of very low levels of trans-continental migration (Chabot et al.
2009). This study did not report structure between Australian sampled populations (based on 50
samples from across Australia & New Zealand), although this finer-scale analysis was not a stated aim
of their research. Further research on school shark by Hernandez et al. (2015) found no population
structuring within southern Australia, or between there and New Zealand, indicating broad-scale
connectivity of populations across the Tasman Sea. Current PhD research at the University of Adelaide
is investigating the location of pupping grounds and possible natal and nursey areas for school shark
in SA waters using satellite tags and vertebrae chemistry (McMillian, unpublished data).

Juvenile shortfin mako sharks tracked from the Great Australian Bight showed an affinity for offshore
areas around the mid-outer shelf zone, therefore are predominantly found outside the State’s coastal
marine management area (but may potentially interact with offshore island Marine Parks and
Commonwealth Marine Parks in the NRSMPA) (Rogers et al. 2015b). Some tracked individuals also

Assessing connectivity in South Australia’s Marine Parks Network, v. 3.                Page 19 of 61
SA Marine Parks Network – connectivity review

moved over long distances into the Coral Sea and across the Indian Ocean, with the greatest distance
travelled being > 25,000 km (Rogers et al. 2015b). Mitochondrial and microsatellite DNA analyses on
shortfin mako sharks show a high level of connectivity across Australian management jurisdictions and
with South Africa and northern hemisphere populations (Rogers et al. 2015a). These combined results
indicate that this highly migratory species, along with many of the other large shark species found in
South Australian waters, will not be adequately protected by the state (or national) marine park
networks because of their long-distance movements, which take them outside SA (and even
Australian) waters. The picture is similar for blue shark; tracking data from 2015/16 demonstrate a
preference for offshore waters in oceanic zones >1000 m deep (eastern and central GAB, Bonney
upwelling and Tasman Sea) and long-distance movements, although some individuals did spend time
(up to 14 %) within the Great Australian Bight Commonwealth Marine Reserve (Rogers et al. 2016).
This indicates that ensuring the ongoing viability of these wide-ranging species is likely to be
dependent on the implementation of both national (i.e. NRSMPA) and international recommendations
around marine protected area network coverage. The IUCN’s recent global targets for “30% of each
marine habitat” to be set aside in “highly protected MPAs and other effective area-based conservation
measures” by 2030 will be helpful in ensuring this (IUCN 2016).

White sharks have been demonstrated to use areas within and around the Neptune Islands Marine
Park consistently, with acoustically tagged sharks showing residency periods of up to 10 days at a time
(Rogers et al. 2014b; Rogers 2016); however, individual sharks are not resident in the area year-round.
Five white sharks were tracked by (2016) from the Neptune Islands (a state Marine Park) and moved
distances of between 9 and 1,931 km from the tagging site, using both the deep continental shelf
slope and shallower habitats in northern Spencer Gulf. The use of shallow Gulf habitats at certain
times of year is supported by acoustic tagging studies on white sharks that report detections in north-
west and north-east Gulf St Vincent and Adelaide Metropolitan waters (Huveneers et al. 2014).
Unfortunately, these studies do not report whether the sharks spent time in the Gulf Marine Parks.
These results combine to suggest broad-scale connectivity of inshore and offshore habitats for this
species in SA, supported by broader-scale research that demonstrated no population structure for
white sharks within or between SA and WA (Blower et al. 2012). However, further detailed
information about the species’ movements and residency will be required to assess the adequacy of
the Marine Parks Network for their protection while they are in SA waters.

Assessing connectivity in South Australia’s Marine Parks Network, v. 3.                Page 20 of 61
SA Marine Parks Network – connectivity review

Seabirds:

Goldsworthy & Page (2010) report a general lack of data on crested tern distribution and population
structure/connectivity, with long term monitoring data only available (intermittently) from a single
study site in SA (Troubridge Island in Gulf St Vincent) and no information on demographic or genetic
connectivity . An earlier study of banded birds (from 18 colonies in SA) showed long-distance dispersal
from banding locations (>2000 km); however, this study relied on recoveries of sick and wrecked birds
which may have been carried some distance by currents (Waterman et al. 2003). Even so, it
demonstrates the wide at-sea distribution of birds from SA colonies (Figure 7) and highlights the need
for inter-annual tracking data that can elucidate habitat use of non-breeding birds and adults during
inter-breeding periods and dispersal behaviour of fledged juveniles from the colony during their pre-
breeding years. McLeay et al (2010) tracked adult crested tern movements during chick-rearing, when
they are central place foragers who must return to the colony to provision chicks. The typical foraging
trip was < 40km from the colony, although distances of up to 118 km were recorded. Figure 8 shows
the tracks from tagged birds (McLeay et al. 2010) and indicates that approximately half of the foraging
activity of the tracked birds during the breeding season falls within the Habitat Protection or General
Managed Use Zones of the Lower Yorke Peninsula Marine Park, however foraging trips in southerly or
easterly directions were not encompassed within the Marine Park boundaries.

  Figure 7 from Waterman et al. (2003): Locations of recoveries of dead or dying crested terns that
 were banded at Penguin Island in SA (indicated by a black star). Immature, one-year and two-year
 birds are shown by solid circles, and mature, three-year and older birds are shown by open circles.

Assessing connectivity in South Australia’s Marine Parks Network, v. 3.                Page 21 of 61
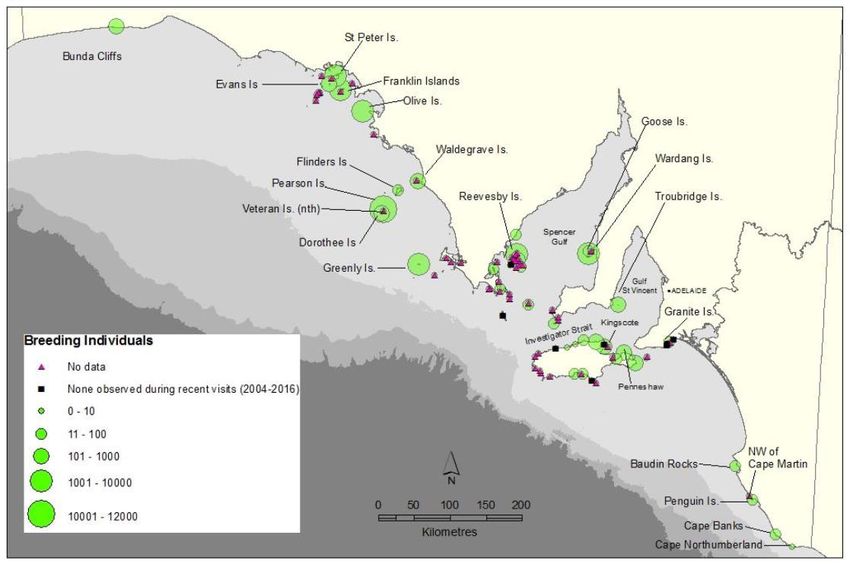
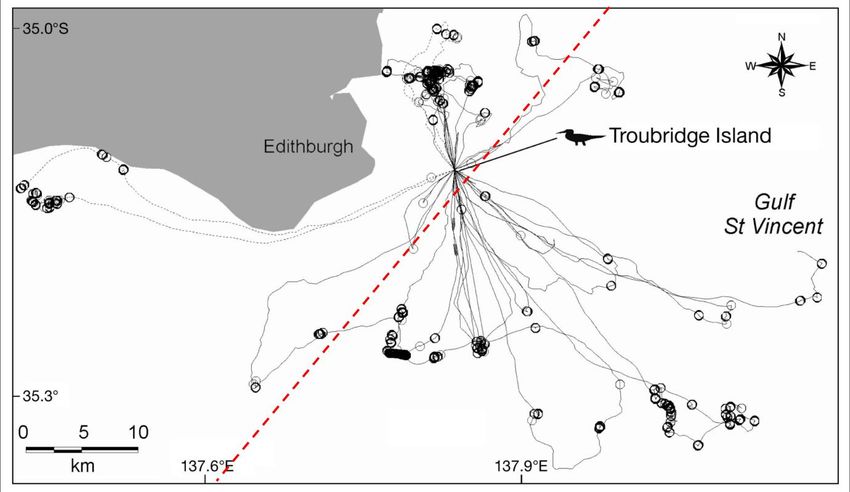
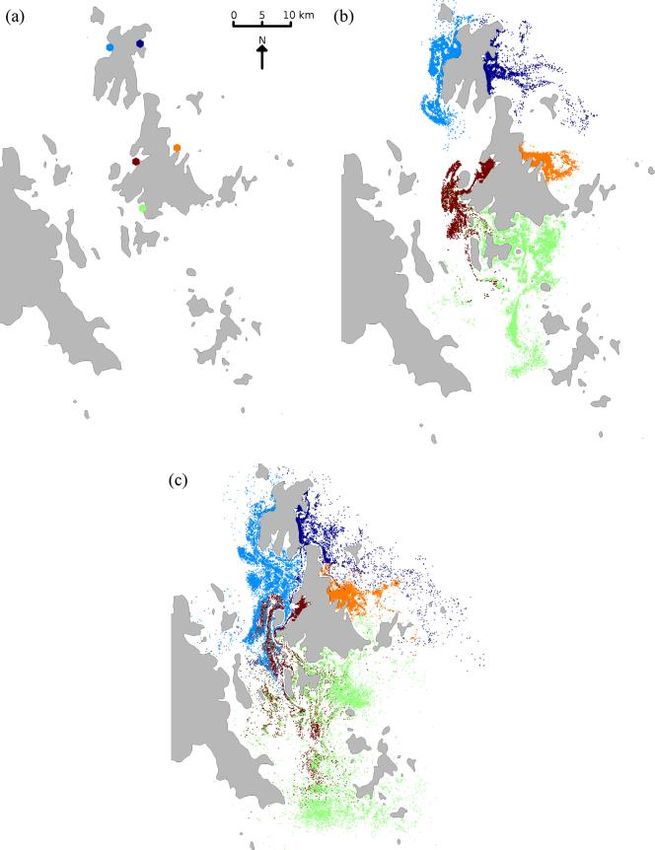
SA Marine Parks Network – connectivity review

Figure 8 adapted from McLeay (2009): Crested tern foraging trips from Troubridge Island colony,
tracked using GPS (N = 21 adult breeding birds). Circles indicate areas of concentrated foraging. Red
dashed line indicates the approximate location of the outer boundary of the Lower Yorke Peninsula
Marine Park (foraging areas inshore of this line are within the marine park Habitat Protection or
General Managed Use Zones).

There are approximately 100 little penguin colonies in SA (DEWNR, 2016), several of which have seen
severe population declines over recent years (Goldsworthy et al. 2010; Department for Environment
2016). Figure 9 shows the location of known colonies and indicates population sizes based on the
most recent estimates (some of which may be based on decades-old data) (Department for
Environment 2016).

Tracking of adult little penguins has been carried out from some breeding colonies: Granite Island (n
= 10), West Island (n = 8), Troubridge Island (n = 18), Pearson Island (n = 12), Olive Island (n = 12) and
Reevesby Island (n = 5) (Bool et al. 2007; Wiebkin 2012). This information alone is of limited use in
inferring population connectivity as it focusses on a single life stage during a limited temporal period.
However, these data can provide information on the level of protection afforded by the SA Marine
Parks Network to adult birds during the chick-rearing season (see examples in Figure 10). It should be
noted that currently only very small populations persist at the colonies on Granite and West Islands
and in Kingscote and Penneshaw (Department for Environment 2016), therefore the tracking data
from these colonies may no longer be relevant or representative.

Assessing connectivity in South Australia’s Marine Parks Network, v. 3.                   Page 22 of 61
SA Marine Parks Network – connectivity review

Figure 9 from DEWNR (2016): Distribution of little penguin colonies in SA with estimates of number of
breeding birds. Black squares show locations where penguins were recorded historically, but were
not observed in visits between 2004 and 2016. Population estimates are from the best-available data,
which have varying levels of reliability/uncertainty.

Figure 10 adapted from Bool et al (2007) and Wiebkin (2011): Density maps indicating the proportion
of time that tracked breeding adult little penguins spent foraging in the waters around their colonies.
A) Granite Island (n = 10); B) Kingscote and Penneshaw (n = 5); C) West Island (n = 8); and D)

Assessing connectivity in South Australia’s Marine Parks Network, v. 3.                Page 23 of 61
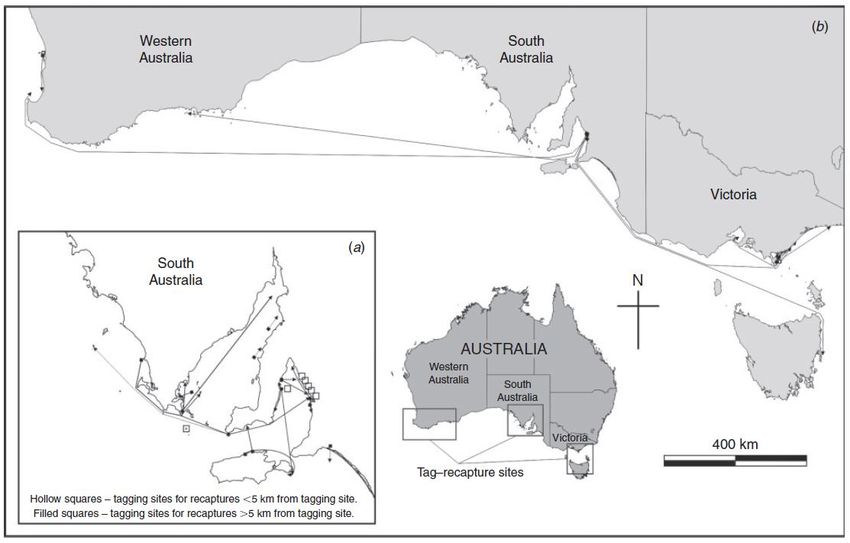
SA Marine Parks Network – connectivity review

Troubridge Island (n = 15). The red dashed lines show the approximate locations of the outer
boundaries of relevant SA Marine Parks. © South Australian Research and Development Institute,
reproduced with permission.

There is no evidence of phylogeographic structuring in Australian little penguin populations, which
infers a high level of historical relatedness between colonies (Peucker et al. 2009). A broad scale study
of the whole of south-eastern Australia provided evidence of some contemporary genetic
differentiation between SA populations and populations in other states (Overeem et al. 2008). At a
finer scale, only one population in SA (Troubridge Island) is genetically distinct from all others,
suggesting that there is some genetic connectivity between most South Australian colonies. However,
differences in morphological, behavioural and ecological traits indicate that natural selection due to
local environmental conditions (water temperature, water depth and prey availability) influences the
birds at each colony (separated by < 150 km) (Wiebkin 2012; Colombelli-Négrel 2016). The differences
between morphological traits were greater between birds from colonies that were further away from
each other (Colombelli-Négrel 2016). These results suggest a low level of demographic connectivity
between the populations at different colonies, which may negatively affect their ability to recover
from population declines.

Short-tailed shearwaters tracked using satellite transmitters during chick-rearing from two SA island
colonies (Althorpe Island and St Peter Island) were shown to have two primary modes of foraging. The
first was ‘short’ trips into waters 35 - 70 km from the colonies (Einoder et al. 2005), and the second
was ‘long’ trips into the Southern Ocean – some going as far as the Antarctic ice front (Einoder et al.
2011). These results indicate that there are likely areas for foraging around the colonies which may
be afforded some protection by the SA marine parks network (for these two colonies this would
particularly be Western Kangaroo Island Marine Park, Southern Spencer Gulf Marine Park and also the
South-west Commonwealth Marine Park). However, the interspersion of ‘long’ foraging trips of >
1000 km means there are considerable periods when the birds are not using habitats within the
network, even during the breeding period when they are central-place foraging from SA colonies
(Einoder et al. 2005; Einoder et al. 2011).

Data on population structure and connectivity for other sea and shore bird species using SA waters
are lacking.

Marine mammals:

Recent genetic studies using mitochondrial DNA (Campbell et al. 2008; Lowther et al. 2012) and
microsatellite loci (Ahonen et al. 2016) show that populations of Australian sea lions are highly

Assessing connectivity in South Australia’s Marine Parks Network, v. 3.                  Page 24 of 61
SA Marine Parks Network – connectivity review

structured at a fine scale in SA and that both males and females are strongly philopatric. Ahonen et
al. (2016) found that at least 68% of the adults they sampled were at their natal colonies. These results
indicate low dispersal and high levels of population structuring, which fits with the species
asynchronous breeding behaviour at the different SA breeding colonies, but is somewhat surprising
given their capability for long distance movements (> 350 km) (Ahonen et al. 2016). Lowther et al
(2012) demonstrated individual foraging specialisation and discrete foraging habitats (using stable
isotopes), and suggested that dispersal was limited by these behaviours. Genetic differentiation
increased with distance between colonies (Campbell et al. 2008; Ahonen et al. 2016) and there was
no evidence of exchange between WA and SA colonies (Ahonen et al. 2016; Figure 11). Despite the
low overall connectivity, the study found moderate levels of contemporary migration between most
colonies, with the exception of Lewis Island, which is a source of dispersing animals, but has not
received many migrants over recent generations (Ahonen et al. 2016; Figure 11).

Figure 11 from Ahonen et al. (2016): Location of sampling sites for Australian sea lion DNA with
number of samples from each location indicated. Green arrows and values show the direction and
magnitude of contemporary movement between pairs of sites. © 2016 Ahonen, Lowther, Harcourt,
Goldsworthy, Charrier and Stow. Reproduced under a creative commons license.

There are currently no published studies on the population structure or connectivity of long-nosed fur
seals in SA waters although it is likely that some relevant data may be held by SARDI, collected as part
of the Great Australian Bight research program. The outcomes of the multispecies tracking work
associated with this program are likely to be very useful in terms of assessing connectivity in the
marine parks network for mobile megafauna.

Assessing connectivity in South Australia’s Marine Parks Network, v. 3.                  Page 25 of 61
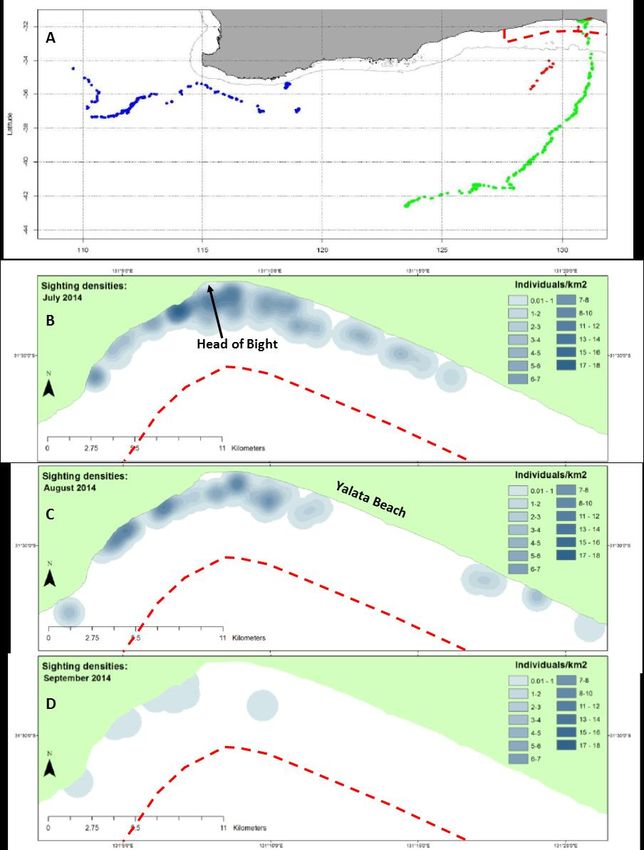
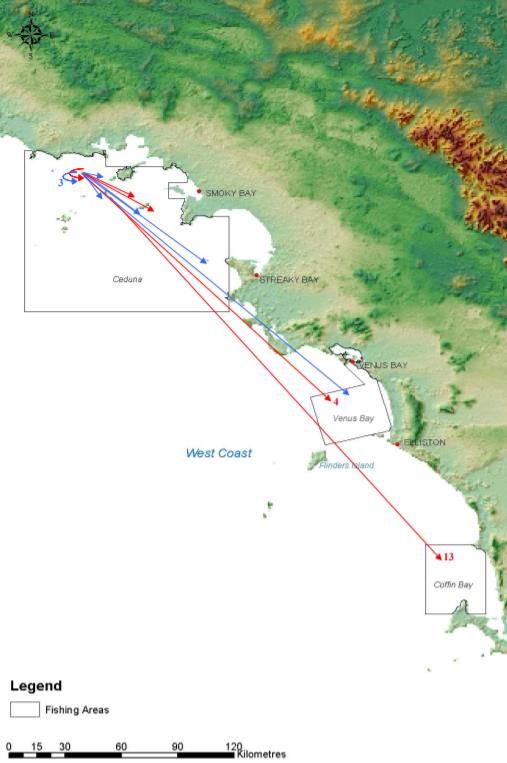
SA Marine Parks Network – connectivity review

Studies on short-beaked common dolphins indicate no population structuring within SA waters (but
indicate that SA populations are not well-connected with those in Tasmania). A high level of
connectivity across SA is to be expected for this vagile species, which is often found aggregated into
very large pods (Bilgmann et al. 2008). On the contrary, there is evidence for population structure in
bottlenose dolphins in SA, evidenced by restricted gene flow (indicating a lack of contemporary
connectivity) between populations in Spencer Gulf and in coastal areas to the west of the Gulf,
separated by distances of 100s of km (Bilgmann et al. 2007). A finer-scale study of bottlenose dolphin
residency along the coast of Adelaide found that there was a mixture of resident and visiting dolphins
using these waters (Zanardo et al. 2016). This indicates that there is likely to be some connectivity
between populations, at least within this region of Gulf St Vincent.

Attard et al. (2010) showed that there is a high level of connectivity in the wide-ranging blue whale,
which is an annual visitor to SA waters that are influenced by the Bonney Upwelling. Individuals
sampled within SA waters were also not genetically differentiated from those sampled in Victoria or
WA, suggesting that there is a single mobile population feeding in areas of coastal upwelling along the
southern coast of Australia (Attard et al. 2010). This level of connectivity and long-distance dispersal
means that this species is unlikely to be adequately protected throughout its life-cycle by the SA
Marine Parks Network, although they will potentially afford some protection at specific feeding
grounds (depending on the zoning). There is no research that looks specifically at the connectivity of
southern right whales in SA waters, although there are data on their distribution and offshore
movements (3 tracked individuals) in the Great Australian Bight (Mackay et al. 2015a; Mackay et al.
2015b), as well as information suggesting an important calving area in Encounter Marine Park
(Australian Government DSEWPC 2012). These studies indicate that there is a high level of occupancy
of southern right whales (including mother and calf pairs) in the Far West Coast Marine Park,
particularly around the Head of Bight and Yalata Beach nursey areas, during July – September (Mackay
et al. 2015b; Figure 12 b, c & d). However, tracked individuals (N = 3) showed long-distance dispersal,
moving outside State waters and indicating broad scale connectivity with areas under WA and
Commonwealth jurisdiction (Mackay et al. 2015a; Figure 12 a). This long-range connectivity is also
supported by (Bilgmann et al. 2014) who undertook inshore cetacean surveys as part of the Great
Australian Bight Research Program from July – August 2013. Their results suggest that the inshore
waters between Ceduna and Coffin Bay are used by whales transiting from feeding grounds to
aggregation sites at the Head of the Bight and/or Fowlers Bay in the Nuyts Archipelago Marine Park,
and may also occasionally be used for calving and nursing (Bilgmann et al. 2014).

Assessing connectivity in South Australia’s Marine Parks Network, v. 3.                 Page 26 of 61
You can also read