Allele Sorting as a Novel Approach to Resolving the Origin of Allotetraploids Using Hyb-Seq Data: A Case Study of the Balkan Mountain Endemic ...
←
→
Page content transcription
If your browser does not render page correctly, please read the page content below
ORIGINAL RESEARCH
                                                                                                                                                published: 28 April 2021
                                                                                                                                         doi: 10.3389/fpls.2021.659275

                                             Allele Sorting as a Novel Approach to
                                             Resolving the Origin of
                                             Allotetraploids Using Hyb-Seq Data:
                                             A Case Study of the Balkan Mountain
                                             Endemic Cardamine barbaraeoides
                                             Marek Šlenker 1,2† , Adam Kantor 1† , Karol Marhold 1,2 , Roswitha Schmickl 2,3 ,
                                             Terezie Mandáková 4,5 , Martin A. Lysak 4,6 , Marián Perný 7 , Michaela Caboňová 1 ,
                                             Marek Slovák 1,2 and Judita Zozomová-Lihová 1*
                                             1
                           Edited by:         Institute of Botany, Plant Science and Biodiversity Centre, Slovak Academy of Sciences, Bratislava, Slovakia, 2 Department
                        Božo Frajman,        of Botany, Faculty of Science, Charles University, Prague, Czechia, 3 Institute of Botany, The Czech Academy of Sciences,
       University of Innsbruck, Austria      Průhonice, Czechia, 4 Central European Institute of Technology, Masaryk University, Brno, Czechia, 5 Department
                                             of Experimental Biology, Faculty of Science, Masaryk University, Brno, Czechia, 6 National Centre for Biomolecular Research,
                         Reviewed by:
                                             Faculty of Science, Masaryk University, Brno, Czechia, 7 Independent Researcher, Žibritov, Slovakia
                  Salvatore Tomasello,
     University of Göttingen, Germany
                  Rie Shimizu-Inatsugi,      Mountains of the Balkan Peninsula are significant biodiversity hotspots with great
      University of Zurich, Switzerland
                                             species richness and a large proportion of narrow endemics. Processes that have driven
                   *Correspondence:
             Judita Zozomová-Lihová          the evolution of the rich Balkan mountain flora, however, are still insufficiently explored
           judita.zozomova@savba.sk          and understood. Here we focus on a group of Cardamine (Brassicaceae) perennials
     † These   authors have contributed      growing in wet, mainly mountainous habitats. It comprises several Mediterranean
                    equally to this work
                                             endemics, including those restricted to the Balkan Peninsula. We used target
                   Specialty section:        enrichment with genome skimming (Hyb-Seq) to infer their phylogenetic relationships,
         This article was submitted to       and, along with genomic in situ hybridization (GISH), to resolve the origin of
     Plant Systematics and Evolution,
               a section of the journal
                                             tetraploid Cardamine barbaraeoides endemic to the Southern Pindos Mts. (Greece).
            Frontiers in Plant Science       We also explored the challenges of phylogenomic analyses of polyploid species and
         Received: 27 January 2021           developed a new approach of allele sorting into homeologs that allows identifying
          Accepted: 10 March 2021
                                             subgenomes inherited from different progenitors. We obtained a robust phylogenetic
           Published: 28 April 2021
                                             reconstruction for diploids based on 1,168 low-copy nuclear genes, which suggested
                              Citation:
     Šlenker M, Kantor A, Marhold K,         both allopatric and ecological speciation events. In addition, cases of plastid–nuclear
Schmickl R, Mandáková T, Lysak MA,           discordance, in agreement with divergent nuclear ribosomal DNA (nrDNA) copy variants
Perný M, Caboňová M, Slovák M and
     Zozomová-Lihová J (2021) Allele
                                             in some species, indicated traces of interspecific gene flow. Our results also support
         Sorting as a Novel Approach         biogeographic links between the Balkan and Anatolian–Caucasus regions and illustrate
                to Resolving the Origin
                                             the contribution of the latter region to high Balkan biodiversity. An allopolyploid origin
     of Allotetraploids Using Hyb-Seq
    Data: A Case Study of the Balkan         was inferred for C. barbaraeoides, which highlights the role of mountains in the Balkan
        Mountain Endemic Cardamine           Peninsula both as refugia and melting pots favoring species contacts and polyploid
                        barbaraeoides.
          Front. Plant Sci. 12:659275.
                                             evolution in response to Pleistocene climate-induced range dynamics. Overall, our study
      doi: 10.3389/fpls.2021.659275          demonstrates the importance of a thorough phylogenomic approach when studying

Frontiers in Plant Science | www.frontiersin.org                                    1                                             April 2021 | Volume 12 | Article 659275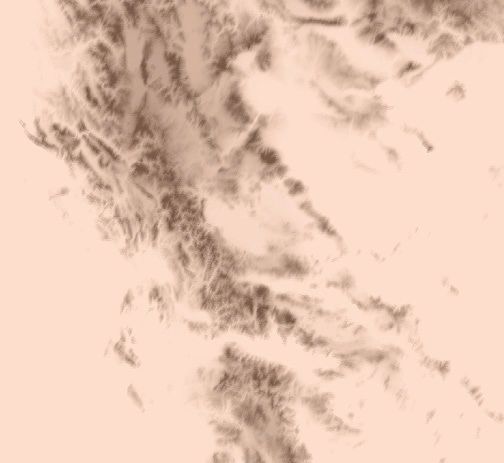
Šlenker et al.                                                                                                            Phylogenomics of Balkan Cardamine

                                             the evolution of recently diverged species complexes affected by reticulation events at
                                             both diploid and polyploid levels. We emphasize the significance of retrieving allelic and
                                             homeologous variation from nuclear genes, as well as multiple nrDNA copy variants from
                                             genome skim data.
                                             Keywords: allopolyploidy, Balkan endemism, genomic in situ hybridization, Hyb-Seq, nrDNA, Pindhos Mts., read-
                                             backed phasing, target enrichment

INTRODUCTION                                                                       (e.g., Ansell et al., 2011; Surina et al., 2014; Caković et al., 2015;
                                                                                   Koch et al., 2017). Plant migration via two dispersal corridors,
The Mediterranean Basin is one of Earth’s major biodiversity                       the North Anatolian Mountains or the Taurus Mountains, has
centers (Myers et al., 2000) harboring several regional hotspots                   been proposed, which was enhanced by land bridges that existed
with increased levels of species richness and endemism (Médail                     since the Messinian salinity crisis until the Pliocene–Pleistocene
and Quézel, 1997; Thompson, 2020). Processes that have                             transition (Bilgin, 2011; Kaya and Çiplak, 2017; Özüdoğru and
given rise to such biodiversity hotspots at a finer scale are                      Mummenhoff, 2020).
complex and reflect interactions of climatic, geological, and                          Cardamine L. (Brassicaceae) is a worldwide distributed and
biogeographic history of the Mediterranean region (Hewitt, 2011;                   species-rich genus (>200 spp.), which has one of its diversity
Nieto Feliner, 2014; Thompson, 2020). Areas of high endemism                       centers located in the European Mediterranean (Marhold et al.,
are concentrated particularly on islands and in mountains,                         2004, 2018; Lihová and Marhold, 2006; Carlsen et al., 2009;
which provide favorable conditions for both speciation and                         Kučera et al., 2010). The target group of species studied here
long-term population persistence (Médail and Quézel, 1997;                         comprises approximately 30 taxa, both at species and subspecies
Stevanović et al., 2007; Panitsa et al., 2018; Thompson, 2020).                   levels, and includes a few widespread taxa distributed across
Complex mountainous landscape has a buffering effect on                            Europe, several endemics confined to Southern Europe, and
climate change and enables species to survive periods of climatic                  also some species from SW Asia (mainly the Anatolian and
fluctuations through minor range shifts (Médail and Diadema,                       Caucasus regions). They have commonly been delimited as three
2009; Harrison and Noss, 2017; Muellner-Riehl et al., 2019).                       related diploid–polyploid species complexes: the Cardamine
Mountains, however, are not just reservoirs, but also cradles of                   amara, Cardamine pratensis, and Cardamine raphanifolia groups
diversity. Great habitat diversity over short geographic distances                 (Lihová et al., 2004a; Marhold et al., 2004, 2018). In contrast
and high topographic complexity of the mountains creates                           to this traditional, morphology-based delimitation, phylogenetic
opportunities in which both adaptive and nonadaptive speciation                    reconstructions suggested the existence of only two complexes
may occur (Harrison and Noss, 2017; Perrigo et al., 2020). These                   resolved as respective monophyletic clades, one comprising the
factors also favored the evolution of narrow endemism in the                       C. amara complex and the other the remaining species (Marhold
Mediterranean (Thompson, 2020). In addition, range or niche                        et al., 2004; Carlsen et al., 2009). The crown group ages of both
shifts in response to geological and climatic events may bring                     clades have been dated back to the Pliocene (approximately 3–4
vicariant taxa into contact and cause hybridization, with or                       Mya), and divergence of the extant species likely occurred during
without a ploidy level increase (Nieto Feliner, 2014). Although                    the Pleistocene (Huang et al., 2020). Most of the species diversity
hybridization and polyploidization are recognized as significant                   of these complexes is concentrated in Mediterranean mountains,
processes for plant evolution and speciation (Soltis and Soltis,                   which host several diploid and polyploid endemics (Marhold
2009; Soltis et al., 2014), their frequency and contribution to the                et al., 2018). Polyploid origins have been resolved or hypothesized
high species diversity and endemism in the Mediterranean are                       in only a few cases (Lihová et al., 2004a, 2006; Perný et al.,
still poorly understood (Marques et al., 2018; Thompson, 2020).                    2005a), and even at the diploid level, species relationships within
    Here, we focus on the mainland area of the central and                         the complexes have remained poorly understood (Lihová et al.,
southern Balkan Peninsula, which is one of the regional                            2004a; Marhold et al., 2004). In the Balkan Peninsula, diploid
biodiversity hotspots with a large proportion of narrow                            endemics prevail, and these include Cardamine penzesii Ančev et
endemics (Stevanović et al., 2007; Georghiou and Delipetrou,                      Marhold, Cardamine rivularis Schur, C. amara subsp. balcanica
2010; Tomović et al., 2014). Despite extensive botanical                          Ančev, Marhold et Kit Tan, and Cardamine acris Griseb. with
explorations and well-described endemism patterns in this                          three subspecies recognized. In addition, tetraploid populations
area, speciation processes that have driven the evolution of                       from the Pindos Mts. in northwestern Greece have been reported
the rich mountain flora are still not sufficiently explored.                       and attributed to Cardamine barbaraeoides Halácsy. It is a species
Mainly allopatric speciation often accompanied by reticulate and                   with an uncertain circumscription and unknown polyploid origin
polyploid evolution has been suggested in recent studies (López-                   (Marhold et al., 2018).
Vinyallonga et al., 2015; Olšavská et al., 2016; Durović et al.,                      High-throughput DNA sequencing has brought excellent
2017; Španiel et al., 2017). High species diversity in this area may               opportunities to improve phylogenetic inferences, particularly
also be connected with adjacent Anatolia, which is recognized                      when facing difficult evolutionary cases, such as rapid radiations
as a center of lineage diversification in several plant genera and                 or recent speciation characterized by low genetic divergence and
a possible source for the colonization of the Balkan Peninsula                     presence of incomplete lineage sorting (ILS) often complicated

Frontiers in Plant Science | www.frontiersin.org                               2                                        April 2021 | Volume 12 | Article 659275
Šlenker et al. Phylogenomics of Balkan Cardamine
by hybridization and polyploidy (Schmickl et al., 2016; Nikolov and homeologous sequence variation and its sorting into
et al., 2019; Karbstein et al., 2020; Larridon et al., 2020). parental subgenomes.
Disentangling reticulate and polyploid evolution, however, has
been a difficult task, and phylogenomic studies on polyploids
have lagged behind (Oxelman et al., 2017; Rothfels, 2021). Recent MATERIALS AND METHODS
advances in this respect (see, e.g., Kamneva et al., 2017; Morales-
Briones et al., 2018; Carter et al., 2019; Brandrud et al., 2020) Study Species and Sampling
have opened up new perspectives on analyses of polyploid species The target species complexes of Cardamine comprise
complexes. Approaches that account simultaneously for ILS and rhizomatous perennials with an allogamous or mixed mating
reticulation have been developed and improved (Oberprieler system, capable of vegetative propagation (Lövkvist, 1956;
et al., 2017; Wen et al., 2018; Cao et al., 2019). Those network Marhold and Ančev, 1999; Tedder et al., 2015). They grow in
methods can provide significant insights into the evolution of wet habitats from lowlands up to the alpine belt, in or nearby
polyploids based on multilocus sequence data (e.g., Kamneva running or standing water, usually along river and stream
et al., 2017; Morales-Briones et al., 2018). Still, standard practice banks, in springs, wet meadows and pastures, in flood-plain
when assembling sequencing reads is to generate a single to montane forests. Morphologically, they are characterized
consensus sequence per locus and individual, which represents by pinnate basal leaves, pinnate to pinnatisect stem leaves,
a strong violation for allopolyploid genomes. The outcome and white, pale pink to purple flowers arranged in racemes
of such consensus assembly is a mix of sequences retrieved (e.g., Marhold et al., 1996; Marhold and Ančev, 1999; Lihová
from different homeologs (parental subgenomes) and chimeric et al., 2004b; Perný et al., 2004). In the Balkan Peninsula,
sequences. Therefore, the crucial steps to resolve in polyploid they include mostly endemics (C. amara subsp. balcanica,
phylogenetics are to separate sequencing reads originating from C. acris subsp. acris, subsp. vardousiae Perný et Marhold,
different subgenomes, assemble haplotype (allele) sequences, subsp. pindicola Perný et Marhold, C. barbaraeoides, C. penzesii,
assign them to the subgenomes, and trace the parental origin C. rivularis) or more widespread European taxa reaching
of these subgenomes by multilabeled species tree or network their southeastern distribution margins there [Cardamine
inference methods (Rothfels, 2021). A few recent studies have matthioli Moretti, C. amara subsp. amara, subsp. opicii (J.
explored different ways how to accomplish these steps, either Presl et C. Presl) Čelak; Figure 1]. Apart from tetraploid
via mapping and categorization of the sequence reads to the records for C. barbaraeoides (Perný et al., 2005a; Lihová and
reference diploid genomes (Page et al., 2013; Grover et al., 2015), Marhold, 2006], the other Balkan taxa are known to be diploid,
developing bioinformatics pipelines for amplicon sequences of with exceptional triploid plants reported for C. rivularis and
polyploids from long-read sequencing platforms (Rothfels et al., C. ×rhodopaea Ančev (C. rivularis × C. matthioli) (Kučera et al.,
2017), or via the assembly of haplotype sequences by read-backed 2005; Ančev et al., 2013; Melichárková et al., 2020). Only diploid
phasing (Eriksson et al., 2018; Kates et al., 2018). Nevertheless, the representatives have so far been reported from the adjacent
assignment of alleles to parental subgenomes has been critical and Anatolian–Caucasus region (Marhold et al., 2004; Kučera
difficult to achieve readily for hundreds of loci typically recovered et al., 2005). In the Apennines, on the contrary, one diploid
by target enrichment techniques. Some statistical methods for (Cardamine apennina Lihová et Marhold) and two polyploids
this task are under development and appear promising (Freyman (Cardamine silana Marhold et Perný, Cardamine amporitana
et al., 2020; Lautenschlager et al., 2020), but may also be Sennen et Pau, both presumably allopolyploids, Perný et al.,
computationally intensive. 2005a, and unpubl. results) occur (Marhold et al., 2018). The
In this article, we employ target enrichment with genome three species, C. amara, C. amporitana, and Cardamine lazica
skimming (Hyb-Seq) using genus-specific probes to capture Boiss. et Balansa ex Buser (the last one being referred to as
hundreds of orthologous low-copy nuclear loci (target exons with Cardamine wiedemanniana Boiss. in our previous studies; see,
flanking intronic and intergenic regions), along with obtaining e.g., Lihová et al., 2004a), have been regarded as members of
the complete plastid genome and high-copy nuclear ribosomal the C. amara complex, whereas the other species have been
DNA (Weitemier et al., 2014; Schmickl et al., 2016). Here we attributed to either the C. pratensis or C. raphanifolia groups.
develop a novel computational approach to sort alleles obtained The position of C. barbaraeoides remained uncertain and was
from polyploids into parental subgenomes, utilizing genetic commonly classified either as C. amara subsp. barbaraeoides
distances among alleles, and employ it to reconstruct the origin (Halácsy) Maire et Petitm. (Tan, 2002) or as C. raphanifolia
and parentage of tetraploid C. barbaraeoides. We complement subsp. barbaraeoides (Halácsy) Strid (Strid, 1986; Jones and
this phylogenomic approach with genomic in situ hybridization Akeroyd, 1993).
(GISH, Silva and Souza, 2013). In detail, we aimed to (1) resolve Here, we included all taxa occurring in the Balkan Peninsula,
phylogenetic relationships among Balkan Cardamine species plus diploids from adjacent areas, C. apennina from the
and determine major factors affecting endemism patterns in Apennines, and C. lazica and Cardamine uliginosa M.Bieb. from
mountains of the Balkan Peninsula; (2) reconstruct the origin of the Anatolian–Caucasus region (Figure 1, Supplementary Data
tetraploid C. barbaraeoides from the Pindos Mts. in Greece to Sheet 1). C. uliginosa is a highly polymorphic and widespread
shed light on the evolution of mountain endemic flora through species (Figure 1) described from the Caucasus, but probably
polyploidy; and (3) identify challenges of phylogenomic analyses being polyphyletic and pending further detailed studies (Marhold
of polyploid species, where we focus on resolving heterozygous et al., 2004; study under progress). Two geographically distant
Frontiers in Plant Science | www.frontiersin.org 3 April 2021 | Volume 12 | Article 659275Šlenker et al. Phylogenomics of Balkan Cardamine
amm.....C. amara ssp. amara (l-mt)
amo......C. amara ssp. opicii (mt-subal)
acra
amb......C. amara ssp. balcanica (mt-subal)
laz........C. lazica (mt-subal) mt
ape.......C. apennina (l-mt)
mt.........C. matthioli (l-mt) acrp
riv.........C. rivularis (mt-al)
acra......C. acris ssp. acris (mt-subal)
acrp......C. acris ssp. pindicola (mt-subal)
bar
acrv......C. acris ssp. vardousiae (mt-subal)
amo pen.......C. penzesii (l)
acrv
ul..........C. uliginosa (mt-al)
amo bar........C. barbaraeoides (mt)
amo
amo
riv
acra
ape
amb riv
pen
amm
laz
ul
0 250 500 km
FIGURE 1 | Distribution of the Cardamine taxa under study, based on data compiled from floras, herbarium specimens, previous studies, and our own records. The
western borders of the area of Cardamine amara subsp. balcanica remain unknown (marked here by a black–orange dashed line; see Tomović et al., 2009); this
taxon has been thoroughly studied so far only in its Bulgarian range (Marhold et al., 1996). Cardamine matthioli and C. amara subsp. amara are widespread taxa in
Europe (Jalas and Suominen, 1994), but their precise distribution in the Balkan Peninsula remains unclear, with the southernmost records reported from central and
northeastern Greece (gray dotted line; Marhold and Tan, 2000) and North Macedonia (orange dotted line; Jalas and Suominen, 1994; Tomović et al., 2009, and this
study), respectively. The area of Cardamine uliginosa extends further to the south and southeast, reaching the mountains of Iran and Lebanon. The occurrence of the
taxa along the elevational gradient is indicated in brackets as follows: l, lowland; mt, montane; subal, subalpine; al, alpine belt. Circles indicate our sample sites; see
Supplementary Data Sheet 1 for details on the populations sampled.
accessions attributed to this species were included here, one Chromosome Counting and Flow
from the Uludağ Mts. in NW Turkey, here referred to as Cytometry
C. cf. uliginosa, and the other from the Caucasus (Armenia).
Chromosomes of C. barbaraeoides were counted from mitotic
Altogether, we sampled 46 populations representing nine species metaphase plates observed in cells of young, actively growing
(13 taxa), which were used for ploidy level and genome size root tips obtained from cultivated plants. Chromosome spreads
measurements by flow cytometry (307 accessions), polymerase were prepared following Marhold et al. (2002) using the Giemsa
chain reaction (PCR) amplification of the nuclear ribosomal stain, or following Mandáková and Lysak (2016a) using the DAPI
DNA (nrDNA) ITS region (48 accessions), and Hyb-Seq analyses (40 ,6-diamidino-2-phenylindole) fluorochrome. For the other
(22 accessions) capturing target nuclear genes, plastid DNA, sampled species and subspecies, chromosome number records
and nrDNA. The tetraploid C. barbaraeoides and a selection of were available from previous studies (Kučera et al., 2005), in some
potential parental candidates were used in GISH experiments. In cases even from the here sampled localities (see Supplementary
addition, four diploids representing phylogenetically divergent Data Sheet 1 for details).
lineages (following the genus phylogeny, Carlsen et al., 2009) Flow cytometry was applied here to measure nuclear DNA
were included as outgroups. The list of the populations sampled content of the sampled accessions (Doležel et al., 2007). These
and accessions analyzed is given in Supplementary Data Sheet 1. measurements were performed to confirm that the ploidy level
Frontiers in Plant Science | www.frontiersin.org 4 April 2021 | Volume 12 | Article 659275Šlenker et al. Phylogenomics of Balkan Cardamine
of the analyzed populations and accessions is uniform and Multiple clones per sample were sequenced (see Supplementary
agrees with the known records, as well as to determine genome Data Sheet 1 for details). The sequencing was carried out at
size differences between the species. Both absolute and relative Eurofins Genomics Company (Konstanz, Germany).
nuclear DNA content was measured, using the DNA-intercalating
fluorochrome [propidium iodide (PI)], and the AT-selective Hyb-Seq Library Preparation
DAPI fluorochrome, respectively (Doležel et al., 2007). For Sequencing libraries were prepared using the NEBNext UltraTM R
PI measurements, we used fresh leaf tissue from cultivated DNA Library Prep Kit for Illumina (New England Biolabs,
R
plants, whereas for DAPI measurements we used silica gel– MA, United States) following the manufacturer’s protocol. gDNA
dried tissue (Suda and Trávníček, 2006a,b). Each individual was (400 ng per accession) was fragmented with a Covaris M220
analyzed separately (for precise relative or absolute nuclear DNA sonicator (Woburn, MA, United States) to a target fragment size
content values), or up to three individuals were pooled (for of 500 bp. Adaptor-ligated DNA fragments were purified with
ploidy level inference only; see Supplementary Data Sheet 1). the QIAquick PCR Purification Kit (Qiagen) and size-selected
Sample preparation followed the protocols described by Marhold using SPRIselect beads (Beckman Coulter, MA, United States) to
et al. (2010). Fluorescence of the stained nuclei was measured a 500- to 600-bp size range. PCR enrichment with eight cycles was
using Partec CyFlow flow cytometers (Partec GmbH, Münster, performed using index primers from NEBNext Multiplex Oligos R
Germany), either with a UV LED lamp for DAPI measurements for Illumina . The amplified libraries were cleaned up with
R
or a green solid-state laser for PI measurements. Relative nuclear AMPure XP beads (Beckman Coulter), measured with a Qubit 2.0
DNA content (2C value given in arbitrary units) was calculated fluorometer (ThermoFisher Scientific, MA, United States), and
as the ratio between the positions of the G1 peaks of the sample pooled equimolarly (24 accessions/pool). The pooled library was
and the standard. Absolute nuclear DNA content (2C value size-selected using SPRIselect beads as above and measured again
given in pg) was calculated from the ratio of the respective with the Qubit 2.0. An aliquot containing 250 ng was enriched
G1 peaks and the known 2C value of the standard. Solanum by hybridization with synthesized RNA baits (26 h at 65◦ C)
pseudocapsicum (2C = 2.59 pg; Temsch et al., 2010) was used using the MYbaits kit, following the protocol v. 3.02 (Arbor
R
as the primary internal standard. In cases when peak overlaps Biosciences, MI, United States). The target-enriched library was
between the sample and standard were observed or expected, amplified by PCR with nine cycles using the KAPA HiFi HotStart
Bellis perennis (2C = 3.38 pg; Schönswetter et al., 2007) was used mix (Kapa Biosystems, Wilmington, MA, United States) and
as the secondary standard (see Supplementary Data Sheet 1). purified with the QIAquick PCR Purification Kit. Enriched and
unenriched library aliquots were pooled in a ratio 2:1, finally
purified with AMPure XP beads, and submitted for sequencing
PCR Amplification, Molecular Cloning, with 150-bp paired end reads on an Illumina MiSeq system at
and Sanger Sequencing BIOCEV, Czechia.
Polymerase chain reaction amplification, molecular cloning, and The design of the Cardamine-specific target enrichment
Sanger sequencing of the ITS region of nrDNA were employed probes is described in detail in Melichárková et al. (2020). In
to explore the diversity of ITS variants within and between brief, we used genome skim data of Cardamine parviflora (NCBI
individuals, both diploid and tetraploid, as well as to compare this accession no.: SRR11977919) omitting plastid and mitochondrial
approach with the accuracy and efficiency of retrieving different reads, which were matched against unique transcripts of C. amara
ITS variants from high-throughput genomic reads. In addition, (SRR11977918), utilizing the workflow of the Sondovač 0.99
PCR amplification, molecular cloning, and Sanger sequencing of script1 (Schmickl et al., 2016). Genome skim hits were assembled
chalcone-synthase (CHS) was performed for tetraploid accessions into larger contigs, which were filtered for length and uniqueness,
only (Supplementary Data Sheet 1). CHS is a single-copy and compiled as probe sequences for bait synthesis. In total,
nuclear gene of high phylogenetic resolution, used previously 14,464 120-mer biotinylated RNA baits, capturing 2,246 exons
to infer polyploid origins and phylogeny of Cardamine species from 1,235 genes, were synthesized by MYcroarray (now
(Lihová et al., 2006; Kučera et al., 2010). It was included among Arbor Biosciences).
the target genes in the Hyb-Seq approach, and therefore, the
sequenced CHS clones were used to verify and optimize the
assembly of allele sequences by read-backed phasing and the
Hyb-Seq Data Processing and
procedure of allele sorting into parental homeologs in tetraploid Phylogenomic Analyses
accessions (see below). Demultiplexed reads were trimmed of adapters and low-quality
Genomic DNA (gDNA) was isolated from silica gel–dried bases using Trimmomatic v. 0.36 (Bolger et al., 2014). Read ends
leaves using the DNeasy Plant Mini Kit (Qiagen, Germany) or with quality below Q20 were discarded, and the remaining part
GeneAll Exgene Plant SV mini kit (GeneAll Biotechnology Co., of the read was trimmed if average quality in a 4-bp sliding
LTD., South Korea). ITS amplifications and molecular cloning window was below Q15. Finally, any reads trimmed to less than
followed the protocols specified in Melichárková et al. (2017, 50 bp were discarded. PCR duplicates were removed using the
2019). Exon 2 of CHS was amplified with the primers CHSF2 and Clumpify command of BBTools2 .
CHSR1 (Lihová et al., 2006) and cloned following Melichárková
et al. (2017). The PCR reaction mix contained also 3% dimethyl 1
https://github.com/V-Z/sondovac
sulfoxide to suppress PCR-mediated recombination events. 2
https://jgi.doe.gov/data-and-tools/bbtools
Frontiers in Plant Science | www.frontiersin.org 5 April 2021 | Volume 12 | Article 659275Šlenker et al. Phylogenomics of Balkan Cardamine
Consensus target sequences were assembled using HybPiper (Pease et al., 2018), which can distinguish strong conflict
version 1.3 (Johnson et al., 2016) utilizing BWA v. 0.7.13 (Li from weak signal, was applied to assess branch support of
and Durbin, 2009), SPAdes v. 3.13 (Bankevich et al., 2012), and the trees generated from the concatenated alignments. The
Exonerate v. 2.2 (Slater and Birney, 2005). HybPiper generates concatenation of the aligned exons and genes was performed
a single consensus sequence per individual, with potentially by AMAS (Borowiec, 2016). Species trees were inferred from
heterozygous bases called as the nucleotide with the highest individual gene trees under a multispecies coalescent model
read frequency. “Supercontigs” (targeted exons and flanking using ASTRAL-III (Zhang et al., 2018). PhyloNet was employed
sequences) were recovered using the script intronerate.py. to infer a species network evaluating reticulate evolutionary
Recovered consensus supercontig sequences were aligned using relationships in individual gene trees. The network was inferred
MAFFT v. 7.313 (Katoh and Standley, 2013). Flanks and sites with a single reticulation node using the InferNetwork_MP
with gaps in more than 25% of sequences were removed using method in 10 runs, each with two optimal networks returned
the ips R package (Heibl, 2008 onward) in R 3.3.2 (R Core Team, (Wen et al., 2018). SuperQ v.1.1 (Grünewald et al., 2013;
2019). Alignments were inspected visually, and misassemblies Bastkowski et al., 2018) decomposed gene trees into quartets,
were removed. In addition to using the consensus supercontig and inferred a supernetwork selecting the JOptimizer scaling
sequences, the allele sequences were inferred with read-backed and Gurobi optimizer. The trees used as input data for species
phasing (described in detail below in Extracting Allele Sequences tree reconstruction and both network analyses had contracted
and Identifying Homeologs Inherited From Different Parents) branches with low support (≤ 20%) by Newick-Utilities v.
using WhatsHap (Martin et al., 2016). Both consensus and allele 1.6 (Junier and Zdobnov, 2010). Bayesian clustering of SNP
data sets were used in further analyses. data was performed to infer homogeneous genetic clusters
The recovered sequences of the target nuclear genes were with STRUCTURE 2.3.4 (Pritchard et al., 2000). Input datasets
analyzed using the following workflow. First, we performed were generated by the snipStrup pipeline [available online at:
phylogenomic analyses of diploid taxa only (with both the https://github.com/MarekSlenker/snipStrup; described in detail
consensus and allele sequence alignments), to provide a robust in Melichárková et al. (2020)]. This pipeline uses target sequences
phylogenetic framework, using both concatenation of assembled (those used for probe synthesis) as a reference and calls variants
genes and species tree inference under the multispecies coalescent with respect to ploidy. To ensure that no linkage existed between
model. As next, we analyzed diploids together with the tetraploid sites, 500 datasets were produced by drawing a single random
C. barbaraeoides. Considering that the tetraploid genome consists SNP site from each gene containing at least 10 SNPs across the
of two subgenomes that may be more or less differentiated, and samples. Each dataset was run for each K = 1–10 (user-defined
thus potentially conveys conflicting phylogenetic information, number of clusters), with a burn-in length of 100,000 generations
we used here multiple approaches. To gain initial insights into and data collection for an additional 900,000 generations, setting
the tetraploid genome, we used consensus supercontig sequences the admixture model and correlated allele frequencies. The results
and applied methods that can detect and visualize conflict of 500 datasets were averaged using the program CLUMPP
caused by potential discordance between consensus supercontigs (Jakobsson and Rosenberg, 2007) and drawn with Distruct
retrieved from independent genes. In allopolyploids, the (Rosenberg, 2004). The approach of Evanno et al. (2005) was used
consensus sequences may comprise different homeologs or even to determine the optimal K value.
consist of artificial, chimeric sequences. The analyses included
supernetwork and species network calculations based on the
gene trees obtained from the assembled consensus sequences, as
Extracting Allele Sequences and
well as single-nucleotide polymorphisms (SNPs) calling followed Identifying Homeologs Inherited From
by Bayesian clustering of the SNP datasets. Finally, when the Different Parents
conflict between the subgenomes of the tetraploid became Allele sequences were derived using the scripts and following the
apparent, we derived allele sequences of the exons by read-backed workflow available online at: https://github.com/mossmatters/
phasing also from the tetraploids (see below in Extracting Allele phyloscripts/tree/master/alleles_workflow, described in detail by
Sequences and Identifying Homeologs Inherited From Different Kates et al. (2018), only using the latest versions of GATK and
Parents). Up to four different alleles obtained from the exons WhatsHap (Martin et al., 2016; Schrinner et al., 2020) enabling
of tetraploid C. barbaraeoides were sorted into two distinct to call and phase variants in polyploids. If the phased sequences
homeologs based on allelic divergence (computing interallelic were divided into multiple blocks, only the longest phase block
distances, see below) using an optimized threshold value. The for each individual was retained, and the remaining interallelic
resulting allele alignments were submitted to coalescent-based variant sites were masked by using Ns on those positions.
species tree inference. The alleles obtained from the tetraploid C. barbaraeoides
Phylogenetic trees were constructed using RAxML-NG v. 0.9.0 were sorted into two distinct homeologs as follows. The first
(Kozlov et al., 2019). The best-fit model of substitution for step was to find two pairs of alleles, in which the alleles are
each gene, exon, or partitioning scheme was estimated using closest to each other within the pairs while more distant between
the IQ-TREE’s ModelFinder function (Chernomor et al., 2016; the pairs. Interallelic distances were estimated from the branch
Kalyaanamoorthy et al., 2017) under the Bayesian information lengths of the corresponding exon or gene ML trees (computed
criterion. Branch support of the best ML trees was estimated by cophenetic function of package stats, R Core Team, 2019).
by 500 bootstrap (BS) replicates. The quartet sampling method The optimal threshold for unequivocal allele sorting was set to
Frontiers in Plant Science | www.frontiersin.org 6 April 2021 | Volume 12 | Article 659275Šlenker et al. Phylogenomics of Balkan Cardamine
4 (for more details about searching for the optimal threshold Analyses of nrDNA Sequence Data
value, see Supplementary Text 1). This means that if an average nrDNA sequences obtained from molecular cloning were aligned
distance between alleles within the proposed two pairs was more in Geneious v. R10 (Kearse et al., 2012). Sequences of nrDNA
than four-time shorter than the average distance between alleles were also recovered from Hyb-Seq data in HybPiper using
within any other possible arrangement, these pairs of alleles were C. amara (AY260579.1) and C. pratensis (KF987809.1) reference
considered unequivocally different and attributable to different sequences, as specified above for the target nuclear loci, but
homeologs (see also Supplementary Text 2). If the allele sorting omitting the “supercontig” option. The sequences were aligned
did not pass the desired threshold, two options were followed. using MAFFT v. 7.450 (Katoh and Standley, 2013), and only
Either the interallelic SNPs were masked by using Ns on those the ITS region was extracted and kept for further analyses
positions (such unsorted, masked exons were used for further to allow for direct comparison with the cloned data. The
concatenation into gene alignments, see below) or the sample sequences recovered from HybPiper were also proceeded further
was removed from the alignment (for exon-based analyses). As to read-backed phasing to retrieve multiple nrDNA variants,
next, the allele pairs were attributed to different homeologs and as described above. Here were generated four nrDNA datasets
labeled by calculating their distances to the alleles of all diploid as follows: (1) alignment obtained from molecular cloning; (2)
species. The allele pair that was closer to C. amara (proposed consensus assembly with base calling following the majority rule
as the maternal parent according to the plastome phylogeny, criterion, as produced by HybPiper; (3) ambiguous assembly
see below) was marked as homeolog “A”, and the other pair as with intraindividual SNPs replaced by IUPAC codes produced
homeolog “B”. Gene alignments were also assembled, in which by bcftools consensus command; and (4) “multiallelic” (read-
the phased alleles of the respective exons were concatenated backed phasing) alignment, where multiple nrDNA variants were
to genes to obtain longer alignments with potentially stronger retrieved for each sample. Maximum likelihood (ML) trees were
phylogenetic signal. The concatenated exons included those with inferred with RAxML-NG as above.
successfully sorted alleles into “A” and “B” homeologs and those
for which allele sorting was equivocal, with masked interallelic
SNPs. After exon concatenation, the allele sorting into two Analyses of Chloroplast Genome Data
homeologs was verified for each gene, with the same threshold Chloroplast DNA sequences were assembled using Fast-Plast
as set for the exons above, to confirm unambiguity or to remove v. 1.2.8 (available online at: https://github.com/mrmckain/Fast-
the equivocal sample from the gene alignments. Both exon- Plast) with default settings. This pipeline utilizes Trimmomatic
based and gene-based alignments were used for species tree v. 0.39 (Bolger et al., 2014) for initial read cleaning, Bowtie 2
inference in ASTRAL-III. The labeled homeologs, representing v. 2.3.5.1 (Langmead and Salzberg, 2012) to extract chloroplast
the two subgenomes within C. barbaraeoides, were treated as reads using a database of reference plastomes, SPAdes v.
independent accessions. The scripts used are available online at: 3.13 (Bankevich et al., 2012), and afin (available online
http://github.com/MarekSlenker/AlleleSorting. at: https://github.com/mrmckain/Fast-Plast/tree/master/afin) for
de novo sequence assembly. For two accessions, for which
the plastome assembly failed in Fast-Plast, chloroplast DNA
Gene Genealogy Interrogation Analyses sequences were assembled in HybPiper using the C. amara
To explore the significance of phylogenetic placements of the (KY562580.1) reference sequence. The obtained plastome
A and B homeologs of C. barbaraeoides, we performed alternative sequences, comprising the large single copy (LSC), the small
topology testing using the gene genealogy interrogation (GGI) single copy (SSC), and one copy of the inverted repeats (IRb),
analyses (Arcila et al., 2017). This approach accounts for gene were aligned using MAFFT v. 7.450 (Katoh and Standley, 2013).
tree estimation error and evaluates the relative support for Gene annotation (protein coding, tRNA and rRNA genes) was
specific alternative hypotheses. First, the hypotheses to be tested performed with GeSeq (Tillich et al., 2017). Two chloroplast DNA
are defined by performing constrained ML gene tree searches (cpDNA) alignments were generated and used for phylogenetic
with enforced monophyly of the examined clades in RAxML. tree reconstructions, one comprising the complete sequences of
Here we considered three different topologies for both A and B the LSC, SSC, and IRb regions, including intergenic spacers, and
homeologs, following the results of PhyloNet analyses and exon- the other consisting of the concatenated sequences of annotated
and gene-based species trees inferred from phased sequences (see genes only. ML trees were inferred in RAxML-NG as above.
Results for details). The topology test was then performed for each Although it has been widely assumed that plastid genes are
nuclear gene or exon (i.e., considering both exon- and gene-based inherited as a single locus, favoring their concatenation before
phased datasets) by statistically comparing the site likelihood phylogenetic analyses, some recent studies have indicated that
scores obtained for each constrained tree in RAxML using these genes may not be as tightly linked as expected and
the approximately unbiased (AU) topology test implemented in may experience different evolutionary histories. Therefore, the
CONSEL (Shimodaira and Hasegawa, 2001; Shimodaira, 2002). application of multispecies coalescent methods to account for
The AU test performs simultaneous comparisons of multiple potential discordance between gene trees has been advocated also
trees and estimates a P value for each topology. The trees are then for plastome genes (Gonçalves et al., 2019; Walker et al., 2019).
ranked according to the P values, and the results are visualized Following this research, we extracted the most variable protein-
as plots of the cumulative number of constrained gene trees and coding genes (42 genes, those > 350 bp long with > 10 variable
their AU test P values for each topology. positions in the alignment), for which separate ML gene trees
Frontiers in Plant Science | www.frontiersin.org 7 April 2021 | Volume 12 | Article 659275Šlenker et al. Phylogenomics of Balkan Cardamine
were constructed in RAxML-NG. The obtained ML gene trees population C018 of C. acris with increased genome size values not
were then used for species tree inference in ASTRAL-III. attributable to any ploidy level with certainty (Supplementary
Data Sheet 1). The diploid species displayed a wide range
Genomic in situ Hybridization of 2C values, and most of the species differed from each
Genomic in situ hybridization was performed in C. barbaraeoides other in their nuclear DNA content (Supplementary Data
to identify its parental chromosome complements. GISH probes Sheet 1, Figure 2). Populations of C. cf. uliginosa from the
were prepared from total gDNA of eight diploid taxa, C. acris Uludağ Mts. (UD, northwestern Turkey) and the Caucasus
subsp. acris, C. amara subsp. amara, subsp. balcanica, C. lazica, Mts. (AM, Armenia) showed markedly different values (in
C. matthioli, C. penzesii, C. rivularis, and C. uliginosa (see accordance with their genetic divergence, see below) and were
Supplementary Data Sheet 1), which were used in different kept as two separate entities. The smallest genome sizes were
combinations. Mitotic chromosome spreads of C. barbaraeoides observed in C. amara and C. lazica, whereas the largest
were prepared as described above, following Mandáková and ones in C. acris, C. rivularis, and C. cf. uliginosa from the
Lysak (2016a). To remove RNA and cytoplasm, the preparations Uludağ Mts., being more than twice as big as in C. amara.
were treated with 100 µg/mL RNase (AppliChem) in 2 × sodium In accordance with the tetraploid level, the largest nuclear
saline citrate (20 × sodium saline citrate: 3 M sodium DNA content was measured in C. barbaraeoides, but when
chloride, 300 mM trisodium citrate, pH 7.0) for 60 min, and recalculated to the meiotically reduced genome (corresponding
0.1 mg/mL pepsin (Sigma) in 0.01 M HCl at 37◦ C for 5 min, to the 2x level), it showed an intermediate value placed among
and then postfixed in 4% formaldehyde in 2 × sodium saline the diploids (Figure 2).
citrate for 10 min, washed in 2 × sodium saline citrate
twice for 5 min, dehydrated in an ethanol series (70%, 80%, Hyb-Seq Data
and 96%, 2 min each), and air-dried. gDNA of the diploids The sequencing process yielded, on average, 1.28 million
was extracted from silica gel–dried leaves using the DNeasy reads per sample. Adapter trimming, quality filtering and
Plant Mini Kit (Qiagen). Isolated gDNA was labeled with deduplication resulted in an average loss of 1.06% of reads.
either biotin-dUTP or digoxigenin-dUTP via nick translation Of the remaining reads, 54.11% on average were mapped
according to Mandáková and Lysak (2016b). Individual labeled to the target nuclear gene sequences, which ensured mean
probes were stored at −20◦ C until use. The GISH protocol coverage of more than 97 reads per base. Mean coverage of
followed Mandáková et al. (2013, 2014). The immunodetection the plastid genome fluctuated widely among samples, from 13.5
of hapten-labeled probes was performed as follows: biotin-dUTP to 96.23 reads per base (43.56 on average). The same was
was detected by avidin–Texas red (Vector Laboratories) and true for the ITS region of nrDNA, but the mean coverage
amplified by goat anti-avidin–biotin (Vector Laboratories) and of all samples was more than 70 reads per base. Of the
avidin–Texas red; digoxigenin-dUTP was detected by mouse 2,246 exons from 1,235 genes, targeted by the designed RNA
antidigoxigenin (Jackson ImmunoResearch) and goat anti- baits, 1,858 (82.72%) consensus sequences were assembled in
mouse–Alexa Fluor 488 (Invitrogen). After immunodetection, all 22 samples. More than 98% of sequences, that is, 1,829
chromosomes were counterstained with DAPI (2 µg/mL) in supercontigs representing 1,168 genes, passed inspection and
Vectashield (Vector Laboratories). Painted chromosome figures were used for further analyses. The length of the exon alignments
were photographed using an Axioimager Z2 epifluorescence ranged from 63 to 3,548 bp (709 bp on average), whereas
microscope (Zeiss) equipped with CoolCube CCD camera the gene length ranged from 72 to 8,458 bp, with a mean
(MetaSystems). Images were acquired separately for the three of 1,111 bases. The concatenated alignment of all genes was
fluorochromes using appropriate excitation and emission filters 1,297,401 bp long.
(AHF Analysentechnik). The three monochromatic images
were pseudocolored, merged, and cropped using Photoshop
CS (Adobe Systems) and Image J (National Institutes of Phylogenomic Analyses of Diploids
Health) software. Based on Target Nuclear Loci
Maximum likelihood analysis of the diploid taxa, based on the
concatenated dataset of all 1,829 loci (consensus supercontigs)
RESULTS from 1,168 nuclear genes, resulted in a tree with two major
well-supported clades (Figure 3A, Supplementary Figure 1).
Chromosome Numbers and Genome One clade comprised accessions of C. amara and C. lazica
Size Variation in a sister position, supported by high BS as well as quartet
Chromosome counting revealed the tetraploid level with concordance (QC) values. The other major clade exhibited
2n = 32 chromosomes in C. barbaraeoides, determined in a topology with strong to moderate support (QC = 0.42–1,
two populations. Flow cytometry confirmed the tetraploid BS = 69%–100%) and comprised three subclades as follows:
level in all five sampled populations (27 individuals in total; (1) C. acris resolved in a sister position to C. cf. uliginosa
Supplementary Data Sheet 1). Ploidy level screening within from the Uludağ Mts.; (2) C. penzesii together with the
the other studied species showed consistent results, supporting accession of C. uliginosa from the Caucasus; (3) C. apennina
a single, diploid level. Only few exceptions were identified, and C. matthioli in a sister position, together with C. rivularis.
such as one apparently triploid individual of C. acris and Because the two geographically distant accessions of C. uliginosa
Frontiers in Plant Science | www.frontiersin.org 8 April 2021 | Volume 12 | Article 659275Šlenker et al. Phylogenomics of Balkan Cardamine
0.50
0.45
Relative genome size (a.u.) *
0.40
0.35
0.30
0.25
*
0.20
0.15
C. amara C. lazica C. barbaraeoides C. acris C. cf. uliginosa C. uliginosa C. penzesii C. matthioli C. rivularis
(37 ind.) (5 ind.) (20 ind.) (25 ind.) Uludağ Caucasus (11 ind.) (13 ind.) (24 ind.)
(3 ind.) (4 ind.)
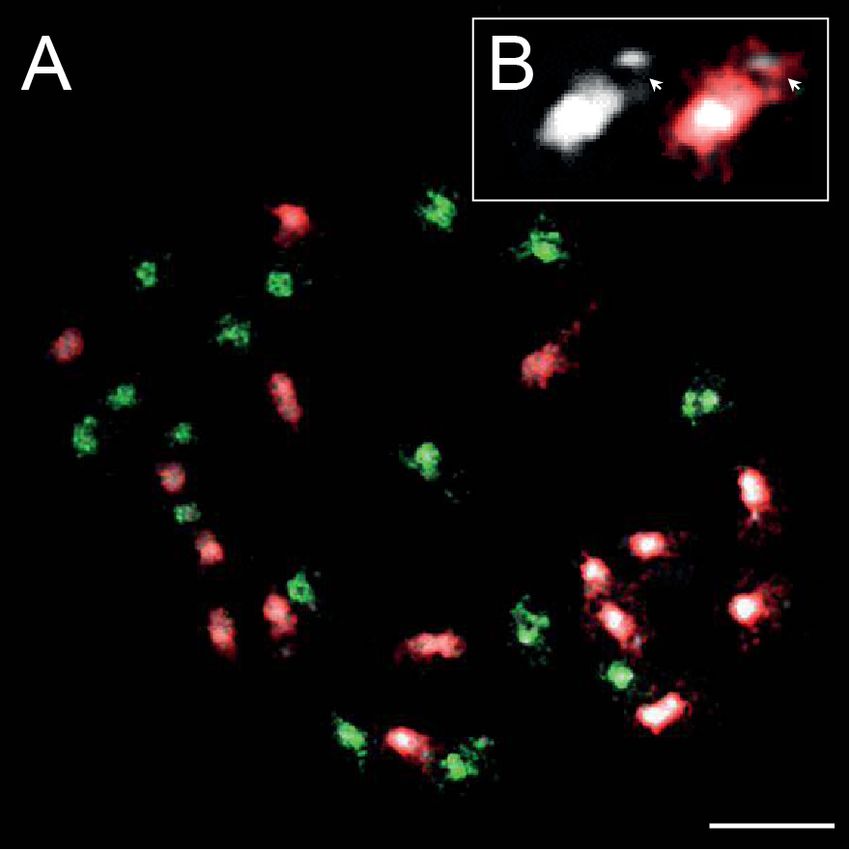
FIGURE 2 | Genome size variation of the Cardamine species under study, based on flow cytometric analyses. Relative nuclear DNA content inferred from DAPI
measurements is presented, given as the ratio of the sample and standard G1 peaks (2C values in arbitrary units, a.u.). In the tetraploid Cardamine barbaraeoides
(marked by asterisk), however, DNA content of the meiotically reduced genome (corresponding to the 2x level) is assessed and presented. Population C018 of
Cardamine acris was omitted because of its divergent DNA content and unclear ploidy level (see Supplementary Data Sheet 1). Boxplot graphs show the 25th
and 75th percentiles (boxes), median values (vertical lines within boxes), and minimum to maximum values (whiskers). Orange color is used for species of the
Cardamine amara group, blue for the other diploids, and black for the tetraploid C. barbaraeoides. The number of analyzed individuals per species is indicated. See
Supplementary Data Sheet 1 for more details and population-level values.
A C. apennina B
QC ≥ 0.75 C. matthioli
0.75 > QC ≥ 0.5
C. rivularis
0.5 < QC ≥ 0
C. penzesii
C. uliginosa
(Caucasus)
C. acris
C. cf. uliginosa
(Uludağ)
C. lazica
C. amara
C. trifolia
C. impatiens
FIGURE 3 | Phylogenetic trees inferred from the complete dataset of 1,168 nuclear genes, based on consensus supercontig sequences of diploid Cardamine
accessions. Orange color is used for the clades and branches of the Cardamine amara group, whereas blue is used for the remaining diploids resolved in the sister
position. (A) Maximum likelihood tree inferred in RAxML-NG from the concatenated genes. Multiple individuals per species are shown collapsed (see
Supplementary Figure 1 for the fully labeled version of the tree including bootstrap support). Branch support is indicated by quartet concordance (QC) values
(colored circles in the nodes). (B) Species tree inferred in ASTRAL-III. Branch support is indicated by pie charts, depicting three local posterior probabilities for the
given branch (dark blue for the main topology as resolved here and light blue for the alternative ones; not shown for the fully supported branches when the local
posterior probability for the present topology equals 1).
(Caucasus vs. Uludağ) appeared clearly differentiated in all from 1,168 ML gene trees, based either on consensus sequences
datasets (including nrDNA and cpDNA data, see below), (Figure 3B) or phased allele sequences (results not shown),
they were treated as two distinct entities in all multispecies showed identical topologies and branch support. These trees
coalescent methods. The species trees inferred using ASTRAL were also fully congruent with the ML tree of the concatenated
Frontiers in Plant Science | www.frontiersin.org 9 April 2021 | Volume 12 | Article 659275Šlenker et al. Phylogenomics of Balkan Cardamine
A C. impatiens B
C. trifolia
0.258 0.742
barC007_103
barC010_102
C. barbaraeoides
C. cf. uliginosa
C. trifolia
C. apennina
C. impatiens
C. uliginosa
C. matthioli
C. penzesii
C. rivularis
(Uludağ)
(Caucasus)
C. acris C. lazica C. amara
C
barC011_101
FIGURE 4 | Phylogenetic analyses indicating the hybrid (allopolyploid) origin of the tetraploid Cardamine barbaraeoides. Orange color is used for the accessions
from the Cardamine amara group (C. amara and Cardamine lazica), blue for the remaining diploids, and black for the tetraploid C. barbaraeoides. (A) Supernetwork
representation of quartets generated in SuperQ, which was derived from 1,168 nuclear gene trees estimated in RAxML and based on consensus supercontig
sequences. (B) Species network inferred in PhyloNet from the same set of 1,168 nuclear gene trees. Inheritance probabilities are shown along the branches
indicating the origin of C. barbaraeoides. (C) Bayesian clustering of SNP datasets in STRUCTURE at optimal K = 2, obtained from variant calling in a selection of 947
most informative genes. The coloring in the graph indicates the sample assignment to the two genetic clusters. Thick vertical lines separate different species.
dataset. Two branches that received lower QC values in the admixture was observed in the tetraploid C. barbaraeoides
ML tree, congruently, showed slightly decreased local posterior (Figure 4C). Thus, all these analyses showed strong conflict
probabilities in the species trees. in the consensus supercontig sequences of the tetraploid and
suggested an allopolyploid origin of C. barbaraeoides, its
progenitors being derived from the two major clades of diploids.
The Tetraploid Genome of
C. barbaraeoides: Insights From Target
Nuclear Loci Identification of Parental Progenitors: Gene Tree and
Displaying Conflict: Network Analyses Based on Species Tree Reconstructions Based on Phased
Consensus Sequences and Bayesian Clustering of Allele Sequences
SNP Variation Read-backed phasing yielded two alleles per exon for diploids and
The SuperQ network derived from 1,168 ML gene trees based on four alleles for tetraploids. In diploids, the level of heterozygosity
consensus sequences displayed two well-differentiated groups of varied widely from 10.28% to 51.34% (34.01% on average). Allele
diploid taxa (corresponding to the two major clades as resolved phasing in the tetraploid C. barbaraeoides yielded similar results
above) and strong conflict in the placement of the tetraploid among the samples. Homozygous (10.02% on average), fully
accessions (Figure 4A). The species network analysis (PhyloNet) heterozygous (13.5%), and partially heterozygous exons with two
based on the same set of ML gene trees suggested a hybrid different alleles in the ratio 1:3 (8.4%) were relatively rare, while
origin of C. barbaraeoides as well, with one ancestral lineage partially heterozygous loci with two different alleles in the ratio
from the clade of the C. amara group (comprising C. amara 2:2 (21.54%) and especially those with three different alleles
and C. lazica) indicating a greater inheritance probability (74.2%) (46.53%) were much more frequent (Supplementary Figure 3
and the other pointing to the C. cf. uliginosa accession from the and Supplementary Table 1). The complete set of 1,829 targeted
Uludağ Mts. (25.8%), which was sister to C. acris (Figure 4B). exons of C. barbaraeoides, each phased to four alleles, was further
Interestingly, some of the repeated PhyloNet runs indicated a processed to allele sorting.
reticulation event also for C. penzesii, involving C. cf. uliginosa The optimized threshold for allele sorting invalidated 47.64%
from the Uludağ and the Caucasus as the two ancestors sequences of C. barbaraeoides, which could not be sorted
(Supplementary Figure 2). unequivocally. They definitely regarded the homozygous exons
Single-nucleotide polymorphisms calling utilized 947 and partially heterozygous one (those with the alleles in the ratio
genes, which harbored at least 10 SNPs across the samples. 1:3) and part of the other heterozygous exons (Supplementary
STRUCTURE analyses of 500 SNP datasets (each with one Table 1). Alleles from all three samples of C. barbaraeoides were
SNP randomly drawn per gene) identified the optimal genetic successfully attributed to the A and B homeologs only in 612
partitioning at K = 2, with the same two clusters of diploid exons (33.46%), but on the other hand, more than 70% of exons
taxa as identified in the trees above, whereas significant genetic (1,287) kept at least one sample with successfully sorted alleles
Frontiers in Plant Science | www.frontiersin.org 10 April 2021 | Volume 12 | Article 659275Šlenker et al. Phylogenomics of Balkan Cardamine
and thus held at least partial information available for coalescent- results clearly favored the topology in which C. barbaraeoides
based tree reconstruction. At the gene level (with concatenated homeolog A was resolved in a sister position to the clade of
exons), attempts to sort the alleles into two different homeologs the C. amara group (Figure 5). This topology was significantly
succeeded in 38.13% of sequences. Alleles from all three samples supported by a greater number of genes and exons than the
of C. barbaraeoides were successfully attributed to A and B alternative topologies (P < 0.05) and agrees also with the
homeologs in 274 genes (23.46%), and those from at least one exon-based ASTRAL species tree. Two alternative topologies,
sample were present in 621 genes (53.17%). i.e., with C. barbaraeoides homeolog A being sister to either
Subsequently, for species tree inferences in ASTRAL, we C. amara (as seen on the gene-based species tree, Figure 5B) or
assembled multiple datasets that were derived from phased C. lazica, received much less support. As for the placement of
exon- and gene-based alignments. For exons, they included the the B homeolog of C. barbaraeoides, the GGI analyses favored
following: No. 1, a dataset comprising all 1,829 exons with zero to the topology in which C. barbaraeoides was placed in a sister
three tetraploid accessions retained for each exon (i.e., a dataset position to the clade comprising C. acris and C. cf. uliginosa from
with missing accessions allowed); No. 2, a dataset comprising the Uludağ, in accordance with the ASTRAL species trees. The
974 exons each with at least two tetraploid accessions (a dataset second topology, with C. barbaraeoides being sister to C. acris,
allowing at most one accession missing); and No. 3, a dataset was significantly supported by a much smaller number of trees,
comprising 612 exons, in which all three tetraploid accessions followed by the third topology (C. barbaraeoides sister to C. cf.
were retained for each exon. The species trees inferred from all uliginosa from the Uludağ, suggested by PhyloNet) with only
three datasets recovered the same topology and differed only negligible support (Figure 5).
in some branch support values (Figure 5A, Supplementary Slightly different and also equivocal GGI results in some cases
Figures 4A–C). As for the diploid taxa, the topology was largely were obtained when including also the exons or genes, in which
congruent with that of the trees derived from the diploid one or two accessions of C. barbaraeoides were missing (i.e.,
sequence data only (Figure 3, see above), differing only in the one individual kept at minimum) because of failed allele sorting
placement of the species pair C. penzesii–C. uliginosa from the (1,287 exons or 621 gene in total). In those datasets, the two
Caucasus. The position of this species pair, however, received topologies with C. barbaraeoides homeolog B being sister either
a relatively low QC value in the tree of diploids (Figure 3A). The to C. acris or to the clade of C. acris and C. cf. uliginosa from
A homeolog of C. barbaraeoides was resolved in a sister position the Uludağ received similar support, and none of them could
to the C. amara clade, comprising C. amara and C. lazica. The be strongly favored over the other (Supplementary Figure 4).
B homeolog of C. barbaraeoides was placed in a sister position The placement of homeolog A in the dataset of 1,287 exons
to the clade consisting of C. acris and C. cf. uliginosa from the also remained equivocal, with similar support given for its sister
Uludağ (Figure 5A). position to either C. amara or to the clade of the C. amara group
Similarly, as for the exons, three datasets of phased gene-based (comprising also C. lazica). In the dataset of 621 genes, the same
alignments were assembled: No. 1, a dataset comprising all 1,168 topology for C. barbaraeoides homeolog A was favored as in the
genes with zero to three tetraploid accessions retained for each dataset of 274 genes (Supplementary Figure 4).
gene; No. 2, a dataset comprising 441 genes each with at least two
tetraploid accessions; and No. 3, a dataset comprising 274 genes,
in which all three tetraploid accessions were retained for each
Analyses of nrDNA Polymorphisms
gene. The species trees recovered the same topology for all three Obtained From Molecular Cloning and
datasets, with differences only in branch support (Figure 5B, Genome Skim Data
Supplementary Figures 4D–F), and were almost identical to The ITS alignment obtained from molecular cloning was
those inferred from exon-based data. The only difference was in 623 bp long and comprised 180 sequences from 48 ingroup
the placement of the A homeolog of C. barbaraeoides, which was individuals. It contained 209 variable sites (33.5%) and 99
resolved here in a sister position to C. amara (and not to the parsimony-informative sites (15.9%). High intraspecific and even
whole C. amara clade as above in exon-based trees). intraindividual diversity of the ITS variants (ribotypes) was
When computing distances between the alleles retrieved from revealed in the diploid taxa (Supplementary Data Sheet 1).
C. barbaraeoides and successfully sorted into A and B homeologs Nevertheless, the ribotypes observed within individuals and
and the alleles of each diploid species, it becomes apparent that within species were mostly similar and clustered together, with
the A homeolog is closest to C. amara alleles, tightly followed the exceptions of rare divergent ribotypes found in a single
by those of C. lazica, whereas the B homeolog is closest, almost accession of C. acris (C015-107) and C. penzesii (DEM7)
equally, to the alleles of C. cf. uliginosa from the Uludağ and those (Supplementary Figure 6). In accordance with the data from
of C. acris (Supplementary Figure 5). the target nuclear loci, genetic differentiation was observed
within C. uliginosa; ribotypes from the Uludağ samples were
Alternative Topology Testing: GGI Analyses nested within the diversity of C. acris, whereas those from the
Topology tests based on the GGI analyses yielded robust and Caucasus appeared closest to C. penzesii or C. matthioli (Figure 6,
highly congruent results both from the exon- and gene-based Supplementary Figure 6). In the tetraploid C. barbaraeoides,
datasets, when considering the set of trees in which alleles the vast majority (approximately 78%) of ITS sequences were
from all three accessions of C. barbaraeoides were present (i.e., placed within the C. amara clade. Three ribotypes (i.e., 4.6%)
successfully phased and sorted, 612 exons or 274 genes). The GGI of C. barbaraeoides (found in three different accessions),
Frontiers in Plant Science | www.frontiersin.org 11 April 2021 | Volume 12 | Article 659275You can also read