CONNECTOMICS OF HUMAN ELECTROPHYSIOLOGY - PSYARXIV
←
→
Page content transcription
If your browser does not render page correctly, please read the page content below
Connectomics of Human Electrophysiology

                 Sepideh Sadaghiani1,2, Matthew J Brookes3 and Sylvain Baillet4

1. Department of Psychology, University of Illinois, Urbana-Champaign, IL, USA
2. Beckman Institute for Advanced Science and Technology, University of Illinois, Urbana-Champaign, IL,
   USA.
3. Sir Peter Mansfield Imaging Centre, School of Physics and Astronomy, University of Nottingham,
   University Park, Nottingham, NG72RD, UK.
4. McConnell Brain Imaging Centre, Montreal Neurological Institute, McGill University, Montreal, QC,
   Canada.

Abstract - We present both a scientific overview and conceptual positions concerning the
challenges and assets of electrophysiological measurements in the search for the nature and
functions of the human connectome. We discuss how the field has been inspired by findings and
approaches from functional magnetic resonance imaging (fMRI) and informed by a small number
of significant multimodal empirical studies, which show that the canonical networks that are
commonplace in fMRI are in fact rooted in electrophysiological processes. This review is also an
opportunity to produce a brief, up-to-date critical survey of current data modalities and signal
processing methods available for deriving both static and dynamic connectomes using
electrophysiological data. We review hurdles that challenge the significance and impact of current
electrophysiology connectome research. We then encourage the field to take a leap of faith and
embrace the wealth of electrophysiological signals, despite their apparent, disconcerting
complexity. Our position is that electrophysiology connectomics is poised to inform testable
mechanistic models of information integration in hierarchical brain networks, constructed from
observable oscillatory and aperiodic signal components and their polyrhythmic interactions.

    1) Introduction
        Brain connectomics is a young and fast-growing sub-discipline of neuroscience that has
transformed human brain mapping (Raichle, 2009; Sporns, 2010). Spawned from MRI at the turn
of the 21st century and boosted by mathematical instruments such as graph theory, connectome
studies aim to provide an integrative view of brain structure and function, in health and disease.
Access to larger and deeper multimodal research data repositories and the growing sophistication
of analytical methods have contributed to a fast-evolving landscape of MRI-based derivations and
interpretations of the human connectome (see e.g., Glasser et al., 2016). In this context, we
interrogate the singular role and assets of electrophysiology (e-phys) in connectome research.

        Electrophysiological techniques are historically first and remain the most accessible and
most published in basic (in both human and animal models) and clinical neuroscience (Baillet,
2017). They consist of a remarkably diverse portfolio of methodologies that has evolved with
decades of progress in sensing and computing technologies. Their specific strengths are in: 1)
the ability to assess neural activity directly, contrasting indirect metabolic signals, 2) their
millisecond temporal resolution (a consequence of the direct measurement), 3) their versatility to

                                                                                                     1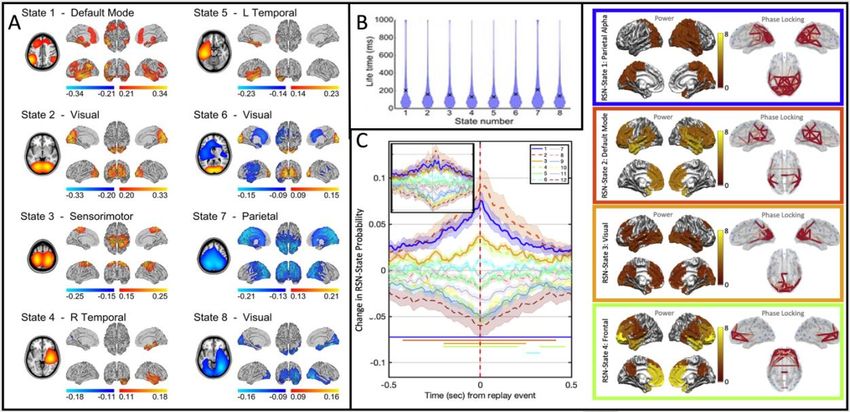
record at multiple spatial scales, from single cells to the whole brain, 4) the possibility to establish
causal effects via concurrent neurostimulation, and 5) the growing availability, cost-effectiveness
and data quality of portable, ambulatory instruments.

        Our goal in this review paper is to explain why these unique assets make e-phys
approaches particularly pertinent to connectome research. We also emphasize that e-phys data
can effectively be combined with other types of neurodata and technologies: from the relatively
straightforward registration of invasive recording sites with structural MRI, to simultaneous scalp
data collection with functional magnetic resonance (fMRI) or positron emission tomography (PET),
all potentially synchronized with neurostimulation either intracranially or non-invasively (with e.g.,
intracranial electrical stimulation in patient participants, transcranial magnetic stimulation (TMS),
transcranial direct current stimulation (tDCS) or transcranial alternating current stimulation (tACS)
- see e.g., (Driver et al., 2009) for a review).

       This versatility and flexibility extend beyond human neuroscience. E-phys techniques are
available in vitro, in cell cultures, tissue slices and organoids (Trujillo et al., 2019). They also
enable unique metrics in behaving animal models, simultaneously combined with calcium imaging
or specific pharmacological and optogenetic manipulations (Kim et al., 2017). The ability to marry
these ex-vivo or animal studies with, for example, whole head non-invasive investigations in
humans with electroencephalography (EEG) or magnetoencephalography (MEG) offers the
powerful prospect to develop an understanding that spans from in-vitro models to human
neuroimaging, as a mechanistic common denominator across species and spatial and
behavioural scales.

        In sum, e-phys encompasses a set of cross-cutting scientific technologies that provide
unique access to the neural dynamics of brain systems. In principle, they can deliver unique
insight on how functional communication in brain networks forms and dissolves, and in doing so
enables a range of complex behaviours, at natural time scales: from the perception and
processing of naturalistic stimuli (e.g., Donhauser and Baillet, 2020), to the dynamics of decision
making and complex motor adaptation (e.g., Cheyne, 2013; Pisauro et al., 2017).

         E-phys connectomics investigations are also uniquely positioned to address a wide range
of clinical neuroscience questions. For instance, scalp and intracranial EEG are widely used in
the epilepsy clinic (Henry, 2006). So far, the purpose has been to identify the locus of seizures,
with the underlying hypothesis that a circumscribed seizure onset zone would entrain the rest of
the brain to generate a seizure. However, more recent epilepsy research has gradually evolved
towards a more network-oriented view, whereby in non-localizing cases, seizures are the
consequence of pathological interactions in an anatomically distributed seizure onset network
(McCormick and Contreras, 2001). E-phys investigations at multiple spatial scales in behaving
patients (e.g., Despouy et al., 2020), combined with electrostimulation testing at well-defined brain
locations (Kim, 2016), are uniquely poised to reconcile complex brain network activity with patient-
specific behaviour in neurocognitive tasks (Thiery et al., 2020), and the real-time unfolding of their
seizure semiology (Moreau et al., 2020).

                                                                                                      2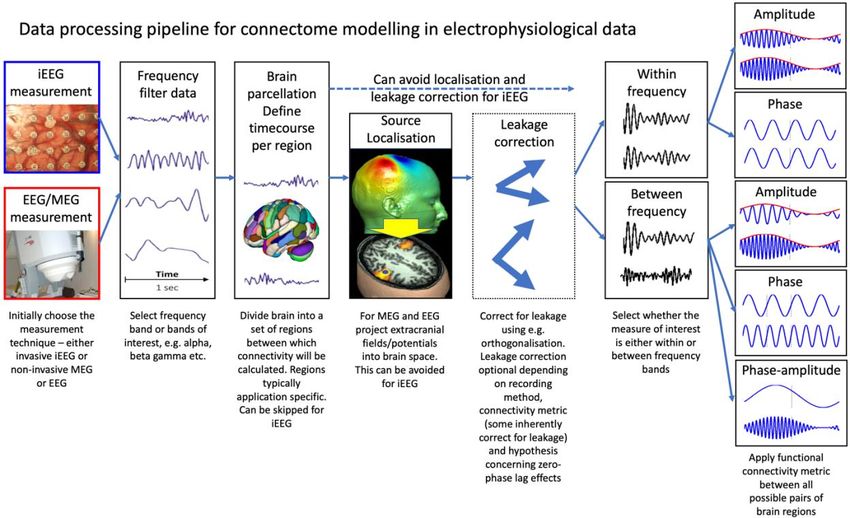
In neurodegenerative brain disease research, e-phys connectomics have the capacity to
enable the early detection of pathophysiological processes affecting brain networks, before
clinical symptoms emerge and before structural alterations are visible in MRI, at a lower cost than
PET and with the anatomical specificity that emerging blood and other fluid tests lack (Jeromin
and Bowser, 2017). In Alzheimer’s disease (AD) for instance, very early alterations of synaptic
regulation in cell assemblies may be detectable with e-phys investigations, before these
neurophysiological changes provoke the accumulation of A-beta plaques and Tau neurofibrillary
tangles that invade brain networks at a larger scale, inducing tissue sclerosis and functional
alterations (Palop et al., 2006).

        Similarly, in neuropsychiatry e-phys connectomes have shown promise in the identification
of putative markers of disease progression, and potentially offer useful information which may
ultimately enable stratification of patients (Uhlhaas and Singer, 2010).

       Taken together, e-phys techniques stand out as having unique potential to clarify the
mechanistic nature of network interactions across the widest possible range of spatial and
temporal scales: from small cell assemblies and circuits to the whole brain, and from millisecond
changes to chronic recordings. These techniques provide information in tissue cultures, in
behaving animal models, in humans through development and aging, in premature new-borns
and complex behaving adults, and from minimal, altered to full states of consciousness (e.g.,
Engemann et al., 2018).

       Considering such unique assets and the exciting promise for basic and clinical
neuroscience, one needs to question why e-phys studies to date have not been more pervasive
and impactful in the connectome literature. We review this question in depth, highlighting striking
contributions of e-phys in connectome research, and suggesting pathways to mitigate the
complexity and practical pitfalls of e-phys techniques, to maximize their impact on our
understanding of the integrative nature and mechanisms of the human connectome.

         To that end, we organized this position paper in 4 sections. In Section 2, we outline briefly
the methods that are available for e-phys data collection and the analysis techniques commonly
used in connectome investigations. We then discuss briefly some of the more recent findings
relating to dynamic (time-resolved) functional connectivity derived from e-phys data, reviewing
current and emerging methods and nascent findings. In Section 3, we describe why the rich and
complex features of ongoing e-phys activity (i.e., not averaged with respect to a stimulus input or
behavioural event), although traditionally ignored, are meaningful, both in terms of their relation
to the structural and functional MRI connectome, and their behavioural significance. We call for a
leap of faith from connectome researchers to embrace this richness in the e-phys signals available
to them. Finally in Section 4, we advocate for testable concepts and mechanistic approaches to
address the difficult questions posed by (e-phys) connectomics; we first highlight the main
technical challenges in dealing with connectivity measurements from time-resolved data, then put
forward emerging, holistic considerations to account for functional coupling manifested by neural
oscillations.

                                                                                                    3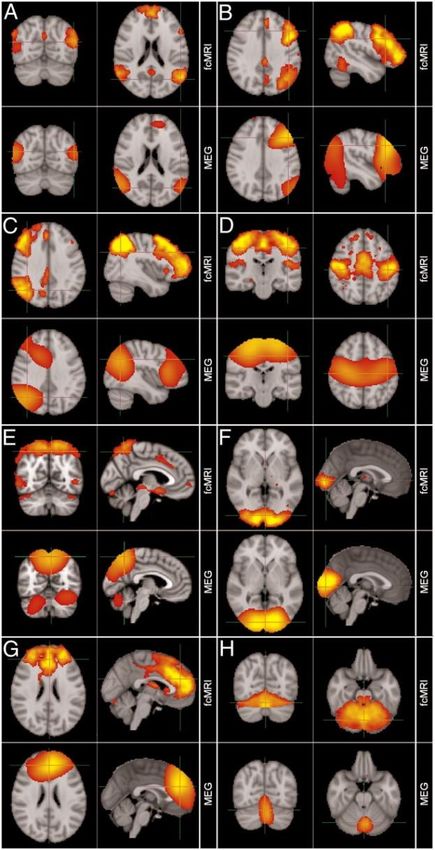
2) Measuring the electrophysiological connectome

2.1) Data collection modalities of human e-phys
         Assessment of e-phys connectivity between brain regions necessarily requires metrics of
brain function which have 1) high fidelity, with sufficient signal-to-noise ratio (SNR) to enable
accurate characterisation of statistical interdependencies between signals from separate brain
regions; and 2) sufficient spatial resolution to ensure that connectivity estimation between regions
is not degraded substantially by spurious signal interactions (“leakage” or “cross-talk”) from one
region to another. With this in mind, e-phys measurements can be divided into two categories:
         Non-invasive methods encompass electroencephalography (EEG) (Berger, 1929) and
magnetoencephalography (MEG) (Cohen, 1972); the former measures electrical potential
differences at the scalp surface generated by fluctuating current flow in the brain; the latter
measures the corresponding magnetic induction generated by the same current fluctuations. Both
probe e-phys activity in relatively large (>50,000) populations of neurons (Murakami and Okada,
2006). The main neurophysiological generators are currents induced by post-synaptic potentials
(local field potentials, LFPs) primarily from cortical pyramidal cells (Baillet, 2017).
         Invasive measurements, often collectively termed intracranial-EEG (iEEG), range from
electrocorticography (ECoG) (where electrode arrays are placed under the dura mater on the
brain surface) to depth electrodes targeting deeper structures. Measurement of localised electrical
potential at each electrode site, relative to some reference, provides direct assessment of local
electrical activity. Reference placement generally determines the size of the neuronal population
from which the measurement is made. Measurements commonly reflect LFPs from cortical
pyramidal cells (similar to MEG/EEG) summed over thousands of neurons (Rasch et al., 2009).
However, some depth electrodes can also measure action potentials, including in behaving
humans (Fried et al., 1997).

        There is no single “best technique” to assess e-phys connectivity. Indeed, the technique
of choice depends on the scientific question. Intracranial EEG typically provides the highest SNR,
with high spatial resolution, but has limited spatial coverage of the brain volume. iEEG is highly
invasive and therefore restricted to data from surgical patients who volunteer to participate in
research. The implantation montage is idiosyncratic of each patient case, which challenges group
studies and replication of findings. Further, the data collected may be affected by abnormal neural
processes, since electrode locations are decided based on pathophysiological considerations.
This issue can be remedied to some degree by excluding electrodes that are close to epileptic
foci or have extensive epileptiform activity, as well as removing epochs with epileptiform activity
from all electrodes. Crucially for connectome studies, spatial coverage of recordings is sparse in
single individuals, which precludes whole-brain connectivity studies, although pooling across
several patients can alleviate the issue.

        The signals measured with MEG and EEG mirror those of iEEG, with the substantial
benefits of providing synoptic coverage of the brain, noninvasively and both in patients and
healthy participants. However, with extracranial sensors further away from brain sources, MEG
and EEG have lower SNR compared to iEEG (especially at high frequency). Importantly for
connectome derivations, multiple sensors pick up activity from the same electrical source in the

                                                                                                  4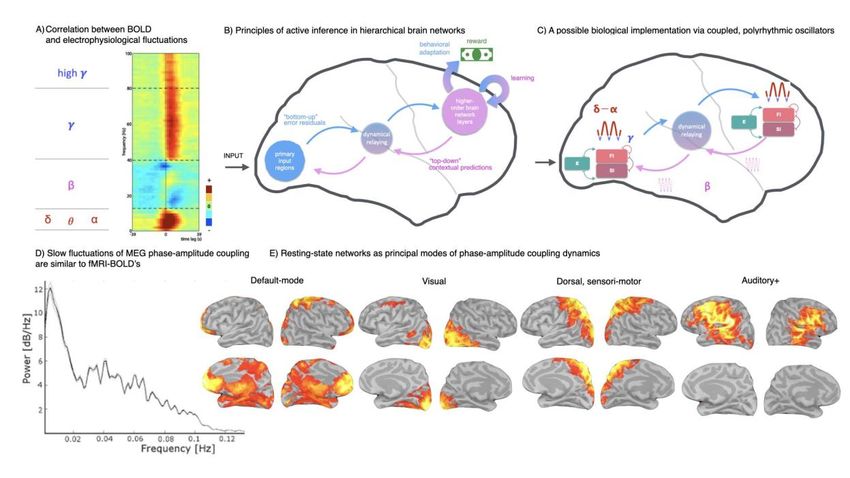
brain - an effect known as volume conduction (in EEG) or field spread (in MEG) that introduces
leakage between scalp measurement points. Inverse modelling (reconstructing source space
estimates of brain current based on scalp-level field/potential measurement) of EEG/MEG
generators improves this issue (Schoffelen and Gross, 2009). Nevertheless, the ill-posed nature
of the inverse problem means that even in source space, leakage can still occur between regions
which complicates connectivity measurements (see also Section 2.2 and Table 2). Compared to
EEG, MEG offers higher spatial accuracy since it is less sensitive to the geometry and
conductance of head tissues. MEG is also less susceptible to biological artifacts (Baillet, 2017;
Boto et al., 2019). However, MEG is also more expensive to purchase and operate, and is
therefore less accessible. Significant progress on sensing technology promises the delivery of
new, more flexible and affordable MEG instruments which have recently proved effective for
connectivity measurement (Boto et al., 2021).
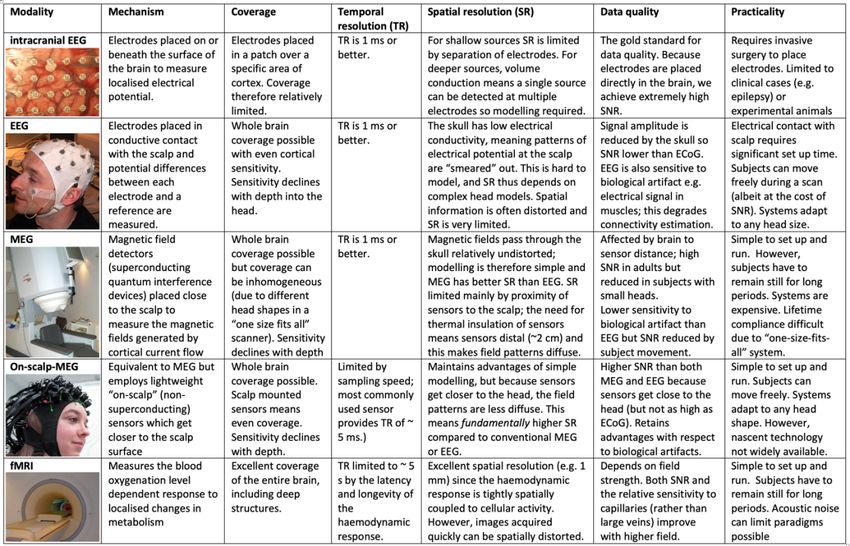
In Table 1, we summarise the similarities and differences within the family of e-phys
recording techniques. Most importantly, all of these techniques can offer useful and high-fidelity
measures of connectivity, which complement the structural and functional connectomes
measured using MRI/fMRI.
Table 1 -- Methods to measure electrophysiological activity
Intraoperative photo of intracranial EEG is reprinted with permissions from (Miller, 2019)
5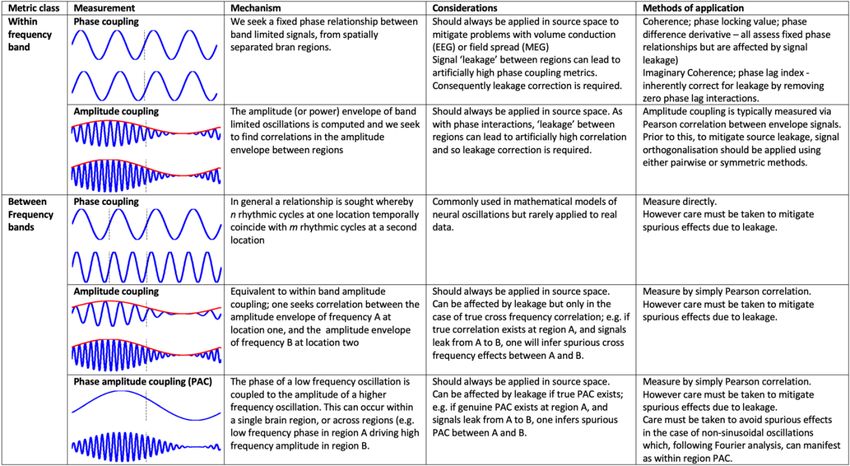
2.2) Current approaches to electrophysiological connectivity assessment
        Regardless of how they are measured, e-phys signals are dominated by “oscillations”
which exist across a broad (0-1000 Hz) frequency range. Most signal power is concentrated in
the low frequencies (1-100 Hz), and this range is subdivided into bands, traditionally defined as
delta (1-4 Hz), theta (4-8 Hz), alpha (8-13 Hz) beta (13-30 Hz) and gamma (30-100 Hz). At very
low frequencies, infra-slow fluctuations can also be measured. This rich multi-spectral signal
offers myriad metrics by which to compute statistical interdependencies between signals derived
from separate brain locations. Such metrics, because they are applied directly to e-phys data,
offer perhaps the best means to understand the mechanisms of functional coupling. However,
equally they also mean that the e-phys connectivity literature is complex and often dominated by
high-level methodological discussions which can obfuscate the neuroscientific findings.

        Broadly, e-phys connectivity metrics can be split into two categories, within-frequency
band (e.g., alpha-to-alpha) and between frequency bands (e.g., alpha-to-gamma). Two classes
of within-frequency connectivity metric are currently popular: fixed phase relationships (e.g.,
coherence) and amplitude correlation measures. These disparate techniques provide insight into
two separate modes of functional connectivity (Engel et al., 2013). For between-frequency
measures, there are three typical families of techniques: phase-phase, amplitude-amplitude, and
phase amplitude coupling, the latter being the most commonly applied. We summarise these
measures in Table 2, with a quick, practical overview of their respective physical foundations,
alongside the primary methodological considerations that must be taken into account prior to
using them.

Table 2 -- Mathematical techniques to characterize connectivity between electrical signals derived
from separate brain regions.

                                                                                                6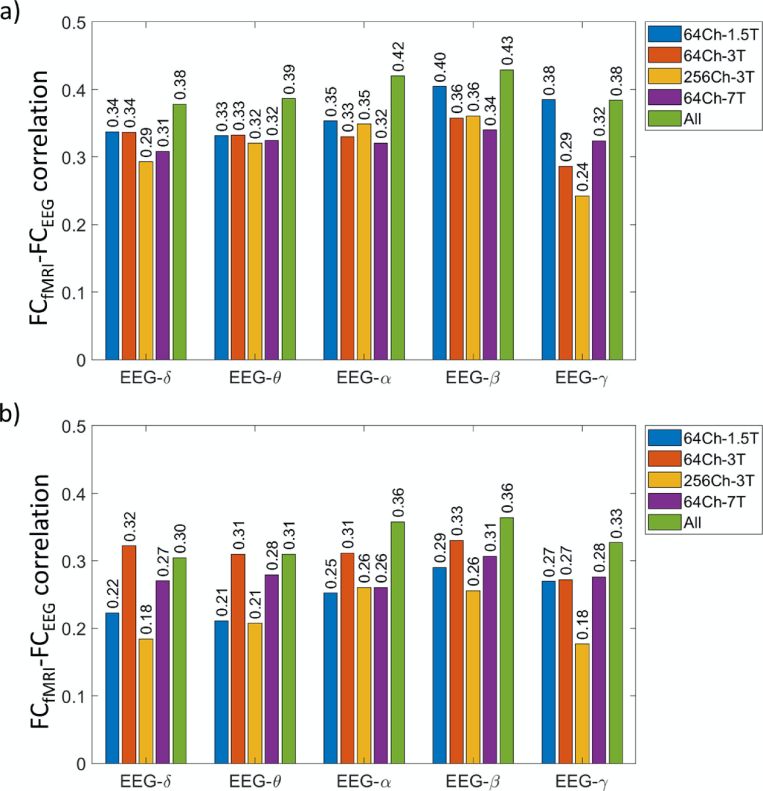
Importantly, and as with all types of biosignal analysis, the biggest caveat to e-phys
connectivity is data quality, with specific attention to inherent limitations in terms of spatial
resolution and signal leakage - especially for MEG/EEG. Reliable and robust methods to mitigate
leakage have been introduced in recent years. Most of these methods rely on the mathematical
principle of signal “orthogonalization” (Colclough et al., 2015; Hipp et al., 2012), which in practice
attenuates signal interactions that result in strict and fixed zero-phase lag between regions, which
are a signature of spurious interactions. As discussed in Section 4, we emphasize and
acknowledge that whilst this pragmatic approach does reduce leakage, genuine zero-phase lag
delays are commonly observed between neurophysiological signals, even between distant brain
nodes, and these true interactions are lost. Hence, interpretation of “orthogonalized data” needs
to take such blind-spot effect into consideration. A second methodological caveat is signal
artifacts affecting data quality, such as from muscle activity or movements. These artifacts are
typically worse in EEG, although still significant in MEG (especially in terms of head movements
in the MEG sensor array), while essentially minimal in iEEG. Methods are available in free and
commercial software to mitigate these unwanted signals.

         Finally, we note that in addition to the class of metrics defined above, which estimate
connectivity without indicating the “direction” of information flow, a number of directed measures
have been developed or adopted in e-phys connectomics. These include but are not limited to
Granger causality, partial directed coherence and dynamic causal modelling. Such measures
exploit the high temporal resolution of e-phys measurements to infer the average (over some time
window) direction of information flow between two regions. These techniques are typically more
complex and difficult to deploy in practice, especially over longer data length, essentially because
of sophisticated parameter identification requirements, but nevertheless offer a means to assess
directionality in brain networks in relation to cognition and behaviour.

       A schematic overview of the basic methodology to process e-phys data to derive an e-
phys connectome measure is shown in Figure 1.

                                                                                                    7
Figure 1 -- a schematic overview showing the process by which connectivity is calculated in e-phys
data. Intraoperative photo of intracranial EEG is reprinted with permissions from (Miller, 2019)
2.3) Towards a dynamic, time-resolved connectome
In the context of large-scale connectomics, the connectivity metrics described above are
typically applied across many minutes, or sometimes hours of data, and are referred to as the
“static” connectome (analogous to common time-averaged connectivity in fMRI). This approach
necessarily assumes that the interaction between two neural assemblies can be summarized by
a single number (averaged in time). In truth, this is not the case as the brain must continuously
form and dissolve networks, on a rapid (millisecond) timescale, in response to cognitive and
behavioural demands that are constantly in flux. Consequently, the human connectome should
be considered a dynamic process, and e-phys connectivity offers, at least in principle, a means
to assess these dynamics. Indeed, perhaps one of the most exciting prospects of e-phys is the
promise of exploiting high time resolution to measure dynamic connectivity.
Sliding window approaches
At the simplest level, dynamic connectivity can be calculated via a ‘sliding’ window; i.e.
one calculates connectivity between regions using the methods described in Table 2, but applied
to a small segment (typically a few seconds) of data. This window of interest is then moved in
time to track dynamics of that connection. This approach developed in fMRI (Chang and Glover,
2010) has been used extensively in e-phys (O’Neill et al., 2017a; cf. Section 3.3). A key point is
that the utility afforded by such a technique depends on the length of the window; this, in turn,
depends on the extent to which one can get a reliable metric of connectivity in a short time frame,
which itself depends on the number of degrees of freedom in the signal.
8The number of temporal degrees of freedom, n, in a signal is estimated as n = 2BwD,
where Bw is the signal bandwidth and D is the width, in time, of the window. Whereas the
bandwidth of a (‘classically’ acquired) fMRI signal is ~0.25 Hz (Yuen et al., 2019) the nominal
bandwidth of the e-phys signal is at least 100 Hz (and can be much larger with reproducible
signals up to and including 1KHz). This means that (at face value) time windows for sliding-
window based connectivity measures can be ~400 times shorter in e-phys compared to fMRI.
This, in turn, makes e-phys the technique of choice for dynamic functional connectivity
measurements. In practice, the e-phys signal contains different features in different bands, and
one often looks to compute connectivity within narrowband signals (e.g., alpha, beta, gamma
bands). This means that the improvement in time resolution over fMRI is not as dramatic.
Nevertheless, even for the narrowest bands (e.g., the 8-13 Hz alpha band) the bandwidth remains
at 5 Hz, affording at least a 20-fold improvement in temporal resolution over fMRI.
However, despite the high bandwidth of e-phys signals, the width of the window for sliding
window approaches remains a fundamental limitation; one really wants the window width to match
the timescale of network fluctuations in the brain. However, in practice this is almost certainly
unknown, and may change over the course of an experiment. Likewise, it may be different for
different networks and vary with the age, or pathological state of the participant. It is also possible
that the timescale of fluctuations in connectivity may simply be too short for viable measures of
connectivity within the window (e.g., for alpha band, a 1-s window, which is still a long time
compared with cognitive processing, only contains 10 degrees of freedom). For these reasons,
whilst the sliding window remains a useful and conceptually straightforward tool, it is likely that
other methods could better exploit the high temporal resolution that e-phys affords.
Beyond the sliding window
A number of techniques have attempted to examine connectivity “moment-to-moment”,
i.e., gain an estimate of functional connectivity for every sample in an e-phys time course. Here,
an available technique is the phase-difference-derivative (PDD) (Breakspear et al., 2004). Briefly,
PDD probes the existence of a fixed phase relationship; the instantaneous phase of signals from
distal regions is acquired and the difference between them measured over time. The derivative of
this phase difference indicates whether the phase difference is changing. If the difference
derivative is zero, a transient fixed phase relation is implied. In unaveraged or resting state task
free data, PDD and similar metrics tend to be unstable, and one ends up averaging over time
windows which ultimately, leads to the same problem faced by sliding windows. However, in task-
based studies, assuming the same experimental paradigm is repeated many times, PDD can be
averaged over trials, an approach that has offered useful insights. For example, Tewarie et al.
(2019) showed that high amplitude beta oscillations in the motor cortex were related to increased
levels of connectivity between the primary motor cortex and other brain regions within the
sensorimotor system.
One technique, developed in recent years, which is able to sidestep the windowing
problem - even in resting state data - is based on hidden Markov modelling (HMM; Baker et al.,
2014; Woolrich et al., 2013) (to date this technique has been applied mostly to MEG, but recent
9papers have employed it for both EEG and fMRI (Hunyadi et al., 2018)). The HMM assumes that
e-phys data are governed by a series of mutually exclusive hidden “states”. This means that at
any one point in time, the brain can be said to exist in a specific state. The state sequence is
Markovian (meaning that the state modelled is dependent only on the state immediately preceding
it). In its simplest form, the HMM might describe states in a single e-phys time course; each state
could be described by a Gaussian distribution from which the e-phys data are extracted. If, at
some time point t, the observed e-phys data are most likely drawn from the Gaussian describing
State 1, then State 1 would be assigned to time point t. Conversely, if the Gaussian from State 2
is most likely, state 2 would be assigned, and so on. This model can be expanded to encompass
multivariate data where one includes all e-phys time courses from regions across the whole brain
(here each state is governed by a multivariate mean and covariance (Baker et al., 2014)). More
recent versions of the model also enable time embedding (Vidaurre et al., 2018), enabling states
to be governed by a complete spatial, temporal and spectral description of brain activity.
Using this unsupervised approach, the identification of when the brain enters or leaves a
specific state is automated, and because states are entered more than once, one can average
data across many visits to the same state - improving SNR. In this way, we sidestep the ‘classical’
problem of having to average within predefined and largely meaningless sliding windows, since
the HMM automatically selects the time windows in a data-driven manner. As we discuss further
below, the HMM is offering a new means to capture brain network dynamics at very rapid
timescales. We also discuss in Section 4 new physiological conceptions that may inspire future
measurement methods of e-phys connectivity in a time-resolved manner.
3) A leap of faith: exploiting ongoing electrophysiological activity to define
electrophysiological connectomes
In this section, we argue that many common e-phys analyses, on their own, fall short of
providing a comprehensive mechanistic understanding of brain-behaviour relationships. E-phys
measurements are typically repeated many times, and data is averaged across trials to detect
possible effects relative to a “baseline” period of reference. In most e-phys studies, the baseline
is discarded, treating ongoing brain dynamics as “noise”. Here, we argue for “a leap of faith”; a
leap to exploit in full rather than “correct away” the signal expressions of ongoing e-phys
processes and their spatial organization. We use the term “ongoing” in a broad sense to refer to
all neural processes (both during rest and tasks) not captured by stimulus (or response)-locked
and trial-averaged approaches.
Several observations motivate such a leap. Firstly, ongoing processes constitute the
strongest portion of the power spectrum of e-phys activity. These processes are spatio-temporally
well organized, although they have been historically considered as generated by unstructured
noise. Secondly, ongoing processes are of functional significance for behaviour. Below, we first
lay out why common e-phys analyses are often blind to these consequential properties of ongoing
activity. In Subsections 3.1 and 3.2, we elaborate on the spatial organization of ongoing e-phys
activity (i.e. whole-brain pattern of connection strength across region-pairs), and discuss its
behavioural significance. In Subsection 3.3 we review briefly the latest evidence on the dynamics
of ongoing activity.
10Common “corrections” of baseline
In task-based e-phys, local activation levels are typically assessed as event-related
potentials or fields (ERPs and ERFs) and/or event-related spectral perturbations (ERSPs) that
are corrected relative to pre-stimulus baseline or expressed as contrasts across experimental
conditions or groups of participants. Both average evoked responses and their contrasts are blind
to brain activity present at prestimulus baseline. Further, and by design, ERP/ERFs and ERSPs
capture consistency over trials and are insensitive to the variability of evoked responses that may
result from ongoing activity. Similarly, when assessing e-phys connectivity, coupling measures
such as PLV and coherence are commonly normalized to prestimulus timepoints and designed
to quantify cross-trial consistency. Task-related connectivity changes are thus commonly studied
in a way that treats ongoing e-phys processes as “noise”. It is also important to note that the often-
chosen approach to study connectivity across a small number of task-related sensors or sources
of interest neglects the distributed spatial organization of e-phys data.
3.1) Ongoing electrophysiological activity has an intrinsic spatio-temporal organization
An important aspect that invites going beyond the above-described “corrections” of
ongoing activity is that this activity is spatio-temporally organized rather than merely reflecting
unstructured noise. Below, we review e-phys investigations that have established the presence
of a stable spatial organization of connectivity, paralleling earlier observations from functional and
structural MRI. Specifically, we discuss the presence of “canonical” Intrinsic Connectivity
Networks (ICNs, each comprising a specific distributed set of strongly interconnected brain
regions, as initially described in MRI studies). We also discuss connection-wise quantitative
comparisons of e-phys and MRI-based connectivity, and the context-invariant intrinsic nature of
e-phys connectomes. Further conceptual and mechanistic considerations are proposed in Section
4, to inspire more research on these questions that make e-phys connectomics stand out
uniquely.
Intrinsic spatial organization in intracranial electrophysiology
To establish the presence of ICN organization independently of the potential impact of
source leakage, we first consider human intracranial recordings. Although intracranial studies
typically lack the whole-brain coverage required for a comprehensive depiction of ICNs, individual
studies have confirmed the existence of specific ICNs depending on the available electrode
placement. High intra-network connectivity during task-free resting state has been reported
across regions of the somatomotor ICN (Hacker et al., 2017; He et al., 2008; Ko et al., 2013;
Weaver et al., 2016), the visual and auditory ICNs (Ko et al., 2013; Nir et al., 2008), and higher-
order ICNs including the default mode (DM), dorsal attention (DAT), and fronto-parietal executive
control (FP) networks (Hacker et al., 2017; Kucyi et al., 2018). Beyond within-ICN connectivity,
more comprehensive intracranial connectome characterization includes the anti-correlation
across the DM network and “task-positive” areas (Hacker et al., 2017; Keller et al., 2013), as well
as observation of whole-brain connectomes (full connectivity matrix) by pooling available
electrode-pairs over many subjects (Betzel et al., 2019; Figure 2C). The latter study reports a
significant albeit moderate association between the group-level fMRI connectome and the pooled
whole-brain ECoG connectome in all canonical frequency bands. Of note, although many studies
that seek similarity with fMRI-derived FC focus on slow co-fluctuations of high-gamma power, the
11above-listed studies extend to amplitude coupling of other oscillation frequencies as well as
measures that involve oscillation phase. In summary, human iEEG studies provide confidence
regarding the presence of an intrinsic spatial organization of ongoing e-phys connectivity across
oscillation frequencies and connectivity measures, and also lend support to the spatial network
organisation often reported in fMRI.
Intrinsic spatial organization in MEG/EEG
With this confidence in an intrinsic spatial organization established, we turn to MEG and
EEG source space studies of whole-brain connectomes. Numerous MEG amplitude-coupling
studies offer converging evidence for the presence of sensory/motor (SM, VIS, AUD) and higher-
order (DM, DAT, VAT, FP) ICNs using seed-based correlations (de Pasquale et al., 2010; Hipp
et al., 2012, p. 2012; Figure 2A), temporal ICA (Brookes et al., 2011; Fig 2B) and discrete co-
activation states (Baker et al., 2014; Figure 3A and Section 3.3). While some of these studies use
broadband signals, those that focus on distinct frequency bands often report the α and/or β bands
to be most dominant in reflecting ICNs. Further, while amplitude coupling has been the more
commonly used connectivity mode in MEG resting state connectome studies, MEG phase
coupling shows a similar spatial distribution anchored by ICNs (see below for (Tewarie et al.,
2016) comparing both modes to fMRI FC). We discuss in Section 4, how these seemingly
disparate observations may come together, and how derivatives from cross-frequency, phase-
amplitude coupling measures likewise provide ICNs akin to fMRI (Florin and Baillet, 2015). Finally,
in spite of stronger susceptibility to volume conduction compared to MEG, EEG likewise robustly
reflects the intrinsic spatial organization of the connectome (Wirsich et al., 2021), backed by
cross-modal convergence with fMRI and dMRI as described below.
Robust but moderate spatial similarity of static MEG/EEG- to MRI-based connectomes.
Beyond qualitative description of e-phys ICNs and connectomes, the connection-wise
correspondence to MRI-derived connectivity patterns can be quantified when using the same
brain parcellation atlas across data modalities. Such quantitative descriptions are useful because
they inform conclusions regarding neurobiological reasons for convergence/divergence of
connectivity patterns across data modalities (we thus include some effect sizes below). Such
comparative studies have been discussed extensively in a previous paper (Sadaghiani and
Wirsich, 2019). Here, we highlight some key observations.
Connection-wise spatial similarity of static source-space MEG/EEG connectomes to the
fMRI-derived connectome has been firmly established in numerous studies but is modest in effect
size. This cross-modal similarity is significant but small at the level of individual subjects (Hipp
and Siegel, 2015; MEG amplitude coupling). Effect sizes are considerably larger when comparing
group-average MEG/EEG and fMRI-derived connectomes; across concurrently recorded EEG
and fMRI connectomes the spatial correspondence is reported at r>= 0.3 for most bands (Wirsich
et al., 2017; EEG imaginary phase coupling; Figure 2D). These effect sizes are similar to those
discussed above for group-level iEEG connectomes (Betzel et al., 2019; Fig. 2C). Importantly,
cross-modal connectome association has been firmly reproduced with the same moderate effect
size in concurrent EEG-fMRI in numerous settings, from 64 to 256 EEG scalp electrodes and from
1.5 to 7T MRI field strengths (Wirsich et al., 2021; Figure 2D). Interestingly, while MEG group-
12average connectomes in specific frequency bands show moderate resemblance to fMRI
connectivity (r up to 0.35 for amplitude coupling and 0.24 for phase coupling depending on
frequency band), associations double in size when jointly considering linear and nonlinear
combinations of frequency-specific MEG connectomes (Tewarie et al., 2016). Further, jointly
considering amplitude- and phase-coupling predicts the fMRI connectome at r = 0.73. Thus,
different canonical frequency bands and e-phys coupling modes may be associated with unique
components of FC in fMRI. It is possible, even likely, that fMRI represents a non-linear
combination of e-phys coupling phenomena, further highlighting the advantage of e-phys
modalities in dissociating the contribution of such phenomena to the functional connectome.
The above-described increase in MEG/EEG to fMRI spatial similarity from individual to
group-level connectomes suggests that this similarity is driven by robustly shared features, i.e.,
the consensus across the population. The most robust tracts of the structural connectome play a
key role in such FC consensus as a shared backbone. Indeed, both amplitude-, phase- and
phase-amplitude coupling in all canonical frequency bands are stronger between nodes with
direct or indirect structural (derived from diffusion-weighted MRI, dMRI) connections than those
without such connections, even after accounting for spatial proximity (Chu et al., 2015; EEG
phase coupling and amplitude coupling; Florin and Baillet, 2015; MEG phase-amplitude coupling).
A study of the alpha band confirmed a close structure-function relationship both for group-average
and individual connectomes (r = 0.48) (Finger et al., 2016; EEG phase coupling). A substantially
higher association was achieved in this study between observed EEG connectomes and
simulated EEG connectomes modelled from dMRI connectivity (r = 0.74). Importantly, such
modelling approaches also provide mechanistic insights into the contribution of structural to e-
phys connectome organization (e.g. Cabral et al., 2014; cf. Ritter et al. in this Special Issue).
Interestingly, when the structure-function relationship is directly compared between fMRI and
EEG, e-phys may match dMRI-derived connectivity better than fMRI (Deligianni et al., 2016;
Wirsich et al., 2017; concurrent EEG-fMRI). The correspondence to dMRI-derived connectivity
gives additional methodological credibility to e-phys source-space connectomes and points to a
substantial contribution of structural connectivity.
Importantly, while noise and confounds in both e-phys and fMRI measures certainly
contribute to the often modest size of their cross-modal association, the connectome
dissimilarities are likely biologically meaningful. The vastly different temporal characteristics of
fMRI and e-phys measures emphasize divergent types of neural processes (Hari and Parkkonen,
2015). While the fast and slow processes share an important degree of spatio-temporal
organization, a considerable proportion of these processes is likely independent. Further, the
brain’s vascular response is likely coordinated across areas of ICNs (Bright et al., 2020), implying
that BOLD signal correlations in fMRI may reflect a direct vascular relationship across areas in
addition to associated metabolic demands from neural processes as captured by e-phys methods.
These observations motivate revision of the viewpoint that fMRI and e-phys provide different
windows onto the same neural processes. Rather, the more exciting view arises that the functional
connectome comprises distinct modes of connectivity unfolding in partially non-overlapping
spatial and temporal patterns. Depending on their timescale, these patterns dominate the signals
in hemodynamic and e-phys acquisition methods, respectively.
13To conclude, convergence of electrophysiological connectomes with the well-established
fMRI connectome implies that connectomes can be successfully derived in source-space
MEG/EEG. Conversely, the imperfection of this cross-modal similarity suggests the presence of
unique features only observable in one modality. Both of these aspects motivate embracing rather
than ignoring ongoing activity and its spatial organization in e-phys studies.
Figure 2 -- The presence of an intrinsic whole-brain connectivity organization in e-phys data. A)
Sensory and motor ICNs as observed with seed-based connectivity in source-space MEG amplitude
coupling. The spectral plot (right) indicates a strong contribution from alpha and beta band oscillations to
these intrinsic networks (reprinted with permissions from Hipp et al., 2012). B) Temporal ICA of band-
specific oscillation amplitudes in MEG yields numerous ICNs (four are shown as examples), including
sensory/motor as well as higher-order networks. Alpha and especially beta bands captured ICN
organization well. A direct comparison between the MEG-derived (bottom row) and the fMRI-derived (top-
row) independent component maps demonstrates high spatial similarity (adapted from Brookes et al.,
2011). C) Connection-wise connectivity strength is spatially associated between fMRI and intracranial e-
phys (ECoG amplitude coupling, pooled over patients). The strength of this correlation is around ~0.35 for
all frequency bands (reprinted with permissions from Betzel et al., 2019). D) A similar spatial association of
connection-wise connectivity strength is observed between fMRI and concurrently recorded scalp EEG
(phase coupling). The left scatterplot shows an example for the beta band, where each data point is from
one connection (region pair) of the connectome averaged across subjects (reprinted with permissions from
Wirsich et al., 2017). This relationship is reproducible at similar effect size across various MRI field strengths
(1.5-7T) and EEG densities (64-256 channels) (adapted from Wirsich et al., 2021).
14Figure 2
15Stability of the intrinsic electrophysiological connectome across cognitive states
One key characteristic of an intrinsic spatial organization of large-scale connectivity is its
relative independence of cognitive context. Such insensitivity to cognitive context has been well
quantified in fMRI, demonstrating that task-specific changes to the brain’s fMRI-derived time-
averaged connectome organization are small (Cole et al., 2014; Gratton et al., 2018; Hearne et
al., 2017). Compared to the aperiodic infra-slow fluctuations of the BOLD signal however,
oscillation-based FC is well-positioned to support long-range communication on the rapid
timescale of tens to hundreds of milliseconds required for cognitive processes (see Section 3).
Could this aptitude result in stronger reconfiguration of e-phys FC organization by cognitive
context? E-phys connectome investigations such as those discussed above commonly focus on
task-free resting state, and few e-phys connectome studies have quantitatively compared
cognitive states.
One such study analysed daylong iEEG recordings over various levels of arousal and day-
to-day activities (Kramer et al., 2011). Amplitude- and phase-coupling derived from periods of 100
s and longer displayed a consistent spatial organization over the diurnal cycle. A related study
using sensor-level EEG identified high spatial correlation over different sleep stages and
wakefulness for both amplitude- and phase coupling organization (again for periods of >=100s)
(Chu et al., 2012). An EEG study in source-space showed that phase-coupling is spatially
consistent when calculated over several minutes of different tasks (resting state, video viewing,
and flashing gratings) with similar modular organization across frequency bands (Nentwich et al.,
2020). Finally, a recent ECoG study contrasted various cognitive states including rest and short
(1.5-2.5 s) pre-stimulus and post-stimulus epochs of different tasks (Mostame and Sadaghiani,
2021). Phase- and amplitude-coupling revealed a highly similar, largely state-invariant spatial
component across cognitive states. This spatial organization was shared across all frequency
bands (though individual bands further exhibited temporally independent FC dynamics that can
support frequency-specific information exchange).
Collectively, these studies suggest that the spatial organization of oscillation-based FC is
largely stable over cognitive states (including levels of arousal, resting wakefulness, and task
periods with different cognitive demands) i.e., it is primarily intrinsic in nature. This organization
is also to a large degree shared across frequency bands. Consequently, dynamic changes in e-
phys connectomes, including those occurring spontaneously, initiated by task context, or evoked
by stimulation should be studied in terms of informative departures from the relatively stable
intrinsic organization (cf. Section 3 for methodological aspects).
3.2) Ongoing electrophysiological activity and connectivity are of behavioural
consequence
Ultimately, the functional significance of the connectome lies in the role it plays in cognition
and behaviour. This fundamental role has been established through the observation that e-phys
connectome organization can be predictive of task behaviour, as we will outline below. Since
research into distributed, large-scale connectivity in e-phys modalities is rather recent (see
Section 3.1), we also discuss more generally the cognitive role of spectral power and phase of
ongoing oscillations as they constitute the basis for cross-regional dependencies underlying the
16large-scale connectome. We close by discussing how these studies may collectively inform about
fundamental mechanisms of brain function.
Association of resting state activity and connectivity with behavioural traits across individuals
Both simple features of the MEG/EEG power spectrum (Da Silva Castanheira et al., 2021;
Demuru and Fraschini, 2020) as well as attributes of oscillation-based connectomes (Da Silva
Castanheira et al., 2021; Demuru et al., 2017; Nentwich et al., 2020; Sareen et al., 2021)
constitute highly subject-specific brain “fingerprints'' on the basis of which individuals can be
identified. Inter-individual differences in e-phys attributes, including e-phys connectome
organization, should thus be considered important to brain function rather than only reflective of
noise. This individual specificity suggests an association between such e-phys features and
behavioural traits. Indeed, long before the era of resting state studies in fMRI, so-called
quantitative EEG (QEEG) studies firmly established the wealth of behaviourally relevant
information contained in task-free ongoing activity. A long and fruitful history of such studies has
shown association between e-phys power spectra and related feature derivations with
behavioural or clinical traits, and cognitive abilities (Mahjoory et al., 2019; Palva et al., 2013).
More recently, distributed phase-coupling at rest has been linked to task performance in the
healthy population and aberrations thereof in neurological patients (e.g. Sadaghiani et al., 2019).
Turning to source-space EEG, cognitive traits such as IQ have been predicted from phase-
coupled connectomes in both resting state and task-based recordings (Nentwich et al., 2020).
Interestingly, resting state source-space phase-coupling and amplitude-coupling constitute
spatially distinct associations with behavioural task performance (Guggisberg et al., 2015).
Further, resting state e-phys connectivity not only predicts individuals’ perceptual performance
but also stimulus-related activation (oscillation power) on tasks (Allaman et al., 2020).
Behavioural consequences of prestimulus power, phase, and connectivity during task
Complementing the above-described trait-like associations across the population,
oscillation-based “states” affect behaviour within individuals. Here, it is important to emphasize
that the largely stable core organization of the e-phys connectome (extensively discussed in
Section 3.1) is complemented by more subtle but behaviourally consequential time-varying
changes (cf. Sections 2.3 and 3.3). While the above-described trait-like behavioural associations
harness the stable aspect by integrating e-phys signals over extensive recordings, the following
studies unveil the importance of time-varying dynamics by investigating trial-by-trial variability. An
individual’s behaviour varies from moment to moment even under comparable external
circumstances. Trial-by-trial behaviour on various tasks has been shown to covary with
prestimulus potentials (Bode et al., 2012; Britz and Michel, 2010), and the power (Lange et al.,
2014) as well as phase (Busch et al., 2009; Kayser et al., 2016; Mathewson et al., 2009) of
ongoing oscillations at baseline in task-relevant early and higher-order areas. A key feature of
experimental design shared among these studies is that they maximize behavioural variability
(typically measured as accuracy or perceptual choice) by using near-threshold stimuli, ambiguous
and illusory stimuli, or conflict-causing stimuli in a cue-free setting. These designs rest on the
observation that the less reliable the external information, the more the brain must rely on internal
information provided by ongoing activity. Given the often noisy, incomplete, and ambiguous
nature of sensory information, the reliance on ongoing activity underlines its putative mechanistic
17importance in terms of enabling a form of active sensory inference (see discussion of mechanisms
below and in Section 4).
Beyond power and phase of oscillations, the coupling of these properties across
distributed regions also impacts behaviour. A number of perception studies in MEG/EEG source-
space have taken a hypothesis-driven approach to selecting a small number of relevant regions
activated by the task at hand. Among these task-related regions, prestimulus phase coupling
affects perceptual decisions in various task settings and sensory modalities (Hanslmayr et al.,
2007; Keil et al., 2014; Rassi et al., 2019). Further, beyond perception tasks, cognitive control
processes such as top-down inhibition are affected by prestimulus connectivity states over and
above the impact of prestimulus power (Hamm et al., 2012). Finally, the study of prestimulus
connectivity has been extended beyond select task-relevant regions to source-localized whole-
brain phase coupling and its topology (Weisz et al., 2014). And of course, task-concurrent whole-
brain connectomes inform not only about the behavioural impact of prestimulus connectivity, but
also of post-stimulus connectivity dynamics (e.g. Favaretto et al., 2021; Hirvonen et al., 2018).
The study of large-scale connectomes in e-phys task experiments is, in our view, particularly
underutilised and promising for understanding the functional significance of the statistical
variability of connectome measures around a mean core organization.
Mechanisms underlying behavioural impact
What are the mechanisms driving the association of prestimulus activity and post-stimulus
behaviour? A growing body of literature suggests that this association results from the modulation
that prestimulus processes exert on stimulus-evoked brain responses. While trial-to-trial variability
of evoked responses are rarely acknowledged by most common e-phys analysis approaches,
such variability is often of similar magnitude to spontaneous fluctuations of ongoing activity. Owing
to the alpha rhythm’s cyclic modulation of cortical excitability, this rhythm has been extensively
studied in this context. It is well established that both prestimulus alpha-band phase and amplitude
shape sensory evoked responses (Becker et al., 2008; Fellinger et al., 2011; Iemi et al., 2019;
Rajagovindan and Ding, 2011), with causal impact on perception (Jaegle and Ro, 2013; Romei
et al., 2010). Note that evidence of an influence of connectivity on evoked responses is much less
extensive (e.g., Rassi et al., 2019), reinforcing the need to incorporate baseline connectivity in
future research.
One prominent suggestion has been that baseline signals represent levels of arousal and
alertness/vigilance (Minkwitz et al., 2011), which aligns well with the role of certain oscillations in
such general (i.e., unspecific) cognitive functions (Sadaghiani and Kleinschmidt, 2016).
Interestingly however, both scalp and intracranial studies using decoding approaches have
demonstrated that the influence of baseline activity is not limited to general processes but extends
to specific sensory representations. In particular, prestimulus oscillation power (and phase: Li et
al., 2020) in sensory areas can be used to directly decode stimulus-specific task-relevant
information (Kayser et al., 2016) and modulates post-stimulus decoding of behaviour in a region-
by-stimulus specific manner (Li et al., 2020). Interestingly, a recent MEG study suggests that a
general process and stimulus-specific information may be concurrently present in different
aspects of ongoing activity (Podvalny et al., 2019).
18One likely interpretation for the stimulus-specific observations is that prestimulus signals
represent intrinsic fluctuations in selective attention, modulating the gain of specific
representations. The findings are also in line with another, broader viewpoint regarding the impact
on evoked responses and behaviour. According to this viewpoint, this impact results from the
possibility that ongoing activity and its spatial organization represent statistical regularities of the
world, and that these representations spontaneously reactivate in an iterative manner (Berkes et
al., 2011; Sadaghiani and Kleinschmidt, 2013). This interpretation is well-aligned with predictive
coding and active inference conceptual frameworks that view perception through the lens of
generative models, postulating an indispensable role of prior information in “generating” percepts
(Friston et al., 2011; Schroeder et al., 2010). Within the context of this framework, ongoing activity
is considered to reflect the neural activity that predicts the causes of sensory inputs as well as the
precision or uncertainty of such predictions (Morillon and Baillet, 2017; Sadaghiani et al., 2010).
We discuss these aspects further in Section 4.
Irrespective of such a mechanistic purpose, the association of intrinsic oscillations with
clinical markers, cognitive abilities, and trial-by-trial behaviour calls for a shift to complement the
long-standing research of stimulus-locked and trial-averaged neural processes with the study of
ongoing e-phys processes and the intrinsic connectome in particular.
3.3) Ongoing activity changes dynamically at rapid timescales
The above discussions on pre-stimulus connectivity and its impact on behaviour and post-
stimulus processes is the first step towards a dynamic connectivity approach in which the
formation and dissolution of networks is mapped in real time as the brain responds during
cognition. As outlined in Section 2, e-phys approaches have a distinct advantage in this regard,
and the evidence presented above suggests that a truly dynamic approach to connectivity – in
particular mapping connectivity at the timescale relevant to cognition (i.e., the millisecond
timescale) may offer new insights into the underlying enabling functional mechanisms.
The evidence for changes in connectivity over time, even in the resting state, is well
established. For example, the sliding window method explained in Section 2 has been used to
demonstrate significant temporal fluctuations in e-phys connectivity: In early work, DePasquale
et al. (2010) demonstrated the use of a 10-s sliding window to elucidate the transient formation of
canonical ICNs that had been seen in fMRI. Interestingly, using sliding windows (60 s) in multi-
modal recordings, changes in strength of connectivity temporally coincide across concurrent fMRI
and EEG (coherence) in all canonical frequency bands and broadly across the cortex (Wirsich et
al., 2020). Brookes et al. (2014) showed significant fluctuations of MEG connectivity within the
sensorimotor network using a sliding window technique with a window length of 40 s. These
observations show how resting state e-phys connectivity demonstrates subtle but significant
dynamic fluctuations about a central core organization.
Whilst resting state fluctuations of connectivity are apparent, it is sometimes difficult (or
even impossible) to link those fluctuations to behaviour. Consequently, a number of attempts have
been made to study task evoked changes in e-phys connectivity. For example, O’Neill et al. (2015)
19used a sliding window to demonstrate how e-phys connectivity changes with a motor task. This
work employed a canonical correlation-based methodology which was able to detect “sub-
networks” within the sensorimotor system; in time windows encompassing a button press the
authors showed that specific subnetworks within the sensorimotor system were more likely. In
this way, both the temporal and spatial variation of network formation was taken into account. A
further study by O’Neill et al. (2017b) measured the full connectome matrix using 6-s sliding
windows, and demonstrated the formation and dissolution of networks during a Sternberg working
memory task. These studies begin to show that a complete dynamic approach to functional
connectivity offers new insight into task evoked dynamics. However, for reasons outlined above,
especially in Section 2, the utility of the sliding window comes into question, because the inherent
timescale of the metrics available is limited to relatively slow fluctuations.
Towards a new generation of functional connectivity
The limitations of sliding window (and similar) approaches are potentially lifted by the use
of the Hidden Markov Model (cf. Section 2.3). In an early paper by Baker et al. (2014), this method
was used to uncover the recurrence of brain states that were shown to exist on the time-scale of
just a few hundred milliseconds. The identified states each had a distinct spatial signature, which
resembled the canonical ICNs previously observed using static connectivity approaches in fMRI
and e-phys (Figure 3A-B). Post-hoc analysis showed that the classical manifestation of
connectivity was underpinned by these rapid fluctuations of network dynamics. In a follow-up
paper using a time-embedded HMM (able to capture spectral signatures), Vidaurre et al. (2018)
showed that canonical ICNs (motor, visual, default-mode) could again be extracted from ongoing
e-phys data; the default mode was shown to be split in frequency, with parieto-temporal
projections in alpha and frontal projections in the delta and theta bands. Importantly, once again
these networks were shown to modulate on a rapid (You can also read