Proximity labeling of protein complexes and cell type-specific organellar proteomes in Arabidopsis enabled by TurboID - bioRxiv
←
→
Page content transcription
If your browser does not render page correctly, please read the page content below
bioRxiv preprint first posted online May. 13, 2019; doi: http://dx.doi.org/10.1101/629675. The copyright holder for this preprint
 (which was not peer-reviewed) is the author/funder, who has granted bioRxiv a license to display the preprint in perpetuity.
                              It is made available under a CC-BY-NC-ND 4.0 International license.

Proximity labeling of protein complexes and cell type-specific
organellar proteomes in Arabidopsis enabled by TurboID
Andrea Mair 1,2, Shou-Ling Xu 3, Tess C. Branon 1,4,5,6, Alice Y. Ting 1,5,6,7, Dominique C. Bergmann 1,2
1 Department of Biology, Stanford University, Stanford
2 Howard Hughes Medical Institute
3 Carnegie Institution for Science - Department of Plant Biology, Stanford
4 Department of Chemistry, Massachusetts Institute of Technology, Cambridge
5 Department of Genetics, Stanford University, Stanford
6 Department of Chemistry, Stanford University, Stanford
7 Chan Zuckerberg Biohub, San Francisco

Abstract
Defining specific protein interactions and spatially or temporally restricted local proteomes improves our understanding of all
cellular processes, but obtaining such data is challenging, especially for rare proteins, cell types, or events. Proximity labeling
enables discovery of protein neighborhoods defining functional complexes and/or organellar protein compositions. Recent
technological improvements, namely two highly active biotin ligase variants (TurboID and miniTurboID), allowed us to address
two challenging questions in plants: (1) what are in vivo partners of a low abundant key developmental transcription factor and
(2) what is the nuclear proteome of a rare cell type? Proteins identified with FAMA-TurboID include known interactors of this
stomatal transcription factor and novel proteins that could facilitate its activator and repressor functions. Directing TurboID to
stomatal nuclei enabled purification of cell type- and subcellular compartment-specific proteins. Broad tests of TurboID and
miniTurboID in Arabidopsis and N. benthamiana and versatile vectors enable customization by plant researchers.

Introduction
All major processes of life, including growth and development              nucleic acid, protein and metabolite composition of different
and interactions among cells, organisms and the                            cell types in plants was issued at the start of this year (Rhee,
environment, rely on the activity and co-operation of                      Birnbaum, and Ehrhardt 2019). While several groups have
hundreds of proteins. To fully understand these processes                  produced single cell gene expression profiles (e.g. (Efroni et
on a cellular level, we must know all players present in a cell            al. 2015; Ryu et al. 2019; Denyer et al. 2019; Nelms and
or cell-type at a specific location and time. This requires                Walbot 2019)) and tissue/cell-type specific profiles of active
information about transcription and chromatin state, as well               translation (e.g. (Vragovic et al. 2015; Tian et al. 2019)), we
as about protein abundance and protein complex                             lack effective tools to obtain similarly precise information
compositions. A large international effort, the ‘human cell                about protein distribution, abundance and the composition of
atlas’ project, is taking a first step in this direction. It aims to       protein complexes.
characterize all cell types in the human body, using recent
advancements in high-throughput single-cell and multiplex                  Today’s state-of-the-art for identification of in-planta protein
techniques (Regev et al. 2017; Stuart and Satija 2019).                    interactors and complexes is affinity purification with protein-
Following this example, a call for a ‘plant cell atlas’ describing         specific antibodies or single- and tandem affinity purification

Key words: proximity labeling, BioID, TurboID, miniTurboID, plant, protein complex composition, nuclear proteome, organellar
proteome, cell-type specific proteome

Recurring abbreviations: AP, affinity purification; AP-MS, affinity purification-mass spectrometry; bHLH, basic helix-loop-helix;
BirA*, promiscuous E. coli biotin ligase; FDR, false discovery rate; GC, guard cell; GO, gene ontology; HAT, histone acetyl
transferase; HDAC, histone deacetylase; LC-MS/MS, liquid chromatography coupled to tandem mass spectrometry; MS, mass
spectrometry; miniTID, miniTurboID; NES, nuclear export signal; NLS, nuclear localization signal; PCA, principal component
analysis; PL, proximity labeling; POI, protein of interest; SA, streptavidin; TF, transcription factor; T ID, TurboID; WT, wild-type;
Y2H, yeast-2-hybrid

                                                                       1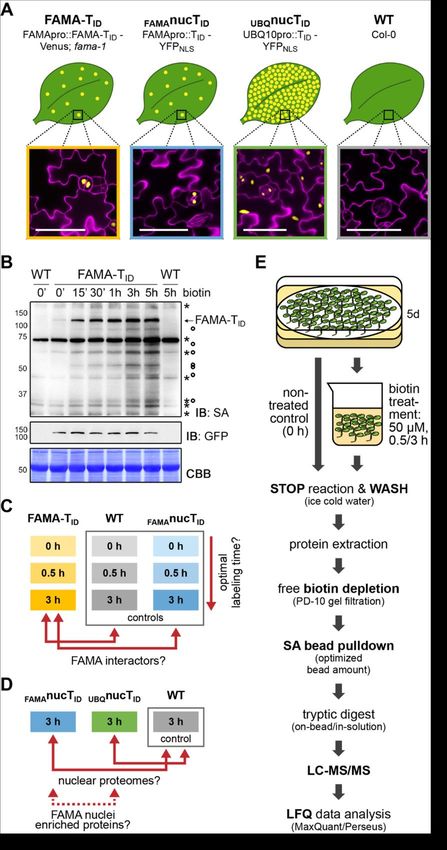
bioRxiv preprint first posted online May. 13, 2019; doi: http://dx.doi.org/10.1101/629675. The copyright holder for this preprint
 (which was not peer-reviewed) is the author/funder, who has granted bioRxiv a license to display the preprint in perpetuity.
                              It is made available under a CC-BY-NC-ND 4.0 International license.

tags and subsequent mass spectrometry (MS) analysis                        transformed N. benthamiana leaves (Conlan et al. 2018),
(Struk et al. 2019; Xu et al. 2010). However, while affinity               respectively.
purification- mass spectrometry (AP-MS) strategies are
undoubtedly useful in many instances, AP-MS is challenging                 These plant studies all utilized BioID, which is based on an
for very low abundant proteins, those expressed only in rare               E. coli biotin ligase (BirA) made promiscuous by a point
cell types or developmental stages, and those with poor                    mutation (R118G) to yield BirA*. BirA* is either fused to a
solubility like integral membrane proteins. Moreover, AP-MS                protein of interest or targeted to a desired subcellular
tends to miss weak and transient interactions unless paired                localization to mark protein interactors and local proteomes,
with crosslinking (Qi and Katagiri 2009; Van Leene et al.                  respectively. When biotin is supplied in the presence of ATP,
2007; Bontinck et al. 2018). For obtaining subcellular                     BirA* binds and activates biotin and releases reactive
proteomes, typical traditional approaches rely on cell                     biotinyl-AMP which can covalently bind to close-by primary
fractionation protocols that enrich organelles from whole                  amines on lysine residues (Roux et al. 2012). Based on
tissues, followed by protein extraction and MS analysis.                   experiments with the nuclear pore complex (Kim et al. 2014),
Besides cross-contamination with other organelles, cell                    the labeling radius of BirA* was estimated to be
fractionation has the issue that only compartments that can                approximately 10 nm, which is in the size-range of an
be purified are accessible (Agrawal et al. 2011). The                      average globular protein. The actual labeling range may vary
usefulness of this strategy for studying local protein                     between experiments and is dependent on characteristics of
compositions in individual cell types is further limited by the            the BirA* fusion protein, such as linker length and bait
requirement of prior enrichment of the cell type of interest.              mobility, and on the labeling time. Typical labeling times with
For rare and transient cell types, acquiring a sufficient                  BirA* are between 12 and 24 hours, which limits the
amount of ‘pure’ organelle material for MS analysis would be               usefulness of BioID for studying short and time-sensitive
a major challenge.                                                         events.

Recent technological innovations in the form of proximity                  The three plant studies demonstrate that BioID can work in
labeling (PL) techniques provide the sensitivity and                       plants if the bait is expressed at sufficiently high levels, but
specificity needed to identify protein complexes and (local)               the method does not perform nearly as well as it does in the
proteomes on a cell-type specific level. These techniques                  animal systems for which it was designed. Several factors
employ engineered enzymes to covalently attach biotin to                   likely contribute to this (Bontinck et al. 2018). First, BioID is
nearby proteins which can then be affinity purified from total             most often used in mammalian cell culture, where biotin is
protein extracts using streptavidin-coupled beads without the              easily taken up from the growth medium. Structural features
need for crosslinking to stabilize weak and transient protein              of plants, including cell walls and the cuticle, could impede
interactions or cell sorting and fractionation to enrich                   biotin uptake, especially in older plants or certain tissues.
organelles. Because proteins do not have to be isolated in                 Second, as an E. coli-derived enzyme, BirA*’s optimum
their native state, harsher extraction and more stringent wash             temperature is about 37°C (Kim et al. 2016). Its activity at
conditions can be applied, which can reduce false positives                temperatures suitable for plant growth and treatment might
from post-lysis interactions or from non-specific binding of               be too low for efficient labeling. Finally, unlike animals, plants
proteins to the beads, and can improve solubilization of                   produce and store biotin in their cells, which hampers tight
membrane proteins (for recent review see (Gingras, Abe,                    temporal control of labeling. Free biotin produced by the plant
and Raught 2019)). An ever growing number of applications                  could lead to continuous low-level ‘background’ labeling prior
for PL in animals, including the characterization of protein               to exogenous biotin application, which could over time lower
complexes (e.g. the nuclear pore complex (Kim et al. 2014)),               the signal-to-noise ratio.
of organellar proteomes (e.g. mitochondrial matrix and
intermembrane space (Rhee et al. 2013; Hung et al. 2016))                  Recent engineering of improved versions of BirA, however,
as well as for local proteomes (e.g. inside cilia (Mick et al.             might improve PL efficiency in plants and provide the tools
2015), at synaptic clefts (Loh et al. 2016), at endoplasmic                required to build a ‘plant cell atlas’. In a directed evolution
reticulum-mitochondria contact sites (Cho et al. 2017; Hung                approach, two new variants – TurboID and miniTurboID –
et al. 2017), demonstrate the usefulness and versatility of                with similar specificity as BirA* but greatly increased activity
these techniques. Although the potential utility for PL in                 and lower temperature requirements were created (Branon
plants is equally tremendous, its adaptation in plants is                  et al. 2018). TurboID and miniTurboID were successfully
proving challenging. So far, only three studies have                       utilized to generate different organellar proteomes in HEK
described successful PL in plant systems, employing                        cells and worked in vivo in a broad range of species,
overexpression of a transcription factor (TF) in transiently               including Drosophila and C. elegans which were previously
transformed rice protoplasts (Lin et al. 2017) and high level              inaccessible for BioID (Branon et al. 2018). The efficacy of
expression of Pseudomonas syringae effector proteins in                    these new enzymes in plants and their potential to identify
stable Arabidopsis lines (Khan et al. 2018) and transiently                rare protein complexes and local proteomes in individual cell

                                                                       2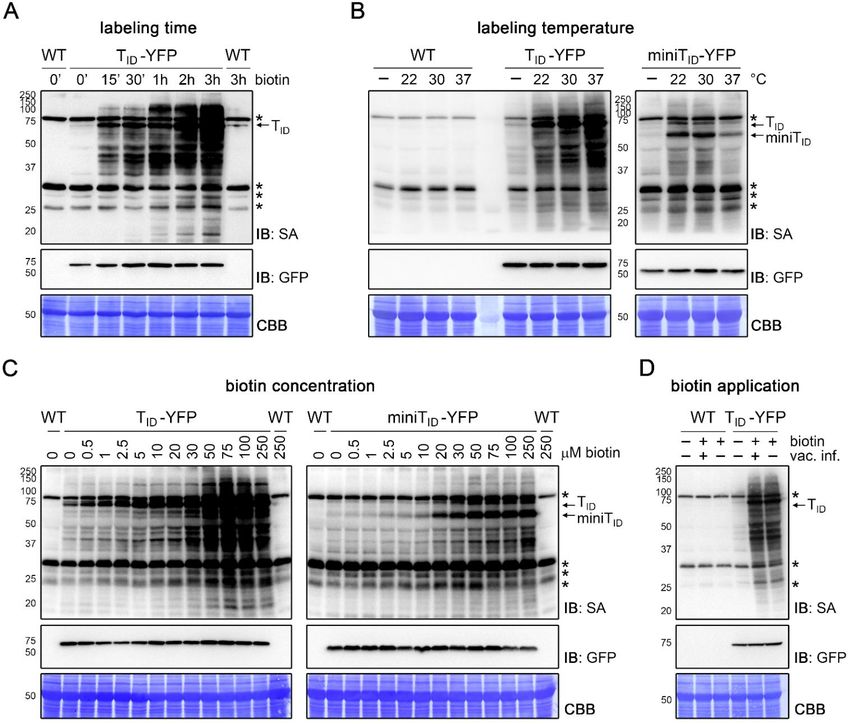
bioRxiv preprint first posted online May. 13, 2019; doi: http://dx.doi.org/10.1101/629675. The copyright holder for this preprint
 (which was not peer-reviewed) is the author/funder, who has granted bioRxiv a license to display the preprint in perpetuity.
                              It is made available under a CC-BY-NC-ND 4.0 International license.

types of complex multicellular organisms, however, were not                Here, we show that TurboID and miniTurboID enable
addressed.                                                                 effective PL in plants and have greatly improved activity
                                                                           compared to BirA*. We use TurboID to identify partners of
                                                                           the stomatal guard cell transcription factor FAMA and to
                                                                           obtain the nuclear proteome of a rare cell type in Arabidopsis
       Highlights                                                          seedlings – young stomatal guard cells. Our work indicates
                                                                           high sensitivity of the new PL enzymes in plants. To enable
   •   TurboID (TID) and miniTurboID (miniTID) work
                                                                           adoption by the plant research community, we provide
       well in all tested tissues and growth stages of
                                                                           reagents and a broadly applicable workflow for PL
       stably transformed Arabidopsis and in
                                                                           experiments under different experimental conditions in a
       transiently transformed N. benthamiana leaves.
                                                                           variety of tissues in Arabidopsis and N. benthamiana and
   •   Labeling times of under 10 minutes can give
                                                                           highlight critical steps in experimental design and execution.
       immunoblot-detectable signals, but longer
       incubation may be required for protein
       identification by mass spectrometry (MS).
   •   In Arabidopsis, TID activity is higher than miniTID                 Results
       activity, but ‘background’ labeling with                            TurboID and miniTurboID can biotinylate plant proteins
       endogenous biotin is also increased.                                under conditions appropriate for plant growth
   •   Biotin concentrations in the range of 2.5-50 µM
       and 20-50 µM are suitable for enhanced labeling                     With increased efficiency, BioID-based PL would be a
       with TID and miniTID. For most Arabidopsis                          valuable tool to study protein interactions and local
       tissues, submergence in the biotin solution is                      proteomes on a cell type-specific level in plants. We
       sufficient but some tissues and other plants may                    therefore made an initial diagnosis of whether the improved
       require vacuum infiltration of the biotin solution                  BirA* variants TurboID and miniTurboID (hereafter called TID
       for optimal labeling.                                               and miniTID; also abbreviated as TbID and mTb in animal
   •   TID and miniTID work at temperatures compatible                     literature) are appropriate for PL applications in plants, by
       with normal plant growth and at elevated                            testing their activity in the nucleus and cytosol of two plant
       temperatures, but are most likely not suitable for                  model systems: transiently transformed N. benthamiana
       cold stress experiments.                                            leaves and young seedlings of stably transformed
   •   Proximity labeling (PL) with the FAMA-TID fusion                    Arabidopsis. To enable a comparison with previous
       protein led to the identification of new putative                   experiments in the literature, we also included the original
       co-activator       and     -repressor       complex                 BirA* in our experiments and expressed all three versions
       components for FAMA, a transcription factor in                      under the ubiquitous UBIQUITIN10 (UBQ10) promoter. A
       young guard cells.                                                  YFP tag was added to confirm correct expression and
   •   PL with nuclear TID produced general and young                      localization of the TID and miniTID biotin ligases (Figure 1 –
       guard cell-specific proteomes with high                             figure supplements 1 and 2).
       specificity for nuclear proteins and identified
       guard cell specific transcription factors.                          To test biotin ligase activities, we treated leaf discs from N.
   •   Important considerations for the experimental                       benthamiana leaves or whole five-day old transgenic
       design of PL experiments: choice of biotin ligase                   Arabidopsis seedlings, each expressing TID or miniTID, with
       (TID vs. miniTID); proper controls to distinguish                   biotin and subsequently monitored biotinylation in total
       specific labeling from background; optimization                     protein extracts using streptavidin immunoblots. For biotin
       of labeling conditions (biotin concentration,                       treatment, we briefly vacuum infiltrated the plant tissue with
       treatment time); optimization of bead amount for                    the biotin solution and then incubated the tissue submerged
       affinity purification                                               in the solution for one hour at room temperature. Mock- or
   •   Important considerations for affinity purification                  untreated plants were used as controls (Figure 1A). In TID-
       and MS identification of biotinylated proteins:                     and miniTID-expressing N. benthamiana and Arabidopsis,
       depletion of free biotin to reduce required bead                    biotin treatment induced strong labeling of proteins,
       amount (buffer exchange with gel filtration                         demonstrating that the new biotin ligases work under our
       columns or centrifugal filters, dialysis); beads for                chosen conditions in plants. As was observed in other
       affinity purification (avidin-, streptavidin-, or                   organisms, both TID and miniTID showed greatly increased
       neutravidin beads vs. anti-biotin antibodies); MS                   activity compared to BirA*, which mainly achieved weak self-
       sample prep (on-bead trypsin digest vs. elution                     labeling within one hour of biotin treatment (Figure 1B-C,
       and in-gel digest); MS and quantification                           Figure 1 – figure supplements 3 and 4). Since plants
       method (label-free vs. isotopic labeling)                           produce and store free biotin in their cells, we were
                                                                           concerned about 'background’ labeling in the absence of
                                                                           exogenous biotin. Although it did appear, background

                                                                       3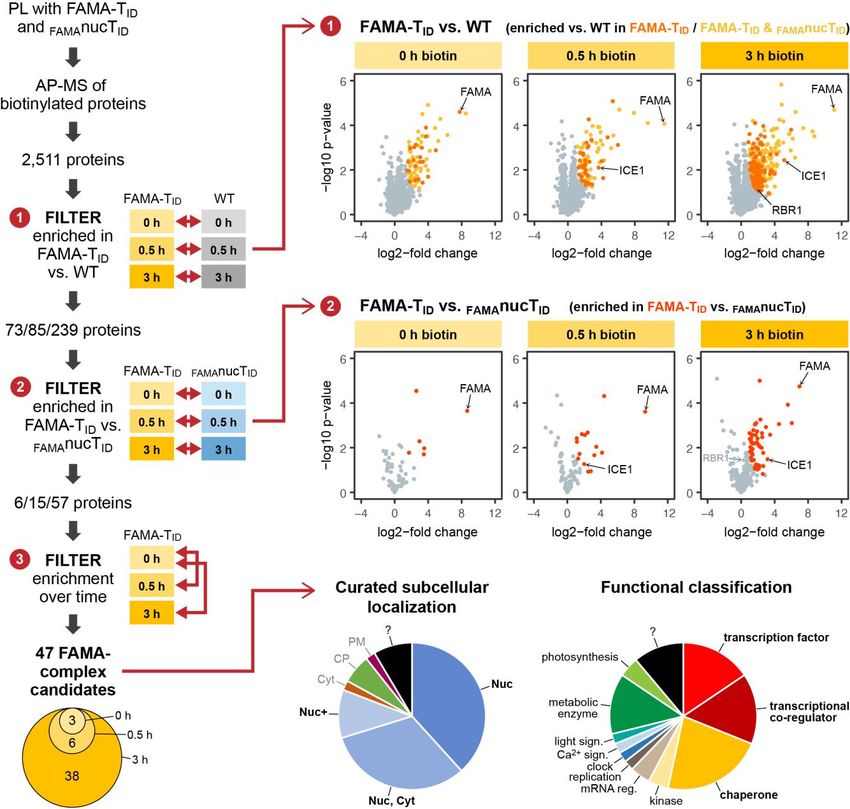
bioRxiv preprint first posted online May. 13, 2019; doi: http://dx.doi.org/10.1101/629675. The copyright holder for this preprint
 (which was not peer-reviewed) is the author/funder, who has granted bioRxiv a license to display the preprint in perpetuity.
                              It is made available under a CC-BY-NC-ND 4.0 International license.

                                                                                          Figure 1: TID and miniTID exhibit robust
                                                                                          biotinylation activity in N. benthamiana and
                                                                                          Arabidopsis

                                                                                          (A) Overview of the experimental setup.
                                                                                          UBQ10pro::BirA*/TID/miniTID-YFP constructs with an
                                                                                          NLS or NES for nuclear or cytosolic localization were
                                                                                          used for transient and stable transformation of N.
                                                                                          benthamiana and A. thaliana, respectively. Tobacco
                                                                                          leaf discs or whole Arabidopsis seedlings were
                                                                                          submerged in a 250 µM biotin solution, briefly
                                                                                          vacuum infiltrated, incubated for one hour at room
                                                                                          temperature and frozen. Untreated controls were
                                                                                          infiltrated with H2O or frozen directly. Expression and
                                                                                          activity of the BirA versions were analyzed by
                                                                                          immunoblotting. (B-C) Biotin ligase activity in N.
                                                                                          benthamiana (B) and Arabidopsis (C) Streptavidin
                                                                                          (SA) and anti-GFP immunoblots (IB) of protein
                                                                                          extracts from tobacco leaf discs and Arabidopsis
                                                                                          expressing the cytosolic BirA variants without (-) and
                                                                                          with (+) biotin treatment. Untransformed tobacco
                                                                                          leaves and Col-0 wild-type (WT) seedlings were
                                                                                          used as controls. Each sample is a pool of 3 leaf
                                                                                          discs or ~ 30 seedlings. Coomassie Brilliant Blue-
                                                                                          stained membranes (CBB) are shown as a loading
                                                                                          controls. Asterisks mark the positions of naturally
                                                                                          biotinylated proteins.

                                                                                          For microscopy images showing the subcellular
                                                                                          localization of the BirA variants in N. benthamiana
                                                                                          and Arabidopsis see Figure 1 – figure supplements
                                                                                          1 and 2. For immunoblots showing the activity and
                                                                                          expression of both cytosolic and nuclear BirA
                                                                                          versions in N. benthamiana and Arabidopsis see
                                                                                          Figure 1 – figure supplements 3 and 4. For a
                                                                                          schematic overview over the generation and
                                                                                          composition of the available vectors in the ‘PL
                                                                                          toolbox’ see Figure 1 – figure supplement 5.

labeling was in most cases negligible. Direct comparison of                constructs, we did not observe any significant differences in
TID and miniTID in our plant systems revealed little difference            labeling efficiency at the resolution of immunoblots (Figure 1
in either activity or background labeling in N. benthamiana                – figure supplements 3 and 4).
(Figure 1B, Figure 1 – figure supplement 3), possibly due
to the high expression levels of the constructs. In                        From these experiments, we conclude that both TID and
Arabidopsis, however, TID was clearly more active than                     miniTID are well suited for use in plants. Which version is
miniTID but also produced more background, especially in                   more suitable may depend on the individual question and
lines with lower expression levels (Figure 1C, Figure 1 –                  whether high sensitivity (TID) or tighter control over labeling
figure supplement 4). Comparing nuclear and cytosolic                      time (miniTID) is important. For this current study, we

                                                                       4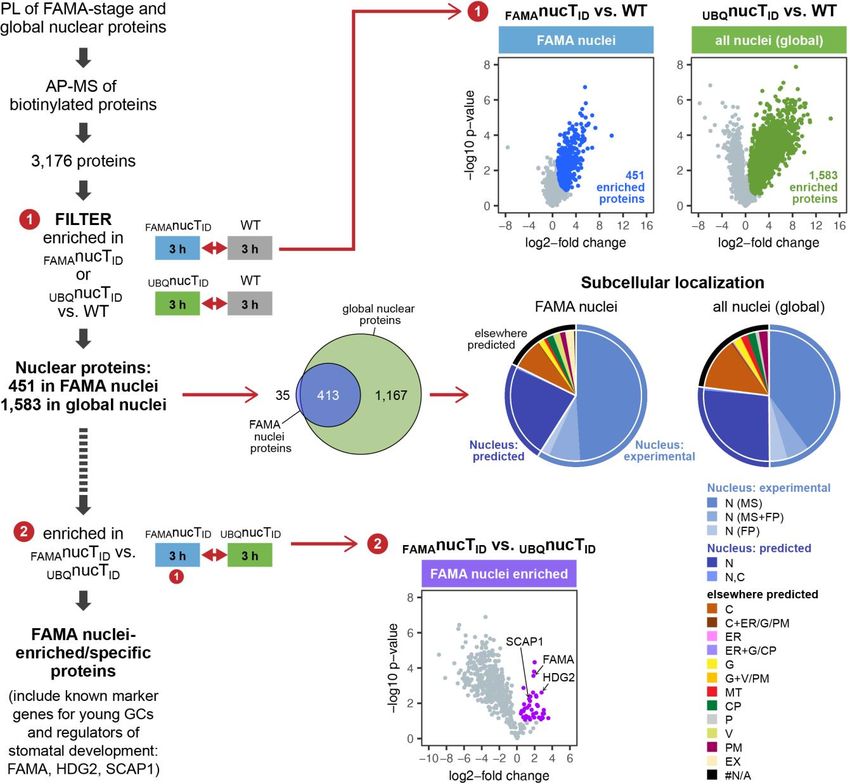
bioRxiv preprint first posted online May. 13, 2019; doi: http://dx.doi.org/10.1101/629675. The copyright holder for this preprint
 (which was not peer-reviewed) is the author/funder, who has granted bioRxiv a license to display the preprint in perpetuity.
                              It is made available under a CC-BY-NC-ND 4.0 International license.

generated a versatile set of gateway-compatible entry and                  alone or as fusion with a protein of interest under a promoter
destination vectors that can be used to express TID or miniTID             of choice (Figure 1 – figure supplement 5). This ‘toolbox’

Figure 2: TID and miniTID work quickly and tolerate a range of experimental conditions in Arabidopsis seedlings

(A-D) Dependency of TID and miniTID activity on labeling time, temperature, biotin concentration and biotin application. Four to five day old
seedlings were treated with biotin as described below. Activity and expression of the T ID/miniTID-YFP constructs were analyzed by
immunoblots (IB) with streptavidin-HRP (SA) and anti-GFP antibodies. Coomassie Brilliant Blue-stained membranes (CBB) are shown as a
loading controls. Asterisks mark the positions of naturally biotinylated proteins. Each sample is a pool of ~ 30-50 seedlings. (A) Labeling
time. Wild-type (WT) and UBQ10pro::TID-YFPNLS (TID-YFP) seedlings were submerged in 250 µM biotin, briefly vacuum infiltrated and
incubated for the indicated time at room temperature (22°C). A control sample was taken before treatment (0’). (B) Temperature-
dependency. WT, UBQ10pro::TID-YFPNLS (TID-YFP) and UBQ10pro::miniTID-NESYFP (miniTID-YFP) seedlings were submerged in 250 µM
biotin and incubated for one hour at the indicated temperature. Control samples (-) were incubated in H2O at 22°C. (C) Biotin concentration.
UBQ10pro::TID-NESYFP (TID-YFP) and UBQ10pro::miniTID-NESYFP (miniTID-YFP) seedlings were submerged in 0.5 to 250 µM biotin and
incubated for one hour at room temperature. A control sample was taken before treatment (0 µM). (D) Biotin application. WT and
UBQ10pro::TID-YFPNLS (TID-YFP) seedlings were submerged in 250 µM biotin, briefly vacuum infiltrated (vac. inf.) or not and incubated for
one hour at room temperature. A control sample was taken before treatment.

For a longer time course in Arabidopsis and quantification of the immunoblots shown in (C) see Figure 2 – figure supplements 1 and 3. For a
short time course and temperature dependency of TID and miniTID in N. benthamiana see Figure 1 – figure supplement 3 and Figure 2 – figure
supplement 2.

                                                                       5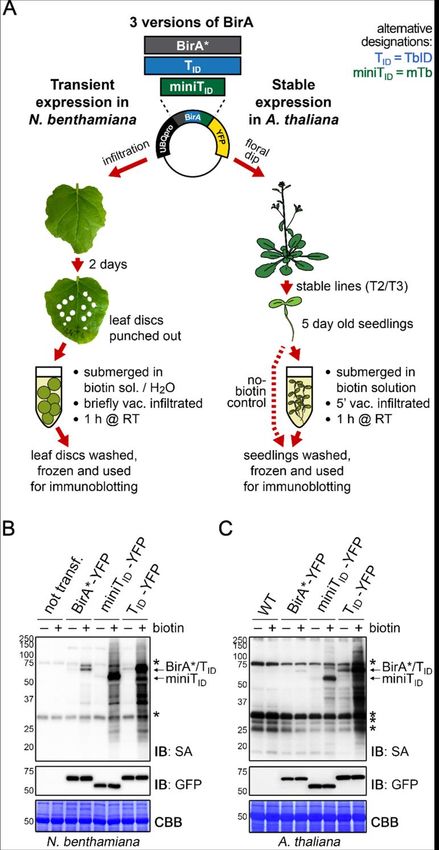
bioRxiv preprint first posted online May. 13, 2019; doi: http://dx.doi.org/10.1101/629675. The copyright holder for this preprint
 (which was not peer-reviewed) is the author/funder, who has granted bioRxiv a license to display the preprint in perpetuity.
                              It is made available under a CC-BY-NC-ND 4.0 International license.

will be accessible through Addgene upon publication (vectors               that TID has a larger dynamic range than miniTID. Weak over-
are listed in the materials and methods section).                          background labeling could already be seen with 0.5 µM
                                                                           biotin, which increased weakly through 20 µM, followed by a
Testing boundaries with TurboID – effects of                               steeper increase with 30µM and was more or less saturated
labeling time, temperature, biotin concentration                           at 50-75 µM. MiniTID required between 2.5 and 10 µM biotin
and application                                                            for weak activity, showed a steep increase with 20 µM
                                                                           (comparable to TID) and was also saturated at 50-75 µM
Achieving an optimal enzyme efficiency by using the right                  (Figure 2C, Figure 2 – figure supplement 3). TID and
experimental conditions, like labeling time, temperature,                  miniTID are therefore comparable to BirA* in their biotin
biotin concentration and mode of application, can be key for               requirement and concentrations of 2.5-50 µM (TID) and 20-
using PL with low-abundant proteins in plants. We therefore                50 µM (miniTID) seem to be appropriate.
tested the effect of those parameters on biotin labeling in four
to five day old Arabidopsis seedlings expressing TID and                   In initial experiments, we vacuum infiltrated the plant material
miniTID under the UBQ10 promoter. In mammalian cell                        with the biotin solution to maximize biotin uptake. At least in
culture, 10 minutes of labeling with TID were sufficient to                Arabidopsis seedlings, this is not necessary. Simply
visualize biotinylated proteins by immunoblot and to perform               submerging the plantlets in the biotin solution resulted in the
analysis of different organellar proteomes (Branon et al.                  same amount of labeling as vacuum infiltration followed by
2018). Using immunoblots, we observed similarly fast                       incubation in the biotin solution did (Figure 2D). This finding
labeling in plants. TID induced labeling of proteins over                  is very important since it not only simplifies handling of the
background levels within 15 minutes of biotin treatment and                experiment, but also improves isolation of labeled proteins by
labeling steadily increased over the next three to five hours              reducing the amount of free biotin in the tissue.
(Figure 2A, Figure 2 – figure supplement 1). An increase
in self-labeling of TID was evident even earlier, after as little          TurboID works in a wide variety of developmental
as five minutes (compare Figure 4 – figure supplement 3).                  stages and tissues
Time course experiments in N. benthamiana suggest that
miniTID is equally fast, with clear labeling of proteins visible           For TID to be widely applicable it must be able to biotinylate
within 10 minutes (Figure 1 – figure supplement 3). This is                proteins in many developmental stages and plant tissues.
a significant improvement over BirA*, for which labeling times             One initial concern, especially with TID, was that background
of 24 hours were applied in all three published plant                      labeling from endogenous biotin would accumulate over
experiments (Khan et al. 2018; Conlan et al. 2018; Lin et al.              time, making experiments with older tissues unfeasible. This
2017).                                                                     was, however, not the case. Labeling worked well in 4 to 14
                                                                           day old plate-grown seedlings without significant increase of
We systematically tested the effect of different biotin                    background (Figure 3 – figure supplement 1). The same
treatment temperatures on TID and miniTID activity in                      was true for separated roots and shoots of 6 to 14 day old
Arabidopsis seedlings. Encouragingly, the activity of both                 seedlings and even for rosette leaves and flower buds of
variants was nearly as high at room temperature (22°C) as                  adult Arabidopsis plants grown on soil (Figure 3, Figure 3 –
at 30°C. Moreover, TID showed only a moderate increase of                  figure supplements 2 and 3). Background activity was low,
activity at 37°C, while miniTID activity was actually reduced at           especially in leaf tissue, and labeling worked well. Vacuum
this temperature (Figure 2B). High activity at ambient                     infiltration was not required for the tested plant sample types,
temperatures was also observed in N. benthamiana (Figure                   except for unopened floral buds, where infiltration improved
2 – figure supplement 2). Increasing temperatures above                    labeling relative to submergence in the biotin solution
plant growth conditions to improve labeling is therefore not               (Figure 3). This is likely because petals and reproductive
needed.                                                                    tissues are not in direct contact with the biotin solution.
                                                                           Overall, our experiments suggest that TID will be applicable
The biotin concentration used for PL is an important                       in a wide range of developmental stages and tissues. Since
consideration. Endogenous levels of biotin in plants are                   TID and miniTID behaved similar in most experiments, it is
sufficient for low-level labeling of proteins by TID, and to some          likely that the same is true for miniTID.
extent also by miniTID. While this may be useful for some
applications, most applications will require strongly                      Testing TurboID’s potential to identify partners of
enhanced and time-regulated labeling through the addition of               a very low-abundant TF and to explore the nuclear
exogenous biotin. Although using excessive amounts of                      proteome of a rare and transient cell type
biotin is inconsequential for immunoblots, it poses a problem
for downstream protein purification with streptavidin beads,               After confirming general applicability of TID for PL in plants,
as will be discussed later. We therefore tested biotin                     we wanted to test its performance for the identification of rare
concentrations ranging from 0.5 to 250 µM to determine the                 protein complexes and the characterization of cell type-
optimal substrate concentration for TID and miniTID. We found              specific organellar proteomes in a real experiment. For this
                                                                           purpose, we chose a cell type-specific transcription factor

                                                                       6
bioRxiv preprint first posted online May. 13, 2019; doi: http://dx.doi.org/10.1101/629675. The copyright holder for this preprint
(which was not peer-reviewed) is the author/funder, who has granted bioRxiv a license to display the preprint in perpetuity.
It is made available under a CC-BY-NC-ND 4.0 International license.
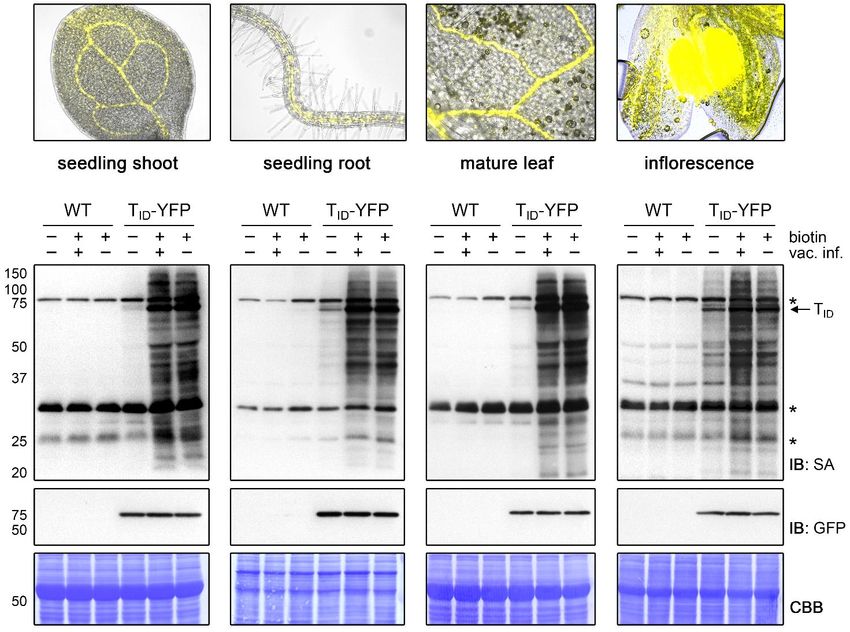
Figure 3: TID works in different developmental stages and organs of Arabidopsis and does not require vacuum
infiltration of biotin
TID activity in shoots and roots of 10 day old plate-grown UBQ10pro::TID-YFPNLS (TID-YFP) seedlings, and in rosette leaves and unopened
flower buds of mature soil-grown plants. Col-0 wild-type (WT) was used as control. The plant material was submerged in a 250 µM biotin
solution, briefly vacuum infiltrated until air spaces were filled with liquid or not vacuum infiltrated and incubated at room temperature for one
hour. Control samples were taken before biotin treatment. Samples are pools of three shoots or roots, two rosette leaves or four
inflorescences. Activity and expression of TID-YFP were analyzed by immunoblots (IB) with streptavidin-HRP (SA) and anti-GFP antibodies.
Coomassie Brilliant Blue-stained membranes (CBB) are shown as a loading controls. Asterisks mark the positions of naturally biotinylated
proteins. Epifluorescence images of seedlings and mature tissues of the TID-YFP line are shown on top.
For immunoblots showing TID activity and background in four to 14 day old whole seedlings and shoots and roots of six to 14 day old seedlings
see Figure 3 – figure supplements 1 and 2. For further microscopy images of the TID-YFP line see Figure 3 – figure supplement 3.
(FAMA) and a subcellular compartment of a rare cell type fluorescence complementation studies (Chen et al. 2016;
(nuclei of FAMA-expressing stomatal cells) for a case study. Kanaoka et al. 2008; Lee, Lucas, and Sack 2014; Li, Yang,
FAMA is a nuclear basic helix-loop-helix (bHLH) TF that is and Chen 2018; Matos et al. 2014; Ohashi-Ito and Bergmann
expressed in young stomatal guard cells (GCs) in the 2006), but only few have been confirmed by in vivo functional
epidermis of developing aerial tissues (Ohashi-Ito and data.
Bergmann 2006). The low abundance of FAMA and FAMA-
expressing cells renders identification of interaction partners For our study, we generated plants expressing TID and a
and cell type-specific nuclear proteins by traditional methods fluorescent tag for visualization under the FAMA promoter,
challenging and makes it well suited for a proof-of-concept either as a FAMA-protein fusion or alone with a nuclear
experiment. Potential FAMA interaction partners were localization signal (NLS) (Figure 4A, Figure 4 – figure
previously identified in yeast-2-hybrid (Y2H) and bimolecular supplement 1). By comparing proteins labeled in the
7bioRxiv preprint first posted online May. 13, 2019; doi: http://dx.doi.org/10.1101/629675. The copyright holder for this preprint
(which was not peer-reviewed) is the author/funder, who has granted bioRxiv a license to display the preprint in perpetuity.
It is made available under a CC-BY-NC-ND 4.0 International license.
Figure 4: Testing TID’s potential to label
protein interactors and subcellular
proteomes in a rare cell type in
Arabidopsis
(A) Plant lines generated for the ‘FAMA
interactome’ and ‘nuclear proteome’
experiments. Line names and genotypes are
given on the top, schematic expression of the TID
fusion proteins (yellow dots) in a leaf and
confocal microscopy images of the epidermis of
five day old seedlings are shown below (TID
fusion protein = yellow; propidium iodide-stained
cell wall = purple; scale bar = 50 μM). FAMA-TID
and FAMAnucTID constructs are expressed in
young guard cells, while the UBQnucTID construct
is expressed ubiquitously. (B) Time course to
optimize time points for the experiments. Five
day old wild-type (WT) and FAMA-TID seedlings
were submerged in 250 µM biotin, briefly vacuum
infiltrated and incubated for the indicated time at
room temperature. Control samples were taken
before treatment (0’). Samples are pools of ~ 30
seedlings. Activity and expression of FAMA-TID
were analyzed by immunoblots (IB) with
streptavidin-HRP (SA) and anti-GFP antibodies.
The Coomassie Brilliant Blue-stained membrane
(CBB) is shown as loading control. Asterisks and
circles mark the positions of naturally biotinylated
proteins and putative FAMA-TID targets,
respectively. (C-D) Scheme of samples and
comparisons used in the ‘FAMA interactome’
(C) and ‘nuclear proteome’ (D) experiments. (E)
Simplified workflow of the experimental
procedure from biotin labeling to protein
identification by liquid chromatography coupled
to mass spectrometry (LC-MS/MS). Three
biological replicates were used. Abbreviations:
SA, streptavidin; LFQ, label free quantification.
For larger extracts of the confocal microscopy
images of the plant lines used in the PL
experiments shown in (A) see Figure 4 – figure
supplement 1. For complementation of the fama-
1 phenotype by the FAMApro::FAMA-TID-Venus
construct see Figure 4 – figure supplement 2. For
another labeling time course with the FAMA-TID
line using shorter labeling times with and without
vacuum infiltration of biotin see Figure 4 – figure
supplement 3. For immunoblots showing
successful labeling and purification of proteins for
the ‘FAMA interactome’ and ‘nuclear proteome’
experiments see Figure 4 – figure supplements 4
and 5. For immunoblots demonstrating the
importance of the biotin depletion step and a
comparison of different biotin depletion strategies
see Figure 4 – figure supplements 6 and 7.
FAMApro::FAMA-TID-Venus (FAMA-TID) and FAMApro::TID- we can test the ability of the system to identify (1) proteins in
YFPNLS (FAMAnucTID) plants to each other and to wild-type close proximity to FAMA (FAMA complexes), (2) the nuclear
(WT) plants and UBQ10pro::TID-YFPNLS (UBQnucTID) plants, protein composition during the FAMA-cell stage, (3) the
8bioRxiv preprint first posted online May. 13, 2019; doi: http://dx.doi.org/10.1101/629675. The copyright holder for this preprint
(which was not peer-reviewed) is the author/funder, who has granted bioRxiv a license to display the preprint in perpetuity.
It is made available under a CC-BY-NC-ND 4.0 International license.
nuclear proteome in general, and (4) possible FAMA-stage figure supplements 4 and 5). The inclusion of a biotin-
specific nuclear proteins. The FAMA-TID-Venus construct is depletion step was found to be critical as free biotin in the
functional, since it complements the seedling-lethal protein extracts competes with biotinylated proteins for
phenotype of the fama-1 mutant (Figure 4 – figure binding of the streptavidin beads (Figure 4 – figure
supplement 2). supplement 6). While for mammalian cell culture or rice
protoplasts thorough washing of the cells seems to suffice for
Determining suitable incubation times is crucial since too removal of free biotin, this is not the case for intact plant
short an incubation can yield insufficient protein amounts for tissue (see also (Conlan et al. 2018; Khan et al. 2018)).
identification but excessive incubation could label the whole Especially when large amounts of starting material and
subcellular compartment. We therefore performed labeling moderate amounts of biotin are used, little to none of the
time-courses with the FAMA-TID line, using immunoblots as biotinylated proteins may be bound by the beads. To
a readout. FAMA auto-labeling could be observed after as maximize the amount of purified proteins it is further
little as five minutes but clear labeling of other proteins advisable to determine the appropriate amount of beads
required approximately 15 to 30 minutes. Longer incubation required for each experiment. We used 200 µl beads for
led to further increase in labeling up to three hours, both in approximately 16 mg total protein per sample. This amount
the form of stronger discrete bands and of diffuse labeling, was chosen based on tests with different bead-to-extract
but stayed more or less the same thereafter (Figure 4B, ratios (Figure 4 – figure supplement 7) and was sufficient
Figure 4 – figure supplement 3). Based on these to bind most biotinylated proteins in our protein extracts,
observations, we chose 0.5 and 3 hour biotin treatments, although the beads were slightly oversaturated by the highly
after which we would expect abundant and most FAMA labeled UBQnucTID samples (Figure 4 – figure supplement
interactors to be labeled, respectively, for the ‘FAMA 5D).
interactome’ experiment (Figure 4C). For the ‘nuclear
proteome’ experiment (Figure 4D), only the longer 3 hour Following AP, we performed liquid chromatography coupled
time point was used, since over-labeling of the compartment to tandem mass spectrometry (LC-MS/MS) analysis to
was not a concern. Accordingly, the FAMA-TID, FAMAnucTID identify and quantify the captured proteins. Tryptic digest for
and WT lines were treated for 0, 0.5 and 3 hours, and the LC-MS/MS analysis was done on-beads, since test
UBQnucTID line only for 3 hours. As plant material, we chose experiments revealed that elution from the beads using two
seedlings five days post germination, which corresponds to different methods (Cheah and Yamada 2017; Schopp and
a peak time in FAMA promoter activity, as determined Bethune 2018) and subsequent in-gel digestion of
empirically by microscopy. We used three biological biotinylated proteins yielded significantly lower protein
replicates per sample. To make the datasets as comparable amounts and less protein identifications (data not shown).
as possible, all steps preceding data analysis were done This apparent sample loss is caused by the strong biotin-
together for the two experiments, as described in the next streptavidin interaction, which allows for stringent washing
section. conditions but also prevents efficient elution of biotinylated
proteins from the beads. Notably, highly biotinylated proteins,
From labeling to identification of biotinylated which likely comprise the most interesting candidates, will
proteins – identifying critical steps interact with more than one streptavidin molecule and will be
especially hard to elute. After MS analysis, we identified and
Through empirical testing of experimental conditions using quantified the proteins by label-free quantification and filtered
the UBQnucTID line, we identified steps and choices that have for significantly enriched proteins. This part was done
a big impact on success of protein purification and separately for the ‘FAMA interactome’ and ‘nuclear
identification after PL with TID. These include sample choice proteome’ experiments and is described in the following
to maximize bait abundance, removal of free biotin, sections.
optimizing the amount of streptavidin beads for affinity
purification (AP) and choosing among MS sample prep Proximity labeling is superior to AP-MS for
procedures. Below, we describe our experimental procedure identification of candidate interactors of FAMA
(Figure 4E) and highlight key choices.
FAMA acts as both an activator and repressor for hundreds
We first labeled five day old seedlings, by submerging them of genes (Hachez et al. 2011), suggesting a need for
in a 50 µM biotin solution for 0, 0.5 or 3 hours, quickly washed coordinated action with other TFs, co-activators and -
them with ice cold water to stop the labeling reaction and to repressors (Matos et al. 2014). Identifying such proteins
remove excess biotin and isolated total proteins for AP of through classical affinity purification-mass spectrometry
biotinylated proteins. The protein extracts were then passed approaches is hampered by the low overall abundance of
through PD-10 gel filtration columns to reduce the amount of FAMA. Apart from INDUCER OF CBF EXPRESSION 1
free biotin in the sample before proceeding with AP using (ICE1), which is a known heterodimerization partner of FAMA
magnetic streptavidin beads. Successful labeling and (Kanaoka et al. 2008), we failed to identify any transcriptional
purification was confirmed by immunoblots (Figure 4 – (co-)regulators by AP-MS with FAMA-CFP, despite the use
9bioRxiv preprint first posted online May. 13, 2019; doi: http://dx.doi.org/10.1101/629675. The copyright holder for this preprint
(which was not peer-reviewed) is the author/funder, who has granted bioRxiv a license to display the preprint in perpetuity.
It is made available under a CC-BY-NC-ND 4.0 International license.
Figure 5: ‘FAMA interactome’ experiment – PL with TID reveals potential FAMA interactors involved in transcriptional regulation
Workflow (left) and results (right) of the experimental setup and data filtering process. Biotinylated proteins from seedlings
expressing FAMA-TID or nuclear TID in FAMA-stage cells (FAMAnucTID) and from wild-type (WT) after 0, 0.5 and 3 hours of biotin treatment
were affinity purified (AP) with streptavidin beads and analyzed by mass spectrometry (MS). Proteins that were identified in all three
biological replicates of at least one genotype and time point were used to filter for FAMA-complex candidates by three consecutive filtering
steps: First, proteins enriched in FAMA-TID compared to WT were determined for each time point using unpaired 2-sided t-tests with a
permutation-based FDR for multiple sample correction, considering only proteins that were identified in all three replicates of FAMA-TID
at this time point (cutoff: FDR = 0.05, S0 = 0.5; ❶). Significant proteins were then filtered for enrichment compared to FAMAnucTID (same
t-test parameters; ❷) and for enrichment in biotin-treated versus untreated FAMA-TID samples (t-test: p < 0.05; ❸). The Venn diagram
on the bottom left shows the distribution of the 47 candidates between time points (see Table 1 for candidate list). Scatter plots on the
right show log2-fold changes and -log10 p-values from t-test comparisons between FAMA-TID and WT (top) and FAMA-TID and FAMAnucTID
(center). Proteins significantly enriched in FAMA-TID are shown in yellow, orange and red. All filtering steps and statistical analyses were
done in Perseus. Subcellular localization and functional distribution of the candidate proteins is shown as pie charts on the bottom right.
Data were manually curated from literature. Abbreviations: Nuc, nucleus; Cyt, cytosol, CP, chloroplast, PM, plasma membrane, +, and
other.
For hierarchical clustering and PCA of samples used in this experiment, see Figure 5 – figure supplement 2. For scatterplots and heatmaps
of proteins enriched in FAMA-TID and FAMAnucTID compared to WT and for enrichment of proteins over time… (continued on next page)
10bioRxiv preprint first posted online May. 13, 2019; doi: http://dx.doi.org/10.1101/629675. The copyright holder for this preprint
(which was not peer-reviewed) is the author/funder, who has granted bioRxiv a license to display the preprint in perpetuity.
It is made available under a CC-BY-NC-ND 4.0 International license.
of crosslinking agents and large amounts of plant material
(15 g of four day old seedlings per sample). Moreover, less This left us with 47 ‘high confidence’ candidates (Figure 5,
than 20% of the AP-MS-derived ‘candidates’ were predicted Table 1), 35 of which were previously demonstrated to be in
to be nuclear, and one quarter were chloroplast proteins the nucleus using fluorescent protein fusions or were found
(Figure 5 – figure supplement 1, source file Figure 5 – in MS-based nuclear proteome studies (Figure 5, Table 1,
supplemental table 5). We therefore wanted to see if PL source file – Figure 5 – supplemental tables 2 and 4).
would improve the identification of biologically relevant Notably, more than half of the candidates have a role in
FAMA interactors. regulation of transcription or are chaperones which could
assist in FAMA’s role as a TF or in protein folding and
For the ‘FAMA interactome’ experiment we compared stabilization, respectively (Figure 5, Table 1, source file –
proteins purified from plants expressing the FAMA-TID fusion Figure 5 – supplemental table 4). Moreover, several of
(FAMA-TID) with proteins from WT and with proteins from these proteins have previously been shown to interact with
plants expressing nuclear TID (FAMAnucTID) after 0, 0.5 and 3 each other, which suggests that they could be part of the
hours of biotin treatment. In total, we identified 2,511 proteins same FAMA complexes. This is a huge improvement
with high confidence (quantified in all three replicates of at compared to our AP-MS experiment, which could only
least one sample). Principal component analysis (PCA) confirm FAMA’s interaction with its obligate
showed a clear separation of the samples by genotype and heterodimerization partner ICE1. The transcriptional
time point (Figure 5 – figure supplement 2). Despite this regulators we found with PL can be roughly divided into two
clear separation, the majority of proteins were common to all categories: TFs and transcriptional co-regulators. Among the
samples, including the untreated WT control (source file TFs we again found ICE1 (as well as peptides shared
Figure 5 – supplemental table 1), indicating that a large between ICE1 and its orthologue SCRM2). We also found
proportion of identified proteins bound to the beads non- three other bHLH TFs (AIB/JAM1, JAM3, and BIM1) and the
specifically, and underlining the importance of appropriate non-canonical bHLH-type TF BZR1. AIB and JAM3 play
controls and a data filtering pipeline like the one described partially redundant roles in negative regulation of jasmonic
below. acid (JA) signaling (Sasaki-Sekimoto et al. 2013; Fonseca et
al. 2014), while BIM1 and BZR1 mediate brassinosteroid
To narrow down the number of candidates and identify (BR) signaling (Yin et al. 2002; Wang et al. 2002). Both JA
proteins enriched in the FAMA-TID plants, we applied several and BR signaling play roles in stomatal function or
filtering steps (Figure 5). First, we identified proteins that development (Acharya and Assmann 2009; Gudesblat et al.
were significantly enriched in the FAMA-TID samples 2012; Kim et al. 2012).
compared to WT, considering only proteins that were found
in all three replicates of FAMA-TID. This resulted in a list of Among the transcriptional co-regulators we found two
73, 85 and 239 proteins (including FAMA) at the 0, 0.5 and 3 significantly enriched transcriptional co-activators: MED16,
hour time points, respectively (Figure 5, source file – Figure which is part of the mediator complex that links TFs to RNA
5 – supplemental table 2). Since TID is highly active and Pol II (Kidd et al. 2011), and HAC1, which is a histone acetyl
endogenous levels of biotin are sufficient for low-level transferase (HAT) (Deng et al. 2007). Combined with
labeling, there is a risk that proteins are labeled stochastically previous data showing a link between FAMA and RNA Pol II
and that, over time, the whole nuclear proteome would be (Chen et al. 2016), this suggests that FAMA activates genes
labeled. Notably, more than half of the proteins enriched in both directly by recruiting RNA Pol II and by opening up the
the FAMA-TID plants at any of the time points were also chromatin for other transcriptional regulators. Among
enriched in the FAMAnucTID plants (Figure 5, Figure 5 – transcriptional co-repressors were TOPLESS (TPL)-related
figure supplement 3, source file – Figure 5 – proteins TPR3 and TPR4 and LEUNIG (LUG) and LEUNIG
supplemental table 2). We therefore filtered out proteins HOMOLOG (LUH), which recruit histone deacetylases
that were not significantly enriched in the FAMA-TID versus (HDACs) to TFs (Long et al. 2006). Additionally, we identified
the FAMAnucTID samples, reducing the dataset to 6, 15 and 57 the linker protein SEUSS (SEU), which mediates interaction
proteins (including FAMA) (Figure 5, source file – Figure 5 of LUG and LUH with TFs (Liu and Karmarkar 2008;
– supplemental table 2). Finally, we removed proteins that Sitaraman, Bui, and Liu 2008). The identification of all three
were not significantly enriched after biotin treatment members of the SEU/LUG/LUH co-repressor complex is a
compared to the untreated samples, since these proteins are strong indication of a functional complex with FAMA in the
likely genotype-specific contaminations. plant. Relaxing our filtering criteria to include proteins that are
(Figure 5: figure legend continued) … in all three genotypes, see Figure 5 – figure supplements 3 and 4. For tables summarizing all
identified and enriched proteins, see source file Figure 5 – supplemental tables 1-4. For an overview over the workflow and proteins identified
by affinity purification of FAMA-interacting proteins using a classical AP-MS strategy with GFP-Trap beads, see Figure 5 – figure supplement
1 and source file Figure 5 – supplemental table 5.
11bioRxiv preprint first posted online May. 13, 2019; doi: http://dx.doi.org/10.1101/629675. The copyright holder for this preprint
(which was not peer-reviewed) is the author/funder, who has granted bioRxiv a license to display the preprint in perpetuity.
It is made available under a CC-BY-NC-ND 4.0 International license.
enriched in the FAMA-TID vs FAMAnucTID samples but were by setting a stringent cutoff on enrichment between FAMA-
not significant under our stringent cutoff, we find several TID and FAMAnucTID, we might lose some true interactors. This
more components of transcriptional co-regulator complexes, might be especially true of ubiquitously expressed proteins
including three more MED proteins, another HAT, two more with many partners like RBR1, where FAMA-RBR1
TPL-related proteins and TPL itself. interactions are likely to represent only a small fraction of all
complexes.
RBR1, a cell cycle regulator and a known interactor of FAMA
(Lee, Lucas, and Sack 2014; Matos et al. 2014), is also Overall, this experiment demonstrates the usefulness of PL
among the FAMA-TID enriched proteins but, due to a modest to identify potential interaction partners of rare proteins. We
fold change, did not pass our last filters (Figure 5, source identified several good FAMA-complex candidates which
file – Figure 5 – supplemental table 2). This suggests that could support FAMA in its role as a key TF and provide a
Table 1: FAMA complex candidates from Figure 5
Enriched at time point Subcellular
AGI Gene name Functional annotation
0h 0.5 h 3h localization
Y Y AT3G26744 ICE1, SCRM bHLH transcription factor N
Y Y AT2G46510 AIB, JAM1 bHLH transcription factor N
Y AT4G16430 JAM3 bHLH transcription factor N, C
Y AT5G08130 BIM1 bHLH transcription factor N
Y AT1G75080 BZR1 transcription factor N, C
Y Y AT5G11060 KNAT4 homeobox transcription factor N, C
Y AT2G41900 OXS2, TCF7 zinc finger transcription factor (N), C
Y AT1G79000 HAC1, PCAT2 transcriptional co-activator (histone acetyltransferase) N, C
Y AT4G04920 MED16, SFR6 transcriptional co-activator (mediator complex) N
Y AT1G43850 SEU transcriptional co-repressor adapter N
Y AT4G32551 LUG, RON2 transcriptional co-repressor N
Y AT2G32700 LUH, MUM1 transcriptional co-repressor N
Y AT3G15880 TPR4, WSIP2 transcriptional co-repressor N
Y AT5G27030 TPR3 transcriptional co-repressor N
Y AT5G02500 HSP70-1 HSP70 chaperone N, C
Y Y AT5G02490 HSP70-2 HSP70 chaperone N, C
Y AT3G09440 HSP70-3 HSP70 chaperone N, C
Y AT3G12580 HSP70-4 HSP70 chaperone N, C
Y AT5G22060 J2 HSP70 co-chaperone N
Y AT3G44110 J3 HSP70 co-chaperone N, C, MA
Y AT1G62740 HOP2 HSP90/70 co-chaperone (N), C
Y AT3G25230 FKBP62, ROF1 HSP90/70 co-chaperone (N), C
Y AT4G22670 HIP1, TPR11 HSP90/70 co-chaperone N, C
Y Y Y AT4G02450 P23-1 HSP90 co-chaperone N, C
Y Y Y AT5G56460 putative protein kinase PM
Y AT5G35410 SOS2, CIPK24 protein kinase N, C, PM
Y AT3G54170 FIP37 m6A methyltransferase complex component N
Y AT1G02140 HAP1, MAGO exon-junction complex component N, C
Y AT5G41880 POLA3, POLA4 putative DNA polymerase alpha subunit N
Y AT3G22380 TIC nuclear clock regulation factor N
Y AT2G41100 TCH3, CAL12 calcium-binding protein N
Y AT1G72390 PHL nuclear receptor/co-activator N, C
Y Y AT1G20110 FREE1, FYVE1 ESCRT-I complex component C, ES, N
Y AT1G18660 IAP1 C3HC4-type RING-finger domain protein MA, N
Y Y Y AT1G12200 FMO putative flavin monooxygenase N/A
Y Y AT3G53260 PAL2 phenylalanine ammonia-lyase N, C, EX
Y AT3G23840 CER26-LIKE acyl‐CoA‐dependent acyltransferase N/A
Y AT5G13710 CPH, SMT1 C‐24 sterol methyl transferase N
Y AT1G63180 UGE3 UDP-Glucose 4-Epimerase C*
Y AT5G17990 PAT1, TRP1 phosphoribosylanthranilate transferase CP*
Y AT1G15980 NDH48, NDF1 chloroplast NAD(P)H dehydrogenase complex subunit CP
Y AT4G30720 PDE327 putative oxidoreductase/electron carrier CP
Y AT1G50570 undescribed protein N
Y AT1G30070 undescribed protein N
Y AT5G15680 undescribed protein N/A
Y AT5G53330 undescribed protein N
Y AT4G25290 undescribed protein N/A
Column labels: Enriched at time point: time points at which a protein was significantly enriched are marked with Y. AGI: Arabidopsis gene
identifier. Subcellular localization: as described for fluorescent protein fusions in literature unless marked with * (localization inferred from
functional annotation): N, nucleus; (N), nucleus under heat or other stress; C, cytosol; EX, extracellular; PM, plasma membrane; ES,
endosomes; MA, membrane (associated); CP, chloroplast; N/A, localization unknown (no experimental evidence found and localization cannot
be clearly inferred from function).
For further information on the candidate proteins and selected references see source files Figure 5 – supplemental table 4.
12bioRxiv preprint first posted online May. 13, 2019; doi: http://dx.doi.org/10.1101/629675. The copyright holder for this preprint
(which was not peer-reviewed) is the author/funder, who has granted bioRxiv a license to display the preprint in perpetuity.
It is made available under a CC-BY-NC-ND 4.0 International license.
possible mechanism for FAMA to induce fate-determining expected since the UBQnucTID dataset also contains FAMA-
and lasting transcriptional changes in developing GCs. Some stage cells.
of the FAMA-complex candidates identified through PL are
also slightly enriched in FAMA AP-MS samples compared to To estimate how ‘pure’ our nuclear proteomes are, we
their controls. However, the enrichment is not enough to call curated published nuclear and subnuclear compartment
any of them, except ICE1, significant in the AP-MS proteomes (Bae et al. 2003; Bigeard et al. 2014; Calikowski,
experiment. PL therefore not only gave us higher specificity Meulia, and Meier 2003; Chaki et al. 2015; Palm et al. 2016;
for nuclear proteins than the AP-MS did, but it is potentially Pendle et al. 2005; Sakamoto and Takagi 2013; Goto et al.
more sensitive as well. It is worth noting, that most FAMA 2019) and searched the Arabidopsis protein subcellular
interaction candidates were identified at the 3 hour time point localization database SUBA (version 4, (Hooper et al. 2017),
and that longer biotin treatment greatly improved http://suba.live/) for proteins that were observed in the
identification of biotinylated proteins (Figure 5, Figure 5 – nucleus as fluorescent-protein fusions. This resulted in a
figure supplement 4, source file – Figure 5 – combined list of 4,681 ‘experimentally determined nuclear
supplemental table 3). proteins’; 4,021 from MS and 975 from localization studies
(source file – Figure 6 – supplemental table 4). More than
Proximity labeling can be used to analyze the three quarters of the proteins enriched in our UBQnucTID and
nuclear proteome in rare FAMA-expressing cells FAMAnucTID datasets are either experimentally verified
during GC development nuclear proteins or are predicted to be localized in the
nucleus (Figure 6, source file Figure 6 – supplemental
The second question our PL experiment should answer was tables 2, 3 and 5). This suggests that most identified proteins
whether TID could be used to take a snapshot of the nuclear are indeed nuclear proteins. Of the remaining proteins, most
proteome of FAMA-expressing cells. Traditional tools to are predicted to be in the cytosol and could have been
study organellar proteomes are not well-suited for such an labeled by TID right after translation and before nuclear import
endeavor, since they require isolation of the cell-type and of the biotin ligase or by a small mis-localized fraction of TID.
organelle of interest and therefore lack the required Importantly, chloroplast proteins, which are a major source
sensitivity. Branon et al (Branon et al. 2018), showed that TID of contamination in plant MS experiments, make up only
can be used to efficiently and specifically purify proteins from about 3 % of our identified proteins (source file Figure 6 –
different subcellular compartments without prior cell supplemental table 5). In contrast, about 12 % and 6 % of
fractionation. Their work was done using a homogeneous the proteins identified in the two most recent Arabidopsis
population of cultured mammalian cells, however, so it nuclear proteome studies (Palm et al. 2016; Goto et al.
remained to be shown whether it would be possible to isolate 2019), are predicted to be in the chloroplast (SUBAcon
an organellar proteome from an individual cell type, prediction, SUBA4). Gene ontology (GO) analysis is also
especially a rare or transient one, in a complex multicellular consistent with nuclear enrichment in both nuclear TID
organism. datasets (Figure 6 – figure supplement 3, source file
Figure 6 – supplemental tables 2,3 and 7). Importantly, our
To identify nuclear proteins in FAMA-expressing young GCs nuclear TID successfully labeled all major sub-nuclear
and compare them to the global nuclear proteome at this compartments and domains, including the nuclear pore
growth stage, we purified proteins from seedlings expressing complex, the nuclear envelope, the nuclear lamina, the
nuclear TID under the FAMA (FAMAnucTID) and UBQ10 nucleolus and other small speckles, as well as DNA- and
(UBQnucTID) promoter and from WT after three hours of biotin chromatin-associated proteins (subdomain markers from
treatment. PCA and hierarchical clustering showed a clear (Petrovska, Sebela, and Dolezel 2015; Tamura and Hara-
separation of the three genotypes (Figure 6 – figure Nishimura 2013), see source file Figure 6 – supplemental
supplement 1). In total, we identified 3,176 proteins with table 8 for examples).
high confidence (source file – Figure 6 – supplemental
table 1). 1,583 proteins were significantly enriched in After the general assessment of data quality and nuclear
UBQnucTID compared to WT (Figure 6, Figure 6 – figure specificity, we asked whether proteins enriched in nuclei of
supplement 2, source file Figure 6 – supplemental table FAMA-expressing cells, obtained by comparing the
2), which is comparable to the number of proteins identified FAMAnucTID to the UBQnucTID dataset (Figure 6, Figure 6 –
with nuclear TID in human HEK cells (Branon et al. 2018). figure supplement 2, source file Figure 6 – supplemental
These proteins comprise our ‘global’ nuclear protein dataset. table 3), include known GC nuclear proteins. Indeed, looking
Despite the relative rareness of FAMA-expressing cells, the at these proteins we find several known stomatal lineage-
FAMAnucTID dataset yielded 451 enriched proteins (Figure 6, and GC-associated TFs, including FAMA itself,
Figure 6 – figure supplement 2, source file Figure 6 – HOMEODOMAIN GLABROUS 2 (HDG2) and STOMATAL
supplemental table 3). Notably, most of them overlap with CARPENTER 1 (SCAP1) (Ohashi-Ito and Bergmann 2006;
our global nuclear protein dataset (Figure 6), as would be Peterson et al. 2013; Negi et al. 2013). Additionally, there
were 10 proteins among the 42 highly FAMAnucTID enriched
13You can also read