Mixing state of refractory black carbon aerosol in the South Asian outflow over the northern Indian Ocean during winter - Recent
←
→
Page content transcription
If your browser does not render page correctly, please read the page content below
Atmos. Chem. Phys., 21, 9173–9199, 2021
https://doi.org/10.5194/acp-21-9173-2021
© Author(s) 2021. This work is distributed under
the Creative Commons Attribution 4.0 License.

Mixing state of refractory black carbon aerosol in the South Asian
outflow over the northern Indian Ocean during winter
Sobhan Kumar Kompalli1 , Surendran Nair Suresh Babu1 , Krishnaswamy Krishna Moorthy2 ,
Sreedharan Krishnakumari Satheesh2,3,5 , Mukunda Madhab Gogoi1 , Vijayakumar S. Nair1 ,
Venugopalan Nair Jayachandran1 , Dantong Liu4,a , Michael J. Flynn4 , and Hugh Coe4
1 Space Physics Laboratory, Vikram Sarabhai Space Centre, Thiruvananthapuram, India
2 Centre for Atmospheric & Oceanic Sciences, Indian Institute of Science, Bengaluru, India
3 Divecha Centre for Climate Change, Indian Institute of Science, Bengaluru, India
4 Centre for Atmospheric Science, School of Earth and Environmental Sciences, University of Manchester, Manchester, UK
5 DST-Centre of Excellence in Climate Change, Indian Institute of Science, Bengaluru, India
a now at: Department of Atmospheric Sciences, School of Earth Sciences, Zhejiang University, Hangzhou, Zhejiang, China

Correspondence: Surendran Nair Suresh Babu (sureshsplvssc@gmail.com)
and Sobhan Kumar Kompalli (sobhanspl@gmail.com)

Received: 9 August 2020 – Discussion started: 1 October 2020
Revised: 14 April 2021 – Accepted: 21 April 2021 – Published: 16 June 2021

Abstract. Regional climatic implications of aerosol black          mained thickly coated (RCT ∼ 2.05 ± 0.07). The air over the
carbon (BC), which has a wide variety of anthropogenic             remote equatorial Indian Ocean, which received considerable
sources in large abundance, are well recognized over South         marine air masses compared to the other regions, showed
Asia. Significant uncertainties remain in its quantification       the lowest rBC mass concentrations (∼ 206 ± 114 ng m−3 )
due to a lack of sufficient information on the microphysi-         with a moderately thick coating (RCT ∼ 1.73 ± 0.16). Even
cal properties (its concentration, size, and mixing state with     over oceanic regions far from the landmass, regions that re-
other aerosol components) that determine the absorption po-        ceived the outflow from the more industrialized east coast/the
tential of BC. In particular, the information on the mixing        Bay of Bengal had a thicker coating (∼ 104 nm) compared
state of BC is extremely sparse over this region. In this study,   to regions that received outflow from the west coast and/or
the first observations of the size distribution and mixing state   peninsular India (∼ 86 nm). Although different regions of the
of individual refractory black carbon (rBC) particles in the       ocean depicted contrasting concentrations and mixing state
South Asian outflow to the south-eastern Arabian Sea and the       parameters due to the varied extent and nature of the con-
northern and equatorial Indian Ocean regions are presented         tinental outflow as well as the atmospheric lifetime of air
based on measurements using a single particle soot pho-            masses, the modal parameters of rBC mass–size distribu-
tometer (SP2) aboard the Integrated Campaign for Aerosols,         tions (mean mass median diameters ∼ 0.19–0.20 µm) were
gases, and Radiation Budget (ICARB-2018) ship during win-          similar over all regions. The mean fraction of BC-containing
ter 2018 (16 January to 13 February). The results revealed         particles (FBC ) varied in the range of 0.08–0.12 (suggest-
significant spatial heterogeneity of BC characteristics. The       ing significant amounts of non-BC particles), whereas the
highest rBC mass concentrations (∼ 938 ± 293 ng m−3 ) with         bulk mixing ratio of coating mass to rBC mass was high-
the highest relative coating thickness (RCT; the ratio of BC       est (8.31 ± 2.40) over the outflow regions compared to the
core to its coating diameters) of ∼ 2.16 ± 0.19 are found          remote ocean (4.24 ± 1.45), highlighting the role of out-
over the south-east Arabian Sea (SEAS) region, which is            flow in providing condensable material for coatings on rBC.
in the proximity of the continental outflow. As we move            These parameters, along with the information on the size-
to farther oceanic regions, though the mass concentrations         resolved mixing state of BC cores, throw light on the role of
decreased by nearly half (∼ 546 ± 80 ng m−3 ), BC still re-        sources and secondary processing of their complex mixtures

Published by Copernicus Publications on behalf of the European Geosciences Union.

9174                                            S. K. Kompalli et al.: Mixing state of rBC aerosol in the South Asian outflow

for coatings on BC under highly polluted conditions. Exam-          direct and indirect radiative effects (Jacobson, 2001; Bond et
ination of the non-refractory sub-micrometre aerosol chem-          al., 2013).
ical composition obtained using the aerosol chemical spe-              The BC sources are highly varied, both seasonally and spa-
ciation monitor (ACSM) suggested that the overall aerosol           tially, over the Indian region (e.g., Kompalli et al., 2014a;
system was sulfate-dominated over the far-oceanic regions.          Prasad et al., 2018, and references therein). Aerosol BC has
In contrast, organics were equally prominent adjacent to the        an average atmospheric lifetime of about a week (Lund et
coastal landmass. An association between the BC mixing              al., 2018; Bond et al., 2013). It is prone to regional as well
state and aerosol chemical composition suggested that sulfate       as long-range transport during its short atmospheric life-
was the probable dominant coating material on rBC cores.            time and found even over remote regions, such as the po-
                                                                    lar regions, albeit in lower concentrations (Raatikainen et
                                                                    al., 2015; Liu et al., 2015; Sharma et al., 2017; Zanatta et
                                                                    al., 2018). The alteration to BC mixing state depends on var-
1   Introduction                                                    ious factors, which include the BC size distribution, nature
                                                                    of sources, the concentration of condensable materials that
Black carbon (BC) is the dominant light-absorbing atmo-             BC encounters during its atmospheric lifetime, and processes
spheric aerosol species that perturbs regional and global ra-       such as photochemical ageing (Liu et al., 2013; Ueda et
diation balance through the positive radiative forcing arising      al., 2016; Miyakawa et al., 2017; Wang et al., 2018). Conse-
out of its strong absorption of solar radiation and its ability     quently, the nature and extent of coating on BC vary in space
to reduce cloud albedo (Menon et al., 2002; Ramanathan and          and time and, as such, BC in a polluted environment chemi-
Carmichael, 2008; IPCC, 2013; Bond et al., 2013; Huang et           cally ages faster than in a relatively clean environment (e.g.,
al., 2016). Produced by the incomplete combustion of hy-            Peng et al., 2016; Liu et al., 2010, 2019; Cappa et al., 2019).
drocarbon fuels, BC has a global direct radiative forcing of        This calls for region-specific characterization of the spatio-
+0.71 W m−2 (+0.08 to +1.26 W m−2 ), of which fossil fuel           temporal variability of the BC mixing state. This is partic-
and biofuel emissions contribute +0.51 W m−2 ; the rest is          ularly important over the South Asian region (with rapidly
from biomass burning (Bond et al., 2013). Such large forcing        increasing anthropogenic activities and enhanced emissions
due to BC is reported to be capable of causing significant per-     from a variety of sources) and its outflow into the adjoining
turbations to atmospheric circulation, cloud dynamics, rain-        oceans (Lawrence and Lelieveld, 2010; Babu et al., 2013;
fall pattern, static stability, and convective activity over re-    IPCC, 2013). Aerosol BC over this region has a wide variety
gional scales, especially over the Indian region (Menon et          of sources (industrial and vehicular emissions, biomass, crop
al., 2002; Ramanathan et al., 2005; Meehl et al., 2008; Bol-        residue, and residential fuel burning) and is co-emitted with
lasina et al., 2008; Lawrence and Lelieveld, 2010; Babu et          a broad spectrum of gaseous compounds that form secondary
al., 2011; D’Errico et al., 2015; Boos and Storelvmo, 2016).        aerosol species such as sulfates, nitrates, phosphates, and
While fresh BC is fractal-like, hydrophobic, and externally         secondary organic aerosols (SOAs) (Gustafsson et al., 2009;
mixed, atmospheric ageing (temporally and/or chemically)            Pandey et al., 2014) leading to complex mixing states of
results in internally mixed BC with hydrophilic compounds           BC during its atmospheric chemical ageing. The absorp-
(e.g., organic acids and ammonium sulfate) and an altered           tion potential of the resultant mixed-phase particles would
mixing state, size, and morphology. Also, the ageing process        be quite different from those of nascent BC (Lawrence and
leads to enhanced absorption potential of BC (Schnaiter et          Lelieveld, 2010; Srivastava and Ramachandran, 2013; Srini-
al., 2005; Shiraiwa et al., 2010; Cappa et al., 2012, 2019;         vas and Sarin, 2014; Moorthy et al., 2016). When air masses
Zhang et al., 2015; Peng et al., 2016; Ueda et al., 2016). The      from such complex source regions are transported to remote
mixing state of BC is a vital parameter that determines its         regions devoid of any sources of BC, the mixing state of BC
optical and radiative properties (Moffet and Prather, 2009;         may change. This is due to (a) the restructuring of the BC ag-
Liu et al., 2017) and is a critical input parameter for the         gregates during the transport due to different processes (Kütz
models used to estimate BC direct radiative forcing (Bond           and Schmidt-Ott, 1992; Weingartner et al., 1995; Slowik et
et al., 2013). The information on the nature of the coating         al., 2007b; Pagels et al., 2009) and (b) the varied nature
material along with the state of mixing of BC particles gives       and amounts of coating material arising due to the differ-
insight into the magnitude of the mixing-induced absorp-            ent atmospheric lifetimes and microphysical processes in-
tion enhancement for BC (Cappa et al., 2012, 2019; Peng et          volving different species (McFiggans et al., 2015). There-
al., 2016; Liu et al., 2017). Further, the coating of other solu-   fore, the characterization of aerosol and trace species proper-
ble species on BC modifies its hygroscopicity and cloud con-        ties has gained much attention over the years. Lawrence and
densation nuclei (CCN) activity (McMeeking et al., 2011;            Lelieveld (2010) have highlighted many field experiments
Liu et al., 2013; Laborde et al., 2013) and, therefore, the         that attempted to assess the impact of continental outflow of
mixing state alters BC-induced cloud changes and indirect           anthropogenic emissions from South Asia to the surround-
radiative effects. Thus, the characterization of BC size and        ing oceanic regions and its climate implications. Past field
its mixing state is critical to reducing the uncertainties in its   campaigns, such as the Indian Ocean Experiment (INDOEX)

Atmos. Chem. Phys., 21, 9173–9199, 2021                                              https://doi.org/10.5194/acp-21-9173-2021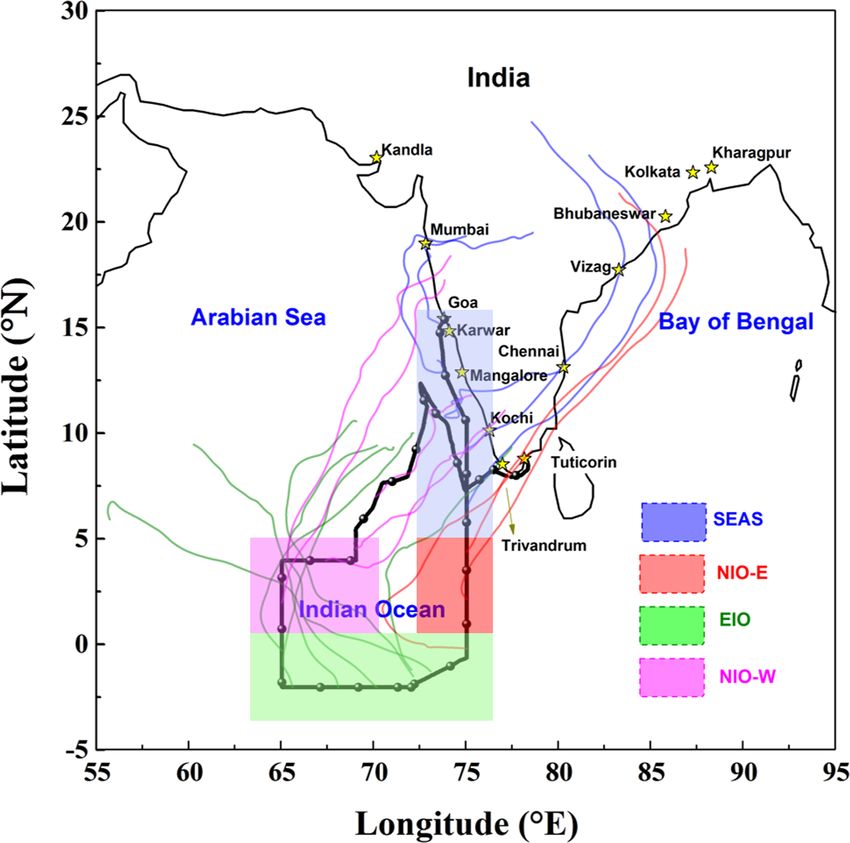
S. K. Kompalli et al.: Mixing state of rBC aerosol in the South Asian outflow                                              9175

during 1998–1999 (Ramanathan et al., 2001) and the Inte-          2     Experimental measurements
grated Campaign for Aerosols, gases, and Radiation Budget
(ICARB) during March–May 2006 (phase 1) and December–             2.1    Campaign details and meteorology
January 2008/09 (phase 2) (Moorthy et al., 2008; Babu et
al., 2012; Kompalli et al., 2013), have characterized regional    Phase 3 of the Integrated Campaign for Aerosols, gases,
aerosols over the northern Indian Ocean during different sea-     and Radiation Budget cruise-based experiment (hereafter re-
sons.                                                             ferred to as the ICARB-2018) was carried out during the win-
    However, the information on BC microphysical properties       ter period (16 January–13 February 2018) along the track
(especially its size distribution, mixing state, and extent of    shown by the solid black line in Fig. 1, covering different
coating) over the northern Indian Ocean has remained elu-         parts of the south-eastern Arabian Sea (SEAS), the north-
sive primarily due to a lack of instruments for near real-        ern Indian Ocean (NIO), and the equatorial Indian Ocean
time measurements to estimate BC size and coating (Kom-           (EIO), as highlighted by the different boxes about the track.
palli et al., 2020b). A combination of analytical instruments,    More details about the experiment and sampling conditions
such as the single particle soot photometer (SP2) based on        are available in earlier publications (Gogoi et al., 2019; Nair
the laser-induced incandescence technique for the measure-        et al., 2020; Kompalli et al., 2020a). Briefly, the measure-
ments of microphysical properties of refractory BC (rBC) at       ments were made from the specially configured aerosol lab-
a single particle level (Moteki and Kondo, 2007; Schwarz          oratory on the top deck of the ship, ∼ 15 m above the sea
et al., 2008, 2013; Laborde et al., 2012; Liu et al., 2014),      level, and the instruments sampled air from a community
the mass spectroscopy-based aerosol chemical composition          aerosol inlet set up with an upper size cut-off at 10 µm at a
measurements (Liu et al., 2014; Gong et al., 2016) such as        flow rate of 16.67 litres per minute (LPM). Membrane-based
the aerosol mass spectrometer (AMS) (Jayne et al., 2000;          dryers were installed in the sampling lines to remove the ex-
Jimenez et al., 2003; Allan et al., 2003), or the aerosol chem-   cess moisture (to limit the sampling relative humidity (RH)
ical speciation monitor (ACSM) (Ng et al., 2011) that pro-        to < 40 %). Proper care was taken to avoid contamination
vide near real-time information on the possible coating sub-      from the ship’s emissions by aligning the bow of the ship
stances, provides a way to address this issue (Kompalli et        against the wind direction, and any spurious data were re-
al., 2020b, and references therein).                              moved during post-processing (as has been done in earlier
    In this study, we report the first measurements of BC mi-     such campaigns; Moorthy et al., 2008).
crophysical properties over the south-eastern Arabian Sea            The South Asian region is known for its seasonally con-
and the northern and equatorial Indian Ocean regions. The         trasting synoptic meteorology associated with the Asian
observations were carried out as a part of the third phase of     monsoon and north–south excursion of the inter-tropical
the Integrated Campaign for Aerosols, gases, and Radiation        convergence zone (ITCZ) and monsoonal circulations (Das,
Budget (ICARB) campaign during the winter season when             1986; Asnani, 1993). During the winter (December to
the abovementioned oceanic regions are strongly impacted          February), calm north-easterly winds prevail over the In-
by the South Asian outflow aided by the favourable synop-         dian landmass, which facilitates extensive transport of con-
tic winds (Lawrence and Lelieveld, 2010; Nair et al., 2020).      tinental air mass to the surrounding ocean. The synoptic
The weak winds and absence of strong precipitation during         conditions during the campaign period were quite simi-
this season are conducive to longer atmospheric lifetimes         lar to the climatological pattern, as revealed by Fig. S1a
and support inter-hemispheric transport of the pollutants. The    in the Supplement, which shows the prevailing synoptic
main aims of our measurements included: (i) characterization      mean wind vectors at 925 hPa derived from ERA-Interim
of the spatio-temporal variation of BC size distributions over    wind data from ECMWF (European Centre for Medium
the northern Indian Ocean, (ii) examination of the extent of      range Weather Forecasting; https://apps.ecmwf.int/datasets/
BC transport from distinct source regions and changes to its      data/interim-full-daily/levtype=sfc/, last access: 25 February
mixing state during the transport to the ocean, and (iii) quan-   2020) data. The spatial distribution of fire counts over the
tification of the degree of coating on BC and identification      continental landmass lying upwind of the campaign area,
of the nature of potential coating species by using concur-       as derived from the Moderate Resolution Imaging Spectro-
rent chemical composition measurements during the South           radiometer (MODIS) fire radiative power (MODIS Ther-
Asian outflow. The results of the campaign are presented and      mal Anomalies/Fire locations, Collection 6 product obtained
implications discussed.                                           from https://earthdata.nasa.gov/firms, last access: 24 Febru-
                                                                  ary 2020) for the period 10 January to 14 February 2018, is
                                                                  shown Fig. S1b in the Supplement. It reveals a significant
                                                                  number of fire events in the upwind regions. Monthly mean
                                                                  tropospheric NO2 column abundances obtained from TRO-
                                                                  POspheric Monitoring Instrument (TROPOMI) (http://www.
                                                                  temis.nl/airpollution/no2col/no2regio_tropomi.php, last ac-
                                                                  cess: 27 February 2020) data, shown in the bottom panels

https://doi.org/10.5194/acp-21-9173-2021                                           Atmos. Chem. Phys., 21, 9173–9199, 2021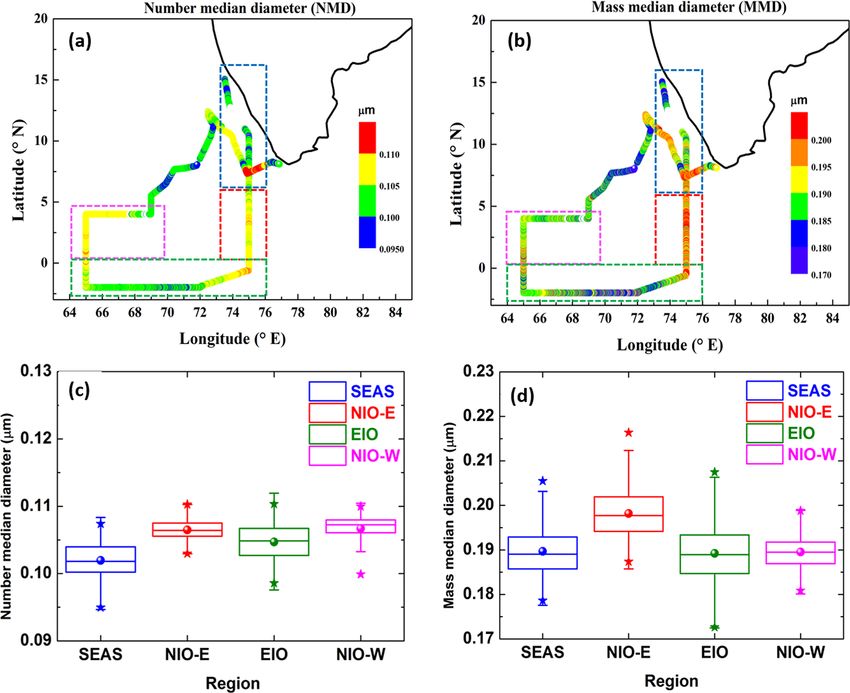
9176                                               S. K. Kompalli et al.: Mixing state of rBC aerosol in the South Asian outflow

                                                                         tential long-range transport of the continental emissions to
                                                                         different oceanic regions covered during the campaign. Ac-
                                                                         cordingly, the cruise region is divided into five distinct sub-
                                                                         regions: (i) south-eastern Arabian Sea (SEAS), which en-
                                                                         countered direct outflow from the strong source regions in
                                                                         the western coastal and peninsular India region (shown with
                                                                         a blue box and air mass trajectories); (ii) northern Indian
                                                                         Ocean-east (NIO-E) (eastern leg of the cruise covering the
                                                                         NIO region) that experienced air masses from the east coast
                                                                         of India and the Bay of Bengal regions (red); (iii) equato-
                                                                         rial Indian Ocean (EIO), where mostly marine air masses
                                                                         originated and/or confined within the north-eastern Arabian
                                                                         Sea and without any direct influence of continental outflow
                                                                         (green); (iv) northern Indian Ocean-west (NIO-W), which
                                                                         experiences outflow mainly from western coastal regions of
                                                                         Peninsular India after considerable transit over the Sea (ma-
                                                                         genta); and (v) southern Arabian Sea (SAS), the unshaded
                                                                         region of the track where widespread rainfall associated with
                                                                         the passage of a large scale meteorological system was en-
                                                                         countered. We have not included the data collected over the
                                                                         SAS region in the overall analysis of the present study, and a
Figure 1. Cruise track of the ICARB-2018 over the northern In-
dian Ocean from 16 January to 13 February 2018; the different
                                                                         brief discussion about it is provided in the Supplement. Dur-
classified sub-regions are highlighted with shaded portions, and         ing the rest of the cruise period, calm winds (< 5 m s−1 ) and
major industrial cities and ports along with coastline are marked        clear sky conditions prevailed with no significant variation in
with a star symbol. HYSPLIT 5 d isentropic air mass back trajecto-       air temperature (mean ∼ 28 ± 0.8 ◦ C) and relative humidity
ries arriving at 100 m a.m.s.l. (dashed lines) above the ship location   (mean ∼ 73±5 %) conditions. Table 1 gives the details of the
at 05:30 UTC on each day for different sub-regions are shown in          regional mean (avg), maximum (max) and minimum (min)
different colours. The filled circles on the track indicate the daily    values of meteorological variables (air temperature (AT), rel-
mean position of the ship. SEAS: south-east Arabian Sea; NIO-E:          ative humidity (RH), wind speed (WS), wind direction (WD),
northern Indian Ocean-east; EIO: equatorial Indian Ocean; NIO-W:         total accumulated rainfall (RF) amount) for different regions
northern Indian Ocean-west; southern Arabian Sea: SAS; this re-          covered during the ICARB-2018.
gion was affected by rain and a large scale meteorological system.
The data from the SAS were not included in the overall analysis.
                                                                         2.2   Measurements

                                                                         Of the several measurements made, the measurements of
of the same figure (for January 2018 see Fig. S1c and for                the BC single particle microphysical properties were carried
February 2018 see Fig. S1d in the Supplement), show signif-              out using a single-particle soot photometer (SP2) (Model:
icant emissions over the continental areas upwind, a part of             SP2-D; Droplet Measurement Technologies, Boulder, USA),
which would be transported to the oceanic regions during the             which was operated at a flow rate of 0.08 L min−1 . The SP2
ICARB-2018. Earlier, based on the observations using the                 employs a 1064 nm Nd:YAG intracavity laser and by using
optical attenuation technique (aethalometer) over the upwind             a laser-induced incandescence technique, it characterizes the
locations (Kharagpur, Bhubaneswar, Vizag, Trivandrum),                   physical properties of refractory BC (rBC) at the individual
Kompalli et al. (2013, 2014b) reported that the highest equiv-           particle level (Moteki and Kondo, 2007; Schwarz et al., 2008,
alent black carbon (EBC; optically measured BC) mass con-                2013; Laborde et al., 2012; Liu et al., 2014; Shiraiwa et
centrations throughout the year are seen during the winter pe-           al., 2007; Kompalli et al., 2020b). It provides information
riod (mean values ranging from ∼ 5389 ± 1245 ng m−3 over                 about mass and number concentrations and size distributions
Trivandrum to 11 691±4457 ng m−3 over Kharagpur), which                  of rBC. The amplitude of the incandescence signal is pro-
highlighted the source strength during this season. Also, the            portional to the rBC mass present in the BC-containing par-
east coast of India is more industrialized compared to the               ticles, and the mass equivalent diameter (the diameter of a
west coast and/or peninsular India (Fig. S1c and d in the Sup-           sphere containing the same mass of rBC as measured), or BC
plement; Moorthy et al., 2005; Kompalli et al., 2013).                   core diameter (Dc ), is obtained from the measured rBC mass
   Air mass back trajectories derived using the Hybrid                   by assuming a density, ρ ∼ 1.8 g cm−3 , for atmospheric BC
Single-Particle Lagrangian Integrated Trajectory (HYS-                   (Bond and Bergstrom, 2006; Moteki and Kondo, 2007, 2010;
PLIT) (https://www.arl.noaa.gov/hysplit/ready/, last access:             McMeeking et al., 2011). Further, the amplitude of the scat-
20 September 2019) and shown in Fig. 1 highlight the po-                 tering signal provides information about the scattering cross

Atmos. Chem. Phys., 21, 9173–9199, 2021                                                   https://doi.org/10.5194/acp-21-9173-2021
S. K. Kompalli et al.: Mixing state of rBC aerosol in the South Asian outflow                                                     9177

Table 1. Regional values of meteorological parameters observed during the cruise period.

                   Region           AT (◦ C)                 RH (%)            WS (m s−1 )         WD (◦ )   RF (mm)
                              Avg    Max       Min    Avg     Max     Min    Avg   Max      Min
                   SEAS      27.6    29.3      26.8   76.2    86.3    65.9   2.7    5.5      0.3   NE               0
                   NIO-E     28.0    28.7      27.0   69.0    76.5    60.1   3.1    4.8      2.0   NE               0
                   EIO       28.0    29.1      26.9   72.2    79.4    65.5   4.7    8.8      2.3   NW               0
                   NIO-W     28.4    28.9      27.7   72.7    78.5    66.1   4.2    6.2      1.7   NW             7.1
                   SAS       28.2    30.0      27.4   73.9    81.9    61.1   2.8    5.7      0.1   N             50.5

section of the particles, which is used to determine the optical        to accurately derive the size of the coated particle (Gao et
sizing of the particles. In the case of BC-containing particles,        al., 2007; Moteki et al., 2010; Shiraiwa et al., 2008, 2010;
the scattering signal gets distorted as it passes through the           Laborde et al., 2013; Taylor et al., 2015; Liu et al., 2017).
laser beam because of the intense thermal heating of the par-              Supplementing the above, we used the information on the
ticle and evaporation of the coating. Thus, the scattering sig-         mass concentration of non-refractory PM1.0 aerosols (organ-
nal of the BC particle is reconstructed using a leading-edge            ics, sulfate, ammonium, nitrate, and chloride) from a collo-
only (LEO) fitting technique, as described in earlier publi-            cated aerosol chemical speciation monitor (ACSM; Model:
cations (Gao et al., 2007; Liu et al., 2010, 2014, 2017), and           140; Aerodyne, USA) (Ng et al., 2011). The objective here is
this scattering cross section is matched with the modelled              to identify the possible coating material on rBC particles. The
values in a Mie lookup table to derive the optical diameter             ACSM consists of a particle sampling inlet, three vacuum
of a BC particle or the coated BC size (Dp ). Here, the to-             chambers (differentially pumped by turbopumps, backed by
tal particle is treated as an ideal two-component sphere with           the main diaphragm pump), and a residual gas analyser
a concentric core–shell morphology, with a core (rBC) re-               (RGA) mass spectrometer (Pfeiffer Vacuum GmbH). The
fractive index value of 2.26 − 1.26i (Moteki et al., 2010; Liu          particles are drawn to an aerodynamic lens assembly having
et al., 2014; Taylor et al., 2015) and a coating refractive in-         D50 limits (50 % transmission range) of 75–650 nm and 30 %
dex of 1.5 + 0i (which is an optimum value and in the range             to 40 % transmission efficiency at 1 µm (Liu et al., 2007)
of refractive indices of inorganic salts ((NH4 )2 SO4 = 1.51;           through a 100 µm critical orifice. These particles are focused
NaCl = 1.53) and secondary organic aerosols (∼ 1.44–1.5)                into a narrow beam and transmitted to a vacuum environ-
at λ = 1064 nm (Schnaiter et al., 2005; Metcalf et al., 2012;           ment where they are flash vaporized by the thermal cap-
Lambe et al., 2013; Laborde et al., 2013; Taylor et al., 2015).         ture vaporizer (Xu et al., 2017; Hu et al., 2017a, b) op-
These two diameters (Dp and Dc ) are used to infer the coat-            erating at 525 ◦ C. Subsequently, these vapours are ionized
ing thickness. Before the experiment, the SP2 was calibrated            via 70 eV electron impact ionization and detected with a
using Aquadag® black carbon particle standards (Aqueous                 quadrupole mass spectrometer. The data are processed as per
Deflocculated Acheson Graphite, manufactured by Acheson                 the prescribed methodology (Ng et al., 2011; Middlebrook
Inc., USA), and a correction factor of 0.75 is applied to ad-           et al., 2012; Kompalli et al., 2020b). We used software pro-
dress the difference between Aquadag® standards and ambi-               vided by the manufacturer (Aerodyne Research, ACSM Lo-
ent BC (e.g., Moteki and Kondo 2010; Laborde et al., 2012).             cal, version 1.6.0.3, within IGOR Pro version 7.0.4.1) for
A detailed description of the instrument, data interpretation           processing and analysis of data. Using the default fragmenta-
procedures, uncertainties, and caveats involved can be found            tion table (Allan et al., 2004), the measured fractions of unit
elsewhere (Liu et al., 2010, 2014; McMeeking et al., 2010;              mass resolution spectra signals were apportioned to individ-
Sedlacek et al., 2012, 2018; Kompalli et al., 2020b). It is             ual aerosol species. The required corrections for the instru-
recognized that the SP2 cannot provide the details of rBC               ment performance for the varied inlet pressures and N2 sig-
aggregate morphology or the relative position of the BC                 nal were performed (Ng et al., 2011; Sun et al., 2012). Mass-
within the particle, which can be determined better through             dependent ion transmission efficiency correction of the resid-
microscopy-based studies (e.g., Adachi et al., 2010; Ueda et            ual gas analyser was carried out using the signals from the in-
al., 2018). However, the intensity of the incandescence signal          ternal diffuse naphthalene source (m/z 128). The calibrations
detected by the SP2 is proportional to the refractory black             of ionization efficiency (IE) and relative IE (RIE) calibrations
carbon mass present in the particle and is independent of               were performed prior to the experiment by using monodis-
particle morphology and mixing state (Slowik et al., 2007a;             perse (300 nm) particles of NH4 NO3 and (NH4 )2 SO4 (Jayne
Moteki and Kondo, 2007; Schwarz et al., 2008). Again,                   et al., 2000; Allan et al., 2003; Jimenez et al., 2003; Cana-
though the SP2 has limited detection sensitivity towards pure           garatna et al., 2007). The present ACSM consists of a cap-
scatterers because of the limited size range it covers, the             ture vaporizer with an inner cavity to reduce the particle
light scattering information at 1064 nm has been widely used            bounce (Xu et al., 2017), resulting in a higher collection ef-

https://doi.org/10.5194/acp-21-9173-2021                                                   Atmos. Chem. Phys., 21, 9173–9199, 2021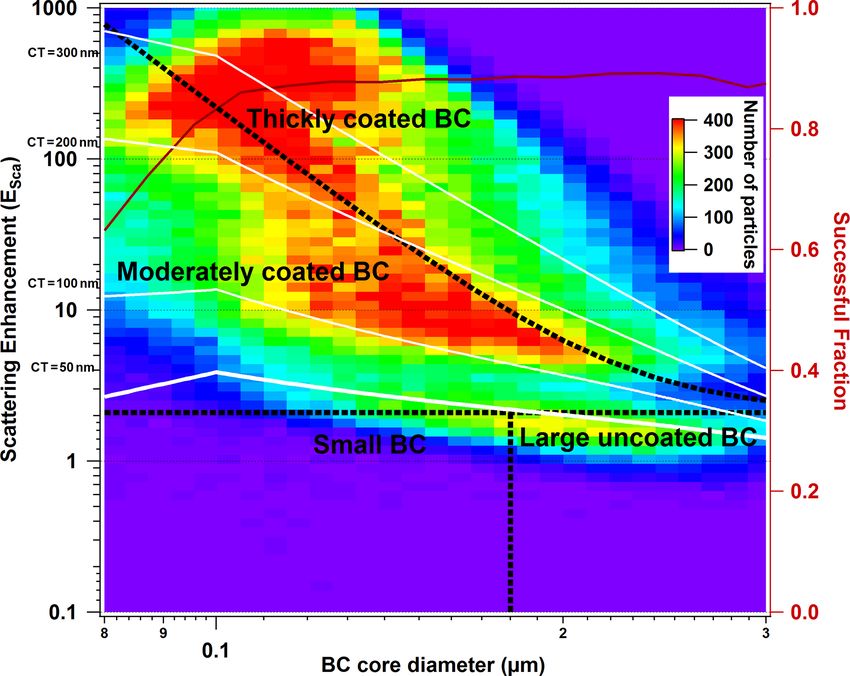
9178                                            S. K. Kompalli et al.: Mixing state of rBC aerosol in the South Asian outflow

ficiency (about unity) (Hu et al., 2017a, b). Therefore, the        sociated were described elsewhere (Liu et al., 2017, 2019;
composition-dependent collection efficiency correction pre-         Sedlacek et al., 2018; Brooks et al., 2019; Kompalli et
scribed by Middlebrook et al. (2012), applicable to standard        al., 2020b).
vaporizer instruments, was not applied to our data. More than          The means of the mass median diameter (MMD) and num-
1200 quality checked individual observations with a time res-       ber median diameter (NMD) were determined from the size
olution of ∼ 30 min formed the database for this study.             distributions of BC cores for each time window by least
   Continuous measurements of the particle number size dis-         squares fitting to an analytical monomodal log-normal dis-
tributions in the size range of 10 to 414 nm were also carried      tribution (Liu et al., 2010, 2014; Kompalli et al., 2020b) of
out aboard, at the 5 min interval, using a scanning mobil-          the following form:
ity particle sizer spectrometer (SMPS; TSI Inc., USA) dur-                                         "                 2 #
ing the campaign (Kompalli et al., 2020a). The SMPS con-               dX      X       X0              ln Dq − ln Dm
sists of an electrostatic classifier (TSI 3080), a long differen-            =     √           exp −                      .   (2)
                                                                    d ln Dq           2π ln σm             2 ln σm
tial mobility analyser to size segregate the particles based on
their electrical motilities (Wiedensohler, 1988) that are sub-      Here X0 corresponds to mass/number concentration of the
sequently counted by using a water-based condensation par-          mode, Dm is the mass/number median diameter, Dq is par-
ticle counter (TSI 3786). Concurrent measurements of the            ticle diameter, dX is mass/number concentrations in an in-
particle number size distributions in the aerodynamic diam-         finitesimal diameter interval d ln Dq , and σm is the geometric
eters range of 542 to 19 800 nm (which can be converted to          standard deviation (of the median diameter).
stokes diameters using an effective particle density) have also        Using the bulk RCT and MMD of the BC cores, the
been made using the aerodynamic particle sizer (APS; Make:          volume-weighted coated BC size (Dp,v ) is calculated as be-
TSI, Model: 3321) that works based on the “time-of-flight”          low to indicate the mean coated BC size:
technique (Leith and Peters, 2003). Though the contribution
from the particles in the sizes measured by the APS to the                   Dp
                                                                    Dp,v =      × MMD.                                         (3)
overall aerosol number concentrations are found to be < 2 %;                 Dc
combining both these measurements gives the total parti-
                                                                    Since the ratio of the mass of non-absorbing coating material
cle number concentrations covering a wide size range (10–
                                                                    to the rBC core is an important parameter in determining the
10 000 nm). We have used the particle number size distri-
                                                                    degree of absorption enhancement of BC, we quantified their
butions (and total particle number concentrations) from 10–
                                                                    mixing in terms of the bulk mixing ratio of coating mass over
1000 nm from the SMPS + APS measurements, along with
                                                                    rBC mass (MR,bulk ) derived by assuming densities for the
the number concentration of rBC from the SP2 to estimate
                                                                    bulk coating (ρcoating ) and rBC core (ρrBCcore ∼ 1.8 g cm−3 )
the fraction of rBC-containing particles.
                                                                    (Liu et al., 2019) as below:
2.3    Analysis                                                                    3         !
                                                                                    Dp             ρcoating
                                                                    MR,bulk =              −1 ×             .                 (4)
The extent of coating on rBC particles is quantified in terms                       Dc             ρrBCcore
of the bulk relative coating thickness (RCT) defined as
Dp /Dc , where Dp and Dc are coated and core BC particle            Here we have used the effective dry density (ρcoating ) of am-
diameters, respectively. It is estimated by dividing the total      bient NR-PM1.0 based on the measured near real-time chem-
volume of coated BC with that of rBC cores in a given time          ical composition (Budisulistiorini et al., 2016) by assum-
window (5 min in our case) following Liu et al. (2014, 2019):       ing densities of organics and inorganics as 1.4 (Hallquist et
      vP                                                            al., 2009) and 1.77 g cm−3 (Park et al., 2004), respectively.
      u
      u Dp,i  3                                                        To explore the distribution of BC core-coatings, a param-
Dp u   3  i                                                         eter of scattering enhancement (Esca ) for each single particle
    = P 3 ,
      u                                                    (1)
Dc t Dc,i                                                           is determined using the expression (Liu et al., 2014, 2019):
           i
                                                                              Smeasured,coatedBC
where Dp,i and Dc,i are the diameters of coated and core            Esca =                          ,                          (5)
                                                                             Scalculated,uncoatedBC
rBC, respectively, for each single particle i. In addition to
RCT, we have used bulk volume-weighted absolute coat-               where the term in the numerator is the scattered light inten-
ing thickness (ACT, in nm), defined as (Dp − Dc )/2 (both           sity of the coated rBC particle measured by the scattering
Dp and Dc used here are volume averaged diameters) based            detector of the SP2 and reconstructed using the LEO tech-
on the assumption of a concentric core–shell morphology,            nique, while the denominator is the scattering intensity of
as another diagnostic of the coating on the population of           the uncoated BC calculated using Mie single particle scat-
rBC particles (Gong et al., 2016; Cheng et al., 2018; Brooks        tering solutions assuming sphericity (Liu et al., 2014, 2019;
et al., 2019). More details about the parameters bulk RCT           Taylor et al., 2014; Brooks et al., 2019). For this purpose,
and ACT, the methodology used here, and uncertainties as-           the measured rBC mass and a refractive index of BC of

Atmos. Chem. Phys., 21, 9173–9199, 2021                                                https://doi.org/10.5194/acp-21-9173-2021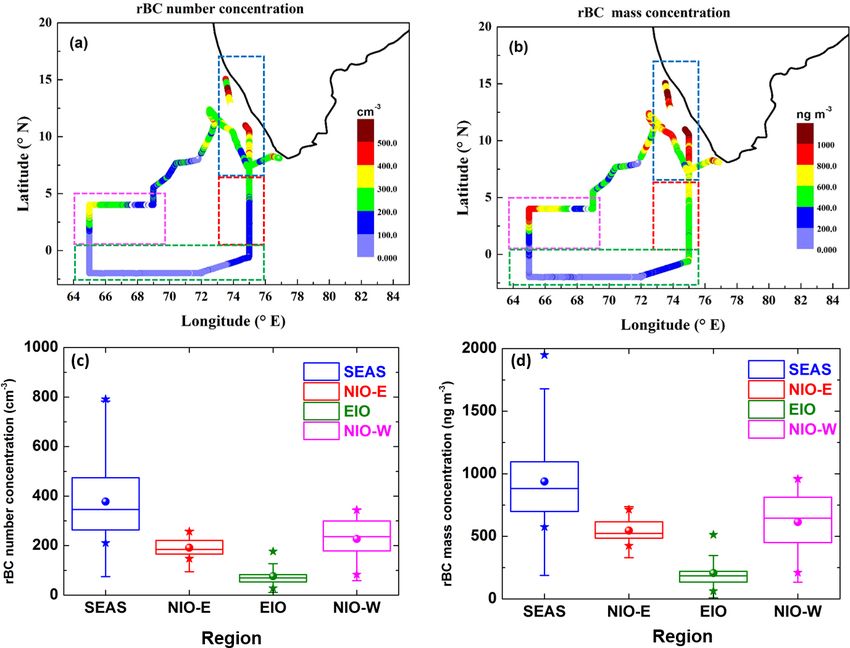
S. K. Kompalli et al.: Mixing state of rBC aerosol in the South Asian outflow                                                  9179

∼ 2.26 ± 1.26i (Moteki et al., 2010) at the SP2 laser wave-         compared the MMD and NMD values of rBC size distribu-
length, ∼ 1064 nm, were used. For an uncoated rBC particle,         tions from different dominant sources. Previous studies re-
Esca is equal to 1, and Esca increases with an increased coat-      port that the MMD (and NMD) values over the regions dom-
ing at a given core size. Combined with rBC core diameters          inated by fresh fossil fuel emissions are smaller (MMD ∼
and coating parameters, Esca is helpful in identifying the na-      100 to 178 nm and NMD ∼ 30 to 80 nm) compared to the
ture of sources, though under the assumption that no material       areas with dominant solid-fuel sources (biomass, biofuel,
loss via oxidative and/or photochemistry occurs, which can          coal-burning) (MMD ∼ 130 to 210 nm and NMD ∼ 100 to
either alter overall particle size and/or the refractive index of   140 nm), whereas well-aged and background BC particles
the coating.                                                        in outflow regions have MMD values in between (MMD ∼
                                                                    180 to 225 nm and NMD ∼ 90 to 120 nm) (McMeeking et
                                                                    al., 2010; Liu et al., 2010, 2014; Kondo et al., 2011; Cappa
3     Results and discussion                                        et al., 2012; Sahu et al., 2012; Metcalf et al., 2012; Laborde
                                                                    et al., 2013; Reddington et al., 2013; Gong et al., 2016;
3.1    Spatial distribution of rBC mass/number                      Raatikainen et al., 2017; Krasowsky et al., 2018; Brooks et
       concentrations and size distributions                        al., 2019; Kompalli et al., 2020b; Ko et al., 2020). The spa-
                                                                    tial distribution of mass median diameter and number median
The spatial variations of the number and mass concentrations        diameters during the ICARB-2018 shown in Fig. 3 was in-
of refractory BC core particles during the cruise are shown         terpreted based on this backdrop. The observed mean NMD
in Fig. 2, along with the statistics over different regions de-     (0.10–0.11 µm) and MMD (0.19–0.20 µm) values over the
picted using the box-and-whisker plots.                             entire study region (Fig. 3c and d) are within the range of
   The highest values and variabilities (standard deviation) in     values reported in earlier studies for chemically aged conti-
the rBC mass (mean ∼ 938 ± 293 ng m−3 ) and number (∼               nental outflow and a combination of sources. Chemical age-
378 ± 137 cm−3 ) concentrations are noticed over the SEAS           ing of BC is another important factor affecting the rBC core
region, which is in the proximity of the source regions and/or      sizes owing to transformation processes (such as collapsing
outflow from the western coast and peninsular India, where          of the BC cores and/or due to coagulation) taking place dur-
industrialized cities and major ports are located (Figs. 1 and      ing the long-range transport (Shiraiwa et al., 2008; Bond
S1 in the Supplement). The concentrations decreased gradu-          et al., 2013; Ko et al., 2020). Freshly produced BC parti-
ally by half as the ship headed towards the NIO-E (eastern leg      cles comprise fractal-like aggregates of spherical graphitic
of the NIO), where it received outflow mostly from the east         monomers with diameters of 10–50 nm (Köylü et al., 1995;
coast and/or the Bay of Bengal regions. The lowest concen-          Bond and Bergstrom, 2006; Bond et al., 2013; Petzold et
trations (which were 4–5 fold lower than the values seen over       al., 2013). However, as they evolve in the atmosphere, re-
the SEAS) are observed over the remote EIO region. The              structuring of these aggregates occurs due to the above pro-
lower concentrations (< 200 ng m−3 ) highlighted the cleaner        cesses and/or condensation of vapours. Compaction can be
nature of this region, which encountered mostly oceanic air         induced by capillary forces while vapour condensation fills
masses. The concentrations increased again (almost 3-fold           the voids of the aggregates (capillary condensation) (Wein-
compared to the values seen over the EIO region) as the ship        gartner et al., 1995; Pagels et al., 2009; Khalizov et al., 2009;
traversed to the NIO-W (western leg of the NIO) region,             Chen et al., 2018, 2016; Ivanova et al., 2021, and references
which experienced continental outflow air masses from the           therein) and/or restructuring driven by surface tension forces
west coast and/or peninsular India, similar to the SEAS but         at the solid–liquid interfaces during condensation of coating
farther from the coast and SEAS region. Thus, the concentra-        material (Kutz and Schmidt-Ott, 1992; Slowik et al., 2007b;
tions in the NIO-W were lower than those seen in the SEAS           Zhang et al., 2008, 2016; Schnitzler et al., 2017). Recently,
and comparable to those seen in its eastern counterpart (NIO-       Ivanova et al. (2021) presented a detailed account of the
E). This also indicated varied amounts of BC in the outflow         above processes. As such, increased ageing (temporal and/or
from different parts of the peninsula, apparently due to dif-       chemical) is more likely to result in compact cores (Liu
ferent source strengths and transit times involved. A similar       et al., 2019; Laborde et al., 2013); however, the effective-
spatial variability pattern was also reported for other aerosol     ness of a condensable vapour to cause restructuring also de-
parameters during the present campaign (Gogoi et al., 2019;         pends on its chemical composition (Xue et al., 2009; Chen et
Nair et al., 2020; Kompalli et al., 2020a).                         al., 2016). The observed MMD values in this study reflected
   The size distributions of rBC are influenced by the source,      such transformation processes.
sinks, and transformation processes taking place during ad-            Notably, the NIO-E region depicted a slightly larger mean
vection and are known to be important in assessing the              MMD (∼ 0.20 µm) due to frequent larger values (35 % of
light absorption characteristics (Reddington et al., 2013).         the measurements showed MMD > 0.20 µm) compared to
The MMD values of the rBC size distributions are strongly           all the other regions (Fig. 3d). This is a result of the fol-
influenced by the source of BC emissions (e.g., Ko et               lowing possibilities: (i) Self-coagulation of rBC cores due
al., 2020; Cheng et al., 2018). Recently, Ko et al. (2020)          to enhanced atmospheric ageing during their transport from

https://doi.org/10.5194/acp-21-9173-2021                                             Atmos. Chem. Phys., 21, 9173–9199, 2021
9180                                             S. K. Kompalli et al.: Mixing state of rBC aerosol in the South Asian outflow

Figure 2. Spatial distribution and box-and-whisker plots of refractory BC (rBC) number (a, c) and mass concentrations (b, d). The colour
scale in the spatial map (a, b) indicates the magnitude of the property. Rectangles with dashed borders highlight different sub-regions. The
box-and-whisker plots (c, d) illustrate the mean (sphere), median (the horizontal bar in the box), 25th and 75th percentile (the lower and
upper lines of the box), 5th and 95th percentile (end of error bars), and maximum and minimum values for the regions (as solid stars).

the source regions on the east coast to the adjacent ma-                from solid-fuel sources (biomass/crop residue/coal burning)
rine regions (at the same time, sedimentation of larger par-            in the upwind regions (the eastern coast of India) through the
ticles resulting in a large reduction in number concentra-              transported air masses can lead to larger BC cores (Brooks et
tion and mass concentration). It may be noted that coagu-               al., 2019; Kompalli et al., 2020b). Interestingly, the EIO re-
lation, even though it increases the rBC core diameters and             gion showed the largest variability with a non-negligible con-
reduces number concentrations, is a slow process. The co-               tribution (∼ 8 %) from smaller BC cores (MMD < 0.18 µm).
agulation rate depends on the square of the particle num-               Over the NIO-W, the MMD values remained between 0.18–
ber concentrations and is the lowest between particles of the           0.20 µm suggesting advection of BC originating from mixed
same size. Thus, the coagulation rates would be higher near             sources over peninsular India and/or the west coast. It may
source regions of the nascent aerosols and drop off gradu-              be noted that the exact sources cannot be identified from the
ally at farther distances. (ii) The second and most impor-              MMD value of rBC size distributions alone. More details on
tant possibility is associated with the cloud processing of             source apportionment are provided in Sect. 3.3.
rBC particles. The less-soluble BC particles remain within                 The spatial distribution of NMD also showed a similar pic-
a non-precipitating cloud as interstitial particles. A cloud un-        ture to that of MMD over all the regions. We compared the
dergoes multiple evaporation–condensation cycles before it              MMD values of rBC observed in our campaign with the val-
transforms into a precipitating system. During such cycles,             ues reported from selected locations with distinct dominant
interstitial BC in cloud droplets can grow larger (especially           sources in different environments in Table 2.
following the evaporation of cloud droplets containing multi-              As evident from Table 2, the MMD values during ICARB-
ple rBC particles) due to agglomeration with other interstitial         2018 mostly fall in the category of BC from the continen-
rBC aerosols. (iii) The third possibility is the varied nature          tal outflow and originated from mixed sources (McMeeking
of dominant sources. A sizable increase in the contribution             et al., 2010, 2011; Ueda et al., 2016; Cheng et al., 2018).

Atmos. Chem. Phys., 21, 9173–9199, 2021                                                    https://doi.org/10.5194/acp-21-9173-2021
S. K. Kompalli et al.: Mixing state of rBC aerosol in the South Asian outflow                                                        9181

Table 2. A comparison of rBC average mass median diameters/mode of mass size distributions (MSD) reported from selected locations with
distinct sources in different environments.

    S. no.   Location                      Type of location/sources               MSD mode/MMD           Reference
                                                                                  (µm)
    Aged air masses in remote/outflow regions
    1.       South-eastern Arabian Sea     Continental outflow/mixed sources      0.18–0.20              Present study
                                                                                  (mean ∼ 0.19 ± 0.01)
    2.       Northern Indian Ocean         Continental outflow/mixed sources      0.19–0.21              Present study
    3.       Equatorial Indian Ocean       Outflow impacted remote                0.18–0.21              Present study
                                           marine/mixed sources                   (mean ∼ 0.19 ± 0.01)
    4.       Fukue Island, Japan           Asian outflow                          0.20–0.22              Shiraiwa et al. (2008)
    5.       Suzu, Japan                   Urban/east Asian outflow site          0.200                  Ueda et al. (2016)
    6.       Mukteshwar, the Himalayas,    High-altitude/biofuel,                 0.21 ± 0.02            Raatikainen et al. (2017)
             India                         crop residue outflow
    7.       Jungfraujoch, Switzerland     High-altitude remote                   0.22–0.24              Liu et al. (2010)
                                           background/biomass
                                           burning, aged BC
    8.       Finnish Arctic                Remote background/aged air mass        0.15–0.20              Raatikainen et al. (2015)
    9.       Alert, Nunavut, Canada        Remote background/aged air mass        0.16–0.18              Sharma et al. (2017)
             (within the Arctic Circle)
    10.      Catalina Island (∼ 70 km      Aged air masses                        0.153–0.170            Ko et al. (2020)
             south-west of Los Angeles)
    11.      Atlantic Ocean                European continental outflow           0.199                  McMeeking et al. (2010)
    12.      Zeppelin, European Arctic     Remote background/aged air mass        0.24                   Zanatta et al. (2018)
    Urban locations
    13.      Regional average              Near source to high altitudes          0.17–0.21              McMeeking et al. (2010)
             over Europe                   (a) European continental               (a) 0.18–0.20
                                           (b) Urban outflow                      (b) 0.17 ± 0.01
    14.      Bhubaneswar, India            Urban/fresh urban emissions            0.17 ± 0.01            Kompalli et al. (2020b)
                                           Urban/continental outflow, aged BC     0.18–0.19
                                           Urban/with high solid-fuel emissions   0.22 ± 0.01
    15.      Indo-Gangetic Plain           Urban polluted/mixed sources           0.18–0.21              Brooks et al. (2019)
             (aircraft experiment)
    16.      Gual Pahari, India            Urban polluted/fresh biofuel,          0.22 ± 0.01            Raatikainen et al. (2017)
                                           crop residue
    17.      Shanghai, China               Urban/pollution episode with           0.23                   Gong et al. (2016)
                                           high biomass burning
    18.      London, England               Urban/traffic emissions                0.119–0.124            Liu et al. (2014)
                                           Wood burning                           0.170
    19.      Canadian oil sand             Urban/fresh urban emissions            0.135–0.145            Cheng et al. (2018)
             mining, Canada
    20.      Catalina Island (∼ 70 km      Biomass burning                        0.149–0.171            Ko et al. (2020)
             south-west of Los Angeles)    Fossil fuel emissions                  0.112–0.129

https://doi.org/10.5194/acp-21-9173-2021                                                  Atmos. Chem. Phys., 21, 9173–9199, 2021
9182 S. K. Kompalli et al.: Mixing state of rBC aerosol in the South Asian outflow
Figure 3. Spatial distribution and the box-and-whisker plots of number median diameter (NMD) (a, c) and mass median diameter
(MMD) (b, d) of rBC core size distributions during the ICARB-2018. The colour scale in the spatial map (a, b) indicates the magni-
tude of the parameter. Rectangles with dashed borders highlight different sub-regions. The box-and-whisker plots (c, d) illustrate the mean
(sphere), median (the horizontal bar in the box), 25th and 75th percentile (the lower and upper lines of the box), 5th and 95th percentile (end
of error bars), and maximum and minimum values for the regions (as solid stars).
Recently, Kompalli et al. (2020b) also reported mean MMD 3.2 Spatial variation of the BC aerosol mixing state
values of 0.18–0.19 µm over Bhubaneswar (located on the
east coast of India) during the winter when urban conti- 3.2.1 The bulk coating parameters: RCT and ACT
nental outflow with mixed sources from the Indo-Gangetic
Plain prevailed. Similarly, Liu et al. (2019) have reported
The variation of bulk relative coating thickness (RCT) esti-
MMD ∼ 0.19–0.21 µm in the urban environment of Beijing
mated using Eq. (1) and absolute coating thickness (ACT)
with mixed sources. The mean MMD values (Table 2) and
describes the physicochemical changes in the characteris-
mass size distributions over different regions covered in this
tics of rBC taking place during atmospheric chemical ageing
study (Fig. S2 in the Supplement) revealed that although the
from the outflow to the oceanic regions. The spatial varia-
peak amplitudes varied in proportion to the magnitude of the
tion of these parameters during the cruise is shown in the top
BC loading, which decreased with increasing distance from
panels of Fig. 4, while the bottom panels show the frequency
the peninsula, the modal diameters (0.19–0.20 µm) showed
of occurrence of these parameters over the different oceanic
little variability, which is also underlined by similar geo-
regions. Corresponding median values are also written in the
metric standard deviation values ∼ 1.55–1.59. This is also
figures.
consistent with the widespread nature of the continental out-
The median values show a clear spatial variation of the
flow to the northern Indian Ocean (from west to east) and
coating thicknesses (both RCT and ACT), being highest over
mixed sources for rBC particles in the outflow (McMeeking
the SEAS (closest to the coast) and lowest over the EIO (far-
et al., 2010).
thest from the landmass). This is attributed to the steadily
Atmos. Chem. Phys., 21, 9173–9199, 2021 https://doi.org/10.5194/acp-21-9173-2021S. K. Kompalli et al.: Mixing state of rBC aerosol in the South Asian outflow 9183 Figure 4. Spatial variation of the bulk (a) relative coating thickness (Dp /Dc ), (b) absolute coating thickness ((Dp − Dc )/2) (the colour scale indicates the magnitude), and (c, d) frequency of occurrence of the bulk RCT and ACT in different oceanic sub-regions (shaded following the criteria in Fig. 1). Sub-regional median values are written in the bottom panels. decreasing concentrations of the coating material in the out- Such variability in the species concentrations in the outflow flow due to possible dispersion and reactions. The SEAS channels is responsible for the marked contrast in the coating region, which is in proximity to the coast and immediately parameters examined here. impacted by the outflow, displayed a wide range of coating As we move farther to the EIO region, RCT and ACT values (Fig. 4c and d), with the highest overall median val- decreased conspicuously, with median values of 1.73 and ues (RCT ∼ 2.15 and ACT ∼ 109 nm). Notably, two peaks 69 nm, respectively, with frequency distributions skewed to- of comparable magnitudes (RCT ∼ 1.95 and 2.3; ACT ∼ 93 wards lower values. It may be recollected that the lowest BC and 126 nm) are visible in the frequency distribution over loading was also noticed over this region (Fig. 2), which ex- this region (Fig. 4d), highlighting the large variability due perienced air masses that have spent considerable time in the to varied amounts of condensable species and rBC chem- marine atmosphere. The lower coating thickness here is at- ical ageing. Nearly 95 % of the observational points over tributed to dilution of the outflow and preferential scavenging the SEAS region indicated that rBC particles have an addi- processes during the advection restricting the concentrations tional coating over their cores to the extent of > 90 % of their of both the BC particles and condensable material. With at- size. Such high levels of the coating indicate the availability mospheric and/or chemical ageing, BC particles become in- of high concentrations of condensable materials in the out- creasingly internally mixed with condensable soluble mate- flow, as have also been reported by other investigators (e.g., rial, which enhances their removal probability by dry depo- Gong et al., 2016; Liu et al., 2019; Brooks et al., 2019). sition and in-cloud scavenging processes in the atmosphere, Over the NIO-E region, only thickly coated BC particles including both nucleation scavenging and scavenging by the are observed where the frequency distributions show a nar- pre-existing cloud droplets (Miyakawa et al., 2017; Ueda et row and sharp peak for bulk RCT (median ∼ 2.05) and ACT al., 2018; Zhang et al., 2008). While the larger BC parti- (median ∼ 104 nm). This highlighted the contrasting nature cles are scavenged rather quickly, the smaller and relatively of the condensable coating material in the Bay of Bengal less-coated BC particles (occasionally, even bare soot par- and/or the east coast outflow channel compared to the west ticles) can persist in the outflow and be transported to the coast and/or peninsular India outflow channel. Earlier, Moor- remote marine regions (Ueda et al., 2018). As the particles thy et al. (2005) showed that the east coast and/or coastal spend more time in the atmosphere, they tend to gain coating Bay of Bengal has stronger hotspots of surface aerosols and material on them. Simultaneously, the loss of coating ma- gases, as well as a higher abundance of submicron aerosols. terial on the particles cannot be ruled out due to photolysis https://doi.org/10.5194/acp-21-9173-2021 Atmos. Chem. Phys., 21, 9173–9199, 2021
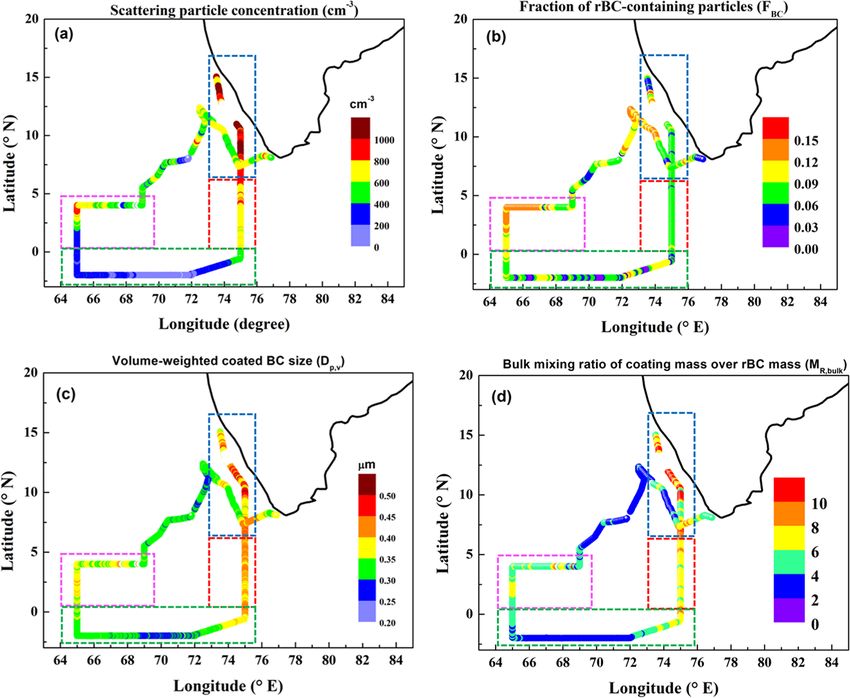
9184                                           S. K. Kompalli et al.: Mixing state of rBC aerosol in the South Asian outflow

or heterogeneous oxidation that can bring about fragmenta-         are influenced by mixing with the surrounding environment.
tion, leading to thinner coatings. Thus, preferential scaveng-     Nevertheless, such a high degree of coatings on BC consid-
ing of larger particles leaving behind smaller and more thinly     erably enhances its absorption cross section, which thereby
coated particles and atmospheric processes leading to loss         causes substantial absorption enhancement (by the factors in
of condensable material explains the broad range of MMD            the range of 1.6–3.4) and affects the radiative forcing (Mof-
(Fig. 3d) and lower RCT values observed over the EIO. Fur-         fet and Prather, 2009; Shiraiwa et al., 2010; Thamban et
thermore, in cleaner maritime regions like the equatorial In-      al., 2017; Liu et al., 2015; Wang et al., 2018). The impli-
dian Ocean, the chemical ageing of BC occurs slowly due            cation of the observed thick coatings on BC to regional ra-
to reduced availability of coating material that possibly re-      diative forcing needs further detailed investigation in future
sulted in the observed smaller coatings on rBC over the EIO        studies.
region. As the impact of continental outflow increases in the
NIO-W, the coating on rBC increased once again (median             3.2.2   Coated BC diameter, FBC , and bulk mixing ratio
RCT ∼ 1.92 and ACT ∼ 86 nm). Interestingly, highly coated                  (MR,bulk )
BC particles were found less frequently over the NIO-W
(with west coast air masses) compared to its eastern counter-      The spatial variation of number concentration (in cm−3 ) of
part, the NIO-E region, which experienced east coast and/or        non-BC (i.e., purely scattering) particles detected by the SP2
Bay of Bengal air masses originating from more industrial-         and the fraction of rBC-containing particles (FBC ; the ratio
ized upwind locations, e.g., Moorthy et al. (2005), Kompalli       of rBC number concentration to the total number concentra-
et al. (2013). Thus, a clear contrast in the mixing state pa-      tion in size range of 10–1000 nm from the SMPS and APS
rameters is evident, which is due to differences in respective     measurements) are shown in Fig. 5a and b. The bottom pan-
coastal sources (Moorthy et al., 2008; Peng et al., 2016; Gong     els of the same figure show the volume-weighted coated BC
et al., 2016) and possible transit times over these two regions.   size (Dp,v ) (in µm) (Fig. 5c) and bulk mixing ratio of coating
   It is known that the BC mixing state depends on var-            mass to rBC mass (MR,bulk ) (Fig. 5d) calculated using the
ious factors, which include the BC size distribution, na-          Eqs. (3) and (4).
ture of sources, the concentration of condensable materi-             The overall spatial variation patterns of scattering particle
als that BC encounters during its atmospheric lifetime, and        concentrations and various mixing state parameters are simi-
processes such as photochemical ageing (Liu et al., 2013;          lar to those of the rBC mass and number concentrations seen
Ueda et al., 2016; Miyakawa et al., 2017; Wang et al., 2018,       earlier, with the highest values over the SEAS, decreasing
2019). The values of BC coating parameters (bulk RCT and           gradually towards the NIO (east and west) to reach the lowest
ACT) seen in the present study that examined outflow char-         values over the remote EIO. The figure reveals the following:
acteristics are comparable to the values reported in pollu-          i. The non-BC (scattering) particle concentrations were
tion in-plume air mass regions elsewhere (e.g., Cheng et                higher, > 1000 cm−3 , in the coastal waters (the SEAS),
al., 2018; Brooks et al., 2019). Recently, Kompalli et al.              decreasing towards farther oceanic regions and reached
(2020b) reported seasonal mean bulk relative coating thick-             values as low as < 200 cm−3 in the remote EIO, which
ness (RCT) in the range of ∼ 1.3–1.8 and ACT ∼ 50–70 nm                 is in line with the expected reduction in the influence of
over Bhubaneswar when the site received polluted outflow                the sources (Fig. 5a).
from the Indo-Gangetic Plain (IGP). Brooks et al. (2019) no-
ticed thickly coated BC particles (ACT ∼ 50–200 nm) across          ii. The rBC particles constituted about 8 %–12 % of the
northern India, especially the IGP and north-east India, dur-           total particle number concentration over different sub-
ing their recent aircraft experiments. As Cheng et al. (2018)           regions, on average (Fig. 5b). The FBC values showed
and Ko et al. (2020) have highlighted, coating parameters               the largest variability over the SEAS among all the re-
derived from the SP2 instruments having different system                gions (Fig. 5b).
configurations (detection limits of scattering intensity and        iii. Coated rBC particles were larger (Dp,v ∼ 0.35–
range of volume equivalent diameters covered) and differ-                0.50 µm) over coastal waters (SEAS), highlighting a
ent techniques used in the estimation of the optical diame-              substantial enhancement of the overall rBC particle
ters from scattering amplitudes (Metcalf et al., 2012; Gong              sizes due to thick coatings on them in the polluted out-
et al., 2016; Raatikainen et al., 2017; Cheng et al., 2018;              flow air masses. The values diminished farther away,
Liu et al., 2019; Ko et al., 2020) can vary considerably. This           and the lowest values (< 0.30 µm) are seen over the EIO
caveat needs to be borne in mind when making inter-study                 region (Fig. 5c).
comparisons. Also, the earlier studies are mostly made in the
“near-field” situation, whereas the present study examined          iv. The bulk mixing ratio of coating mass over rBC mass
the coating characteristics in a “far-field” scenario (far away         (MR,bulk ) revealed high values (2.5–15) with large vari-
from potential sources, especially the NIO and EIO regions).            ability over the regions with extensive outflow (SEAS)
The caveat here is that the present study is not a Lagrangian           due to the presence of thickly coated BC particles in
experiment, and it is possible that the far-field measurements          these regions. Though MR,bulk values were very low

Atmos. Chem. Phys., 21, 9173–9199, 2021                                              https://doi.org/10.5194/acp-21-9173-2021
You can also read