COSMO-BEP-Tree v1.0: a coupled urban climate model with explicit representation of street trees - Geosci. Model Dev.
←
→
Page content transcription
If your browser does not render page correctly, please read the page content below
Geosci. Model Dev., 13, 1685–1710, 2020
https://doi.org/10.5194/gmd-13-1685-2020
© Author(s) 2020. This work is distributed under
the Creative Commons Attribution 4.0 License.

COSMO-BEP-Tree v1.0: a coupled urban climate model
with explicit representation of street trees
Gianluca Mussetti1,2,3,a , Dominik Brunner1 , Stephan Henne1 , Jonas Allegrini2,3 , E. Scott Krayenhoff4 ,
Sebastian Schubert5 , Christian Feigenwinter6 , Roland Vogt6 , Andreas Wicki6 , and Jan Carmeliet3
1 Laboratory  for Air Pollution/Environmental Technology, Empa, 8600 Dübendorf, Switzerland
2 Laboratory  of Multiscale Studies in Building Physics, Empa, 8600 Dübendorf, Switzerland
3 Chair of Building Physics, ETH Zürich, 8093 Zürich, Switzerland
4 School of Environmental Sciences, University of Guelph, Guelph ON N1G 2W1, Canada
5 Geography Department, Humboldt-Universität zu Berlin, 10099 Berlin, Germany
6 Research Group Meteorology, Climatology, and Remote Sensing, University of Basel, 4055 Basel, Switzerland
a now at: Institute for Atmospheric and Climate Science, ETH Zürich, 8092 Zürich, Switzerland

Correspondence: Dominik Brunner (dominik.brunner@empa.ch) and Gianluca Mussetti (mussetti.gianluca@gmail.com)

Received: 3 August 2019 – Discussion started: 30 August 2019
Revised: 14 February 2020 – Accepted: 27 February 2020 – Published: 1 April 2020

Abstract. Street trees are more and more regarded as an           improved the agreement with observations. Street trees pro-
effective measure to reduce excessive heat in urban areas.        duced large changes in simulated sensible and latent heat
However, the vast majority of mesoscale urban climate mod-        flux, and wind speed. Within the canopy layer, the presence
els do not represent street trees in an explicit manner and,      of street trees resulted in a slight reduction in daytime air
for example, do not take the important effect of shading by       temperature and a very minor increase in nighttime air tem-
trees into account. In addition, urban canopy models that take    perature. The model was found to realistically respond to
interactions of trees and urban fabrics directly into account     changes in the parameters defining the street trees: leaf area
are usually limited to the street or neighbourhood scale and      density and stomatal conductance. Overall, COSMO-BEP-
hence cannot be used to analyse the citywide effect of urban      Tree demonstrated the potential of (a) enabling city-wide
greening. In order to represent the interactions between street   studies on the cooling potential of street trees and (b) fur-
trees, urban elements and the atmosphere in realistic regional    ther enhancing the modelling capabilities and performance
weather and climate simulations, we coupled the Building          in urban climate modelling studies.
Effect Parameterisation with Trees (BEP-Tree) vegetated ur-
ban canopy model and the Consortium for Small-scale Mod-
eling (COSMO) mesoscale weather and climate model. The
performance and applicability of the coupled model, named         1   Introduction
COSMO-BEP-Tree, are demonstrated over the urban area
of Basel, Switzerland, during the heatwave event of June–         Street trees – trees located in street canyons – and urban veg-
July 2015. Overall, the model compared well with measure-         etation in general are more and more regarded as an effec-
ments of individual components of the surface energy bal-         tive measure to reduce excessive heat conditions in urban
ance and with air and surface temperatures obtained from a        areas (e.g. Shashua-Bar et al., 2009; Armson et al., 2012;
flux tower, surface stations and satellites. Deficiencies were    Coutts et al., 2016; Tan et al., 2016; Gunawardena et al.,
identified for nighttime air temperature and humidity, which      2017; Manickathan et al., 2018). Excessive heat conditions
can mainly be traced back to limitations in the simulation        are typically caused by the combination of regional-scale
of the nighttime stable boundary layer in COSMO. The rep-         hot weather (heatwave) situations and the urban heat island
resentation of street trees in the coupled model generally        (UHI) effect. The UHI refers to the air temperature increase
                                                                  in urban areas compared to their rural surroundings, and it

Published by Copernicus Publications on behalf of the European Geosciences Union.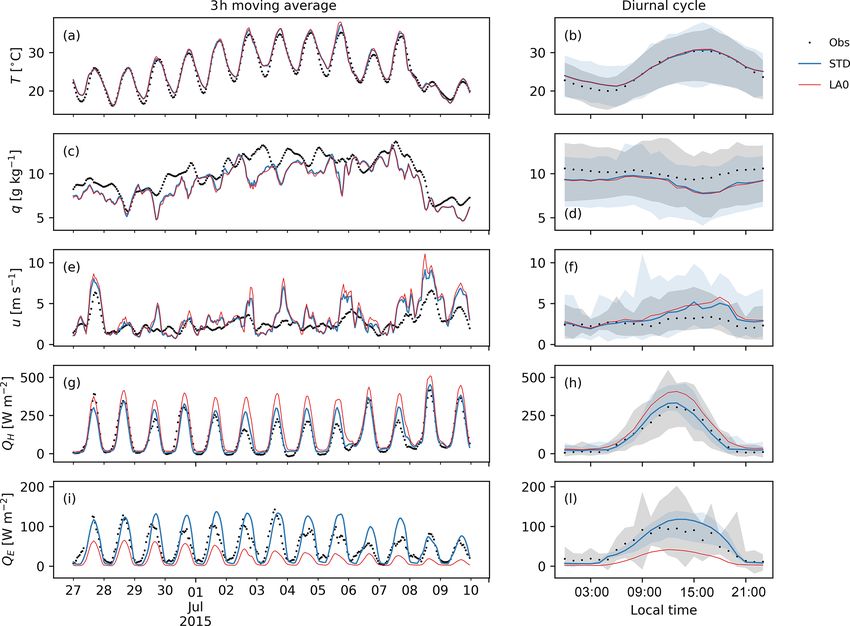
1686                        G. Mussetti et al.: Coupling an urban canopy model with trees with a regional climate model

is caused by the alteration of the surface energy balance due     represented as a single tree canopy characterised by canopy
to the presence of man-made structures and activities (Oke        cover fraction, mean height and mean leaf area density.
et al., 2017). Climate change is expected to further accentu-     Lee (2011) further developed VUCM by including a grass-
ate the magnitude and frequency of excessive heat conditions      covered soil surface within the canyon. Lee et al. (2016) in-
in cities with potentially severe impacts on human health, en-    corporated VUCM into WRF and performed an application
ergy consumption, air pollution and urban ecology (Rosen-         over Seoul, South Korea. VUCM was also used by Lough-
zweig et al., 2018).                                              ner et al. (2012), coupled with WRF, to simulate the role of
   Street trees impact the urban atmosphere through radia-        street trees in Washington, DC, USA. Wang et al. (2018) in-
tive, heat, moisture and flow interactions (Oke, 1989). Street    corporated a representation of the radiative effects of street
trees intercept radiation through their foliage canopy. By in-    trees (Wang, 2014) into the single-layer urban canopy model
tercepting the direct short-wave (solar) radiation, they re-      of WRF (F. Chen et al., 2011). They simulated the impact of
duce the temperature of underlying surfaces (Armson et al.,       street trees over the contiguous United States using a 20 km
2012). Additionally, street trees also intercept radiation com-   model resolution. Krayenhoff et al. (2018) used WRF, cou-
ing from the canyon surfaces, such as the long-wave radia-        pled with the single-layer urban canopy model, to simulate
tion emitted by warm wall and street surfaces. At night, this     the impact of urban adaptation strategies (including street
effect can actually reduce the radiative cooling of wall and      tree planting) for air temperature during contemporary and
street surfaces (Bowler et al., 2010). Through tree transpira-    future climate over the contiguous United States. A couple of
tion, leaf surface temperature is reduced, resulting in the ex-   other urban canopy models (UCMs) with explicit represen-
traction of sensible heat from the air (Green, 1993). Finally,    tation of street trees have been developed (Ryu et al., 2016;
the tree foliage extracts momentum from the mean flow, con-       Redon et al., 2017) but, to the authors’ best knowledge, not
tributing to turbulent kinetic energy (TKE) generation due to     yet coupled with a mesoscale weather and climate model.
wake production and TKE dissipation due to the small scale           The literature review revealed a number of major limita-
of the leaves (Wilson and Shaw, 1977).                            tions in the models used to study the city-wide impact of
   The climatic impact of urban vegetation has been inves-        street trees. Several studies neglected some the interactions
tigated in numerous previous studies from the scale of the        between street trees and urban fabrics. For example, the ex-
single street canyon to that of the entire urban region (e.g.     change of long-wave radiation between street trees and ur-
Gromke et al., 2015; Ng et al., 2012; De Munck et al., 2018).     ban fabrics is often neglected (Wang et al., 2018; Krayen-
However, studies on entire urban regions primarily focused        hoff et al., 2018), together with the impact of street trees
on low vegetation, representing low height gardens and green      on the flow field. Neglecting long-wave radiation exchanges
roofs (Wang et al., 2013; De Munck et al., 2018). Street          and impacts of trees on the flow field may overestimate their
trees, instead, have generally only been represented in a sep-    cooling potential. Another simplistic assumption concerns
arate natural tile (e.g. Schubert and Grossman-Clarke, 2013;      the representation of tree shading, which was in some cases
Li and Norford, 2016). This approach precluded considering        independent of the solar direction (Dupont et al., 2004; Lee
any interactions between trees and urban surfaces in a street     and Park, 2008).
canyon, such as shading and sheltering effects (Krayenhoff           A second common assumption concerns the characterisa-
et al., 2014, 2015). Other studies employed somewhat more         tion of street trees in model applications. In all the previ-
sophisticated methods but still neglect some of the criti-        ous studies, no real data on the location, density height and
cal interactions between trees, canyon surface and airflow        species of street trees were used. Instead, a homogeneous
(Thatcher and Hurley, 2012).                                      distribution of street trees has often been assumed (Dupont
   The very first example of a weather and climate model          et al., 2004; Loughner et al., 2012). The increasing availabil-
with an integrated representation of street trees was devel-      ity of detailed street tree datasets (e.g. Alonzo et al., 2014;
oped by Dupont et al. (2004). They built an urban canopy          Konarska et al., 2016) now gives a chance to represent the
model, called DA-SM2-U, for the Penn State–NCAR fifth-            distribution of street tree characteristics more realistically
generation mesoscale model (MM5; Grell et al., 1994). DA-         during model applications.
SM2-U was based on the multi-layer urban canopy concept              Finally, the majority of the studies did not include a com-
where a drag-force approach is used to represent the dy-          prehensive evaluation of their model. Typically, only the un-
namic and turbulent effects of buildings and vegetation. In       derlying urban canopy model used in the coupled model
the meantime, the Weather Research and Forecasting model          has been evaluated offline. Online model evaluation against
(WRF; Skamarock et al., 2005) has replaced MM5 and, to            surface stations, flux towers and satellite observations are
the authors’ best knowledge, DA-SM2-U was not ported              needed to better understand the model performance and to
to WRF. Lee and Park (2008) developed an urban canopy             identify future lines of development.
model with an explicit representation of street trees named          Motivated by the great potential of using an integrated
Vegetated Urban Canopy Model (VUCM). VUCM adopts a                model to study the urban climate impact of street trees in
single-layer urban canopy concept (i.e. the urban canopy is       a city-wide manner, the objective of this study is two-fold.
represented by only one model layer), where street trees are      First, we aim to document the development of an urban cli-

Geosci. Model Dev., 13, 1685–1710, 2020                                            www.geosci-model-dev.net/13/1685/2020/
G. Mussetti et al.: Coupling an urban canopy model with trees with a regional climate model                                  1687

mate model with explicit representation of street trees, featur-   for operational numerical weather prediction, regional cli-
ing a two-way coupling between the Building Effect Param-          mate simulation and other applications at the mesoscale
eterisation with Trees (BEP-Tree) vegetated urban canopy           (weather phenomena of sizes between about 1 km and a
model (Krayenhoff, 2014; Krayenhoff et al., 2020) and the          few hundred kilometres). COSMO evolved from the oper-
Consortium for Small-scale Modeling (COSMO) Commu-                 ational weather forecast Lokal Modell (LM) of the German
nity Land Model (CLM) (COSMO hereinafter; Rockel et al.,           Weather Service (Steppeler et al., 2003) and has been de-
2008). The coupled model, named COSMO-BEP-Tree, rep-               veloped by a consortium of weather services in Europe and
resents the multiple interactions between street trees, urban      by the CLM community for climate applications (CCLM-
fabrics and the atmosphere in a comprehensive way consid-          Community, 2020). The regional climate model version of
ering the exchange of heat, moisture and momentum, and the         COSMO, called COSMO-CLM, includes modifications al-
transfer of short- and long-wave radiation. COSMO-BEP-             lowing the application on timescales up to centuries (Rockel
Tree enables city-wide studies on the cooling potential of         et al., 2008). These modifications comprise a representation
street trees in comparison, or in combination, with other UHI      of phenological cycles as well as externally prescribed, time-
mitigation measures (e.g. albedo changes). Additionally, it        dependent atmospheric CO2 concentrations.
has the potential to enhance the performance in urban cli-            The COSMO model is based on the thermohydrody-
mate modelling studies by a more realistic representation of       namical equations describing non-hydrostatic compressible
the surface and its interaction with the atmosphere. In order      flow in a moist atmosphere. A variety of physical pro-
to facilitate the application, the model comes with a tool to      cesses are taken into account by parameterisation schemes:
pre-process the additional inputs required for COSMO-BEP-          cloud formation and precipitation, moist and shallow convec-
Tree, such as street tree datasets or a 3-D city model.            tion, subgrid-scale turbulence, radiation and land surface ex-
   Second, we present an application and comprehensive             changes (see Fig. 1a). At the convection-resolving model res-
evaluation of COSMO-BEP-Tree over the transnational ur-            olution used in this study, the parameterisations for subgrid-
ban agglomeration of Basel (Switzerland, Germany and               scale clouds and moist convection are switched off. Addi-
France) during a heatwave event in June–July 2015. The             tional information on the governing equations and physical
evaluation makes use of the extensive measurement infras-          parameterisations can be found in the model documentation
tructure for urban climate studies available in Basel (Feigen-     (COSMO, 2019).
winter et al., 2018; Wicki et al., 2018), including an urban          Recently, urban parameterisations of different degrees of
flux tower and a network of surface stations, and addition-        complexity have been developed for and coupled with the
ally uses land surface temperature (LST) observations from         COSMO model (Trusilova et al., 2016). The TERRA-URB
satellite. In order to verify the model’s response to the pa-      urban parameterisation (Wouters et al., 2015, 2016) em-
rameters that define the street trees, a sensitivity analysis is   ploys a simple but efficient approach by representing the ur-
also presented.                                                    ban canopy using a limited number of parameters (so-called
   We remark that this study only aims to document the de-         bulk approach). The Town Energy Balance (TEB) imple-
velopment and evaluation of COSMO-BEP-Tree. Analyses               mentation of Trusilova et al. (2013) represents an interme-
on the role of street trees in urban climate and on their po-      diate level of complexity with a single-layer urban canopy
tential for mitigating excessive heat conditions are out of the    model. Finally, the multi-layer urban canopy model DCEP
scope of this paper and will be presented in follow-up stud-       (double-canyon effect parameterisation) employs the most
ies. Although the focus of this study is on street trees, it is    physically based but input-demanding representation of the
important to consider that other components of the so-called       urban canopy by solving the radiation exchange in a realistic
urban forest, such as trees in parks and private gardens as        multi-layer canyon configuration (Schubert et al., 2012).
well as peri-urban trees, are also likely to have a remarkable        Applications of these models included studies of the im-
impact on the urban climate.                                       pact of climate change on cities (Grossman-Clarke et al.,
   The paper is structured as follows. The two model compo-        2017; Wouters et al., 2017), the influence of green areas and
nents (COSMO and BEP-Tree), together with the coupling             low-albedo materials (Schubert and Grossman-Clarke, 2013)
strategy and the pre-processor, are described in Sect. 2. Sec-     and the intra-urban climate variability (Mussetti et al., 2020).
tions 3 and 4 present the model evaluation and sensitivity. In
Sects. 5 and 6 future work and conclusions are discussed.
                                                                   2.2   Building Effect Parameterisation with Trees
                                                                         (BEP-Tree)
2     Model description
                                                                   BEP-Tree is a multi-layer urban canopy model with explicit
2.1    COSMO model                                                 representation of trees and their interaction with the street
                                                                   canyon (Krayenhoff, 2014; Krayenhoff et al., 2020). Build-
The COSMO is a non-hydrostatic limited-area atmospheric            ing on the geometry of the existing multi-layer urban canopy
prediction model (COSMO, 2019). It has been designed               model BEP (Martilli et al., 2002), Krayenhoff et al. (2014)

www.geosci-model-dev.net/13/1685/2020/                                               Geosci. Model Dev., 13, 1685–1710, 2020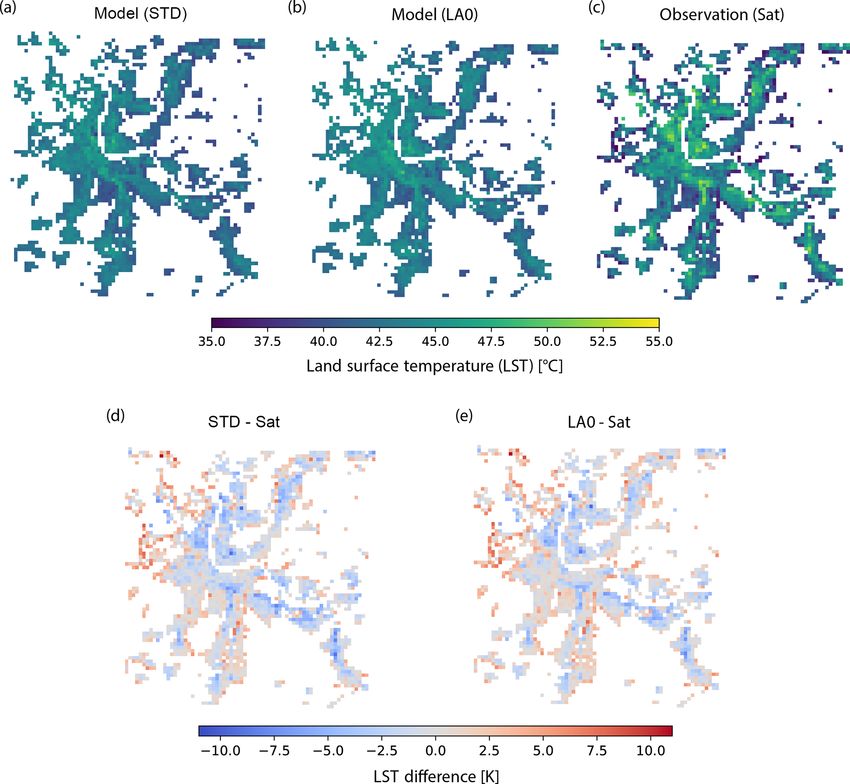
1688                           G. Mussetti et al.: Coupling an urban canopy model with trees with a regional climate model

                                                                        3-D paths of all rays are mapped to the 2-D domain, depend-
                                                                        ing on the canyon orientation; Krayenhoff et al., 2014).
                                                                           BEP-Tree includes a parameterisation of building and tree
                                                                        foliage effects on the airflow (Martilli et al., 2002; Santi-
                                                                        ago and Martilli, 2010; Krayenhoff et al., 2015). The pa-
                                                                        rameterisation introduces (a) a sink term for momentum to
                                                                        account for obstacle drag, (b) modifications of turbulence
                                                                        length scales by building interactions and (c) enhanced dis-
                                                                        sipation of turbulent kinetic energy due to the small scale of
                                                                        the tree foliage elements. The obstacle drag from tree foliage
                                                                        is determined as

                                                                        Sm,i = −Cdv  LD U ui ,                                      (2)

                                                                        where Sm,i is the sink term for momentum along the coordi-
                                                                        nate axis i (m s−2 ), Cdv is the sectional drag coefficient for
                                                                        tree foliage (set to 0.2) (–), U is the horizontal wind speed
                                                                        (m s−1 ), and ui is the wind speed component along axis i
                                                                        (m s−1 ).
                                                                           Surface energy balance equations for roof, wall and road
                                                                        elements are identical to those in Martilli et al. (2002). For
                                                                        leaf layers, the Penman equation is rearranged to solve for
                                                                        the leaf temperature as in Campbell and Norman (2012). The
                                                                        sensible heat flux, latent heat flux and source of moisture
Figure 1. Schematic of the key processes represented by                 from street trees are determined as
(a) COSMO and (b) BEP-Tree for urban climate simulations. De-
tails about the interactions between radiation and the foliage layers   QH = cp gHa  LD (Tveg − Tair ),                         (3)
(e.g. radiation absorption and scattering) are not represented here.
                                                                                  gs ga                         es − eair
Please refer to Sect. 2.1 and 2.2 for a comprehensive description of    QE = λ            LD s (Tveg − Tair ) +             ,   (4)
the models.                                                                     gs + ga                             p
                                                                              µw gs ga                            es − eair
                                                                         Sq =               LD s (Tveg − Tair ) +             , (5)
                                                                              ρair gs + ga                            p
included the effects of tree foliage on the radiative exchange
within the street canyon.                                               where QH is the sensible heat flux from foliage per unit
   The basic geometry is a two-dimensional canyon with ver-             height (W m−3 ), cp is the specific heat capacity of air
tical leaf area density profiles and probabilistic variation of         (J mol−1 K−1 ), gHa is the heat conductance (mol m−2 s−1 ),
building height (see Fig. 1b). Tree foliage is permitted both           Tveg is the temperature of the foliage layer (K), Tair is the air
between and above buildings, allowing the representation of             temperature at the height of the foliage layer (K), QE is the
street trees as well as trees overhanging buildings.                    latent heat flux from foliage per unit height (W m−3 ), λ is the
   Ray tracing is used to determine the receipt of direct short-        latent heat of vaporisation (J mol−1 ), gs is the vapour stom-
wave irradiance by building and foliage elements. View fac-             atal conductance of the leaf (mol m−2 s−1 ), ga is the vapour
tors for long-wave and short-wave diffuse radiation exchange            boundary-layer conductance of the leaf (mol m−2 s−1 ), s =
are computed once at the start of the simulation using a                 des 1
                                                                        dTair p is the change is saturation pressure with tempera-
Monte Carlo ray-tracing approach and used thereafter to cal-            ture given by the Clausius–Clapeyron equation (Stull, 2012)
culate multiple reflections between all urban fabrics. Inter-           (K−1 ), es is the saturation vapour pressure (Pa), eair is the
ception of radiation by tree foliage is modelled with the               vapour pressure in the air (Pa), p is the atmospheric pressure
Beer–Lambert–Bouguer law:                                               (Pa), Sq is the source term for moisture due to transpiration
                                                                      from foliage (s−1 ), µw is the molar mass of water (kg mol−1 ),
1Vi = ri 1 − exp(−K  LD 1s fi ) ,                           (1)        and ρair is the density of air (kg m−3 ). Here, we report only
                                                                        those equations that are relevant for the coupling of BEP-
where 1Vi is the reduction in intensity of the ray due to               Tree with COSMO and for understanding the response to the
the tree foliage (W m−2 ), ri is the initial intensity of the ray       sensitivity experiments described later. The complete set of
(W m−2 ), K is the foliage extinction coefficient (–), LD is the        equations as well as further details about the model compo-
leaf area density (m2 m−3 ),  is the foliage clumping index            nents can be found in Krayenhoff et al. (2014, 2015, 2020),
(–), 1s is the 2-D ray step size (m), and fi is the ratio of 3-D        including a recently developed parameterisation for climate
(actual) to 2-D (model) distance travelled by the ray (actual           impacts of street tree foliage distribution.

Geosci. Model Dev., 13, 1685–1710, 2020                                                   www.geosci-model-dev.net/13/1685/2020/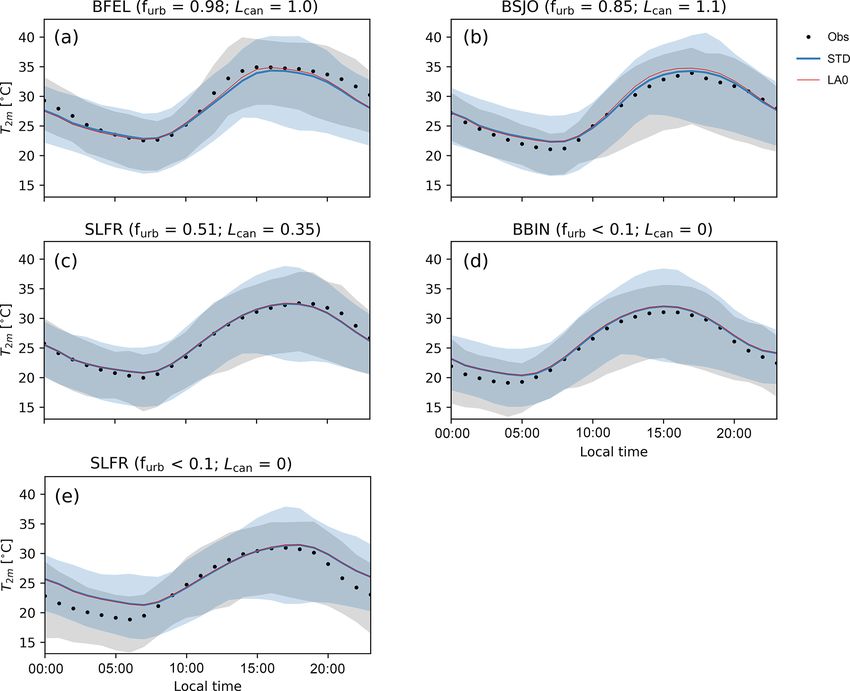
G. Mussetti et al.: Coupling an urban canopy model with trees with a regional climate model                                  1689

   The main model inputs to BEP-Tree are (a) atmospheric          COSMO does it for the natural tile (see Sect. 2.1 for further
state variables above the canyon and (b) canyon geometry          details).
including vegetation. The former includes the traditional at-        A schematic representation of the coupling is presented
mospheric variables and radiation fluxes, which can be ei-        in Fig. 2. Before executing COSMO-BEP-Tree, the param-
ther provided by a tall tower (offline application) or by a       eters that characterise the street canyon are estimated for
weather model (online application). The canyon geometry in-       all urban grid cells in the model domain from external in-
puts include height distribution of buildings, canyon width,      put datasets of trees, building geometries and impervious-
thermophysical material properties of active surfaces (wall       ness. This task is performed by a dedicated pre-processor de-
elements, roof and street) and parameters representing in-        scribed in Sect. 2.4. Once all required inputs are generated,
canyon vegetation.                                                the coupled model can be executed. At the first model time
   Regarding in-canyon vegetation, a vertical profile of leaf     step, the urban canopy parameters are used to estimate the
area density (LD ) needs to be provided for both the canyon       view factors for long-wave and diffuse short-wave radiation
and the building columns. LD,can and LD,bld represent the         between each street canyon element (wall, roof, street and
surface area of leaves per unit volume of air (m2 m−3 ) in the    foliage layer) including the sky. The view factors are stored
canyon space and in the building space (e.g. in the case of       in the form of a matrix and applied during the model sim-
trees overhanging buildings), respectively. Additionally, in-     ulation at each time step. In the case of direct short-wave
formation on the spatial distribution of the leaves from street   radiation, the receipt of radiation by each street canyon ele-
trees in the available canyon space needs to be provided. This    ment is computed online during the simulation using a direct
information is represented by the clumping index  as de-         ray-tracing algorithm. Subsequently, the diffuse short-wave
fined by Nilson (1971). The index takes values between 0 and      radiation, short-wave reflections, and received and emitted
1, with  = 1 being the case where the leaves are randomly        long-wave radiation at each street canyon element are esti-
distributed.  encompasses clumping at several scales, from       mated using a radiosity approach (making use of the view
the within-branch to the between-crown scale.  is used, to-      factor matrices). At this point, the radiation balance at each
gether with LD , to account for the fraction of leaves that ac-   active surface is available and is used to determine the radia-
tively contribute to the radiation exchange. Moreover,  is       tion balance of the entire grid cell in the COSMO model.
used to represent the aerodynamic sheltering following the           The user can specify the frequency at which the radiation
approach proposed by Marcolla et al. (2003) and to modulate       exchanges in BEP-Tree are updated. By default, this is set to
wake production and TKE dissipation (Krayenhoff, 2014).          0.05 h (3 min), as a compromise between accuracy and com-
is always used in combination with LD to compute an “effec-       putational cost.
tive leaf area density” defined as LDe = LD .                       The air temperature tendencies (increments) due to sen-
   BEP-Tree has been evaluated in offline mode against mea-       sible heat flux, the momentum tendencies due to obstacle
surements in Vancouver, Canada (Krayenhoff, 2014). The            drag and the TKE tendencies are determined for each street
evaluation made use of measured fluxes of radiation and tur-      canyon element. For the foliage layers, latent heat and mois-
bulent exchange in the inertial sublayer, as well as measure-     ture fluxes are calculated by solving the leaf energy balance.
ments of air temperature and humidity in the urban canopy         Although moisture exchange between street trees and the at-
layer. The evaluation has been recently extended using mea-       mosphere is implemented, street trees do not interact with
surements of street surface temperature and street-level ra-      soil moisture content as represented by COSMO’s land sur-
diation fluxes from two sites in North America (Krayenhoff        face scheme. In other words, a mechanistic interaction be-
et al., 2020).                                                    tween soil moisture and the transpiration of street trees is
                                                                  not included, assuming that the transpiration is never lim-
2.3   COSMO-BEP-Tree                                              ited by soil water availability. A careful representation of
                                                                  soil moisture in the urban tiles would have required a new
We coupled BEP-Tree to COSMO-CLM model v5.0_clm2.1.               urban hydrology scheme, which was beyond the scope of the
The coupling is done through model integration (also called       study. The missing interaction with soil moisture may reduce
joint coupling by Brandmeyer and Karimi, 2000) and makes          the model ability to represent variations in transpiration dur-
use of the interface created by Schubert et al. (2012) for        ing periods with large changes in soil moisture (Konarska
the urban DCEP. The coupling makes use of the tile ap-            et al., 2016; Asawa et al., 2017). Nevertheless, street trees are
proach, where mixed proportions of urban and natural sur-         less sensitive to variations in soil moisture than short vegeta-
faces within a grid cell can be considered. Natural surfaces      tion, thanks to their deeper root system (L. Chen et al., 2011;
within a urban grid cell represent, for instance, urban parks     Asawa et al., 2017).
and peri-urban forests. The surface–atmosphere interactions          The radiative coupling between COSMO and BEP-Tree is
are calculated independently for the urban and rural tiles and    realised through four bulk radiation parameters: (a) albedo
                                                                                                        ↓
then averaged with respect to the fractional coverage of each     for diffuse short-wave radiation αurb , (b) albedo for direct
tile. BEP-Tree is used to calculate the surface–atmosphere in-                             ⇓
                                                                  short-wave radiation αurb , (c) mean emissivity urb and (d) ra-
teractions for the urban tile, while the land surface model of

www.geosci-model-dev.net/13/1685/2020/                                              Geosci. Model Dev., 13, 1685–1710, 2020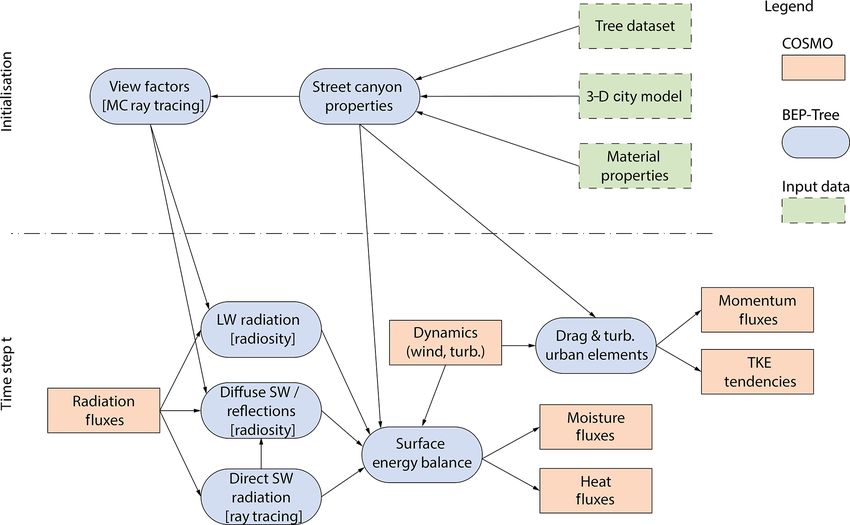
1690                            G. Mussetti et al.: Coupling an urban canopy model with trees with a regional climate model

Figure 2. Flowchart of the coupling of BEP-Tree with COSMO. Rose-coloured boxes denote quantities of COSMO and blue-coloured boxes
of BEP-Tree. Additional input datasets required to run COSMO-BEP-Tree are shown as green-coloured boxes.

                                       ↓
diative surface temperature Turb . αurb does not change with         The bulk radiation parameters from the urban tile (urb )
time, being only dependent on the canyon geometry and on           computed by BEP-Tree are combined with the ones com-
the albedo of individual surface elements, given the assump-       puted by COSMO for the natural (nat ) tile as
tion of isotropic diffuse radiation exchange. Therefore, it is
calculated only once at the beginning of the simulation as                          ⇓             ⇓
                                                                    α ⇓ = furb αurb + fnat αnat ,                             (9)
          ↑                                                                         ↓             ↓
 ↓       Kurb0                                                      α   ↓
                                                                            = furb αurb + fnat   αnat ,                      (10)
αurb =         ,                                           (6)
         K↓                                                            = furb urb + fnat nat ,                            (11)
        ↑
with   Kurb0 being the short-wave radiation reflected from all                          4 +f
                                                                            (furb urb Turb                  4 1/4
                                                                                                  nat nat Tnat )
street canyon elements into the sky for the case where the         Trad =                                           ,        (12)

incoming direct short-wave radiation K ⇓ is zero and K ↓ is
the incoming diffuse short-wave radiation.
     ⇓
   αurb , instead, depends on the position of the Sun and is       with furb and fnat (= 1 − furb ) being the planar fractions of
therefore estimated at each time step as                           urban and natural surfaces, respectively. The resulting bulk
                                                                   radiation parameters are used as lower (surface) boundary
               ↑   ↓
 ⇓       (Kurb − αurb K ↓ )                                        conditions for the short-wave and long-wave radiation rou-
αurb =                      ,                              (7)
                K⇓                                                 tines in COSMO.
         ↑                                                            In the same way, the tendencies of momentum, sensible
with Kurb being the short-wave radiation reflected from all
                                                                   heat, moisture and TKE production from the urban tile are
street canyon elements into the sky.
                                                                   combined with the corresponding tendencies from the natural
   The radiative surface temperature is calculated as
                                                                   tile.
         ↑
          Lurb − (1 − urb )L↓ ) 1/4                                  BEP-Tree operates on a grid (called the urban grid) that is

Trad =                               ,                  (8)        vertically independent of and generally finer than the grid of
                 σ urb
                                                                   COSMO (called the mesoscale grid). As a default, the verti-
          ↑
where Lurb is the sum of the emitted and reflected long-wave       cal resolution of the urban grid is 5 m. At each model time
radiation from all street canyon elements into the sky, urb       step, the input fields from COSMO have to be interpolated
is the bulk emissivity of the urban surface, L↓ is the incom-      to the urban grid, whereas the output fields (tendencies) of
ing long-wave radiation, and σ is the Stefan–Boltzmann con-        BEP-Tree have to be aggregated back to the mesoscale grid.
stant. urb is calculated as the mean emissivity of the street     The interpolation and aggregation of fields in COSMO-BEP-
canyon elements.                                                   Tree follows the implementation of Schubert (2013).

Geosci. Model Dev., 13, 1685–1710, 2020                                                 www.geosci-model-dev.net/13/1685/2020/
G. Mussetti et al.: Coupling an urban canopy model with trees with a regional climate model                                    1691

  Following Schubert (2013), the 2 m air temperature is di-         3     Model evaluation
agnosed from the air temperature at the lowest mesoscale
model layer and the surface temperature from both urban and         3.1    Study area and model setup
natural surfaces as
                                                                    COSMO-BEP-Tree was applied over the Basel metropolitan
T2 m =(fnat Tg + furb Tstr )                                        area (Basel hereinafter), located mainly in Switzerland but
       + r (T1 − (fnat Tg + furb Tstr )),                   (13)    extending over the borders of France and Germany (Fig. 3).
                                                                    Situated along the Rhine river, the larger Basel area has a
where Tg is the surface temperature of the natural tile, Tstr       population of approximately 830 000 inhabitants and is sur-
is the street surface temperature, r is a coefficient that repre-   rounded by hilly to mountainous terrain especially towards
sents the stability-dependent resistance for scalar transport as    the south (Jura Mountains) and north-east (Black Forest).
estimated by the TKE-based surface-layer transfer scheme of         According to the Köppen climate classification, Basel fea-
COSMO (Baldauf et al., 2011), and T1 is the air temperature         tures a temperate oceanic climate (Köppen: Cfb). The in-
at the lowest model level.                                          ner city (Basel-Stadt) includes more than 24 000 urban trees
                                                                    and 275 ha of public vegetated surfaces distributed over a to-
2.4   COSMO-BEP-Tree pre-processor                                  tal area of the city centre of approximately 2385 ha (Stadt-
                                                                    gaertnerei Kantons Basel-Stadt, 2020). The average canopy
Additional input variables need to be calculated before run-
                                                                    cover from street trees is about 20 % when considering the
ning COSMO-BEP-Tree. These variables, referred to as ur-
                                                                    entire urban area, but it varies from 6 % to 31 % in the dif-
ban canopy parameters (UCPs) in the following, describe the
                                                                    ferent neighbourhoods (Fig. S1 in the Supplement). The city
spatial representation of the street canyon (including street
                                                                    of Basel is an interesting target for the availability of exten-
trees) required by the urban canopy model. A dedicated
                                                                    sive observational datasets for model evaluation, which had
Python programme, UCPgenerator v1.0, has been developed
                                                                    been used in numerous previous urban climate studies (e.g.
to generate the UCPs based on external datasets. The work-
                                                                    Rotach et al., 2005; Parlow et al., 2014). Observations and
flow of UCPgenerator is shown in Fig. 2 (green boxes). A
                                                                    input data used here are described in Sect. 3.3 and 3.2.
technical description of UCPgenerator v1.0 is given in Ap-
                                                                       In this study, COSMO-BEP-Tree was run for the period
pendix A.
                                                                    of 22 June–9 July 2015, with the first 5 d discarded as a
   The UCPgenerator requires the following three input
                                                                    spin-up period. The analyses were performed on the period
datasets: (1) street trees, (2) buildings and (3) impervious-
                                                                    of 27 June–9 July 2015, called the study period hereinafter.
ness. The dataset of street trees consists of a spatial map of
                                                                    The period corresponds to an intense heatwave that persisted
the street tree distribution. This may include information on
                                                                    across Europe producing a seasonal mean surface air temper-
tree height, leaf area index (L) or leaf area density (LD ) and
                                                                    ature 2.4 K above the 1964–1993 mean (Dong et al., 2016;
tree species. In the case of missing information, representa-
                                                                    Ionita et al., 2017). The event featured a stable anticyclonic
tive profiles or knowledge-based assumptions can be used in-
                                                                    weather regime with a prevalence of cloud-free conditions,
stead. Information on street trees is typically provided by in-
                                                                    low wind speeds and absence of precipitation. The conditions
ventories maintained by urban environmental agencies (e.g.
                                                                    were ideal for evaluating the model performance, particularly
Stadtgaertnerei Kantons Basel-Stadt, 2020), remotely sensed
                                                                    with respect to the impact of street trees on the urban atmo-
data such as lidar data (e.g. Alonzo et al., 2014) and com-
                                                                    sphere and the development of the UHI.
bined data derived using data fusion techniques (e.g. Branson
                                                                       We applied COSMO-BEP-Tree over a domain of approx-
et al., 2018).
                                                                    imately 90 km × 80 km with a horizontal grid spacing of
   The building dataset consists of a collection of building ge-
                                                                    0.0025◦ (approximately 270 m). A total of 60 levels were
ometries in the urban area, including building height as an at-
                                                                    used in the vertical direction, with 5 and 23 levels in the first
tribute of each individual building. The 3-D building datasets
                                                                    100 and 1000 m, respectively. The model setup closely fol-
are typically provided by national mapping agencies and col-
                                                                    lows the configuration described in Mussetti et al. (2020).
laborative projects (e.g. OpenStreetMap).
                                                                    Initial and boundary conditions were taken from the op-
   The imperviousness dataset is a spatial representation of
                                                                    erational COSMO-2 analyses operated by the Swiss Fed-
the horizontal fraction of impervious surfaces in the model
                                                                    eral Office of Meteorology and Climatology (MeteoSwiss),
domain. Such data are available at the European scale (e.g.
                                                                    which are centred over Switzerland and cover the whole
EEA, 2015) as well as at the global scale (e.g. Brown de Col-
                                                                    Alpine domain. The analyses have a horizontal resolution
stoun et al., 2017).
                                                                    of about 2 km and are produced using a nudging technique
                                                                    (Schraff, 1997) applied to near-surface observations and ver-
                                                                    tical soundings of pressure, humidity and wind. Soil mois-
                                                                    ture, a key variable for accurate representation of heatwaves
                                                                    (Wang et al., 2019), is also initialised with the COSMO-2
                                                                    analyses, which trace back to the soil moisture analyses of

www.geosci-model-dev.net/13/1685/2020/                                                Geosci. Model Dev., 13, 1685–1710, 2020
1692 G. Mussetti et al.: Coupling an urban canopy model with trees with a regional climate model
Table 1. Summary of numerical experiments and changes in the
parameters used for the sensitivity study. Std indicates the standard
value(s) as provided in Sect. 3.2. The other parameters are kept con-
stant with the values provided in Sect. 3.2.
Name LDe gs Description
STD Std Std Current conditions
LA0 0 Std No street trees
LA+ +50 % Std Increased leaf area density
LA− −50 % Std Decreased leaf area density
SC+ Std +50 % Increased stomatal conductance
SC− Std −50 % Decreased stomatal conductance
additional sensitivity simulations, changing the values of the
parameters describing the street trees (Table 1). In addition
to the standard run (STD), simulations without street trees
(LA0), with increased and decreased values of leaf area den-
sity (LA+ and LA−, respectively) and with increased and
decreased values of stomatal conductance (SC+ and SC−,
respectively) were performed.
3.2 Urban canopy input data
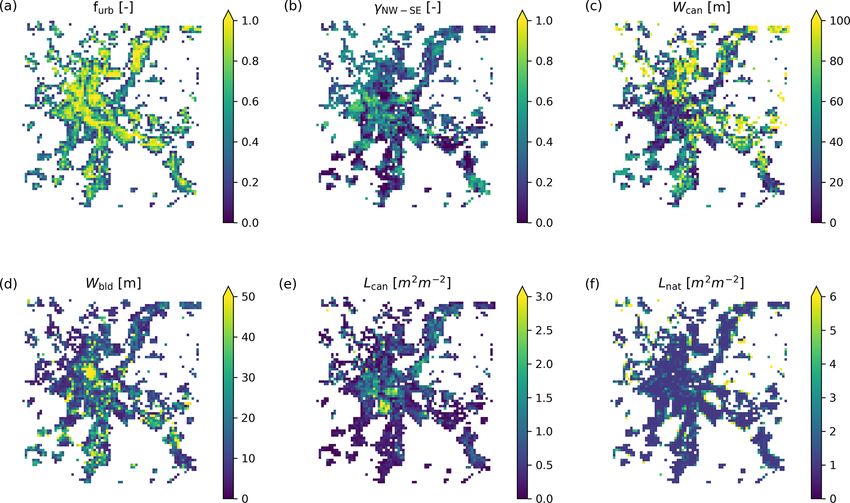
Figure 4 shows the distribution of the main urban canopy pa-
rameters as derived by the UCPgenerator pre-processor. The
model represents the spatial variability of the urban texture in
terms of fraction of urban surfaces, street canyon orientation
and width, building width and urban vegetation (Fig. 4e–f).
Lcan and Lnat are obtained by vertical integration of the re-
spective leaf area densities LD,can and LD,nat . Figure 4 also
gives a flavour of the heterogeneity of the city: industrial ar-
eas in the northern and south-east parts of the city, for in-
stance, are associated with wide street canyons and very low
vegetation density. Residential areas in the south and west
of the centre, in contrast, are characterised by narrow street
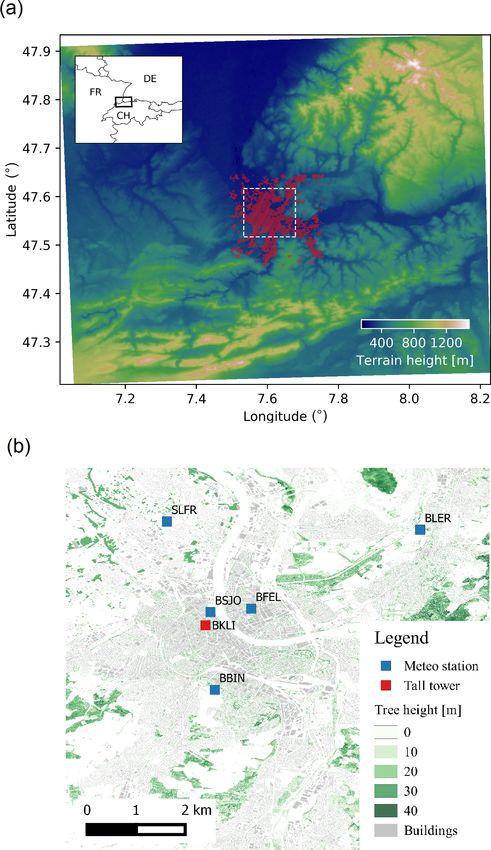
Figure 3. (a) The model domain centred over the metropolitan area canyons and relatively high vegetation density.
of Basel. The terrain height (in m a.s.l.) is shown in the background. The urban canopy parameters were derived with UCPgen-
The urban area is highlighted in red. (b) Details of the urban area erator from the following input datasets: (a) imperviousness
(corresponding to the dashed rectangle in panel a) with the loca-
from EEA (2015), (b) 3-D buildings from Federal Office of
tion of the measurement sites used for the evaluation (Sect. 3). In
Topography (2007) and (c) lidar-based tree canopy height
the background are the tree height distribution (green) (Geoportal
Kanton Basel-Stadt, 2019) and building geometries (grey). (see data availability section). The imperviousness dataset
represents the percentage of soil sealing (including building
area) and has a resolution of 20 m. The building dataset is
a vector dataset representing the building geometries (accu-
ECMWF’s operational Integrated Forecasting System (IFS) racy 3–8 m), including heights but without information on
model (De Rosnay et al., 2013). As additional input pa- the building materials or use. The tree canopy height dataset
rameters for COSMO, the 1 arcsec global digital elevation has a 2 m spatial resolution and includes all trees in the Basel
map ASTER (Tachikawa et al., 2011) for topography, the area. The imperviousness dataset was used to differentiate
10 arcsec GlobCover 2009 land use dataset (Loveland et al., between street trees (contributing to LD,can ) and trees over
2000) for land cover, and the 30 arcsec Harmonized World natural surfaces (contributing to LD,nat ). Specifically, trees
Soil Database (FAO et al., 2009) for soil properties were located over mostly impervious surface (≥ 50 %) are classi-
used. fied as street trees. A local leaf area density (inside individ-
To assess the physical consistency of the implementation ual trees) LD,loc of 1 m3 m−2 was used according to mea-
of the different interactions with street trees, we performed surements over urban trees during summertime in Gothen-
Geosci. Model Dev., 13, 1685–1710, 2020 www.geosci-model-dev.net/13/1685/2020/
G. Mussetti et al.: Coupling an urban canopy model with trees with a regional climate model                                              1693

Figure 4. Urban canopy parameters derived for the model domain: (a) urban fraction, (b) canyon fraction along the NW–SE direction,
(c) average canyon width, (d) average building width, (e) leaf area index due to street trees and (f) leaf area index due to vegetation outside
the urban canopy. Further details about the variables are given in Table A1. Only urban grid cells (furb > 0.1) are shown.

burg, Sweden (Klingberg et al., 2017). The tree species mea-              Table 2. Material properties used in the urban canopy model.
sured by Klingberg et al. (2017) are assumed to be rather
representative as they correspond to 6 of the 12 most com-                                                          Roof     Wall    Road
mon species present in Basel (Geoportal Kanton Basel-Stadt,                   Albedo (–)                             0.10    0.10     0.15
2019). The density of street trees above the building column                  Emissivity (–)                         0.85    0.90     0.95
(LD,bld , representing trees overhanging roofs) was assumed                   Heat capacity (J m−3 K−1 × 10⁶ )       1.50    1.40     1.50
to be 0. This assumption was made given that no reliable in-                  Heat conductivity (W m−1 K−1 )         0.80    1.00     0.80
formation was available about the overlapping between tree                    Total thickness (m)                    0.50    0.30     1.00
crowns and roofs. Further details regarding the methodology                   Roughness length (m)                   0.01       –     0.01
used to derive the urban canopy parameters are given in the
Appendix A. The resulting Lcan (Fig. 4e) have values rang-
ing from 0 up to 3 m2 m−2 , which is within the same range as
                                                                          Basel (Geoportal Kanton Basel-Stadt, 2019) with observed
reported in previous urban studies (Liss et al., 2010; Alonzo
                                                                          values of stomatal conductance (Konarska et al., 2016; Keel
et al., 2015; Klingberg et al., 2017).
                                                                          et al., 2007; Campbell and Norman, 2012; Xiong et al.,
   The thermal and physical properties of urban elements are
                                                                          2018). Additional details are provided in the Table S1 in the
listed in Table 2. The values are based on the recommenda-
                                                                          Supplement.
tions of Loridan and Grimmond (2012) and are used as de-
                                                                             A uniform constant value of clumping index () of 0.5
fault values in COSMO-BEP-Tree. The values have already
                                                                          was used for the reference simulation (STD). In the absence
been evaluated over Basel by Loridan and Grimmond (2012).
                                                                          of easily applicable methods to determine  in street canyon
A foliage scattering coefficient of 0.5 and a foliage emissivity
                                                                          environments, we made our choice in analogy to measure-
of 0.95 are used according to Krayenhoff (2014).
                                                                          ments over an open savannah (Ryu et al., 2010). Savannah is
   A step function is used to model the stomatal conductance
                                                                          a natural environment that resembles the urban environment
(gs ) with values of 140 and 20 mmol m−2 s−1 for daytime
                                                                          in terms of heterogeneity and openness of the tree canopy.
and nighttime, respectively. The values are calculated com-
                                                                             Anthropogenic heat flux (QA ) was estimated offline with
bining the dataset of urban tree species in the public area of
                                                                          the Large scale Urban Consumption of energY model

www.geosci-model-dev.net/13/1685/2020/                                                        Geosci. Model Dev., 13, 1685–1710, 2020
1694 G. Mussetti et al.: Coupling an urban canopy model with trees with a regional climate model
(LUCY; Allen et al., 2011; Lindberg et al., 2013) ver- et al. (2016), Lietzke and Vogt (2013) and Feigenwinter et al.
sion 2014a. LUCY simulates the hourly heat emissions (2018).
from buildings, vehicles and human metabolism using grid- Six surface stations are used to evaluate the model per-
ded inventories of population density, primary energy con- formance inside the urban canopy layer. The sites of Basel
sumption, air temperature, number of vehicles and seasonal, Feldbergstrasse (BFEL) and Basel St. Johannplatz (BSJO)
weekly and diurnal cycles of traffic density. Gridded popula- are operated by the local environmental agency (Lufthygie-
tion density from Center for International Earth Science In- neamt beider Basel). The site of BFEL is located in an area
formation Network – CIESIN – Columbia University, Inter- corresponding to compact mid-rise (LCZ 2) and has mod-
national Food Policy Research Institute – IFPRI, The World erate density of street trees. It is positioned directly inside
Bank, and Centro Internacional de Agricultura Tropical – the street canyon at the intersection between two roads ori-
CIAT. 2011 (2011) with a resolution of 30 arcsec were used. ented along the 80/260 and 160/340◦ axes. Due to its prox-
Values of energy consumption in the region of Basel for the imity to a south-facing wall, BFEL may experience temper-
months of June and July 2015 have been obtained Basel- atures larger than those expected in the middle of the street
Stadt (2020), replacing the default yearly average value, as canyon. The site of BSJO is located in a small park at the
recommended by Lindberg et al. (2013). The model esti- border of the old city centre. The park is vegetated and ex-
mated period-averaged values of QA of 4 and 14.4 W m−2 tends to the north-east, while the surrounding area is char-
over the entire urban area and the city centre, respectively. acterised by a dense mix of mid-rise buildings. Both sites
A maximum value of 22.9 W m−2 was found around midday (BFEL and BSJO) measure temperature with a thermometer
in the city centre. The values are consistent with previous with radiation shield (HC-S3, Campbell Scientific). The site
estimates of 20 W m−2 as an annual average from Christen of Saint-Louis Trois-Frontières (SLFR) is operated by the en-
(2005). vironmental agency of Alsace (ASPA), France. The station is
located in the outskirts of the city in an area characterised by
3.3 In situ measurements large low-rise buildings (LCZ 8). Few or no trees are present,
and the land cover is mostly paved or hard-packed. Air tem-
Measurements from one 38 m tall flux tower and five sur- perature is measured with a platinum resistance thermometer
face stations were used to evaluate the model results. Ta- (HMP35D, Vaisala) with a radiation shield. The site of Basel
ble 3 shows a summary of the corresponding observations. Binningen (BBIN) is operated by MeteoSwiss. The station
The site of Basel Klingelbergstrasse (BKLI) is an urban flux is located in a rural/agricultural patch (LCZ D) at the south-
tower operated by the MCR Lab (Meteorology, Climatology western outskirts of the city. Low-rise residential areas sur-
and Remote Sensing) of the University of Basel. BKLI is round the patches to the west, north and east. The surface un-
located in an area with a dense mix of mid-rise buildings, derneath the sensor is natural (grass), and scattered low-rise
corresponding to local climate zone (LCZ) 2 (Stewart and buildings are present at 15–20 m distance. The site measures
Oke, 2012) and relatively high density of street trees. The temperature with a thermometer with a radiation shield and
site consists of an 18 m high tower mounted on the flat roof of active ventilation (Rotronic HC2A-S3, Meteolabor). The site
a 20 m high building. According to Lietzke and Vogt (2013) of Basel Lange Erlen (BLER) is operated by the MCR Lab.
and Feigenwinter et al. (2012), the measurements can be con- The station is located in a rural/agricultural patch (LCZ D)
sidered to take place above the roughness sublayer and in- at 6 km distance from the city centre. The surface underneath
side the inertial sublayer. The footprint area for energy fluxes the sensor is natural (grass). Given the vegetated environment
was estimated to be 0.60 km2 for 90 % of the source area in and distance from the city centre, the site of BLER is used
summer (Schmutz et al., 2016). The site comprises an eddy as a rural reference in this study. The station used the same
covariance system consisting of an ultrasonic anemometer instruments as the BKLI site for air temperature, relative hu-
(HS-50, Gill Instruments Ltd.) and an open-path CO2 /H2 O midity and radiation fluxes.
infrared gas analyser (LI-7500, LI-COR Inc.). Air temper-
ature is measured with a fine-wire thermocouple mounted 3.4 Satellite observations
in a fan-aspirated radiation shield (ASPTC, Campbell Scien-
tific); relative humidity is measured with a mirror-type dew Thermal infrared (TIR) data from the Landsat 7 are used to
point hygrometer (THYGAN VTP6, Meteolabor AG); radi- evaluate the modelled land surface temperatures (LSTmod ).
ation fluxes are measured with a four-component radiome- Landsat acquires TIR data with a spatial resolution of 60 m.
ter (CNR4, Kipp & Zonen). It is worth to mention that the In contrast to other TIR satellite data (e.g. MODIS or
flux measurement is generally characterised by a consider- SEVIRI), this resolution is fine enough to support high-
able uncertainty (Richardson et al., 2012; Järvi et al., 2018). resolution applications. Due to its small field of view,
The uncertainty due to random errors is approximately 20 % Landsat TIR retrievals are not affected by thermal angular
and 30 % of the measured flux of sensible and latent heat, anisotropy (Hu et al., 2016). During the investigation period,
respectively (Hollinger and Richardson, 2005). Further de- the Landsat 7 scene from 5 July 2015 was selected for the
tails on the site and data processing are available in Schmutz evaluation. No other cloud-free scenes from Landsat 7 or 8
Geosci. Model Dev., 13, 1685–1710, 2020 www.geosci-model-dev.net/13/1685/2020/G. Mussetti et al.: Coupling an urban canopy model with trees with a regional climate model 1695
Table 3. Overview of observation sites used for model evaluation. Figure 3b shows the location of the sites. T is air temperature, q specific
humidity, u wind speed, QH sensible heat flux, and QE latent heat flux.
Name Variablea Type Height furb Lcan LCZ
BKLI T , q, u, QH , QE Flux tower 38 m 0.79 1.50 Compact mid-rise (2)
BFEL T Surface 2m 0.98 1.03 Compact mid-rise (2)
BSJO T Surface 2m 0.85 1.06 Compact mid-riseb (2)
SLFR T Surface 2m 0.51 0.35 Large low-rise (8)
BBIN T Surface 2m < 0.10 0.00 Rural low plantsc (D)
BLER T , q, u Surface 2/10 m < 0.10 0.00 Rural low plants (D)
a Only variables used in this study are reported (the station may measure additional variables). b With scattered trees (LCZ B).
c Surrounded by open mid-rise residential areas (LCZ 2).
were available during this period. Specifically, the Landsat 8
overpass of 4 July 2015 had to be discarded due to the pres-
Nd Nd
ence of cirrus clouds (Fig. S2). X X
LSTmod = Tstr fdir fstr (1 − CC) + Tveg fdir fstr CC
The satellite surface temperature (LSTsat ) was derived d=1 d=1
from satellite data by correcting and converting the TIR sig- Nd X
Nh
!
nal received by the satellite sensor. The LSTsat calculation
X
+ Troof froof fdir fbld + Tnat fnat , (14)
follows the approach described in Mussetti et al. (2020). d=1 h=1
We used the radiative transfer model MODTRAN (MODer-
ate resolution atmospheric TRANsmission) to estimate the where Tstr is the temperature of the streets (function of
atmospheric transmission, the long-wave upwelling or at- canyon direction d), fdir is the fraction of canyons with di-
mospheric path radiance and the long-wave downwelling or rection d, CC is the effective canopy cover from street trees,
sky radiance (Abreu and Anderson, 1996; Berk et al., 2014; Tveg is the vertically averaged temperature of the leaves of
Tardy et al., 2016). Atmospheric profiles from COSMO- the street trees, Troof is the temperature of the roofs (function
BEP-Tree (STD simulation) were used in MODTRAN, re- of canyon direction d and height h) and Tnat is the temper-
placing its standard profiles. MODTRAN was used to trans- ature of the natural tile. CC is estimated from the leaf area
form the top-of-atmosphere radiance to surface-leaving radi- density L using the relationship provided by Klingberg et al.
ance, which was further converted to LST by inverting the (2017).
Planck function (Coll et al., 2010). A modified vegetation-
threshold approach by Sobrino et al. (2008) was used to es- 3.5 Performance metrics
timate the surface emissivity. As the original approach does
The model performance was evaluated against the observa-
not account for built-up areas, a lookup table for dark and
tions using the following metrics: root-mean-square error
bright urban surfaces with a range of 0.95 to 0.97, based on
(RMSE), systematic root-mean-square error (RMSEs ), un-
emissivity values for typical urban fabrics (Baldridge et al.,
systematic root-mean-square error (RMSEu ), mean bias er-
2009), was applied (Mitraka et al., 2012). Note that these val-
ror (MBE) and coefficient of determination (r 2 ). This choice
ues differ from those used in the model (Table 2). The uncer-
of metrics follows the recommendations of Willmott et al.
tainty in the values of emissivity produces average changes in
(1985) and ensures comparability with previous urban cli-
the LST of about 1.25 K (Fig. S3). On top of this, the LST is
mate model evaluations (e.g. Schubert and Grossman-Clarke,
affected by uncertainties due to atmospheric correction, sen-
2014; Oleson et al., 2008; Grimmond et al., 2011). The def-
sor and off-nadir view (Voogt and Oke, 2003; Chen et al.,
inition of the indices is available in Willmott et al. (1985),
2017).
Willmott (1981).
The LSTsat has been remapped to the model grid of
COSMO-BEP-Tree using an average resampling method; i.e.
the average of all contributing pixels was computed (McIn- 4 Results
erney and Kempeneers, 2015). This resampling method en-
sures the conservation of the mean values. 4.1 Evaluation against measurements from an urban
LSTmod was calculated combining the temperatures of flux tower
roofs, streets and natural surfaces according to their respec-
tive fractions as The comparison between model simulations and observa-
tions above the urban canopy layer at the BKLI flux tower
site is shown in Fig. 5. Only the results corresponding to
the reference simulation (STD) and to the simulation without
www.geosci-model-dev.net/13/1685/2020/ Geosci. Model Dev., 13, 1685–1710, 20201696 G. Mussetti et al.: Coupling an urban canopy model with trees with a regional climate model
Table 4. RMSEs, MBEs and coefficient of determination (r 2 ) of the Street trees produce a very small increase in specific humid-
simulated air temperatures (T ), specific humidity (q), wind speed ity, bringing the model in slightly closer agreement with the
(u), sensible heat flux (QH ) and latent heat flux (QE ) at the BKLI observations. This is quantified by a reduction in the sys-
site (38 m above ground) during the study period. In addition to the tematic component of RMSE and MBE compared to LA0
total RMSEs (T), the systematic (S) and the unsystematic (U) RM- of about 0.1 g kg−1 (about 6 % and 8 % of the entire RMSE
SEs are listed. The statistics are provided for the standard simulation and MBE, respectively).
(STD) and the simulation without street trees (LA0). The units only The model simulates well the evolution of wind speed (u)
apply to RMSE and MBE.
during the evaluation period (Fig. 5e–f) but overestimates
u during several days and especially in the afternoon. The
RMSE (T/S/U) MBE r2 overestimation was not limited to the urban area but was
STD 1.04/0.51/0.90 0.51 0.97 also found at the rural site (Fig. S5). Although its origin
T (K)
LA0 1.10/0.58/0.93 0.58 0.97 is unclear, possible causes may include a misrepresentation
STD 1.52/1.13/1.02 −1.09 0.74
of the regional-scale wind from the driving boundary con-
q (g kg−1 ) ditions and an overestimation of the thermally driven flow
LA0 1.61/1.24/1.03 −1.20 0.73
induced by the surface temperature gradient between the city
STD 1.31/0.80/1.03 0.61 0.70 and the surroundings. Nevertheless, the comparison with ob-
u (m s−1 )
LA0 1.62/1.10/1.19 0.87 0.69 servations shows a small bias (MBE = 0.61 m s−1 ), lower
STD 40.10/7.72/39.30 7.70 0.88 than previous urban studies with COSMO (e.g. Schubert and
QH (W m−2 )
LA0 74.80/50.60/55.20 47.00 0.84 Grossman-Clarke, 2014), and the unsystematic error domi-
nates. Street trees reduce the simulated u and slightly im-
STD 25.10/6.86/24.10 5.31 0.70
QE (W m−2 ) prove the agreement with the observations. RMSE and MBE
LA0 37.80/36.90/8.57 −32.20 0.74
are reduced compared to LA0 by 0.31 and 0.26 m s−1 , re-
spectively.
The sensible heat flux (QH ) follows the observations
street trees (LA0) are shown (see Table 1 for further details very well during the evaluation period (Fig. 5g–h), show-
on the simulation setups). The statistical scores are given in ing almost no bias (MBE = 7.7 W m−2 ) but a RMSE of
Table 4. If not specified, we refer to the STD simulation in 40.1 W m−2 with a large unsystematic component. These er-
the text below. rors are comparable to or smaller than those obtained in a
The model simulates the evolution of air temperature very recent intercomparison of UCMs (Grimmond et al., 2011).
well during the evaluation period (Fig. 5a–b), although a The representation of street trees substantially improves the
slight overestimation with a MBE of 0.51 K and a system- agreement with the observations. Street trees reduce simu-
atic RMSE of 0.51 K was found. The overestimation occurs lated QH by as much as 100 W m−2 during midday. The im-
mostly during nighttime and it seems to be related to an provements in RMSE and MBE compared to LA0 were as
underestimation of the bulk albedo (Fig. S4), which can be large as 34.7 and 39.3 W m−2 , respectively. Additionally, an
traced back to the choice of material properties (Table 2). A improvement of 0.06 in r 2 was also found.
too-low albedo may have produced an excess in heat storage The evolution of latent heat flux (QE ) is generally well re-
with consequently larger sensible heat release at night. Nev- produced by the model (Fig. 5i–l), but the agreement is better
ertheless, a nighttime overestimation of temperature was not during the initial and final phases of the heatwave when the
found at the near-surface sites, indicating that more analy- synoptic forcing was stronger and wind speeds correspond-
ses are needed to better understand eventual issues with the ingly higher. During the central part of the evaluation period,
choice of material properties. The impact of street trees on an overestimation is found. Overall, the model showed a very
the air temperature above the canopy layer is found to be small MBE of about 5 W m−2 and a RMSE of 25.1 W m−2 .
negligible, giving the very small differences between STD Again, the scores are comparable to or better than those
and LA0. obtained in a recent intercomparison of UCMs (Grimmond
The evolution of specific humidity q throughout the sim- et al., 2011). The slight overestimation during the central part
ulation is generally well reproduced (Fig. 5c–d). The mean of the simulation period could be caused by a limitation in
value of q is underestimated (MBE = −1.09 g kg−1 ), which soil water availability that may have been present in reality
explains a large fraction of the systematic RMSE (RMSEs but was not considered in the simulations. Street trees had a
= 1.13 g kg−1 ). A similar pattern is found at the rural site very large impact on QE and improved the agreement with
of BLER (Fig. S5), indicating that the bias is not related the observations substantially. RMSE and MBE improved
to the urban scheme. The bias would be consistent with a compared to LA0 by 12.7 and 26.9 W m−2 , respectively.
general underestimation of soil moisture in COSMO as re- For completeness, the comparison between modelled and
ported by Davin et al. (2011). Another possible source of the observed radiation fluxes is shown in Fig. S6. The model sim-
bias may be related to the boundary conditions, with insuffi- ulations agree reasonably well with the observed radiation
cient humidity advected from the boundaries of the domain. fluxes, although the upward short-wave radiation is under-
Geosci. Model Dev., 13, 1685–1710, 2020 www.geosci-model-dev.net/13/1685/2020/You can also read