Comparison of co-located refractory black carbon (rBC) and elemental carbon (EC) mass concentration measurements during field campaigns at several ...
←
→
Page content transcription
If your browser does not render page correctly, please read the page content below
Atmos. Meas. Tech., 14, 1379–1403, 2021
https://doi.org/10.5194/amt-14-1379-2021
© Author(s) 2021. This work is distributed under
the Creative Commons Attribution 4.0 License.

Comparison of co-located refractory black carbon (rBC) and
elemental carbon (EC) mass concentration measurements during
field campaigns at several European sites
Rosaria E. Pileci1 , Robin L. Modini1 , Michele Bertò1 , Jinfeng Yuan1 , Joel C. Corbin1,a , Angela Marinoni2 ,
Bas Henzing3 , Marcel M. Moerman3 , Jean P. Putaud4 , Gerald Spindler5 , Birgit Wehner5 , Thomas Müller5 ,
Thomas Tuch5 , Arianna Trentini6 , Marco Zanatta7 , Urs Baltensperger1 , and Martin Gysel-Beer1
1 Laboratory  of Atmospheric Chemistry, Paul Scherrer Institute (PSI), 5232 Villigen, Switzerland
2 Instituteof Atmospheric Science and Climate, Italian National Research Council (CNR-ISAC),
via Gobetti 101, 40129 Bologna, Italy
3 Netherlands Organisation for Applied Scientific Research (TNO), 3584 Utrecht, the Netherlands
4 Joint Research Centre (JRC), European Commission, 21027 Ispra, Italy
5 Leibniz Institute for Tropospheric Research (TROPOS), 04318 Leipzig, Germany
6 Regional Agency for Prevention, Environment and Energy, Emilia–Romagna, 40122, Bologna, Italy
7 Alfred Wegener Institute, Helmholtz Centre for Polar and Marine Research, 27515 Bremerhaven, Germany
a now at: Metrology Research Centre, National Research Council Canada, Ottawa K1A 0R6, Canada

Correspondence: Robin L. Modini (robin.modini@psi.ch) and Martin Gysel-Beer (martin.gysel@psi.ch)

Received: 14 May 2020 – Discussion started: 25 June 2020
Revised: 4 January 2021 – Accepted: 7 January 2021 – Published: 23 February 2021

Abstract. The mass concentration of black carbon (BC) par-        centration ratios on the single-campaign level were 0.53,
ticles in the atmosphere has traditionally been quantified with   0.65, 0.97, 1.20 and 1.29, respectively, and the geometric
two methods: as elemental carbon (EC) concentrations mea-         standard deviation (GSD) was 1.5 when considering all data
sured by thermal–optical analysis and as equivalent black         points from all five campaigns. This shows that substantial
carbon (eBC) concentrations when BC mass is derived from          systematic bias between these two quantities occurred during
particle light absorption coefficient measurements. Over the      some campaigns, which also contributes to the large over-
last decade, ambient measurements of refractory black car-        all GSD. Despite considerable variability in BC properties
bon (rBC) mass concentrations based on laser-induced in-          and sources across the whole dataset, it was not possible to
candescence (LII) have become more common, mostly due             clearly assign reasons for discrepancies to one or the other
to the development of the Single Particle Soot Photometer         method, both known to have their own specific limitations
(SP2) instrument. In this work, EC and rBC mass concen-           and uncertainties. However, differences in the particle size
tration measurements from field campaigns across several          range covered by these two methods were identified as one
background European sites (Palaiseau, Bologna, Cabauw and         likely reason for discrepancies.
Melpitz) have been collated and examined to identify the             Overall, the observed correlation between rBC and EC
similarities and differences between BC mass concentrations       mass reveals a linear relationship with a constant ratio, thus
measured by the two techniques. All EC concentration mea-         providing clear evidence that both methods essentially quan-
surements in PM2.5 were performed with the EUSAAR-2               tify the same property of atmospheric aerosols, whereas sys-
thermal–optical protocol. All rBC concentration measure-          tematic differences in measured absolute values by up to a
ments were performed with SP2 instruments calibrated with         factor of 2 can occur. This finding for the level of agreement
the same calibration material as recommended in the litera-       between two current state-of-the-art techniques has impor-
ture. The observed values of median rBC-to-EC mass con-           tant implications for studies based on BC mass concentra-

Published by Copernicus Publications on behalf of the European Geosciences Union.
1380                          R. E. Pileci et al.: Comparison of co-located rBC and EC mass concentration measurements

tion measurements, for example for the interpretation of un-         tion in aerosols. The following three different techniques are
certainties in inferred BC mass absorption coefficient values,       most commonly applied: filter based thermal–optical evolved
which are required for modeling the radiative forcing of BC.         gas analysis (Huntzicker et al., 1982; Chow et al., 2007; Cav-
Homogeneity between BC mass determination techniques is              alli et al., 2010); laser-induced incandescence (LII) (Schraml
also very important for moving towards a routine BC mass             et al., 2000; Stephens et al., 2003; Schwarz et al., 2006;
measurement for air quality regulations.                             Michelsen et al., 2015) and methods based on aerosol light
                                                                     absorption (Rosen et al., 1978; Hansen et al., 1984; Arnott
                                                                     et al., 2003; Petzold et al., 2005). The specific terms used
                                                                     to refer to the mass of BC quantified by each of these three
1   Introduction                                                     techniques are as follows: elemental carbon (EC), refractory
                                                                     black carbon (rBC) and equivalent black carbon (eBC), re-
Light-absorbing aerosols exert a positive radiative forcing          spectively (Petzold et al., 2013). Measurements of eBC mass
through direct absorption of solar radiation. Moreover, their        are not further addressed here, as they rely on prior knowl-
heating can change atmospheric dynamics and, thereby,                edge or assumed values of the MACBC . Such prior knowl-
cloud formation and lifetime (Samset et al., 2018). Despite          edge is not required for thermal–optical measurements of EC
the relatively small mass abundance of black carbon (8 %–            mass or for LII measurements of rBC mass.
17 %; Putaud et al., 2010), it dominates the aerosol light ab-          Both thermal–optical analysis (TOA) and the LII tech-
sorption in the atmosphere (Bond et al., 2013). Additional,          nique make use of the high refractoriness of BC to quan-
significant contributions come from brown carbon (Kirch-             tify its mass, although in different manners. In comparing
stetter et al., 2004), tar balls (Adachi et al., 2019) and mineral   these two techniques, it is essential to define what is meant
dust (Sokolik and Toon, 1999).                                       by BC. The popular Bond et al. (2013) definition of BC
   Black carbon aerosols possess a unique set of properties:         is, fundamentally, a summary of the properties of highly
they are refractory (Schwarz et al., 2006), strong absorbers of      graphitized carbon found in soot particles. There are, how-
short- and long-wave radiation (Bond and Bergstrom, 2006),           ever, other forms of light-absorbing carbonaceous particulate
insoluble in water (Fung, 1990), and composed primarily              matter (PM), with different cross sensitivities for TOA and
of graphene-like sp2 -bonded carbon (Medalia and Heckman,            LII. Building on earlier studies (e.g., Bond, 2001), Corbin
1969). The source of black carbon is the incomplete combus-          et al. (2019) recently proposed a refined classification of
tion of hydrocarbon fuels, including fossil fuels and bio-fuels      light-absorbing carbonaceous PM into four classes: soot–
(Bond et al., 2013). BC mass concentration data from atmo-           BC, char BC, tar brown carbon and soluble brown carbon,
spheric measurements are used in many applications such as           and they provided an overview of the respective physico-
validation of model simulations (Grahame et al., 2014; Hod-          chemical properties. This refined classification provides a
nebrog et al., 2014) and quantification of the mass absorption       useful framework in describing the responses of TOA and
coefficient of BC (MACBC ). The latter is defined as the ratio       LII. For example tar brown carbon, an amorphous form of
of the light absorption coefficient caused by BC to the BC           carbon, is sufficiently refractory to contribute to EC mass,
mass concentration and is a crucial parameter in modeling            whereas it is not sufficiently refractory to cause substan-
the BC radiative forcing (Matsui et al., 2018). For these rea-       tial interference in rBC (Corbin and Gysel-Beer, 2019). Any
sons, it is important to assess the accuracy and comparability       work that compares BC measurement techniques should
of different BC mass measurement techniques.                         therefore consider the types of carbonaceous material present
   There is neither an SI (International System of Units)            in the sample.
traceable reference method nor a suitable standard reference            Very few intercomparisons of EC mass and rBC mass are
material for quantifying BC mass (Baumgardner et al., 2012;          available in the literature, particularly when it comes to ambi-
Petzold et al., 2013). This presents a challenge for the long-       ent aerosols, despite the fact that both methods are frequently
term, routine monitoring of BC mass concentrations in obser-         applied these days. This means that the debate on the com-
vation networks such as GAW (Global Atmosphere Watch),               parability of these two quantities is still largely unresolved.
ACTRIS (Aerosol, Clouds and Trace Gases Research In-                 Some studies have shown that the two quantities can agree to
frastructure) and IMPROVE (Interagency Monitoring of Pro-            within a few percent (Laborde et al., 2012b; Miyakawa et al.,
tected Visual Environments). The lack of a reference method          2016; Corbin et al., 2019), while other studies have shown
is due to variability in the microstructure of BC produced by        they can systematically differ by factors of up to 2 to 3 in ei-
different combustion sources (Adachi et al., 2010), the dif-         ther direction (e.g., Zhang et al., 2016; Sharma et al., 2017).
ficulty of isolating BC from other particulate matter and the           In this work, we examined and quantified the level of
lack of direct mass-based methods selective with respect to          agreement or disagreement between BC mass concentra-
BC without interferences (Baumgardner et al., 2012).                 tions measured by thermal–optical analysis and the LII
   In practice, the BC mass is defined operationally through         technique. For this purpose, we compared co-located mea-
methodologies that use distinct physico-chemical and/or op-          surements of EC and rBC mass concentrations from field
tical properties of BC in order to quantify its mass concentra-      campaigns performed at several European sites (Bologna,

Atmos. Meas. Tech., 14, 1379–1403, 2021                                               https://doi.org/10.5194/amt-14-1379-2021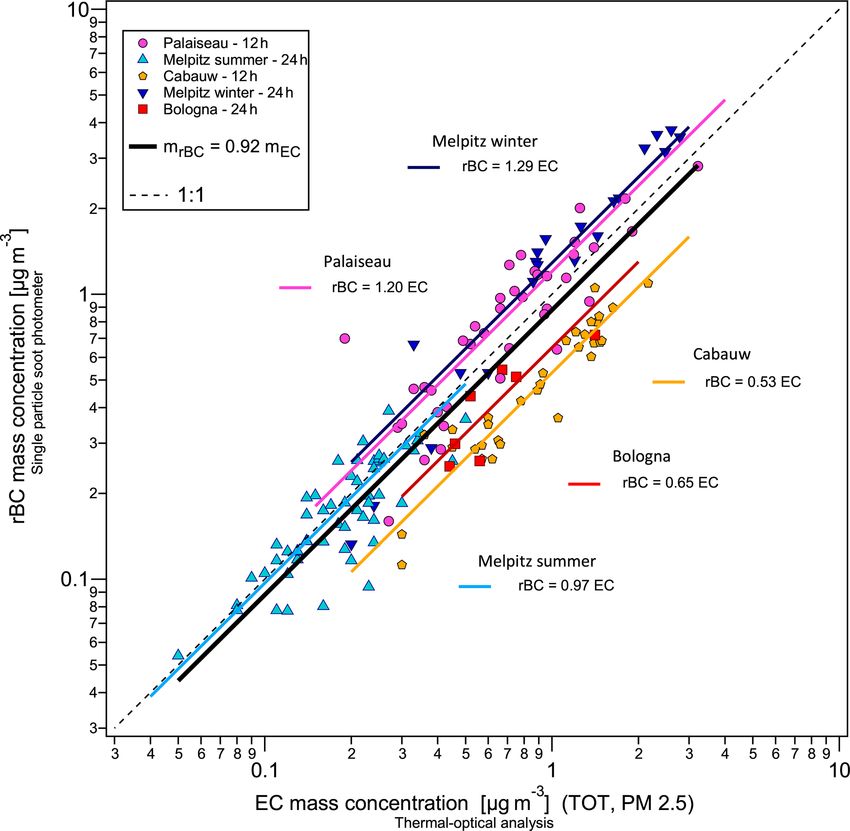
R. E. Pileci et al.: Comparison of co-located rBC and EC mass concentration measurements                                         1381

Cabauw, Palaiseau and Melpitz) in order to sample differ-            20 km. During the campaign, the SP2 was placed behind a
ent aerosol types. Care was taken to harmonize the applied           Nafion dryer (model MD-700, Perma Pure) with a PM10 in-
methods: all thermal–optical measurements were performed             let situated at 4.5 m a.g.l. The PM10 sampler, from whose fil-
with the same temperature protocol (EUSAAR-2, European               ters off-line OC–EC analyses were carried out, did not in-
Supersites for Atmospheric Aerosol Research; Cavalli et al.,         clude a dryer in the sampling line in line with GAW recom-
2010), and all Single Particle Soot Photometer (SP2) cali-           mendations (GAW Report No. 227; WMO, 2016). The mea-
brations were performed using the same calibration material.         surements at this site were performed from 13 to 28 Septem-
This first multi-site intercomparison allows us to more quan-        ber 2016. The meteorological conditions and aerosol charac-
titatively assess the extent to which the EC and rBC concen-         teristics encountered during the campaign are described by
tration measurements agree or disagree with each other. Po-          Tirpitz et al. (2021).
tential reasons for discrepancies such as different size cuts,          The Bologna measurements were performed at the main
calibration uncertainties and various interferences are dis-         seat of CNR-ISAC (Consiglio Nazionale delle Ricerche –
cussed.                                                              Institute of Atmospheric Sciences and Climate), in Bologna
                                                                     (Italy; 44◦ 310 N, 11◦ 200 E; 39 m a.s.l.). The site is classified
                                                                     as urban background and is located in the Po Valley, a Euro-
2     Methods                                                        pean pollution hot spot due to its orography, meteorological
                                                                     conditions and high presence of human activities, resulting
2.1    Sampling campaigns – measurements sites and                   in a large number of anthropogenic emission sources (Vec-
       experimental setup                                            chi et al., 2009; Putaud et al., 2010; Ricciardelli et al., 2017;
                                                                     Bucci et al., 2018). During the campaign, a PM2.5 sampler,
The observations presented here include measurements from            not equipped with a drier, was situated at the ARPAE Su-
five field campaigns at four different sites, three of which         persito (inside the CNR-ISAC area). The SP2 was located
are part of the ACTRIS network (Aerosol, Clouds and Trace            inside a fully instrumented mobile van in the CNR parking
Gases Research Infrastructure; https://www.actris.eu, last ac-       area, about 50 m away from the ARPAE Supersito. The in-
cess: 16 February 2021). Basic information (site and country,        struments in the van were connected to two inlet lines situ-
station code, coordinates, altitude, year and season) of each        ated on the top of the vehicle at a height of 3 m and connected
field campaign is summarized in Table S1.                            to the main inlet line with an inner diameter of 5 cm; no size
   The Melpitz research site of TROPOS (Germany;                     cut was performed. The sampled air was dried to below 30 %
51◦ 320 N, 12◦ 560 E; 87 m a.s.l.) is located in the lowlands of     relative humidity using two custom-built, silica-gel-loaded
Saxony, 41 km NE of Leipzig, Germany. The nearest vil-               diffusion driers. The data presented in this paper were col-
lage with about 230 inhabitants is 300 m east of the sta-            lected from 7 to 31 July 2017. The meteorological conditions
tion. The site is representative of the regional background          and the aerosol properties of this campaign are described by
in central Europe (Spindler et al., 2012, 2013) since it is          Pileci et al. (2021).
situated on a flat meadow, surrounded by agricultural land              The SIRTA Atmospheric Research Observatory (France;
(Spindler et al., 2010). The area is sometimes influenced            48◦ 430 N, 2◦ 120 E; 160 m a.s.l.) is situated in Palaiseau,
by long-range transported air masses from source regions in          25 km south of Paris. The station is characterized as suburban
eastern, southeastern and southern Europe which can con-             background (Haeffelin et al., 2005). This site is influenced
tain, especially in winter, emissions from coal heating (van         by both fresh and aged black carbon mainly originating from
Pinxteren et al., 2019). Two separate field campaigns were           the Paris area. It is impacted by road transport emissions all
performed in summer (from 6 May to 1 July 2015) and                  year round and residential wood burning during the winter
winter (from 2 to 23 February 2017). During the two cam-             (Laborde et al., 2013; Petit et al., 2015; Zhang et al., 2018).
paigns, the SP2 was placed behind a Nafion dryer (model              The SP2 along with many other instruments was installed
MD-700, Perma Pure) with a PM10 inlet about 6 m above                in an air-conditioned trailer of the SIRTA measurement plat-
ground level (a.g.l.). The PM2.5 sampler for the OC–EC sam-          form. For the OC–EC measurements, high-volume samplers
ples was placed nearby. The meteorological conditions and            with a PM2.5 cut-off were available in the same area. The
aerosol characteristics encountered during the campaigns are         measurements were performed from 15 January to 15 Febru-
described by Altstädter et al. (2018) for the summer cam-            ary 2010. EC and rBC concentrations during this campaign
paign and by Yuan et al. (2021) for the winter campaign.             have previously been published in Laborde et al. (2013).
   The KNMI (Koninklijk Nederlands Meteorologisch Insti-
tuut) Cabauw Experimental Site for Atmospheric Research
(the Netherlands; 51◦ 580 N, 4◦ 550 E; 0.7 m a.s.l.) is located in
the background area of Cabauw, 20 km from Utrecht, 30 km
from Rotterdam and 50 km from the North Sea. The nearby
region is agricultural in an otherwise densely populated area,
and surface elevation changes are at most a few meters over

https://doi.org/10.5194/amt-14-1379-2021                                               Atmos. Meas. Tech., 14, 1379–1403, 2021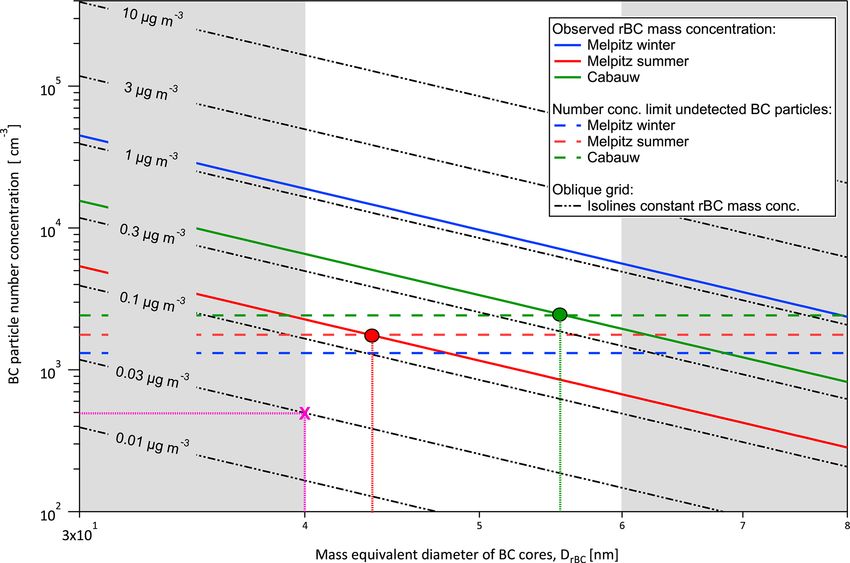
1382                         R. E. Pileci et al.: Comparison of co-located rBC and EC mass concentration measurements

2.2     Thermal–optical analysis                                   – TOR – method) instead of transmittance. As reported in the
                                                                   review paper by Karanasiou et al. (2015), EC values of atmo-
2.2.1    Measurement principle, OC–EC split and                    spheric samples determined using the TOT method are often
         involved artifacts                                        up to 30 %–70 % lower than those determined using the TOR
                                                                   method, which is attributed to various reasons (Karanasiou et
In thermal–optical evolved gas analysis (TOA), carbona-            al., 2015; Chiappini et al., 2014; see Sect. S1). Therefore, all
ceous particles deposited on a filter are thermally desorbed       EC mass values reported in this study are based on the TOT
or reacted in order to determine the total carbon mass. This       method.
technique further divides the total carbon (TC) into EC and           The above-described assumptions about the optical char-
organic carbon (OC) according to the expectation that EC is        ring correction are only partially fulfilled, typically leaving
refractory in an inert atmosphere while OC is not (Chow et         charring artifacts as a main source of bias even for optically
al., 1993; Birch and Cary, 1996; Bond, 2001; Chow et al.,          corrected EC mass data (Chow et al., 2004; Subramanian et
2004). Therefore, TOA provides operationally defined OC            al., 2006). Pyrolysis depends on many factors, including the
and EC mass rather than fundamental quantities. This basic         quantity and type of organic compounds, temperature steps
binary split does not acknowledge that neither OC nor EC           in the analysis, and the residence time at each temperature
are well-defined materials. Instead, carbonaceous matter in        step. This makes the TOA technique sensitive to the aerosol
aerosols populates the multidimensional space of chemical          type collected on the filter. Water extraction experiments
and physical properties more or less in a continuous man-          have shown that water-soluble organic carbon (WSOC) com-
ner (Saleh et al., 2018; Corbin et al., 2020). Nevertheless, the   pounds are particularly prone to causing charring (Yu et al.,
binary split approach aims at providing an operationally de-       2002; Piazzalunga et al., 2011; Zhang et al., 2012; Giannoni
fined EC mass that corresponds to “true” BC mass as defined        et al., 2016). Samples with a high WSOC content come from,
on a conceptual level by Bond et al. (2013) and Corbin et          e.g., biomass and wood burning (Hitzenberger et al., 2006;
al. (2019) (see Sect. 1).                                          Reisinger et al., 2008; Chen et al., 2015). A filter water-
    In TOA, the carbonaceous material deposited on a punch         washing step prior to TOA can be used to remove WSOC,
of a quartz fiber filter is thermally desorbed through pro-        thereby reducing charring artifacts and improving compara-
gressive heating: first in an inert atmosphere of pure helium      bility of different protocols for EC mass measurements (Yu
(He) at multiple moderate temperatures (∼ 500–700 ◦ C) (in-        et al., 2002; Piazzalunga et al., 2011). However, filter pre-
ert mode) and then in an oxidizing atmosphere (98 % He and         washing is generally not applied in long-term-monitoring
2 % O2 ) at high temperature (∼ 850 ◦ C). The applied du-          TOA measurements for practical reasons (the washing step
ration and the temperature of each step vary between dif-          is time-consuming). In these cases, the charring phenomenon
ferent thermal protocols, as discussed below in Sect. 2.2.2.       can be reduced by adopting a thermal protocol with a suffi-
The evolving carbon is catalytically converted first to carbon     ciently long residence time at each temperature step in the
dioxide (CO2 ) and then to methane (CH4 ). CH4 is then quan-       He atmosphere to allow for maximum OC evolution (Subra-
tified using a flame ionization detector (FID) and reported as     manian et al., 2006; Karanasiou et al., 2015).
OC (inert mode) and EC (oxidizing mode) mass. The instru-             The OC–EC split can be also biased by EC pre-
ment type applied in this study and most commonly used to          combustion: EC can thermally evolve in the presence of ox-
perform TOA measurements is the OC–EC analyzer manu-               idizing species (Watson et al., 2005; Corbin et al., 2014,
factured by Sunset Laboratory Inc. (Tigard, OR, USA).              2015), and soluble inorganic compounds (Chow et al., 2001;
    Ideally, all OC would desorb in the inert He atmosphere        Yu et al., 2002) and metal salts (Aakko-Saksa et al., 2018)
and EC would exclusively burn off in the oxidizing O2 atmo-        can catalyze EC pre-combustion. If the amount of EC under-
sphere (Chow et al., 1993; Birch and Cary, 1996). In prac-         going pre-combustion is significant relative to the amount of
tice, a fraction of carbonaceous matter may be more refrac-        PC formed during the analysis, the optical correction (trans-
tory than the applied separation threshold while not being         mittance or reflectance) is not able to account for it, and this
BC in a strict sense. This would cause a positive bias in mea-     may cause an underestimation of the EC concentration.
sured EC mass. In addition, a fraction of the OC can pyrolyze         Moreover, soluble brown carbon on filters can affect the
in the He step to form pyrolytic carbon (PC), which is ther-       laser correction if it was evolving during the OC steps,
mally stable and only desorbs in the O2 step, thereby caus-        thereby causing a positive EC artifact. However, soluble
ing a charring artifact in the mutual quantification of OC and     brown carbon absorbs much less per unit mass than EC at
EC. To correct for this latter effect, a laser at 658 nm is used   the red wavelength (λ = 635 nm) of the laser used in the
in combined thermal–optical analysis to monitor the light          thermal–optical instruments, since its absorbance decreases
transmission through the loaded filter before and during the       strongly from the blue–UV region of the electromagnetic
analysis. The measurement principle behind this so-called          spectrum towards the red region (Karanasiou et al., 2015).
thermal–optical transmission (TOT) correction approach is          This reduces the potential interference of soluble brown car-
explained in Sect. S1. The charring correction can also be         bon via the introduction of a bias in the optical charring cor-
performed using light reflectance (thermo-optical reflectance      rection. Recently, Massabò et al. (2019) developed a modi-

Atmos. Meas. Tech., 14, 1379–1403, 2021                                             https://doi.org/10.5194/amt-14-1379-2021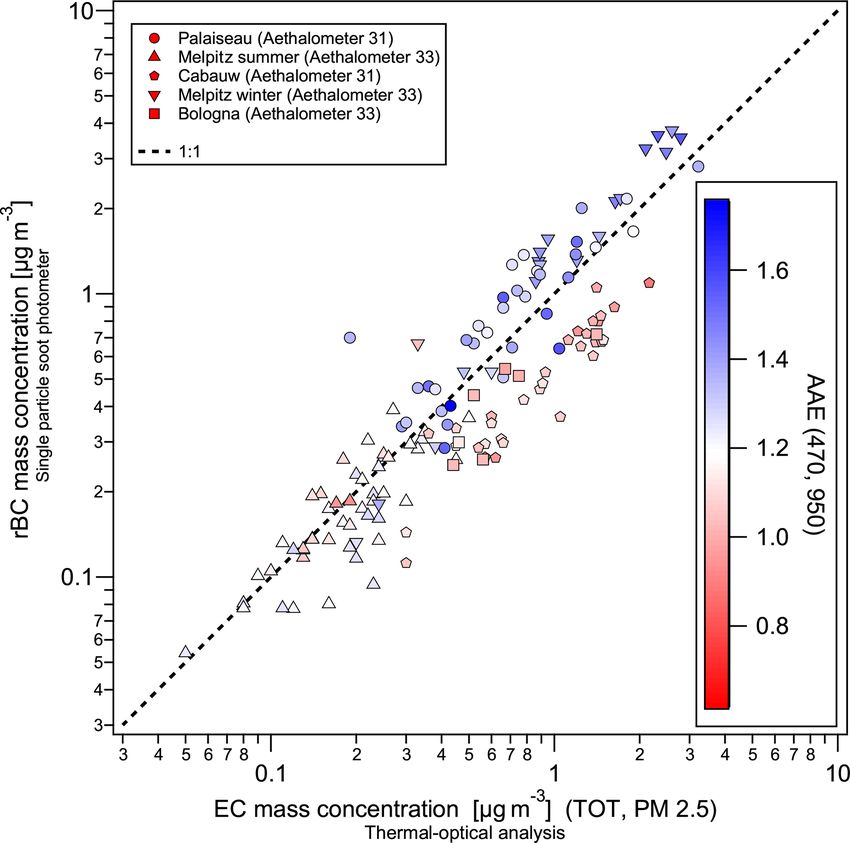
R. E. Pileci et al.: Comparison of co-located rBC and EC mass concentration measurements                                                       1383

fied Sunset Lab Inc. EC–OC analyzer to measure the brown          Table 1. Overview of reported differences between EC calculated
carbon content in the sample by adding a second laser diode       with other protocols minus the EC calculated with the EUSAAR-2
at λ = 405 nm.                                                    protocol.
   Tar brown carbon only evolves in the oxidizing step of
TOA due to its refractoriness (Corbin et al., 2019). There-            Protocols                            Relative difference
fore, it is assigned to EC independent of its light absorption                                         compared to EUSAAR-2 (TOT)
properties. This is in contrast to LII, where tar brown car-           IMPROVE (TOR)                                  ∼ +25 %a
bon only gives a marginal contribution to observed rBC mass            IMPROVE–A (TOR)                                ∼ −10 %b
(Sect. 2.3.3).                                                         EnCan-Total-900                                ∼ ±25 %c
   Further artifacts in TOA can be caused by carbonate car-
                                                                     a Han et al. (2016). b Cheng et al. (2013). c Karanasiou et al. (2015).
bon, as discussed in Wang et al. (2010), Karanasiou et
al. (2015) and Querol et al. (2012). Thermal protocols can
be designed to minimize this artifact by having most carbon-
ate carbon evolve as OC (as is the case with the EUSAAR-2         involve a charring correction (Huang et al., 2006; Chan et
protocol used in this work; Sect. 2.2.2). However, minor pos-     al., 2010).
itive, carbonate-related artifacts in EC cannot be excluded
(Karanasiou et al., 2011).                                        2.2.3    Variability in EC measurements with the
                                                                           EUSAAR-2 protocol
2.2.2   Thermal protocols – EUSAAR-2 vs. other
                                                                  Given the artifacts involved in TOA, different instruments
        existing protocols
                                                                  can measure different EC concentrations for the same sam-
                                                                  ple, even if the same thermal protocol is used. For this reason,
Many variants of thermal protocols exist for the thermal–         the Joint Research Centre (JRC) European Reference Lab-
optical analysis of EC mass (Bautista et al., 2015). The re-      oratory for Air Pollution (ERLAP) organizes annual instru-
sults presented in this study are based on the EUSAAR-            mental inter-laboratory comparisons, which typically include
2 protocol, which was developed by Cavalli et al. (2010).         15 to 30 participants, in order to harmonize measurements
The EUSAAR-2 protocol was specifically optimized for              from different Sunset instruments that employ the EUSAAR-
aerosol typically encountered at European background sites,       2 protocol. The measurement performances are evaluated us-
and it has recently been selected as the European stan-           ing several PM2.5 quartz fiber filters collected at a regional
dard thermal protocol to be applied in air quality networks       background site in Italy. Since the true concentrations of EC
for the measurement of TC (total carbon), OC and EC in            or TC in these ambient samples are unknown (due to the
PM2.5 (particulate matter) samples (European Committee for        lack of suitable reference methods or materials), the expected
Standardization, 2017; EN 16909:2017). Besides EUSAAR-            concentrations are chosen (“assigned”) as the robust averages
2, the IMPROVE–A thermal protocol of the Interagency              (i.e., with outliers removed) of the TC and EC mass concen-
Monitoring of Protected Visual Environments (Chow et al.,         trations measured by all participants.
1993, 2007) and the NIOSH thermal protocols developed by             The latest intercomparison yielded an EC-to-TC ratio re-
the National Institute for Occupational Safety and Health         peatability (with the same instrument over time) of 3 %
(Birch and Cary, 1996) are also commonly used for TOA.            to 8 % and an EC-to-TC ratio reproducibility (among dif-
Various NIOSH-like protocols (NIOSH 5040, NIOSH 840,              ferent instruments) of 12 % to 17 % (across 21 partic-
NIOSH 850 and NIOSH 870) exist that are all modified ver-         ipants), where the method precision becomes exponen-
sions of the Birch and Cary (1996) and Birch et al. (1999)        tially poorer towards lower TC contents (
1384 R. E. Pileci et al.: Comparison of co-located rBC and EC mass concentration measurements
were analyzed by ARPAE. The EC bias and variability in In this study, two different batches of fullerene soot (Alfa
the instrument used for analyzing the Bologna filter samples, Aesar, stock 40971, lots FS12S011 and W08A039) were
which did not participate in a full ERLAP intercomparison, used. The former is recommended as calibration material
was determined by comparison with the JRC ERLAP ref- (Baumgardner et al., 2012) since it was shown to be suit-
erence instrument for nine filter samples from the Bologna able for quantifying BC in diesel engine exhaust (agreement
campaign. The EC bias found was smaller than 20 % for all within 10 % for rBC cores ≤ 40 fg; Laborde et al., 2012b).
applied OC–EC analyzers, which is within the TOA mea- Calibrations using the latter batch agreed with those using
surement uncertainty. Therefore, we did not correct the EC the former batch within 5 %. In this work, three different SP2
measurements reported in this work for these biases. instruments (Paul Scherrer Institute, PSI; Institute des Géo-
Blank filters were analyzed for all campaigns. The blank sciences de l’Environnement, IGE; Alfred Wegener Institute,
value for EC mass was always below the detection limit or AWI) were used to acquire the data (Table 3). This how-
negligibly small compared to EC mass on loaded filter sam- ever does not contribute appreciably to uncertainties, since
ples, such that applying a blank correction does not make a the reproducibility of measured rBC mass size distributions
difference for the resulting EC mass concentration. was shown to be ±10 % during a large SP2 intercompari-
son involving six SP2 instruments from six different research
2.3 The Single Particle Soot Photometer (SP2) groups (Laborde et al., 2012b). The SP2 used during the Mel-
pitz campaigns was calibrated using an aerosol particle mass
2.3.1 Principle of measurement analyzer (APM) to select the calibration particles by mass
(Table 3). For the other campaigns a differential mobility
Laser-induced incandescence occurs when a high-intensity analyzer (DMA) was used for size selection and the corre-
laser is used to heat light-absorbing and highly refractory sponding particle mass was calculated using effective den-
particles to high-enough temperatures for them to emit con- sity data reported in Gysel et al. (2011). The latter approach
siderable grey body and blackbody radiation. LII can be results in an additional error of about 10 %.
used to quantify rBC carbon mass concentration in aerosols
by detecting the emitted thermal radiation, which is ap-
2.3.3 Potential interferences and artifacts
proximately proportional to rBC mass. There are different
instrumental approaches for LII using both pulsed lasers
(Michelsen et al., 2015) and continuous-wave lasers, as in One of the strengths of the SP2 is that the incandescence sig-
the commercially available Single Particle Soot Photometer nal is not perturbed by the presence of non-refractory matter
(SP2, Droplet Measurement Technologies, Longmont, CO, internally or externally mixed with BC (Moteki and Kondo,
USA). The SP2 quantifies the rBC mass in individual parti- 2007; Slowik et al., 2007). However, other types of highly
cles (Stephens et al., 2003; Schwarz et al., 2006; Moteki and refractory and sufficiently light-absorbing (at 1064 nm) ma-
Kondo, 2007). When aerosol particles enter the instrument, terial can incandesce in the SP2 laser. Therefore, SP2 mea-
they are directed into the center of an intra-cavity Nd:YAG surements can potentially contain interferences from met-
laser beam with a wavelength of 1064 nm where they are irra- als, metal oxides (Moteki et al., 2017), volcanic ash and
diated. BC-containing particles absorb the laser light causing dust (rarely) (Kupiszewski et al., 2016). Fortunately, such
them to heat up and incandesce. Since the thermal radiation materials are usually observed only rarely in atmospheric
emitted by individual black carbon particles is proportional aerosols in large-enough quantities to cause significant SP2
to the volume (and mass) of BC in the particles (Moteki and measurement artifacts. Furthermore, if they are present, in
Kondo, 2010), this radiation intensity can be converted to some cases their presence can be identified and ignored when
rBC mass using an empirical calibration curve. calculating rBC mass. Specifically, potential interference can
be determined with the use of the spectral bandpass filters,
2.3.2 rBC mass calibration which permits the determination of the color temperature of
incandescence (Moteki et al., 2017). Recently, Sedlacek et
The relationship between incandescence signal peak ampli- al. (2018) found that rBC-free organic particles that absorb
tude and BC mass depends on the BC type (Moteki and light at 1064 nm can char and form rBC under sufficiently
Kondo, 2010; Laborde et al., 2012a), which means the in- high SP2 laser power, resulting in an rBC overestimate. In
strument should be calibrated with a material that represents general, this artifact is only likely to be relevant in biomass
the type of BC one seeks to measure. Unfortunately, many burning plumes that contain organic tar balls that can ab-
types of BC are found in the atmosphere, such that it is typi- sorb light at 1064 nm (Sedlacek et al., 2018). Marine engines
cally not possible to calibrate the SP2 specifically with atmo- operated with heavy fuel oil can also produce tar particles,
spheric BC. Instead, a fixed calibration using commercial BC but Corbin and Gysel-Beer (2019) found that the contribu-
materials is commonly applied. Therefore, potential variation tion of such particles to rBC mass was negligible. Further-
in the chemical microstructure of atmospheric BC results in more, it is possible to distinguish incandescing tar particles
uncertainty in rBC mass measurements. from soot BC with SP2 measurements by examining the ra-
Atmos. Meas. Tech., 14, 1379–1403, 2021 https://doi.org/10.5194/amt-14-1379-2021R. E. Pileci et al.: Comparison of co-located rBC and EC mass concentration measurements 1385
Table 2. Description of the methodology for EC mass concentration measurements: thermal protocol, sampling duration, inlet size cut, flow
rate and performance during the ERLAP intercomparison, in relative terms for EC bias and variability (Sect. 2.2.3 and Eqs. S1 and S2).
Station Thermal Sampling Inlet size Flow rate EC bias EC
code protocol for duration cut variability
mEC (h)
Palaiseau EUSAAR-2 12 PM2.5 30 m3 in 12 h −6.0 % 11.9 %
(TOT)
Melpitz winter EUSAAR-2 24 PM2.5 30 m3 h−1 −6.0 % 4.3 %
(TOT)
Melpitz summer EUSAAR-2 24 PM2.5 30 m3 h−1 16.1 % 4.4 %
(TOT)
Cabauw EUSAAR-2 12 PM10 27.6 m3 in 12 h −6.7 % 3.0 %
(TOT)
Bologna EUSAAR-2 24 PM2.5 38.3 L min−1 1.6 % 6.8 %
(TOT)
Table 3. Description of the measurement methodology for rBC mass concentration adopted during each campaign, along with SP2 owner
(Paul Scherrer Institute (PSI), Alfred Wegner Institute (AWI) and Institut de Géosciences de l’Environment (IGE)), calibration material
(fullerene soot batch), calibration method selection and inlet size cut.
Station code, SP2 Revision, Calibration Size selection Inlet size SP2 upper
campaign owner acquisition material (fullerene method for cut detection limit
card type soot batch) calibration [nm]
Palaiseau PSI C, 14 bit Fullerene soot DMA PM10 439
– 2.5 MHz – (stock 40971,
eight channels lot FS12S011)
Melpitz AWI C, 14 bit Fullerene soot APM PM10 722
winter – 2.5 MHz – (stock 40971,
eight channels lot W08A039)
Melpitz PSI C, 14 bit Fullerene soot APM PM10 766
summer – 2.5 MHz – (stock 40971,
eight channels lot FS12S011)
Cabauw IGE C, 14 bit Fullerene soot DMA PM10 537
– 2.5 MHz – (stock 40971,
eight channels lot FS12S011)
Bologna PSI C, 14 bit Fullerene soot DMA No size cut 676
– 2.5 MHz – (stock 40971,
eight channels lot FS12S011)
tio of scattering-at-incandescence to incandescence signals diameter of DrBC ≈ 50 nm using a void-free BC bulk den-
(Corbin and Gysel-Beer, 2019). sity of 1800 kg m−3 (Moteki and Kondo, 2010). The lower
cut-off size for unit counting efficiency can be larger if the
2.3.4 SP2 detection efficiency and detection range SP2 is not optimally set up. Usually the SP2’s counting effi-
ciency is robust down to DrBC ≈ 80 nm (mrBC ≈ 0.48 fg). We
The SP2 lower detection limit depends on both physical limi- only considered the data of particles with BC cores greater
tations of the detection technique and instrument parameters than DrBC = 80 nm in this study, as exact characterization of
chosen by the operator (Schwarz et al., 2010). With an op- the cut-off curve was not performed in all campaigns. Note
timal setup, the SP2 can reach unit counting efficiency for that poor counting efficiency for BC cores with greater mass
rBC mass of mrBC ≈ 0.12 fg (Schwarz et al., 2010; Laborde than this limit has been reported by Gysel et al. (2012). Palas
et al., 2012a), which corresponds to an rBC mass equivalent
https://doi.org/10.5194/amt-14-1379-2021 Atmos. Meas. Tech., 14, 1379–1403, 20211386 R. E. Pileci et al.: Comparison of co-located rBC and EC mass concentration measurements
soot, which is characterized by a very small primary sphere Here, 1mextrap is obtained by fitting a lognormal function
dmfit
size and very low fractal dimension, results in relatively en- dlogDrBC to the measured rBC mass size distribution and
hanced heat loss. However, we are not aware of studies indi- only considering potentially missed mass below the lower
cating reduced counting efficiency for atmospherically rele- detection limit (LDL) of the SP2. No correction was ap-
vant BC particles, which have larger primary spheres and a plied for potentially missed mass above the upper detection
higher fractal dimension, compared to Palas soot. limit (UDL) for two reasons explained in Sect. 3.1.1. Using
The SP2 was operated downstream of inlets with a 50 % this approach, the correction term simplifies to the integrated
cut-off diameter at 10 µm in every campaign except for the mass of the lognormal fit in the size range below the LDL:
Bologna campaign, where no external upper size cut was ap-
plied. In addition, the SP2 is unable to quantify rBC mass 1mextrap = 1mrBCUDL = (DrBC ) dlogDrBC (5)
was determined to be preferable. The two methods are based DUDL dlogDrBC
on fitting the measured rBC mass size distribution with a uni- and
modal lognormal function since BC mass size distributions
are generally close to lognormally distributed (e.g., Fig. 1;
Z DUDL dmfit
1mfitresid = (DrBC )
Schwarz et al., 2006; and Reddington et al., 2013). DLDL dlogDrBC
A first approach to correcting SP2 rBC measurements for dmmeas
potentially missed mass is based on extrapolation of the mea- − (DrBC ) dlogDrBC . (6)
dlogDrBC
sured size distribution below and/or above the SP2 detec-
tion limits. We hereafter refer to this as the “extrapolation Note that with this definition 1mfitresid has a negative
extrap
method”. The corrected rBC mass, mrBC,corr , is obtained as value for the example shown in Fig. 1. The correction term
the sum of the measured mass, mrBC,meas , and a correction in the case of the fit method is naturally defined as the differ-
term, 1mextrap : ence between the corrected and the measured rBC mass:
extrap
mrBC,corr = mrBC,meas + 1mextrap . (1) 1mfit = mfit − mrBC,meas . (7)
Atmos. Meas. Tech., 14, 1379–1403, 2021 https://doi.org/10.5194/amt-14-1379-2021R. E. Pileci et al.: Comparison of co-located rBC and EC mass concentration measurements 1387
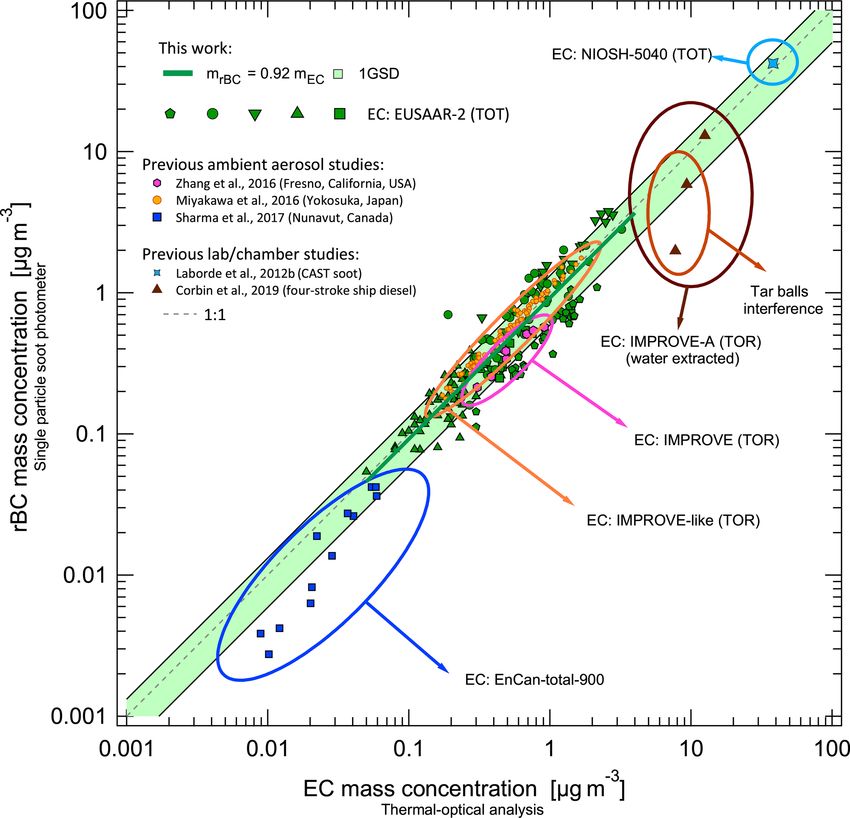
Figure 1. Approach to correct for the rBC mass outside the rBC core size range covered by the SP2 for the Melpitz winter (a and c) and the
Melpitz summer (b and d) campaigns. (c) and (d) show the measured rBC mass size distribution as a function of rBC core mass equivalent
diameter, including the SP2 detection limits DLDL and DUDL . The lognormal functions are fitted between DLDL and Dfit,upper . The inte-
grated areas of the red, purple, and blue shading correspond to 1mrBCUDL , respectively (see Sect. 2.3.5). (a)
and (b) additionally show the same shading after subtraction of the measured size distribution (and measurement forced to be zero outside
the SP2 detection range). The average mass size distributions of the other campaigns are represented in Fig. S1.
From Eqs. (4) and (7), one can derive: al. (2012), which consists of a differential mobility ana-
lyzer (DMA) and a condensation particle counter (CPC).
1mfit = 1mrBCUDL + 1mfitresid . (8) The DMA was operated with a sheath airflow of 10 L min−1 ,
and the aerosol number size distribution was measured ev-
Comparing the missing mass correction terms of the two ap-
ery 20 min. During the Cabauw campaign, a modified ver-
proaches given in Eqs. (1) and (4) shows that the corrected
sion of a commercially available scanning mobility particle
rBC mass differs by the sum of two physically meaning-
sizer (TSI SMPS 3034) provided the number size distribution
ful quantities, the fit residual and the extrapolated rBC mass
of the aerosol in the diameter range from 10 to 470 nm. No
above the UDL:
size information is available for the Palaiseau and Bologna
extrap
mfit
rBC,corr − mrBC,corr = 1mrBC>UDL + 1mfitresid . (9) campaigns.
The results of these two approaches are compared and dis- 2.4.2 Absorption Ångström exponent (AAE) inferred
cussed in relation to the different datasets used in this study from Aethalometer data
in Sect. 3.1.1. Outside of Sects. 3.1.1 and 3.1.2, Figs. 1, 2 and
S1, and Table 4, this paper applies the first method (Eq. 1) to
The Aethalometer measures the light attenuation through
quantify rBC mass.
a sample filter that is continuously loaded with aerosol
2.4 Auxiliary measurements (Hansen et al., 1984). The raw attenuation coefficient (batn )
is calculated from the rate of attenuation change with time.
2.4.1 Aerosol size distribution The relationship between the attenuation coefficient and ab-
sorption coefficient of the deposited aerosol particles is lin-
In the Melpitz winter and summer campaigns, aerosol ear for low attenuation values, but saturation occurs when the
number size distributions in the diameter range from 3.8 attenuation values are high (Weingartner et al., 2003). There-
to 770 nm were measured with a mobility particle size fore, the measurements must be corrected for this “loading
spectrometer (MPSS), custom built by Wiedensohler et effect” in order to obtain a corrected attenuation coefficient
https://doi.org/10.5194/amt-14-1379-2021 Atmos. Meas. Tech., 14, 1379–1403, 20211388 R. E. Pileci et al.: Comparison of co-located rBC and EC mass concentration measurements
Figure 2. Relationship between rBC mass equivalent diameter, BC particle number concentration and rBC mass concentration for perfectly
monodisperse BC aerosols (magenta cross and lines illustrate an example of this unambiguous relationship). The oblique dash-dotted black
grid represents isolines of constant rBC mass concentration. The continuous oblique lines represent the observed uncorrected rBC mass
concentrations (campaign geometric mean values). The horizontal dashed lines represent the upper number concentration limit (nlimit ),
calculated as the difference between the assumed maximum and the measured BC particle number concentration. The figure can be read
in two ways: the intersects of the horizontal lines with rBC mass concentration isolines provide an upper limit for the maximal undetected
rBC mass concentration if the undetected mode peaks at the diameter where the intersect occurs. Alternatively, when the horizontal dashed
line crosses the corresponding oblique line of the same color (e.g., red point if we consider Melpitz summer), this corresponds to a maximal
contribution of rBC mass concentration in small undetected particles equal to the observed value. If we consider Melpitz summer as an
example (red point) this happens for a BC mass mode of 44 nm. The grey shading indicates that the modal diameter of a hypothetical mode
undetected by the SP2 is expected to be between 40 and 60 nm.
Table 4. Estimates of potentially missed rBC mass for the two methods (1mextrap and 1mfit ), summands contributing to it (1mrBC>UDL
and 1mfitresid ) and modal diameter of the averaged rBC mass size distribution, all separately listed for each campaign. The size range of
80–300 nm rBC mass equivalent diameter was chosen for fitting the measurement. The sensitivity of the results to this choice was negligible,
as discussed in the text.
Mass fractions
1mextrap [%] 1mfit 1mrBC>UDL 1mfitresid DrBC,mode
Campaigns (:= 1mrBCR. E. Pileci et al.: Comparison of co-located rBC and EC mass concentration measurements 1389
(batn,corr ) (Virkkula et al., 2007; Drinovec et al., 2015). The centration outside the size range covered by the SP2 (see
attenuation coefficient is greater than the absorption coeffi- Sect. 2.3.5).
cient due to multi-scattering effects within the filter matrix, Typically, the measured size distributions only approxi-
described with a proportionality constant C. mately followed a lognormal distribution. We chose to infer
From a pair of batn,corr coefficients at two different wave- and present the missed rBC mass estimate based on fitting
lengths, λ1 and λ2 , it is possible to calculate the absorption across the range from 80 to 300 nm. In addition, the sensi-
Ångström exponent, AAE(λ1 , λ2 ), a coefficient commonly tivity to the fitted range was assessed. The estimated missed
used to describe the spectral dependence of the aerosol light rBC mass below the SP2 LDL increased by up to 11 % of
absorption coefficient (Moosmüller et al., 2009): the measured mass when increasing the lower fit limit from
80 to 100 nm, i.e., around the SP2 LDL. This provides ev-
ln(batn,1,corr (λ1 )) ln(λ2 ) idence that the extrapolation towards the smallest BC cores
AAE(λ1 , λ2 ) = − . (10)
ln(batn,1,corr (λ2 )) ln(λ1 ) is not strongly affected by the SP2 counting efficiency per-
formance, which could potentially be degraded in this range.
Note that since the Aethalometer C value has only a small The fit approach used the total area of a lognormal fit to rBC
spectral dependence (Weingartner et al., 2003; Corbin et al., mass size distributions to obtain the correct rBC mass. Sen-
2018), it is possible to infer the AAE directly from the cor- sitivity analyses performed with fitting to a manually pre-
rected attenuation coefficient, as is done in this work. scribed upper limit between 200 and 400 nm showed that the
The AAE provides an indication of the sources of BC (Zot- fit results were insensitive to the choice of this upper limit
ter et al., 2017). The light absorption of particles from traffic for valid fits. Therefore, a fixed fit range from 80 to 300 nm,
emissions is dominated by BC, which has an AAE of ∼ 1. which always provides a good match between the measured
By contrast, wood burning emissions contain a mixture of and fitted size distribution around the mode of the distribu-
BC and co-emitted brown carbon. Light absorption by brown tion, will be used in the remainder of this paper for missing
carbon has a much stronger spectral dependence than BC, mass corrections. The validity of the fits was determined by
such that the mixture has an AAE of between ∼ 1 and 3 comparing the fitted peak location with the mode of the mea-
(Kirchstetter et al., 2004; Corbin et al., 2018). This makes sured data. Data were only fitted to a manually prescribed
relative apportionment of BC to traffic and wood burning upper limit, and the fit results were insensitive to the choice
sources based on the aerosol AAE possible. However, this of this upper limit for valid fits, while larger deviations oc-
simple approach only works in the absence of additional BC curred for invalid fits.
sources or light-absorbing aerosol components (e.g., from Detailed results of the missing mass correction are listed in
coal combustion). Table 4. The extrapolation method and the fit method provide
In this paper the AAE values were calculated with the comparable results. It can be seen that 1mextrap varied in the
formula presented in Eq. (10) with λ1 = 470 nm and λ2 = range of 3 %–25 %, while 1mfit varied between 3 %–21 %.
950 nm. Aethalometer AE31 (Magee Scientific) instruments Considerable variability in missing mass correction between
were used during the Palaiseau and Cabauw campaigns. campaigns occurred due to differences in the rBC mass size
These measurements were corrected for the loading effect distribution, especially differences in the average modal di-
with the algorithm developed by Weingartner et al. (2003). ameters, which are also listed in Table 4. As shown in Eq. (9),
In the other campaigns, Aethalometer AE33 (Magee Scien- the extrapolation and the fit methods for missing mass cor-
tific) instruments were used. These data did not need fur- rection differ by the sum of the fit residual (1mfitresid ) and
ther correction since the algorithm developed by Drinovec the extrapolated mass above the UDL (1mrBC>UDL ). The op-
et al. (2015), which takes into account the filter loading ef- posite signs and comparable magnitudes of these two terms
fect, is incorporated into the instrument. However, the AE33 (Table 4), shown as purple and blue shading in Figs. 1 and S1,
firmware correction was not working properly during the have partially compensating effects, resulting on average in
Bologna campaign. Therefore, these data were corrected us- only a 3 % difference between the two missing mass correc-
ing the Weingartner et al. (2003) correction. tion methods.
The systematic difference between measurement and fit
for rBC mass equivalent diameters near the UDL of the
3 Results and discussion
SP2 (Figs. 1 and S1) could indicate either the presence of
3.1 Mass of rBC potentially missing below the LDL of a second lognormal mode that is centered at a larger diam-
the SP2 eter than the main mode or an inaccurate extrapolation of
the incandescence signal calibration for masses greater than
3.1.1 Comparison of two approaches to correct for the 64 fg (DrBC = 408 nm). As both effects make extrapolation
truncated rBC mass of the rBC mass size distribution above the UDL uncertain,
we decided to apply the extrapolation method in this study.
In the following, we compare the results from the two dif- As explained in Sect. 2.3.5 (Eqs. 1 and 2), the extrapolation
ferent approaches for estimating the missing rBC mass con- method only uses the fit below the LDL of the SP2 to esti-
https://doi.org/10.5194/amt-14-1379-2021 Atmos. Meas. Tech., 14, 1379–1403, 20211390 R. E. Pileci et al.: Comparison of co-located rBC and EC mass concentration measurements
mate missing rBC mass. This ensures a well-defined upper was as large as 52 % of the total measured rBC mass con-
cut-off in terms of rBC core mass for the corrected rBC mass centration. While upticks at the lower end of SP2 size dis-
concentration results. In the following, all reported rBC mass tributions may indicate the presence of an additional mode
concentrations are corrected with the extrapolation method of small rBC particles, it should be noted that these upticks
(Eq. 2) with the fit range chosen from 80 to 300 nm, unless might also represent measurement artifacts. SP2 measure-
otherwise stated. ments of rBC cores with diameters below 100 nm are sen-
The missing mass correction results for the Melpitz winter sitive to small variations in fitted calibration curves, and it is
campaign are significantly different from those for the Mel- difficult to perform accurate calibration measurements near
pitz summer campaign and all other campaigns (Figs. 1, S1 the LDL of the SP2 (Laborde et al., 2012a). Nevertheless,
and Table 4). Specifically, the missed mass percentage for we cannot exclude the presence of an undetected mode with
the Melpitz winter campaign is less than 3 %, while it is be- a small modal diameter between around a 40 and 60 nm BC
tween 18 % and 24.5 % for the other campaigns. This is due core size in our studies. An even smaller mode diameter
to the fact that the Melpitz winter rBC core mass size distri- is considered unlikely because such small particles can be
bution peaks in the middle of the SP2 detection range, with found only in the proximity of a source (Zhu et al., 2006). A
DrBC,mode = 227.9 nm (Fig. 1 and Table 4). This is not the larger mode diameter is unrealistic in our campaigns because
case for the other campaigns, where, as shown in Table 4, the we did not see any sign of the upper tail of such a hypo-
average rBC mass size distributions have their maximum be- thetical mode at the bottom end of the BC size distribution
tween 118.6 and 142.9 nm (Figs. 1 and S1). This could indi- measured by the SP2.
cate that in Melpitz during the winter the BC source was dif- The mass of BC particles below the lower detection limit
ferent from that of the other campaigns of this work. Indeed, of the SP2 (DrBC < ∼ 80 nm) can be estimated by measur-
with a back-trajectory analysis on the same dataset, Yuan et ing the total number concentration of nonvolatile particles
al. (2021) showed that the period between 5 and 14 Febru- by thermo-denuded MPSS measurements, assuming that BC
ary 2017 was characterized by air masses transported from particles dominate the number of nonvolatile (NV) parti-
southeast Europe, where coal is still used as fuel (Spindler cles remaining after thermal treatment (Clarke et al., 2004).
et al., 2013). Coal combustion and biomass burning produce Miyakawa et al. (2016) employed this approach to conclude
rBC size distributions with larger modal diameter than traf- that the fraction of small rBC particles with DrBC less than
fic emissions (Bond et al., 2013; Liu et al., 2014; Schwarz, around 80 nm did not contribute substantially to the total rBC
2019). mass concentrations measured at an industrial site south of
Tokyo, Japan. In the absence of such thermally treated mea-
3.1.2 Limits to rBC mass missed in small BC cores surements, we assume 30 % of total measured particle num-
imposed by the BC particle number ber concentration as an upper limit for total BC particle num-
ber concentration (Wehner et al., 2004; Reddington et al.,
The presence of an additional mode of small particles be- 2013; Cheung et al., 2016). This provides, after subtraction
low the lower detection limit of the SP2 would introduce an of the BC particle number concentration measured by the
error in the above extrapolation calculations. Indeed, a sub- SP2, an upper limit (nlimit ) for the undetected BC particle
stantial fraction of nascent soot particles emitted by combus- number concentration.
tion engines is usually below the detectable size range of the The three quantities of BC particle number concentration,
SP2. Count median diameters (CMDs) of nonvolatile particle rBC mass concentration and rBC mass equivalent diame-
size distributions in aircraft turbine exhaust range from 15 to ter are unambiguously related for a hypothetical perfectly
40 nm (Lobo et al., 2015; Durdina et al., 2017, 2019) while monodisperse mode of BC particles. This relationship is il-
unfiltered gasoline direct injection and diesel engines have lustrated in Fig. 2, which presents BC number concentra-
larger CMD values ranging from 50 to 100 nm (Burtscher et tion versus rBC mass equivalent diameter along with iso-
al., 2001; Momenimovahed and Olfert, 2015). lines of constant rBC mass concentration (dash-dotted lines).
The existence of additional modes of BC cores at diam- For example, the magenta marker indicates that a BC par-
eters below the SP2 lower detection limit has been hypoth- ticle number concentration of 494 cm−3 and rBC core di-
esized based on the observation of “upticks” in rBC mass ameter of 40 nm translates to an rBC mass concentration of
size distributions at the LDL of the SP2 (i.e., increasing par- 0.03 µg m−3 . The horizontal dashed lines in Fig. 2 indicate
ticle concentration with decreasing mass equivalent diameter the estimated upper limit, nlimit , for the BC particle num-
as the SP2 LDL is approached) (Liggio et al., 2012; Cappa ber undetected by the SP2. Taking the Melpitz winter cam-
et al., 2019). Cappa et al. (2019) performed multi-modal fits paign as an example, the dashed blue line is clearly below
to measured SP2 size distributions with upticks assuming a the oblique continuous blue line in the BC core range be-
fixed modal diameter (47 nm) and geometric standard devia- tween 40 and 60 nm. Comparing the rBC mass concentra-
tion (1.63) of the lognormal mode lying below the SP2 LDL. tions corresponding to these two lines at a 40 and 60 nm di-
These authors estimated that the campaign average mass con- ameter shows that the maximal undetected rBC mass concen-
centration of the hypothesized small mode of BC particles tration associated with small BC cores is at most 7 % to 23 %
Atmos. Meas. Tech., 14, 1379–1403, 2021 https://doi.org/10.5194/amt-14-1379-2021R. E. Pileci et al.: Comparison of co-located rBC and EC mass concentration measurements 1391
of the measured rBC mass concentration for modes peak- ble 5 and Fig. S2) reveals a slightly different picture: the vari-
ing within these size limits. For Cabauw, the number limit ability in the rBC-to-EC mass ratio is considerably smaller
and mass concentration lines cross at 55.5 nm (green point). for individual campaigns, with GSDs typically around 1.2–
The intersect implies that an undetected mode peaking at this 1.3, and the systematic bias on the campaign level is substan-
size could at most contribute as much additional rBC mass tially greater than the overall bias, with median ratios ranging
as measured by the SP2. The constraints resulting for unde- from 0.53 to 1.29. During the Melpitz winter campaign, mrBC
tected modes between 40 and 60 nm are an additional 37 % was on average 29 % higher than mEC with mrBC and mEC ge-
and 125 % of observed rBC mass, respectively. For the Mel- ometric means (GSD) of 1.20 (2.64) and 0.97 (2.16) µg m−3 ,
pitz summer campaign, the number limit only provides a very respectively. During the Melpitz summer campaign, mrBC
weak constraint on the missed mass as the intercept occurs was comparable to mEC within 3 %, with respective geomet-
at 43.5 nm (red point). Therefore, the undetected rBC mass ric means (GSD) of 0.17 (1.57) and 0.18 (1.54) µg m−3 . For
could reach up to 263 % of detected rBC mass if the modal the Bologna summer campaign, the median rBC-to-EC mass
diameter was located at 60 nm. ratio was 0.65, with mrBC and mEC geometric means (GSD)
Based on the discussion in Sect. 3.1.1, in this study we ap- of 0.40 (1.46) and 0.64 (1.45) µg m−3 . The largest difference
plied the extrapolation method to correct for estimated rBC was found in Cabauw, with a median rBC-to-EC mass ra-
mass below the SP2 LDL (1mextrap in Table 4). The resulting tio of 0.53 and geometric means (GSD) of mrBC and mEC of
corrections are smaller than the upper limit imposed by the 0.46 (1.62) and 0.86 (1.63) µg m−3 , respectively. During the
BC particle number as discussed here. Hence, it cannot be ex- Palaiseau campaign, mrBC was 20 % higher than mEC ; this
cluded that the truly missed mass was larger than accounted value is somewhat higher than the value of 15 % previously
for. The conservative estimate based on the BC particle num- published in Laborde et al. (2013), which is explained by the
ber considerations suggests that the missing mass could be as fact that here we used the mrBC /mEC median value instead
large as 23 % (applied correction 3 %), 125 % (applied cor- of the result of the linear fit.
rection 22 %) and 263 % (applied correction 25 %) for the
Melpitz winter, Cabauw and Melpitz summer campaigns, re- 3.3 Discussion of level of agreement between the rBC
spectively. and EC mass concentration measurements
3.2 Comparison of observed EC and rBC mass In this section, we test different hypotheses for the observed
concentrations differences between rBC and EC mass.
Here we aim at achieving a quantitative comparison of rBC 3.3.1 Differences in upper cut-off diameters and in
(after correction using Eq. 1) and EC mass concentrations inlet losses
measured by the SP2 and the thermal–optical method, re-
spectively. Figure 3 shows a scatterplot of time-resolved data Differences in the upper cut-off diameters for the EC and
using distinct colors for each campaign (rBC data averaged rBC mass measurements are a potential source of discrep-
according to the sampling periods of the EC samples). Fig- ancy. The EC mass measurements presented in Fig. 3 re-
ure S2 presents the corresponding statistics of the rBC-to-EC late to an upper 50 % cut-off at an aerodynamic particle di-
mass ratio, and Table 5 reports all statistical parameters. The ameter Daero = 2.5 µm at ambient RH (Table 2), except for
median values of the rBC-to-EC mass ratio lie between the Cabauw, where a PM10 inlet was used. The SP2 measure-
arithmetic and geometric means, indicating distributions that ments were mostly taken behind PM10 inlets. However, the
are between the normal and lognormal distribution (Fig. S2). SP2 has a more stringent intrinsic UDL, which varied from
For this reason, we adopted the median when reporting the DUDL = 439 to DUDL = 766 nm BC core mass equivalent di-
ratio of the two quantities and in the figures (lines in Figs. 3 ameter, depending on the campaign (Table 3). To explore the
and 6) and the geometric standard deviation (GSD) to re- possibility that BC particles with diameters between the UDL
port the mrBC /mEC variability (Table 5). Considering all data of the SP2 and 2.5 µm aerodynamic diameter contributed to
points from all campaigns, the median value of mrBC /mEC the discrepancies between mrBC and mEC , the SP2-related
was 0.92 with a GSD of 1.5. That is, mrBC was on average mass equivalent diameters (Dve ) were converted to aerody-
8 % smaller than mEC , and 68 % of the individual data points namic diameters (Daero ). This was carried out by numerically
fell into the range within a factor of 1.5 around the geometric solving Eq. (11), where CC is the Cunningham slip correction
mean ratio. Accordingly, the overall statistics for these two factor, ρp is the particle density, ρ0 = 1000 kg m−3 and χ is
quantities agree closely, with geometric mean values (GSD) the particle dynamic shape factor (more details in Sects. S3
of 0.41 (2.60) and 0.47 (2.46) µg m−3 for mrBC and mEC , re- and S4 of the Supplement):
spectively, both ranging from 0.05 to 3.22 µg m−3 (Fig. 3).
The above result suggests a very small overall systematic s
bias between rBC and EC mass on average. However, a look ρo χ CC (Daero )
Dve = Daero . (11)
at the statistics calculated for each campaign separately (Ta- ρp CC (Dve )
https://doi.org/10.5194/amt-14-1379-2021 Atmos. Meas. Tech., 14, 1379–1403, 2021You can also read