Rapid transformation of ambient absorbing aerosols from West African biomass burning - Recent
←
→
Page content transcription
If your browser does not render page correctly, please read the page content below
Atmos. Chem. Phys., 21, 9417–9440, 2021
https://doi.org/10.5194/acp-21-9417-2021
© Author(s) 2021. This work is distributed under
the Creative Commons Attribution 4.0 License.

Rapid transformation of ambient absorbing aerosols
from West African biomass burning
Huihui Wu1 , Jonathan W. Taylor1 , Justin M. Langridge2 , Chenjie Yu1 , James D. Allan1,3 , Kate Szpek2 ,
Michael I. Cotterell4,a , Paul I. Williams1,3 , Michael Flynn1 , Patrick Barker1 , Cathryn Fox2 , Grant Allen1 ,
James Lee5,6 , and Hugh Coe1
1 Department  of Earth and Environmental Sciences, University of Manchester, Manchester, UK
2 Met Office, Fitzroy Road, Exeter, EX1 3PB, UK
3 National Centre for Atmospheric Science, University of Manchester, Manchester, UK
4 College of Engineering, Mathematics and Physical Sciences, University of Exeter, Exeter, UK
5 Wolfson Atmospheric Chemistry Laboratories, Department of Chemistry, University of York, York YO10 5DD, UK
6 National Centre for Atmospheric Sciences, University of York, York YO10 5DD, UK
a now at: School of Chemistry, University of Bristol, Bristol, UK

Correspondence: Hugh Coe (hugh.coe@manchester.ac.uk)

Received: 18 January 2021 – Discussion started: 2 February 2021
Revised: 4 May 2021 – Accepted: 13 May 2021 – Published: 21 June 2021

Abstract. Seasonal biomass burning (BB) over West Africa         genated and low-volatility OA, likely from the oxidation of
is a globally significant source of carbonaceous particles       evaporated primary OA and secondary OA formation. We
in the atmosphere, which have important climate impacts          found that the evolution of BrC with particle age was dif-
but are poorly constrained. Here, the evolution of smoke         ferent in this region compared with previous BB field stud-
aerosols emitted from flaming-controlled burning of agri-        ies that mainly focused on emissions from smouldering fires,
cultural waste and wooded savannah in the Senegal region         which have shown a high contribution from BrC at the source
was characterized over a timescale of half-day advection         and BrC net loss upon ageing. This study suggests an initial
from the source during the MOYA-2017 (Methane Obser-             stage of BrC absorption enhancement during the evolution
vation Yearly Assessment-2017) aircraft campaign. Plumes         of BB smoke. Secondary processing is the dominant con-
from such fire types are rich in black carbon (BC) emissions.    tributor to BrC production in this BB region, in contrast to
Concurrent measurements of chemical composition, organic         the primary emission of BrC previously reported in other BB
aerosol (OA) oxidation state, bulk aerosol size and BC mix-      studies. The total aerosol absorption normalized to BC mass
ing state reveal that emitted BB submicron aerosols changed      (MACmeas-BC ) was also enhanced with ageing due to the
dramatically with time. Various aerosol optical properties       lensing effect of increasingly thick coatings on BC and the
(e.g. absorption Ångström exponent – AAE – and mass ab-          absorption by BrC. The effect of ageing on aerosol absorp-
sorption coefficients – MACs) also evolved with ageing. In       tion, represented by the absorption enhancement (EAbs-MAC ),
this study, brown carbon (BrC) was a minor fractional com-       was estimated over timescales of hours. MOYA-2017 pro-
ponent of the freshly emitted BB aerosols (< 0.5 h), but the     vides novel field results. The comparisons between MOYA-
increasing AAE with particle age indicates that BrC forma-       2017 and previous field studies imply that the evolution of
tion dominated over any loss process over the first ∼ 12 h       absorbing aerosols (BC and BrC) after emission varies with
of plume transport. Using different methods, the fractional      source combustion conditions. Different treatments of ab-
contribution of BrC to total aerosol absorption showed an        sorbing aerosol properties from different types of fires and
increasing trend with time and was ∼ 18 %–31 % at the opti-      their downwind evolution should be considered when mod-
cal wavelength of 405 nm after half-day transport. The gen-      elling regional radiative forcing. These observational results
erated BrC was found to be positively correlated with oxy-       will be very important for predicting climate effects of BB

Published by Copernicus Publications on behalf of the European Geosciences Union.
9418                                                       H. Wu et al.: Rapid transformation of ambient absorbing aerosols

aerosol in regions controlled by flaming burning of agricul-       necessitating consideration of both BC and BrC absorption
tural waste and savannah-like biomass fuels.                       in the West Africa region.
                                                                      Previous studies have characterized freshly emitted BB
                                                                   aerosols to some extent. The initial relative mass contribu-
                                                                   tion of OA and BC varies widely with fuel type and com-
                                                                   bustion conditions, as does the corresponding initial aerosol
1   Introduction                                                   size distribution (Vakkari et al., 2014). The initial optical
                                                                   properties (i.e. single-scattering albedo – SSA, absorption
Biomass burning (BB) of agricultural waste and savannah            Ångström exponent – AAE – and mass absorption coefficient
in the sub-Sahelian regions of West Africa during the dry          – MAC – of BC and BrC) and BC mixing states of freshly
season (November to February) is a strong contributor to           emitted BB aerosols depend strongly on OA/BC mass ra-
the global aerosol burden every year (Roberts et al., 2009;        tios and combustion efficiency (S. Liu et al., 2014; Saleh
Andreae, 2019). Emitted BB plumes over West Africa gen-            et al., 2014; Pokhrel et al., 2016, 2017; McClure et al., 2020)
erally move south-west across the continent and are then           and are therefore also highly variable. The properties of BB
transported over the North Atlantic Ocean. Sometimes, weak         aerosols have been shown to evolve over time post-emission.
southerly advection over the land surface can drive air to         Understanding this ageing process is vital to evaluating their
move northward, and the warm BB plumes tend to be lifted           atmospheric impacts. The chemical and size evolution of
over the cooler and drier Saharan air. Under this latter sce-      BB aerosols has been studied comprehensively in field and
nario, the upper-level circulation plays a role in transport-      laboratory measurements under various BB conditions (e.g.
ing these lifted plumes southward toward the Atlantic Ocean        Capes et al., 2008; Yokelson et al., 2009; Cubison et al.,
(Haywood et al., 2008). These BB aerosols have an important        2011; Pratt et al., 2011; Akagi et al., 2012; Ortega et al.,
impact on the regional climate by scattering and absorbing         2013; Vakkari et al., 2018; Kleinman et al., 2020). How-
solar radiation, and they also interact with clouds. The over-     ever, studies of optical evolution are limited, especially in
all climate effects of these BB aerosols are a combination of      field observations. Existing measurements show that the ab-
interacting warming and cooling effects, depending on the          sorbing properties of BC are modified after emission due to
aerosol vertical distribution and their relative locations with    the internal mixing of BC with other species such as inor-
respect to clouds, as well as their chemical, physical and opti-   ganics and OA (Bond et al., 2013). The MAC of coated BC
cal properties and evolution with transport time (e.g. Boucher     may be enhanced by a lensing effect induced by the coat-
et al., 2013).                                                     ings and/or the absorption from internally mixed BrC (Lack
   Field measurements of African BB indicate that BB               et al., 2012a, b; Healy et al., 2015). The absorbing proper-
aerosols are dominated by carbonaceous particles including         ties of BrC are also modified with ageing, closely related
those comprised of black carbon (BC) and organic aerosol           to secondary BrC formation from photochemical processing
(OA) components, with lesser contributions from inorganic          of co-emitted gaseous compounds (Saleh et al., 2013; Palm
species (Capes et al., 2008, Vakkari et al., 2014). BC is          et al., 2020) and loss by photobleaching (Lee et al., 2014;
thought to be the main absorbing aerosol in BB smoke, di-          Zhao et al., 2015). The normalized excess aerosol scattering
rectly absorbing radiation across the solar spectrum (Bond         with respect to a BB tracer (carbon monoxide, CO) is shown
et al., 2013). Particles composed of only OA predomi-              to increase during atmospheric ageing due to aerosol growth
nantly have a cooling effect by efficiently scattering radia-      caused by condensation and coagulation, resulting in an in-
tion in the solar spectrum. However, certain types of OA,          creasing SSA downwind from the source (Abel et al., 2003;
known as “brown carbon” (BrC), also absorb solar radia-            Yokelson et al., 2009; Akagi et al., 2012; Vakkari et al., 2014;
tion in the near-ultraviolet (near-UV, 300–400 nm) and visi-       Kleinman et al., 2020). The accurate characterization and ap-
ble (400–700 nm) ranges, although this absorption is strongly      plication of these optical properties and their evolution with
wavelength-dependent compared to the absorption spectrum           time under ambient conditions are key issues in modelling
for BC (Bond and Bergstrom, 2006; Ramanathan et al., 2007;         the climate effects of BB aerosols.
Laskin et al., 2015). Moreover, OA can contribute to en-              Laboratory experiments have been used to simulate the
hanced aerosol absorption when OA is internally mixed with         photochemical ageing of solution-extracted particles or
BC through the so-called “lensing effect” (Liu et al., 2017).      smoke (particles plus gases) generated from burning vari-
The inclusion of BrC in global climate simulations is not          ous biomass fuel types under different combustion condi-
common; one study has suggested an average global direct           tions. These experiments have indicated that the evolution
radiative forcing (DRF) of BrC of +0.13 W m−2 (Brown               of BC mixing state and optical properties (e.g. SSA, AAE
et al., 2018), which is ∼ 20 % of the global DRF of BC             and MAC) for BB aerosols vary with initial emission condi-
(+0.71 W m−2 ) estimated by Bond et al. (2013), though both        tions (Zhong and Jang, 2014; Wong et al., 2017, 2019; Ku-
estimates are associated with considerable uncertainty. Re-        mar et al., 2018; Cappa et al., 2020). These results provide
gional effects of BrC over major areas of BB such as subtrop-      insight into the behaviour of BB aerosols in the ambient at-
ical Africa may be substantially larger (Feng et al., 2013),       mosphere; region-specific characterizations of the evolution

Atmos. Chem. Phys., 21, 9417–9440, 2021                                              https://doi.org/10.5194/acp-21-9417-2021
H. Wu et al.: Rapid transformation of ambient absorbing aerosols                                                            9419

of aerosol optical properties are crucial for improving de-       also investigated the relationship between chemical compo-
scriptions in atmospheric models, owing to the diversity in       sition and BrC optical properties.
the ageing process of BB aerosols between wildfire sources.
Current field observations demonstrating this evolution are
sparse, particularly the effects of ageing on the light absorp-   2     Experimental design
tion properties of BrC and BC. Some field studies have re-
ported enhanced absorption of internally mixed BC in aged         The research flights during MOYA-2017 (Methane Observa-
BB smoke far from the source (e.g. Lack et al., 2012a), but       tion Yearly Assessment-2017) were made by the UK Facility
the evolution trends of BC mixing state and optics are quan-      for Airborne Atmospheric Measurements (FAAM) using the
tified poorly. Forrister et al. (2015) tracked wildfire plumes    BAe-146 Atmospheric Research Aircraft (ARA). A total of
over North America and reported decreasing AAE and the            six flights (designated flight labels from C003 to C008) took
loss of BrC over ∼ 2 d of atmospheric transport. Wang et al.      place between 27 February and 3 March 2017, with the pre-
(2016) observed a decreasing MAC for BrC with a lifetime of       cise timings and objectives of these flights provided in Ta-
∼ 1 d during the Amazonian BB season near Manaus, Brazil.         ble S1 in the Supplement. The aircraft was equipped with a
These field measurements covered only a limited range of          range of in situ instruments to measure aerosol composition,
combustion fuels and conditions. Additional field observa-        size distribution and optical properties, as well as trace gas
tions of the evolution of BB absorptivity are necessary to        concentrations and standard meteorological variables. A fur-
extend laboratory mechanisms, to understand ambient atmo-         ther description of the MOYA-2017 campaign is reported by
spheric processes and to provide observational constraints for    Barker et al. (2020). Tracks of the flights (with flight numbers
atmospheric models.                                               labelled from C005 to C007) used in this study are shown
    Although West Africa is one of the most important BB re-      in Fig. 1a. These selected flights focused on freshly emitted
gions on a global scale, field observations of BB aerosols        plumes from wildfires over the Senegal area, in addition to
in this region are limited. The Dust and Biomass Experi-          aged smoke transported south-west over the continent and
ment (DABEX) in January to February 2006 took place in            the Atlantic Ocean. Nearby background air out of the plume
West Africa and investigated the chemical composition, size       was also sampled. Detailed information about the selected
distribution and optics of BB aerosols at different plume         smoke plumes is provided in Sect. 3.1. The main instruments
stages (close to the source, elevated BB layer and trans-         used in this study are described below.
ported BB layer) (Capes et al., 2008; Johnson et al., 2008).
During the DABEX campaign, aerosol absorption and scat-           2.1    Airborne measurements
tering were measured using a filter-based technique (parti-
cle soot absorption photometer) and a nephelometer, respec-       Refractory black carbon (BC) concentrations and physical
tively. Limitations with filter-based measurements of aerosol     properties were measured using a single-particle soot pho-
light absorption were reported in previous studies (Lack          tometer (SP2), the operation of which on the ARA has been
et al., 2008; Davies et al., 2019), and aerosol absorption was    described by McMeeking et al. (2010). The SP2 detects BC-
characterized at only a single wavelength of 567 nm during        containing particles with an equivalent spherical diameter in
DABEX. BC concentrations were estimated using an indirect         the range of 70–850 nm (D. Liu et al., 2014). Briefly, an
method by multiplying the measured absorption (at a single        intra-cavity Nd:YAG laser beam at λ = 1064 nm is used for
wavelength) with an assumed mass absorption coefficient of        particle detection on a single-particle basis. The laser beam
12 m2 g−1 for soot. The properties of BB aerosols, especially     heats particles containing BC to their incandescence temper-
the optical properties and BC microphysical properties, were      ature, and visible light is emitted. The SP2 incandescence
characterized with high uncertainties during DABEX owing          signal is used to derive the mass of refractory BC present in
to the lack of advanced measurement systems that have only        the particle, and the mass can be converted to a spherical-
become available in the last decade. To provide accurate BB       equivalent BC core diameter (DC ) with an assumed BC den-
aerosol parameterizations for modelling regional radiation        sity of 1.8 g cm−3 (Bond et al., 2013). Aquadag BC particle
interactions over the important West Africa region, we re-        standards were used to calibrate the SP2 incandescence sig-
port new field measurements acquired during the MOYA-             nal during the campaign following the calibration procedures
2017 (Methane Observation Yearly Assessment-2017) air-            in Laborde et al. (2012). The SP2 can also provide informa-
craft campaign, benefitting from significant advances in mea-     tion on the coating properties for BC-containing particles by
surement techniques. Here, we present the evolution of BB         determining the λ = 1064 nm light-scattering cross section of
aerosols over the first ∼ 12 h post-emission, including a de-     particles. The scattering signal of a BC-containing particle
tailed characterization of chemical, microphysical and opti-      will be distorted during its transit through the laser beam
cal properties. In addition, we combined measurements with        caused by the mass loss of a BC-containing particle from
optical modelling to investigate the effects of ageing on the     laser heating. The methodology of leading-edge-only (LEO)
light absorption properties of BrC and BC in this region. We      fitting was used to reconstruct the scattering signal of a BC-
                                                                  containing particle, as described in detail in previous studies

https://doi.org/10.5194/acp-21-9417-2021                                           Atmos. Chem. Phys., 21, 9417–9440, 2021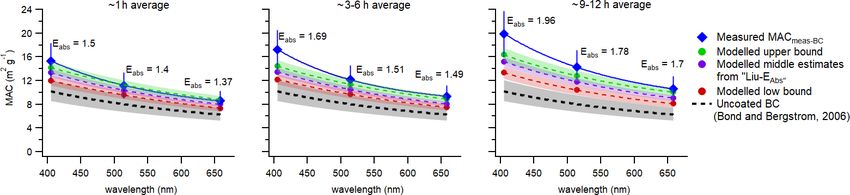
9420                                                          H. Wu et al.: Rapid transformation of ambient absorbing aerosols

Figure 1. (a) Tracks of the flights (labelled from C005 to C007) used in this study. (b) The selected fresh and near-source plumes, with the
spatial distribution of MODIS-detected fires during flight C005. (c, d) 1 d back trajectory of sampled smoke selected from flights C006 (c)
and C007 (d), marked (black crosses) with every 3 h increment. The MODIS-detected fires are also shown in the plots (as observed 3–12 h
before the sampling period).

(Gao et al., 2007; D. Liu et al., 2014; Taylor et al., 2015).           plied to the data based on the algorithm by Middlebrook
The scattering channel was calibrated using polystyrene la-             et al. (2012). The 2σ uncertainties in AMS-measured mass
tex spheres with sizes of 200 and 300 nm. A Mie core–shell              concentrations during aircraft operation were estimated as
model was then used to infer the coated particle diameter               30 % by Bahreini et al. (2009). The AMS data for flight C006
(DP ) and hence the shell/core ratios (DP /DC ), which de-              are not available as the vacuum pump overheated during this
pends on the assumed refractive index of the BC core and                flight. In this study, the OA fragment markers (m/z 43, 44,
coating (Taylor et al., 2015). This model and the required              57 and 60) and proportional contributions of OA fragment
assumptions for refractive indices are further discussed in             markers to the total OA mass (f 43, f 44, f 57 and f 60) were
Sect. 2.3. The SP2 single-particle data were also examined              calculated. The oxygen-to-carbon (O : C) ratio and the ratio
for coincidence at high concentrations following the proce-             of organic mass to organic carbon (OM/OC) were estimated
dures described in Taylor et al. (2020).                                following the methods developed by Aiken et al. (2008). OM
   A compact time-of-flight aerosol mass spectrometer (C-               is the total mass of the OA and OC is the mass of carbon
ToF-AMS) was used to measure the mass concentrations of                 associated with the OA.
non-refractory aerosols, including OA, sulfate, nitrate, am-               The dry (< 10 % RH) aerosol absorption coefficients
monium and a fraction of chloride (Drewnick et al., 2005).              (BAbs , Mm−1 ) were measured using a custom-built suite
The AMS collects submicron particles in the aerodynamic di-             of multi-wavelength photo-acoustic spectrometers (PAS, at
ameter range of ∼ 50–800 nm via an aerodynamic lens. The                wavelengths λ = 405, 514, 658 nm), providing direct and
instrument setup and calibration procedure for the ARA have             non-contact measurements of aerosol absorption. The setup
been described by Morgan et al. (2009). The AMS was cal-                and calibration of these instruments are described in detail by
ibrated using mobility-size-selected ammonium nitrate and               Davies et al. (2018, 2019) and Cotterell et al. (2021). An im-
ammonium sulfate particles. The AMS data were processed                 pactor upstream of the PAS removed particles with aerody-
using the standard SQUIRREL (SeQUential Igor data Re-                   namic diameters > 1.3 µm. The accuracy of the PAS calibra-
tRiEvaL, v.1.60N) ToF-AMS software package. A time- and                 tion was better than 8 % (Davies et al., 2018). The absorption
composition-dependent collection efficiency (CE) was ap-

Atmos. Chem. Phys., 21, 9417–9440, 2021                                                    https://doi.org/10.5194/acp-21-9417-2021
H. Wu et al.: Rapid transformation of ambient absorbing aerosols                                                              9421

Ångström exponent was determined by the equation:                 tinely detects both flaming and smouldering fires with a min-
                                                                  imum size of 1000 m2 . Under very good observation condi-
           ln (BAbs (λ2)) − ln (BAbs (λ1))                        tions (e.g. with the satellite in a near-nadir viewing geometry
AAE = −                                    ,               (1)
                  ln(λ2) − ln(λ1)                                 with respect to the fire and a relatively homogeneous land
in which λ is the wavelength. The uncertainty in the deter-       surface), 1/10 of this size can be detected for flaming fires.
mined AAE is expected to be < 5 % (Taylor et al., 2020).          Most of the fires in this region could be detected by MODIS
   The aerosol number size distribution was measured using        (Giglio et al., 2016). Air mass transport times, in hours since
an on-board scanning mobility particle sizer (SMPS). The          emission, were estimated from the point of aircraft measure-
SMPS sampled aerosols from the same inlet as the AMS              ments to the possible fire sources.
and measured distributions of particle mobility diameter in
the range of 20–350 nm. A low-pressure water-based con-           2.3   Optical modelling
densation particle counter (WCPC model 3786-LP) was con-
nected to a TSI 3081 differential mobility analyser (DMA).        In this study, we simulated the MAC and AAE of coated BC
The SMPS data were inverted using the inversion algorithms        with non-absorbing coatings using a variety of optical mod-
developed by Zhou (2001). The inversion programme in-             els. Firstly, we determined the size and mixing state of BC-
verts mobility concentrations to an aerosol size distribution     containing particles from the single-particle measurements
(dN/d log Dp vs. Dp ). The analysed SMPS data were based          of BC core mass (MBC ) and scattering cross section from
on a ∼ 1 min averaging time only during straight and level        the SP2. This process is based on previous works of Tay-
runs when AMS and SP2 concentrations generally varied less        lor et al. (2015) and Liu et al. (2017). Taylor et al. (2015)
than 30 %. The uncertainty of the SMPS scans is ∼ 33 %. CO        described the steps to calculate the single-particle spherical-
was measured using an AeroLaser AL5002 vacuum-UV fast             equivalent DC and DP with the SP2 measurements and a
fluorescence instrument, with an accuracy of ± 3 % and pre-       scattering model using core–shell Mie theory. An empirical
cision of 1 ppb (Gerbig et al., 1999). Carbon dioxide (CO2 )      correction recommended by Liu et al. (2017) was added to
and methane (CH4 ) were measured using a fast greenhouse          the data processing steps described in Taylor et al. (2015).
gas analyser (FGGA) (O’Shea et al., 2013) and were cal-           We converted the calculated single-particle DP /DC ratio to
ibrated using gas standards traceable to the WMO-X2007            the mass ratio of non-BC to BC (MR) and generated a 2-
scale (Barker et al., 2020).                                      D distribution of MR vs. MBC . Further details concerning
   All measurements reported for aerosols and gases were          the processing of SP2 data are provided in Sect. S2.1 in the
corrected to standard temperature and pressure (STP,              Supplement. For SP2 measurements, not all detected parti-
273.15 K and 1013.25 hPa). The SP2, PAS, CO and FGGA              cles have a successful LEO fitting to measure the scattering
data were recorded at a 1 Hz sampling frequency, while the        cross section of BC-containing particles at 1064 nm, as most
AMS sampling frequency was either 8 or 15 s. Related cal-         particles in the small size range do not scatter enough light
culation methods are listed in detail in Sects. 3 and S2 in the   to be detected and the detected signal of particles at large
Supplement.                                                       sizes is noisy due to a limited number concentration (D. Liu
                                                                  et al., 2014; Taylor et al., 2015). Due to this limited efficiency
2.2   Back-trajectory calculations                                in the detection range for the scattering channel, the MR vs.
                                                                  MBC distribution was corrected for the size-dependent detec-
We used the UK Met Office’s Numerical Atmospheric Mod-            tion efficiency of the SP2 instrument following the methods
elling Environment (NAME) (Jones et al., 2007) to track           described by Taylor et al. (2015, 2020).
the history of sampled air masses over the Atlantic Ocean.           The above SP2 analysis required assumptions of the densi-
The inert particles were released along the aircraft track        ties and refractive index of both the BC core and the coating.
every 30 s, and their 1 d back trajectories were modelled         A BC density of 1.8 g cm−3 and a BC refractive index (mBC )
using three-dimensional gridded meteorological fields de-         of 2.26–1.26i were used in this study, since these values have
rived from the UK Met Office’s global numerical weather           been previously shown to provide good agreement with mea-
prediction model, the Unified Model (Brown et al., 2012).         surements for externally mixed BC particles for scattering at
These fields are updated every 3 h and have a high resolu-        1064 nm using the Mie core–shell model (e.g. Moteki et al.,
tion of 0.23◦ longitude by 0.16◦ latitude. The meteorologi-       2010; Taylor et al., 2015). The coating density was assumed
cal fields have 59 vertical levels up to an approximate height    to be the same as bulk non-BC components and was calcu-
of 29 km. The NAME model was chosen for this study be-            lated from the AMS-measured components following vol-
cause it uses high-resolution meteorological data of approxi-     ume mixing rules. The densities of 1.27 g cm−3 for OA and
mately 17 km × 17 km, and it can predict dispersion over dis-     1.77 g cm−3 for inorganic components were applied (Cross
tances ranging from a few kilometres to the whole globe. The      et al., 2007). In our optical modelling, we assumed a non-
fire sources were identified based on the Collection 6 Terra      absorbing coating, which does not contribute directly to ab-
and Aqua Moderate Resolution Imaging Spectroradiometer            sorption. The refractive index of the coating was assumed to
(MODIS) fire products (Giglio et al., 2018). MODIS rou-           be 1.50i, as used in previous works (e.g. Taylor et al., 2015;

https://doi.org/10.5194/acp-21-9417-2021                                           Atmos. Chem. Phys., 21, 9417–9440, 2021
9422 H. Wu et al.: Rapid transformation of ambient absorbing aerosols
Liu et al., 2017; Wu et al., 2018). The optical models there- 3 Results
fore do not account for direct absorption by non-BC species
such as BrC. 3.1 Sampled fire plumes
Applying the generated 2-D distribution of MR vs. MBC
as inputs, different optical models were used to simulate en- On 1 March 2017, the ARA (flight C005) flew over a selected
semble mean absorbing properties. We employed the core– MODIS-detected fire repeatedly (Fig. 1b) and sampled fresh
shell Mie model and also several parameterizations based on plumes at different heights (∼ 400–1500 m) during the plume
empirical fits to the bulk MAC or absorption enhancement rise stage. The fresh plumes were sampled by positioning the
(EAbs ) for BC particles of different mixing states (Liu et al., ARA directly over the active fires. We analysed the dens-
2017; Chakrabarty and Heinson, 2018; Wu et al., 2018). est plume transects, which are denoted as source emissions,
Briefly, Liu et al. (2017) conducted ambient measurements and the fresh plumes were assumed to be less than 0.5 h old.
of EAbs for BC-containing particles from different combus- The emitted plumes were transported by north-easterly pre-
tion sources and also a laboratory chamber study of fresh vailing winds. Vertical profiles of measured horizontal winds
and aged diesel soot. They made an empirical correction of are shown in Fig. S1 in the Supplement. The aircraft also
EAbs to the core–shell Mie models based on laboratory and sampled air immediately downwind from the fires, making
atmospheric observations. Wu et al. (2018) also introduced plume transects (Fig. 1b). The downwind plumes had under-
an empirical correction of EAbs to core–shell Mie models gone further ∼ 1 h transport and are denoted as near-source.
based on both ambient measurements and aggregate model The plume age was estimated by the distance from the fires
results which were constrained by BC micromorphology. and the average wind speed measured by the aircraft. Later
Chakrabarty and Heinson (2018) integrated modelled results the same day, flight C006 sampled transported smoke as it
and observational findings to establish scaling relationships moved west over the Atlantic Ocean (Fig. 1c). On the fol-
for EAbs and MACBC as a function of BC mass and coating lowing day (2 March 2017), flight C007 sampled transported
thickness. These latter empirical models were chosen based smoke over the Atlantic Ocean again (Fig. 1d). We selected
on a previous study using the same optical simulations (Tay- smoke plumes that were sampled over the Atlantic Ocean,
lor et al., 2020), as they produced MAC and AAE values of and NAME back trajectories showed that these plumes in
aged BB aerosols in relatively good agreement with mea- flights C006 and C007 were mainly transported from a sim-
surements. We provide details on these optical models and ilar fire region as that associated with sampling in flight
parameterizations in Sect. S2.2 in the Supplement. For each C005. The back trajectories and MODIS-detected fire indi-
model, we generated 2-D tables of absorption cross section cate that the transport times of selected smoke plumes over
or EAbs following their optical schemes, corresponding to the the ocean were ∼ 3–6 h in C006 (Fig. 1c) and ∼ 9–12 h in
same grid of the 2-D distribution of MR vs. MBC generated C007 (Fig. 1d).
from the measurement data. The modelled MACs (at 405, Key information regarding the sampled smoke plumes is
514 and 658 nm) were determined by the ratio of the inte- provided in Table 1. Modified combustion efficiency (MCE)
grated absorption cross section to the total BC mass or by is widely used to indicate the combustion condition of a fire.
multiplying the modelled EAbs by the MAC value for un- An MCE > 0.9 is commonly used to indicate BB smoke
coated BC recommended by Bond and Bergstrom (2006). predominantly influenced by combustion during the flaming
The modelled EAbs was determined as the ratio of the simu- phase, whereas MCE < 0.9 indicates that the BB smoke is
lated bulk absorption cross section for coated BC to that for primarily emitted from smouldering-phase combustion (Reid
uncoated BC. Predictions of EAbs are output from the core– et al., 2005). Detailed calculation methods for MCE are listed
shell Mie model, in addition to constituting the sole output in Sect. S1.1 in the Supplement. In this study, the calculated
from the empirical optical parameterizations. The AAE be- MCEs (Table 1) of selected smoke plumes at different trans-
tween two wavelengths was determined by Eq. (1) using the port ages were in a small range of 0.94 to 0.96, suggest-
modelled MAC instead of BAbs . Taylor et al. (2020) assessed ing that all selected smoke plumes during MOYA-2017 were
the uncertainties in calculated values for MAC and AAE consistently dominated by flaming-phase combustion emis-
from these different optical models using a Monte Carlo anal- sions. Although the selected smoke plumes are unlikely to be
ysis, which considered the uncertainties from different input emitted from the same fire at the same emission time, back
variables (BC mass, MR and non-refractory material concen- trajectories suggest that they originated from similar fire ar-
trations). The derived uncertainties from Taylor et al. (2020) eas that likely have the same fuel type. The fire areas are
were considered in this study. mainly a mixture of agricultural stubble (mostly millet crop)
and wooded savannah (deciduous forest matter and savannah
grasses) (Roberts et al., 2009; Fare et al., 2017; Barker et al.,
2020). Both the similar fuel and MCE indicate that the se-
lected smoke plumes are likely to be comparable in terms of
the initial aerosol properties at the source. Table 1 shows that
the sampled smoke plumes were warm and dry. The sam-
Atmos. Chem. Phys., 21, 9417–9440, 2021 https://doi.org/10.5194/acp-21-9417-2021H. Wu et al.: Rapid transformation of ambient absorbing aerosols 9423
Table 1. The fundamental information and modified combustion efficiency (MCE) of sampled smoke plumes.
Sample age < 0.5 h ∼1 h ∼ 3–6 h ∼ 9–12 h
Flight number C005 C005 C006 C007
Date 1 Mar 2017 1 Mar 2017 1 Mar 2017 2 Mar 2017
Time range 12:37:36 to 13:27:30 UTC 13:09:34 to 13:37:10 UTC 17:47:00 to 17:55:00 UTC 15:57:12 to 16:07:32 UTC
Aircraft altitude (m a.g.l.) 380–1486 745–1980 1642–1728 1482–1780
Ambient temperature (◦ C) 29.3 ± 3 24.5 ± 3 23.1 ± 0.3 22.5 ± 0.5
Ambient relative humidity (%) 16 ± 2 18 ± 2 19 ± 1 25 ± 3
Estimated source burn area ≤ 1 km2 ≤ 1 km2 ≤ 1 km2 ≤ 1 km2
Estimated source burn time (UTC) 11:25 to 13:17 11:25 to 13:17 11:51 to 13:17 03:09 to 07:32
MCE 0.94–0.96 0.94 ± 0.01 0.94 ± 0.01 0.94 ± 0.08
pled smoke over the Atlantic Ocean was above the marine and BC are consistently the two largest contributors to total
boundary layer, mitigating interference between BB aerosols aerosol mass, making up over 85 % of the submicron mass
and the marine environment during plume transport. Further- loading. A large fraction of non-refractory chloride was ob-
more, there was no precipitation during the selected flights, served in fresh BB aerosols in our sampling area, which is
and thus wet removal of aerosols during the plume transport possibly due to the usage of organochlorine pesticides in
is expected to be negligible. Overall, these selected smoke Senegal (Diop et al., 2019).
plumes had a discrete range in plume age from about < 0.5 to Fire emission information for a species can be represented
∼ 12 h, which provided an opportunity to study the evolution in two forms: enhancement ratio (ER) and emission factor
of BB aerosol properties during the first ∼ 12 h of transport. (EF). In this study, the ERs of BC and OA with respect to
For the near-source (C005) and transported smoke with an CO (1BC/1CO and 1OA/1CO) were calculated for sam-
age of ∼ 3–6 h (C006), the smoke had undergone only day- pled fresh plumes (< 0.5 h), by dividing the excess BC or
time (photochemical) ageing after emission. For the trans- OA by the excess concentration of CO. The background con-
ported smoke with an age of ∼ 9–12 h (C007), the smoke centrations of different species for freshly emitted plumes
had undergone ∼ 0–2 h of night-time ageing, followed by were determined immediately before entering and after ex-
further daytime ageing. In the following sections, we analyse iting the plume. The EF of a species is defined as the mass
the chemical properties, size distributions, BC core sizes and of the species emitted (in grams) per kilogram of dry mat-
mixing states, and light absorption properties of submicron ter burnt (Andreae and Merlet, 2001). Details of the calcu-
BB aerosols in these selected smoke plumes with different lation methods for ER and EF in fresh plumes are provided
ages. in Sect. S1.1. Although we sampled the fresh plumes over
the same fires repeatedly in 1 h and the MCEs of source fires
3.2 Initial aerosol composition and chemical evolution were similar (0.94–0.96), the 1BC/1CO and 1OA/1CO
ratios (µg cm−3 /µg cm−3 ) in the fresh plumes varied over
In this section, we study the chemical properties of submi- the ranges of 0.012–0.021 and 0.045–0.101, with averages of
cron BB aerosols in the fresh plumes and their evolution 0.016 and 0.071, respectively. The EFs of BC (EFBC ) were
with transport time. The submicron aerosol mass concen- also variable, with values recorded over the range of 0.25–
tration and chemical composition fractions were calculated 0.49 g kg−1 and with an average value of 0.37 ± 0.07 g kg−1 ,
from the measured mass concentrations of species from the which is within the range of 0.26–0.61 g kg−1 reported by
AMS and SP2. For composition calculations, the 1 Hz SP2 previous studies for African savannah (Andreae, 2019). The
data were averaged to the AMS sampling rates. We also in- variations in emission factors indicate that there were tempo-
vestigate the fire emission conditions of OA and BC as well ral fluctuations in the source aerosol emission strength over
as post-emission OA chemistry. Time series of the concen- the same fires in this region.
trations of different chemical components, coupled with CO We converted OA mass into OC mass using the OM/OC
and CO2 mixing ratios in each flight, are shown in Fig. 2. ratios estimated from the AMS measurements. In sampled
3.2.1 Fresh biomass burning chemical properties fresh plumes, the linear Pearson’s correlation coefficients
between OA and BC (ρOA-BC ) and between OC and BC
In the fresh plumes (< 0.5 h), the mean mass fractions (with (ρOC-BC ) were calculated as 0.87 and 0.88, respectively. The
standard deviation) of submicron BB aerosols were esti- OA and OC masses were found to have positive relationships
mated to be 72 % (± 5 %) for OA, 15 % (± 6 %) for BC, 2 % with BC at the source. Using the unconstrained linear orthog-
(± 0.4 %) for nitrate, 0.3 % (± 0.3 %) for sulfate, 5 % (± 1 %) onal distance regression (ODR) fitting method for the regres-
for ammonium and 6 % (± 2 %) for chloride (Fig. 3a). Com- sion of the mass concentrations of OA and BC as well as OC
pared with previously observed fresh smoke aerosol from and BC, we estimated the 1OA/1BC and 1OC/1BC ra-
flaming BB over southern Africa (Vakkari et al., 2014), OA tios as 7.2 (± 0.9) and 5.0 (± 0.6), respectively. Although the
https://doi.org/10.5194/acp-21-9417-2021 Atmos. Chem. Phys., 21, 9417–9440, 20219424 H. Wu et al.: Rapid transformation of ambient absorbing aerosols
Figure 2. Time series of measured mass concentrations of non-refractory aerosol species from the AMS, BC from the SP2, and also measured
CO and CO2 mixing ratios in each flight (a for C005, b for C006 and c for C007). The shaded areas are selected smoke plumes at different
ages. AMS data for flight C006 are not available as the vacuum pump overheated during this flight. CO was measured using an AeroLaser
AL5002 vacuum-UV fast fluorescence instrument, and CO2 was measured using a fast greenhouse gas analyser (FGGA).
previously estimated aerosol emission factors (1BC/1CO, ing trend with ageing, likely caused by replacement by other
1OA/1CO and EFBC ) showed temporal fluctuations at the anions such as nitrates (Akagi et al., 2012). During half-day
source, the 1OA/1BC and 1OC/1BC ratios demonstrated transport, ammonium and BC mass fractions were relatively
less variance and are likely to be representative parameters stable (within their measurement uncertainties) at different
for describing aerosol emissions from fire sources during the ages. Meanwhile, OA constituted a similar fraction of total
MOYA-2017 period. aerosol mass at different ages but varied in organic composi-
tion.
3.2.2 The evolution of chemical properties Here, we use some important OA fragment markers
(m/z 43, 44, 57, 60) from the AMS to investigate the evo-
Figure 3a shows the chemically speciated mass fractions of lution of organic composition. The ion peak at m/z 60
submicron BB aerosols at different plume ages. Some inor- (C2 H4 O+2 ) is attributed to levoglucosan-like species, which
ganic (nitrate and sulfate) mass fractions of aerosols were has been accepted as a marker of BB pyrolysis products
enhanced during the first ∼ 12 h of transport. This observa- (Schneider et al., 2006). The m/z 43 (C3 H+ +
7 ) and 57 (C4 H9 )
tion is consistent with the secondary processing of NOx and markers are from the fragments of saturated hydrocarbon
SO2 emitted from BB (Pratt et al., 2011; Akagi et al., 2012). compounds and long alkyl chains and are good indicators of
The nitrate mass fraction was also observed to increase and fresh aerosols (Alfarra et al., 2007). The m/z 43 marker can
stabilize more rapidly than sulfate due to the faster transfor- also come from oxidized functionalities such as aldehydes
mation of NO2 than SO2 by reaction with OH radicals at typ- and ketones (Alfarra et al., 2007). The m/z 44 is the sig-
ical atmospheric concentrations (Seinfeld and Pandis, 2016). nal of the CO+ 2 ion from carboxylic acid groups and organo-
The non-refractory chloride mass fraction showed a decreas-
Atmos. Chem. Phys., 21, 9417–9440, 2021 https://doi.org/10.5194/acp-21-9417-2021H. Wu et al.: Rapid transformation of ambient absorbing aerosols 9425
Figure 3. (a) The average chemical compositions of sampled smoke submicron aerosols at different ages (left axis); the black solid circles
represent the average O : C ratios of OA in sampled smoke (right axis). The whiskers represent 1 standard deviation. (b) The fractional
signals f 44 vs. f 60 and f 44 vs. f 43 of sampled smoke aerosols in our study. The dashed vertical line represents the background of f 60
(0.3 %) in environments not influenced by BB, as recommended by Cubison et al. (2011). The dashed-dot line passing through measurement
data indicates the general trend in f 44 vs. f 60 with aerosol age.
Table 2. The ERs of BC and OA as well as some chemical information in sampled smoke.
< 0.5 h ∼1h ∼ 3–6 h ∼ 9–12 h
1BC/1CO (µg cm−3 /µg cm−3 ) 0.016 ± 0.003 0.018 ± 0.004 0.017 ± 0.003 0.013 ± 0.003
(min–max: 0.012–0.021)
1OA/1CO (µg cm−3 /µg cm−3 ) 0.071 ± 0.032 0.079 ± 0.030 – 0.066 ± 0.027
(min–max: 0.045–0.101)
OM/OC 1.52 ± 0.03 1.68 ± 0.05 – 2.11 ± 0.04
1OA/1BC 7.2 ± 0.9 5.6 ± 0.5 – 5.9 ± 0.4
1OC/1BC 5.0 ± 0.6 3.5 ± 0.3 – 2.9 ± 0.2
Note: OA information was lost in the transported smoke at an age of ∼ 3–6 h, as there were no AMS data for the period.
peroxides and suggests the presence of oxygenated organic ity types based on the f 44 range, as indicated in Fig. 3b. By
compounds (Aiken et al., 2008). Figure 3b shows the f 44 vs. their method, the OA was mainly semi-volatile oxidized or-
f 43 and f 44 vs. f 60 diagrams of sampled smoke aerosols at ganic aerosol in the first ∼ 1 h and was entirely composed of
different ages following the methods in Ng et al. (2010) and low-volatility oxidized organic aerosol after half-day trans-
Cubison et al. (2011). The f 60 decreased rapidly in the first port. We also calculated the O : C ratio, which is a proxy for
1 h and was close to the background value (0.3 %; Cubison OA oxidation state (Aiken et al., 2008). As seen in Fig. 3a
et al., 2011) in environments not influenced by BB after half- (right-hand axis), the average O : C ratios (with standard de-
day transport. The f 43 also decreased with transport time. viation) increased from 0.26 (± 0.02) in the fresh plumes to
The m/z 57 marker represented 3.7 ± 0.2 % of the total OA 0.74 (± 0.03) at an aerosol age of ∼ 9–12 h, further evidenc-
mass in the fresh plumes and was below the detection limit ing the more oxidized OA state of aged BB aerosols.
after half-day transport. The decreasing f 43, f 57 and f 60 Previous studies employed ERs to remove dilution effects
were associated with the substantial decay of levoglucosan- and quantify post-emission processes within the plume, as-
like species and other related primary OA due to a combina- suming similar emission conditions at the fire source (e.g.
tion of dilution-driven evaporation and oxidation processes Akagi et al., 2012; Jolleys et al., 2012). We calculated the
after emission. The f 44 showed an increasing trend with 1BC/1CO and 1OA/1CO ratios for near-source (∼ 1 h)
plume age and indicates an enhanced fraction of oxidized OA and transported smoke (∼ 3–12 h; ∼ 9–12 h) using the un-
or OA in a higher oxidation state in the aged BB aerosols; constrained linear ODR fitting between two variables (BC
the increased oxidation state and fraction of OA over parti- and CO, OA and CO) (Table 2), which is described in
cle lifetime are associated with the oxidation of primary OA more detail in Sect. S1.1. BC is a chemically stable species.
and secondary organic aerosol formation (Ng et al., 2010). The average 1BC/1CO ratios were estimated to be rela-
The increasing f 44 has previously been shown to be corre- tively similar within measurement uncertainty at different
lated with decreasing OA volatility, as oxygenated OA is less plume ages, indicating that there was negligible aerosol re-
volatile than primary BB OA (Cappa and Jimenez, 2010). Ng moval during plume transport in this study. OA has under-
et al. (2010) classified OA components into different volatil- gone chemical processing after emission, as indicated by
https://doi.org/10.5194/acp-21-9417-2021 Atmos. Chem. Phys., 21, 9417–9440, 20219426 H. Wu et al.: Rapid transformation of ambient absorbing aerosols
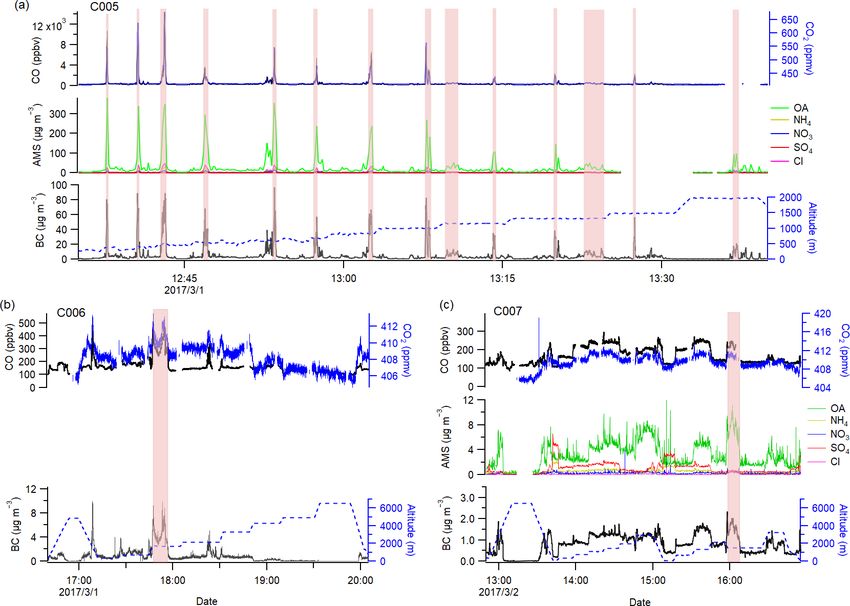
Figure 4. (a) The mean number size distributions of sampled smoke aerosols measured from the SMPS. The lognormal fitted CMDs are
also specified (in nanometres) for aerosols at different ages. The shade areas represent 1 standard deviation. (b) The mean number (left) and
mass (right) distributions of the BC core as a function of the sphere-equivalent diameter for sampled smoke plumes at different ages. The
shaded areas represent 1 standard deviation. The grey dashed square regions show the range of BC core diameter used for calculating coating
properties.
the varying OA compositions described above. Here, we use 3.3 The evolution of smoke aerosol size
the features of 1OA/1CO, 1OA/1BC and 1OC/1BC ra-
tios to study post-emission OA chemistry. The 1OA/1BC
and 1OC/1BC ratios for near-source (∼ 1 h) and trans- Figure 4a shows the mean size distributions of sampled
ported smoke (∼ 9–12 h) were also estimated from the un- smoke aerosols from the SMPS measurements and the cor-
constrained linear ODR fitting between the mass concentra- responding best-fit lognormal distributions, providing deter-
tions for OA and BC as well as OC and BC, respectively minations of count median diameter (CMD). It was not pos-
(Table 2). With negligible removal during transport, these sible to obtain a size distribution in the fresh plumes (< 0.5 h)
ratios would be mainly affected by OA transformation: the since there was not enough time for the SMPS to obtain a full
dilution-driven evaporation of OA to the gas phase, followed 1 min scan in the plume transect (< 30 s). We mainly detected
by subsequent oxidation and re-condensation, and also the single dominant modes during the transects at different ages,
formation of secondary OA from directly emitted precursor transferring from the Aitken mode to the larger accumulation
gases (Grieshop et al., 2009; Palm et al., 2020). The decreas- mode. The CMD increased from 85 nm at ∼ 1 h aerosol age
ing 1OC/1BC ratios with transport time suggests that there to 123 nm after half-day transport. A previous West African
was a continuous net loss of OC mass during the ageing pro- BB study observed near-source aerosol size using a PCASP
cess, implying that the evaporation loss of OC dominated (passive cavity aerosol spectrometer, optical sizing) and re-
over condensational growth. The average 1OA/1CO and ported a similar CMD of 110 nm (Capes et al., 2008). Pre-
1OA/1BC ratios showed small changes at different ages. vious measurements of southern African BB aerosols using
The relatively constant 1OA/1CO and 1OA/1BC ratios a DMPS (differential mobility particle sizer) reported CMDs
during transport arise from the balance of dilution-driven of 69 nm at an aerosol age of < 0.5 h that grew to 123 nm at
evaporation of OC and the increasing O : C ratios for OA, as ∼ 3 h (Vakkari et al., 2018), which is similar to the growth of
has been observed previously (e.g. Capes et al., 2008; Pratt mobility particle size measured in this study.
et al., 2011). From the SP2 measurements, BC mass was converted to
spherical-equivalent BC core diameter (DC ) with an assumed
BC density of 1.8 g cm−3 . Figure 4b shows the mean sphere-
Atmos. Chem. Phys., 21, 9417–9440, 2021 https://doi.org/10.5194/acp-21-9417-2021H. Wu et al.: Rapid transformation of ambient absorbing aerosols 9427
Figure 5. Distributions of measured coating thickness of BC-containing particles in sampled smoke plumes at different ages in terms of
shell/core ratios (a) and absolute coating thickness (b). The first bin (DP /DC = 1, uncoated particle) contains particles with measured
scattering less than that predicted for an uncoated core (equivalent to DP < DC ).
equivalent BC core size distributions in sampled smoke and near-source), the OA was consistent with that of semi-
plumes in terms of number and mass. The average BC core volatile organic aerosol. There is a dynamic equilibrium of
mass and number size distributions were similar at different the semi-volatile organic species in OA through evapora-
aerosol ages. The BC core CMD and mass median diameter tion and re-condensation until OA is highly oxidized to form
(MMD) were relatively constant during half-day transport, low-volatility organic species. Given the higher O : C ratios
falling in the ranges (10 to 90 percentile) of 100–116 nm and with transport time (Fig. 3a and as described in Sect. 3.2),
181–207 nm, respectively. The BC core sizes in this study are the OA was observed to be highly oxidized and was in the
also similar to the reported mean values (CMD = 121 nm and low-volatility range after half-day transport. These lower-
MMD = 188 nm) for highly aged BB aerosols (> 7 d) from volatility species would preferentially partition to the parti-
flaming burning in southern Africa (Taylor et al., 2020). The cle phase. Furthermore the inorganic species (nitrate and sul-
relatively stable BC core size at different ages indicates that fate), formed from the oxidation of emitted gaseous NOx and
BC–BC coagulation events are likely to be minor after emis- SO2 after emission would also condense onto existing par-
sion. ticles. The lower-volatility OA, as well as the formation of
Coating thicknesses on BC were also calculated for BC- inorganic species with transport, contributed to the increas-
containing particles from the SP2 measurements in the DC ing bulk aerosol CMD and coating thickness on BC.
range of 110–315 nm. This range was determined using the
method outlined by Taylor et al. (2015). Figure 5 shows 3.4 The evolution of aerosol absorption
the measured distributions of single-particle coating prop-
erties in selected smoke plumes at different ages expressed 3.4.1 Absorption parameters
in terms of shell/core ratios and absolute coating thickness.
In the fresh plumes (< 0.5 h), ∼ 40 % of BC particles had The AAE is an important optical parameter for aerosol char-
measurable coatings. BC was dominantly externally mixed acterization and apportionment. For the purposes of this pa-
with other co-emitted particles at the source (< 0.5 h). Af- per, BC absorption is considered independent of wavelength
ter emission, BC gradually became internally mixed with and therefore represented by an AAE of ∼ 1 (Bond et al.,
other species, which condensed materials onto the BC cores. 2013). It is generally assumed that an AAE significantly
Nearly all BC particles had measured coatings after half-day greater than 1 indicates the presence of non-BC absorbing
transport. During this process, BC showed enhanced coating particles like BrC or dust, which have higher AAEs than
thickness with transport time. The median BC shell/core ra- fresh BC (Lack and Langridge, 2013). In this study, the
tios and absolute coating thickness increased from 1.1 and AAE405−658 and AAE514−658 (Fig. 6a) were ∼ 1.1 and 0.9,
13 nm in the fresh plumes (< 0.5 h) to 1.7 and 50 nm, respec- respectively, in the fresh plumes, and both showed increas-
tively, after half-day transport. ing trends during the ageing process, reaching up to > 2.1
We now summarize the evolving mixing state of BB and > 1.7, respectively, after half-day transport. As an im-
aerosols in the sampled wildfire plumes. The BB aerosols in pactor upstream of the PAS removed particles with aero-
fresh plumes (< 0.5 h) exhibit a high level of external mix- dynamic diameters > 1.3 µm and because Saharan dust is
ing. The condensation processes between particles occurred mainly in the coarse-mode size range (e.g. Ryder et al.,
after emission; i.e. organic species repartition between par- 2018), the impact of mineral dust on our AAE measure-
ticles over the particle lifetime. At early plume ages (fresh ments should be minor. The AAE may also be affected by
changes in BC size and coating thickness with ageing. Nu-
https://doi.org/10.5194/acp-21-9417-2021 Atmos. Chem. Phys., 21, 9417–9440, 20219428 H. Wu et al.: Rapid transformation of ambient absorbing aerosols
Figure 6. (a) The measured AAE405−658 (black) and AAE514−658 (red) in sampled smoke plumes at different ages. The box-and-whisker
plots represent the 10th percentile, 25th percentile, median, 75th percentile and 90th percentile, and the dot markers represent mean values.
(b) The measured MAC values (markers) with uncertainties (shades) at 405, 514 and 658 nm in sampled smoke with different ages; the black
dashed lines and shaded areas represent the MAC and uncertainties of uncoated BC reported by Bond and Bergstrom (2006).
merical optical simulations, employing a BC refractive index ported smoke (∼ 3–6 h; ∼ 9–12 h), as shown in Fig. 6b. The
of 1.8 + 0.6i, show that the AAE(300−1000 nm) of fresh and un- measured 1 Hz absorption and BC mass concentration in
coated BC is approximately 1.05 and relatively insensitive to smoke were averaged to 10 s sampling periods to lower the
particle size (Liu et al., 2018). For BC particles with core di- uncertainty introduced by small differences in instrument re-
ameters larger than 0.12 µm, the AAE(300−1000 nm) becomes sponse time. Bond and Bergstrom (2006) reported a MAC
smaller when BC particles are aged due to compaction of value of 7.5 m2 g−1 at λ = 550 nm and assumed an AAE of 1
structures and the addition of non-absorbing coating materi- for fresh and uncoated BC, which could be used to extrapo-
als (Liu et al., 2018). Zhang et al. (2020) also conducted nu- late the MAC of uncoated BC to different wavelengths. The
merical studies of the AAE(350−700 nm) of polydisperse BC absorption enhancement (EAbs-MAC ) was then calculated by
aggregates using a BC refractive index of 1.85 + 0.71i as the ratio of the MACmeas-BC to the MAC of uncoated BC
well as a range of BC core sizes (geometric mean radius: 50– derived from Bond and Bergstrom (2006). EAbs-MAC repre-
150 nm) and coatings (shell/core ratios: 1.1–2.7). Calcula- sents the additional absorption of light above that expected
tions by Zhang et al. (2020) indicate that the AAE(350−700 nm) from the bare BC cores and is attributed to the lensing effect
of clear-coated BC is slightly sensitive to particle micro- of coatings on BC cores and the absorption by BrC (Cappa
physics (e.g. BC core size and shell/core ratios), with values et al., 2012; Lack et al., 2013). Figure 7 shows the calcu-
mainly in the range of 0.7–1.4. However, when BC is coated lated MACmeas-BC and EAbs-MAC at 405, 514 and 658 nm for
with absorbing material, such as BrC, numerical optical sim- aerosols in sampled smoke at different ages, demonstrating
ulations show larger AAEs than clear-coated BC and also consistent increases in these metrics with particle age. The
show an increasing AAE with enhanced coating thickness previous section has shown that coating thicknesses of BC-
(Gyawali et al., 2009; Lack and Cappa, 2010; Zhang et al., containing particles increased with particle age. The absorp-
2020). Some theoretical calculations suggest that a thresh- tion enhancement from the lensing effect of non-absorbing
old value of AAE > 1.6 is strongly indicative that BC coat- coatings is expected to be nearly identical over a broad spec-
ings contain light-absorbing materials (e.g. Gyawali et al., tral range (e.g. Cappa et al., 2012; Nakayama et al., 2014;
2009; Lack and Cappa, 2010). The evolution of BC size and Pokhrel et al., 2017). However, the formation for BrC as in-
coatings with ageing, as described in Sect. 3.3, is unlikely dicated by our measured AAE values resulted in higher ob-
to dominate the change in observed AAE if there is no BrC. served EAbs-MAC for progressively shorter wavelengths.
The above discussion indicates that the observed increasing
AAE is most likely attributable to the formation of BrC. In
3.4.2 Absorption attribution to BrC
this study, BC was the dominant light-absorbing aerosol in
fresh BB plumes, while BrC was likely a minor component
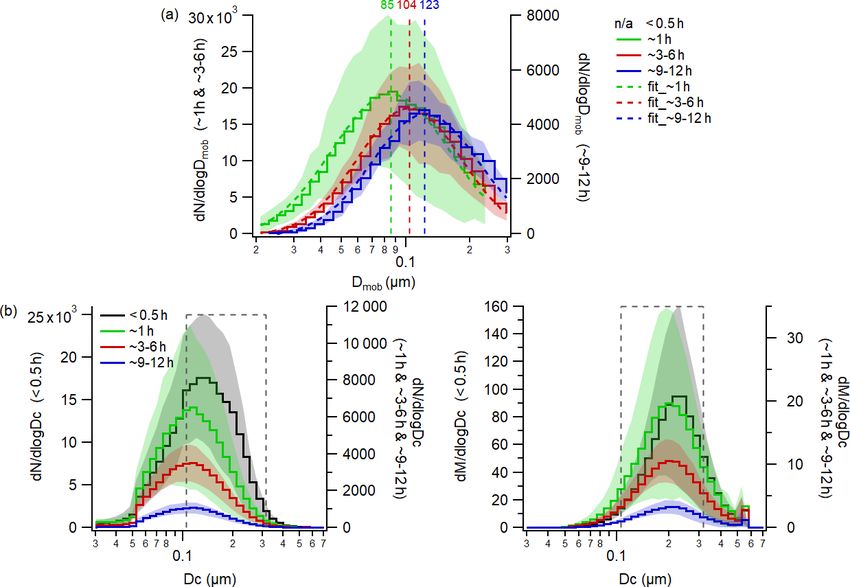
at the source but was formed during transport. In this section, we attribute aerosol absorption to BrC using
The MAC (m2 g−1 ) is a key variable for characteriz- different methods. The calculations were based on both the
ing the absorbing properties of aerosols. The measured measurements described in previous sections and simulated
aerosol absorption normalized to BC mass, denoted as the absorption properties derived from optical models. We used
MACmeas-BC , was determined by the unconstrained linear the measured MACmeas-BC shown in Sect. 3.4.1 and the mod-
ODR fitting between the measured absorption coefficient and elled MAC of aged BC to attribute aerosol absorption. We
BC mass concentration for near-source (∼ 1 h) and trans- also used the AAE method in Lack and Langridge (2013),
as described in Sect. S1.2 in the Supplement, to estimate the
Atmos. Chem. Phys., 21, 9417–9440, 2021 https://doi.org/10.5194/acp-21-9417-2021You can also read