Complex interactions of in-stream dissolved organic matter and nutrient spiralling unravelled by Bayesian regression analysis
←
→
Page content transcription
If your browser does not render page correctly, please read the page content below
Biogeosciences, 18, 3103–3122, 2021
https://doi.org/10.5194/bg-18-3103-2021
© Author(s) 2021. This work is distributed under
the Creative Commons Attribution 4.0 License.

Complex interactions of in-stream dissolved organic matter and
nutrient spiralling unravelled by Bayesian regression analysis
Matthias Pucher1,2 , Peter Flödl3 , Daniel Graeber4 , Klaus Felsenstein5 , Thomas Hein1,2 , and Gabriele Weigelhofer1,2
1 WasserClusterLunz    – Biologische Station GmbH, Lunz am See, Austria
2 Institute of Hydrobiology and Aquatic Ecosystem Management, University of Natural Resources and Life Sciences,
Vienna, Austria
3 Institute of Hydraulic Engineering and River Research, University of Natural Resources and Life Sciences, Vienna, Austria
4 Department Aquatic Ecosystem Analysis and Management (ASAM), Helmholtz Centre for Environmental Research – UFZ,

Magdeburg, Germany
5 Department of Statistics, Vienna University of Technology, Vienna, Austria

Correspondence: Matthias Pucher (matthias.pucher@wcl.ac.at)

Received: 7 October 2020 – Discussion started: 30 October 2020
Revised: 12 April 2021 – Accepted: 20 April 2021 – Published: 25 May 2021

Abstract. Uptake and release patterns of dissolved organic          compound-specific DOM and nutrient spiralling metrics in
matter (DOM) compounds and co-transported nutrients are             our experiment.
entangled, and the current literature does not provide a con-          Bulk DOC uptake varied among sources, showing de-
sistent picture of the interactions between the retention pro-      creasing uptake velocities in the following order: corn > pig
cesses of DOM fractions. We performed plateau addition ex-          dung > leaves > nettles > cow dung. We found no correla-
periments with five different complex DOM leachates in a            tions between bulk DOC uptake and the amounts of protein-
small experimental stream impacted by diffuse agricultural          like compounds or co-leached soluble reactive phosphorus
pollution. The study used a wide range of DOM qualities             (SRP). The fastest uptake was observed for SRP and the
by including leachates of cow dung, pig dung, corn leaves,          tryptophan-like component, while the other DOM compo-
leaves from trees, and whole nettle plants. We measured             nents’ uptake velocities more or less resembled that of the
changes in nutrient and dissolved organic carbon (DOC) con-         bulk DOC. Almost all DOM components showed a nega-
centrations along the stream course and determined DOM              tive relationship between uptake and concentration, known
fractions by fluorescence measurements and parallel factor          as efficiency loss. Furthermore, we observed a few negative
(PARAFAC) decomposition. To assess the influences of hy-            and (weak) positive interactions between the uptake and the
drological transport processes, we used a 1D hydrodynamic           concentration of different components, such as a decreased
model.                                                              uptake of protein-like compounds at high concentrations of a
   We developed a non-linear Bayesian approach based on             high-molecular-weight humic-like compound. We also found
the nutrient spiralling concept, which we named the “inter-         an influence of the wetted width on the uptake of SRP and a
actions in nutrient spirals using Bayesian regression” (INS-        microbially derived humic substance, which indicates the im-
BIRE) approach. This approach can disentangle complex in-           portance of the sediment–water interface for P and humic C
teractions of biotic and abiotic drivers of reactive solutes’ up-   cycling in the studied stream.
take in multi-component DOM sources. It can show the vari-             Overall, we show that bulk DOC is a weak predictor of
ability of the uptake velocities and quantify their uncertainty     DOC uptake behaviour for complex DOM leachates. Individ-
distributions. Furthermore, previous knowledge of nutrient          ual DOM compound uptake, including co-leached nutrients,
spiralling can be included in the model using prior probabil-       is controlled by both internal (quality-related) and external
ity distributions. We used INSBIRE to assess interactions of        (environmental) factors within the same aquatic ecosystem.
                                                                    We conclude that the cycling of different C fractions and their

Published by Copernicus Publications on behalf of the European Geosciences Union.
3104                                                  M. Pucher et al.: Interactions of in-stream DOM and nutrient spiralling

mutual interaction with N and P uptake in streams is a com-           al., 2016). High uptake rates have been observed for protein-
plex, non-linear problem, which can only be assessed with             rich, low-molecular-weight DOM sources such as leachates
advanced non-linear approaches, such as the presented INS-            of fresh leaf litter, macrophytes, and periphyton (Berggren et
BIRE approach.                                                        al., 2010; Koehler et al., 2012). In contrast, the soil leachates’
                                                                      biodegradability has been described as generally low (e.g.
                                                                      Fellman et al., 2009b; Hansen et al., 2016). Finally, the in-
                                                                      stream uptake of DOM may be influenced by environmental
1   Introduction                                                      factors other than nutrient concentrations, such as the hydrol-
                                                                      ogy and morphology of the respective reach or the biofilms’
Dissolved organic matter (DOM) from terrestrial sources               composition (Casas-Ruiz et al., 2017; Romani et al., 2004;
plays a key role in the metabolism and the ecological state of        Weigelhofer et al., 2020).
streams and rivers by controlling the activity and the compo-            Thus, unravelling the underlying mechanisms of in-stream
sition of microbial communities (e.g. Freixa et al., 2016) and        DOM uptake is complex. While a considerable part of the
influencing a variety of aquatic biogeochemical processes             reactive N and P exists as small and simple molecules, dis-
(Tank et al., 2010). The quantity and the quality of DOM              solved organic carbon (DOC) is bound in a mixture of dif-
affect the aquatic bacterial respiration (e.g. Besemer et al.,        ferently structured organic molecules, with retention times
2009; Niño-García et al., 2016), change the ratio between au-         varying by several orders of magnitude (Cory and Kaplan,
totrophy and heterotrophy (Lutz et al., 2012; Martínez et al.,        2012; Mineau et al., 2016). The production of new com-
2017), and influence the microbial uptake of dissolved inor-          pounds during DOM decomposition may further complicate
ganic nitrogen (DIN; e.g. Bernhardt and Likens, 2002; Taylor          an accurate assessment of the DOM uptake (Stevenson and
and Townsend, 2010; Wymore et al., 2016) and soluble reac-            He, 1990; Tsutsuki and Kuwatsuka, 1979). Mass balance ap-
tive phosphorus (SRP; Gibson and O’Reilly, 2012; Stutter et           proaches or calculations of first-order decay curves from ad-
al., 2020; Weigelhofer et al., 2020), amongst others.                 dition experiments have been successfully used in numerous
   The influence of DOM on nutrients is mutual (e.g. Mineau           studies to estimate in-stream uptake of DIN, SRP, and bulk
et al., 2013; Stutter et al., 2020; Weigelhofer et al., 2020)         DOC (e.g. Bernhardt and McDowell, 2008; Catalán et al.,
due to the demand of microbes for carbon (C), nitrogen (N),           2018; Covino, 2012; Ensign and Doyle, 2005; Mineau et al.,
and phosphorus (P) in a molar ratio that approximates their           2013; Schiller et al., 2011; Stream Solute Workshop, 1990;
C : N : P ratio (Small et al., 2009; Stutter et al., 2018; Welti et   Weigelhofer et al., 2018b). However, these methods are often
al., 2017; Godwin and Cotner, 2018). The importance of this           limited in quantifying the uptake of individual DOM compo-
stoichiometric control of nutrient and organic carbon uptake          nents. This limitation restricts and complicates the analyses
in streams and rivers has been known for some time (Cross             of interactions among different DOM components and their
et al., 2005; Dodds et al., 2004) but has increasingly gained         role in the overall DOC uptake (Mineau et al., 2013; Stream
attention over the last few years with the discovery of anthro-       Solute Workshop, 1990; Weigelhofer, 2017; Weigelhofer et
pogenic impacts on pristine C : N : P ratios and DOM compo-           al., 2018b).
sitions (Stutter et al., 2018; Xenopoulos et al., 2021). Inten-          Our study aimed at investigating the effects of DOM qual-
sive land use has changed the origin, amount, and transport           ity on the in-stream DOM uptake. We developed an approach
of terrestrial DOM to streams, thereby probably altering the          to quantify complex interactions between individual DOM
DOM in-stream processing (Weigelhofer et al., 2020).                  compounds, including co-leached N and P, and to elucidate
   According to ecological stoichiometry, in-stream DOM               their combined role in the overall DOM retention. For this
uptake and retention is primarily related to the availabil-           purpose, we performed several short-term plateau additions
ity of inorganic nutrients, whether they already exist in the         with different DOM sources in an agriculturally influenced
freshwater ecosystem (environmental control of DOM up-                headwater stream according to the nutrient spiralling con-
take) or are provided by the DOM source itself (intrinsic con-        cept (Stream Solute Workshop, 1990). We used leachates
trol through the DOM quality; e.g. Bernhardt and McDowell,            from natural and human sources (e.g. leaves, manure) to see
2008; Graeber et al., 2015; Gücker et al., 2016; Wickland et          how in-stream DOM processing may be altered due to an-
al., 2012). Field and laboratory studies show that DOC up-            thropic land use changes. Because of the diverse composition
take can be positively affected by N and P concentrations in          of DOM, we decided to extend the equations from the nutri-
the water column (Catalán et al., 2018; Mineau et al., 2013).         ent spiralling concept (Stream Solute Workshop, 1990) and
DOC uptake is also high in N- and P-rich DOM sources, such            use a Bayesian approach to analyse interactions between and
as leaves from fertilized trees or agricultural areas (Mineau         influences of different DOM components and nutrients, in-
et al., 2013; Mutschlecner et al., 2018; Weigelhofer et al.,          cluding uncertainty propagation. Bayesian statistics is a suit-
2020).                                                                able tool for ecological and biogeochemical questions, allow-
   In addition to nutrient interactions, DOM uptake depends           ing users to assess the natural variability and assign degrees
on the structure and the bioavailability of the individual            of belief in hypotheses based on measured data (Arhondit-
DOM compounds (Guillemette and Giorgio, 2012; Mineau et               sis et al., 2008; Berger and Berry, 1988; Cox, 1946; Ellison,

Biogeosciences, 18, 3103–3122, 2021                                                      https://doi.org/10.5194/bg-18-3103-2021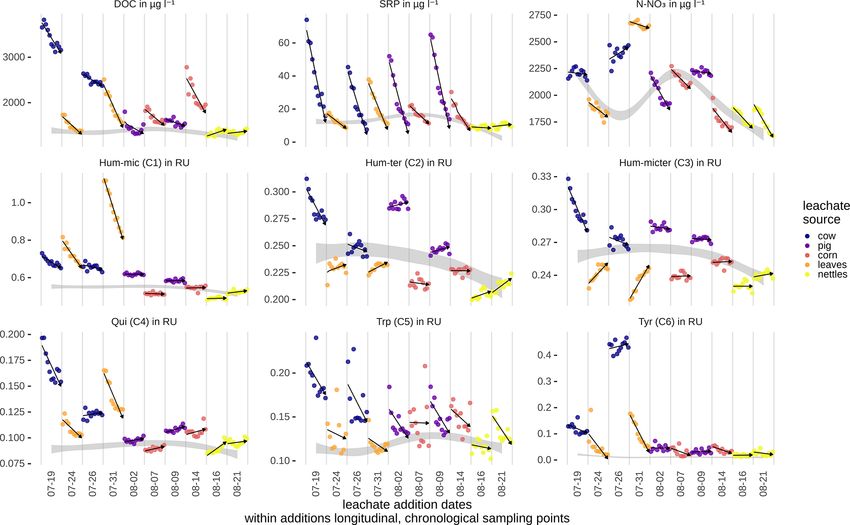
M. Pucher et al.: Interactions of in-stream DOM and nutrient spiralling                                                       3105

2004; Jaynes, 2003; McCarthy, 2007). We incorporated non-          Table 1. Extent and environmental characteristics of the HOAL.
linear nutrient uptake models observed in previous studies,
such as the Michaelis–Menten kinetics or the nutrient effi-                 Characteristic              Value     Unit
ciency loss model (Dodds et al., 2002; O’Brien et al., 2007),               Length                         620    m
in our approach to describe relationships between concen-                   Catchment size                0.66    km2
trations and uptake velocities mathematically. Our approach                 Arable land coverage             90   %
enabled us to (1) analyse how uptake processes of different                 Mean annual discharge        0.004    m3 s−1
components influence each other; (2) test our mathematically                Peak discharge                    2   m3 s−1
pre-formulated assumptions with the measured data, includ-                  Mean annual temperature         9.5   ◦C
ing the remaining errors; (3) consider the natural variabil-                Mean annual precipitation      820    mm yr−1
ity of each parameter; and (4) include knowledge of nutrient
and DOC uptake kinetics from previous studies in our mod-
els. We called our approach “interactions in nutrient spirals      dominated by herbaceous vegetation and grass on the banks.
using Bayesian regression” (INSBIRE). With INSBIRE, we             All inflows as well as the stream discharge are continuously
addressed the following questions:                                 monitored regarding water quantity and quality. Sediments
    – What are the differences in the bulk DOC uptake veloc-       are dominated by clay, which is washed in from the adjacent
      ity of different leachates?                                  fields during storm events. Table 1 shows the extent and basic
                                                                   environmental characteristics of the stream.
    – How do selected DOM components behave in compari-               For the experiments, we chose a study reach of 215 m sit-
      son to the bulk DOC uptake velocity?                         uated between two lateral inflows which was divided into 10
                                                                   subsections of 16 to 26 m lengths, depending on the accessi-
    – Which factors and interactions influence the uptake ve-      bility (Fig. 2). The first sampling point (1) was located 19.4 m
      locity of the bulk DOC, the individual DOM compo-            downstream of the injection point (0) to ensure complete
      nents, and the co-leached nutrients N and P?                 mixing of the solutes in the water column. Full mixing was
We expected nutrient- and protein-rich leachates to show           determined by measuring the electrical conductivity across
higher uptake velocities than the other leachates. Low-            the channel transect during a salt addition before the exper-
molecular-weight protein-like compounds would show a               iments. The study reach was characterized by a meandering
faster uptake, while high-molecular-weight, aromatic com-          stream course with frequent pools (up to 24 cm in depth) be-
pounds would show a slower uptake than the bulk DOC. We            tween sampling points 8 and 11 (Fig. 2). Between point 4 and
also expected to find positive influences of co-transported nu-    point 5, Equisetum palustre and Juncus sp. were growing in
trients on the bulk DOC uptake and negative influences of          the open channel. At point 7, the patchy canopy cover facil-
low-molecular-weight protein-like compounds on the uptake          itated the growth of algae on the stream bed. During the ex-
of high-molecular-weight, aromatic compounds.                      periment, the median temperature was 16.7 ◦ C (interquartile
                                                                   range = 2.4), and the median conductivity was 633 µS cm−1
                                                                   (interquartile range = 23).
2     Methods
                                                                   2.2   Experimental design
2.1    Site description
                                                                   The experiment was performed over six consecutive weeks
The experiment was carried out in the Hydrological Open            in July and August 2018. No major rain event occurred in the
Air Laboratory (HOAL; Fig. 1) in Petzenkirchen, Austria            study area, and the average discharge was between 0.38 and
(Blöschl et al., 2016; for further information and a de-           0.93 L s−1 . Ten additions with DOM leachates from five dif-
tailed map, see https://hoal.hydrology.at/the-hoal, last ac-       ferent sources were injected into the study reach using short-
cess: 3 April 2021). The HOAL is a small catchment that            term plateau additions according to the Stream Solute Work-
was transformed into a hydrologic observatory to foster sci-       shop protocol (Stream Solute Workshop, 1990; Weigelhofer
entific research. It features several permanently installed sen-   et al., 2012). The respective leachate plus a NaCl solution
sors measuring discharge, different water parameters, and          acting as a conservative tracer were pumped into the stream
the weather. Many studies on surface and subsurface flow           at point 0 over 2 to 2.5 h via a peristaltic pump (Fig. 2). We
paths, evaporation, soil erosion, sediment transport, and nu-      used a mobile conductivity meter to identify plateau condi-
trient dynamics have already been performed in the HOAL            tions in the stream at each sampling point. Approximately
(Blöschl et al., 2016). The first-order stream has several in-     10 min after reaching stable plateau conditions, water sam-
flows, including two natural springs, six drainage pipes, and      ples were taken at each sampling point to analyse nutri-
one site with groundwater infiltration from a small wetland.       ent concentrations, organic carbon concentrations, and DOM
The stream flows through a deciduous forest with two short         composition. Thus, the sampling time exceeded the average
open sections in the middle (points 4–5 and 7 in Fig. 2)           water travel time by far, ensuring proper mixing and a stable

https://doi.org/10.5194/bg-18-3103-2021                                                      Biogeosciences, 18, 3103–3122, 2021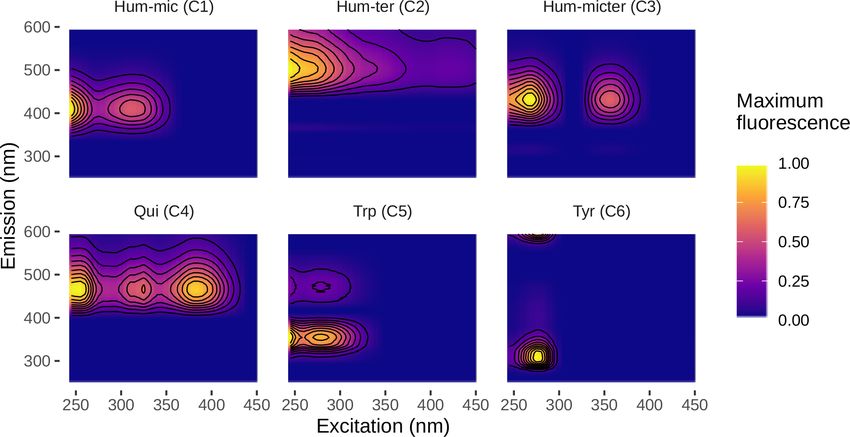
3106                                                M. Pucher et al.: Interactions of in-stream DOM and nutrient spiralling

Figure 1. Hydrologic Open Air Laboratory (HOAL): catchment, stream, sampling points, and location within Austria. A satellite image
of the site also shows the inflows before and after the sampling stretch (catchment outlet: MW; inlet: SYS4; tile drains: FRAU1, FRAU2,
SYS1, SYS2, and SYS3; erosion gullies: E1 and E2; springs: Q1 and K1; wetland run-off: A1 and A2). GIS data and aerial provided by the
Bundesamt für Wasserwirtschaft in Petzenkirchen, Austria.

Figure 2. Sampling scheme and general parameters of the stream. Point 0 marks the location of the solute addition, and points 1–11 the
sampling sites.

state during sampling (see Fig. 2). After shutting the addition       addition experiments (Weigelhofer, 2017; Weigelhofer et al.,
off, the change in conductivity was recorded until salt con-          2012, 2018b) and on the long-term weather and discharge
centrations had returned to ambient levels. Additions were            data of the stream. During our experiments, environmental
limited to a maximum of two times per week with at least              changes were negligible due to highly stable weather con-
48 h between two consecutive samplings, allowing the sys-             ditions and the lack of human activities in the experimental
tem time to recover. Each leachate was added twice to the             area. We also observed no systematic changes of the DOM,
stream with an interval of 5–7 d to minimize adaptions of             N-NO3 , and SRP uptake over time, indicating that any po-
the microbial community and interferences among leachates.            tential adaptions or responses of the microbial community to
The additions created concentration peaks equal to or below           these short and low pulses did not affect the results of the
local rain events. Each Monday, we sampled ambient con-               study significantly.
centrations to interpolate background conditions for the days
with addition experiments. All samples were taken between             2.3   Preparation of the leachates
10:00 and 14:00 CEST to ensure comparability. As the en-
vironment changes naturally over time (e.g. discharge, tem-           The leachates were prepared from 50 g L−1 dry matter of
perature), different additions cannot be compared if the in-          cow and pig dung, foliage from local trees (Acer platanoides,
terval between them is too long. However, extremely short             Acer pseudoplatanus, Lonicera xylosteum, Pteridium aquil-
intervals and/or long addition times may lead to adaptions of         inum, Sambucus nigra), nettles (Urtica dioica), and corn
the microbial community. Thus, the sampling schedule rep-             plant (Zea mays) leaves. We leached the substrates with
resents a compromise based on our experiences in nutrient             nutrient-poor water from a local well under aerated condi-

Biogeosciences, 18, 3103–3122, 2021                                                      https://doi.org/10.5194/bg-18-3103-2021
M. Pucher et al.: Interactions of in-stream DOM and nutrient spiralling                                                        3107

tions in a barrel over 24 h. The leachates were filtered in steps    the data (Pucher et al., 2019). We used Open-Fluor (Murphy
of 2 and 0.5 mm using stainless-steel sieves and 50 µm us-           et al., 2014) to compare and link the found components with
ing a 25 cm spun filter cartridge (PureOne PS-10). The end           other studies (Table 2).
volume was between 40 and 60 L. To avoid post-leaching
changes in DOM, the leachates were prepared freshly for              2.5   Hydrodynamic modelling
each addition.
   Average DOC concentrations in the stream water were               A hydrodynamic 1D model was used to calculate the neces-
about 1.3 mg L−1 . We aimed to achieve an increase by about          sary hydraulic parameters using the software package HEC-
3 mg L−1 DOC in the experiments. Some sources proved dif-            RAS (Hydrologic Engineering Center’s River Analysis Sys-
ficult to leach in sufficient amounts, and parts of the leached      tem). To create the digital terrain model, a cross-sectional ap-
DOC were degraded even during short storage. Thus, the               proach was applied, where 64 cross sections were recorded at
DOC increase achieved during the experiments was between             a distance of 0.8 to 6.8 m depending on structural variations
0.2 and 2.3 mg L−1 . Even within the same source, leached            and accessibility. A total of 251 points were measured in
amounts varied in concentration and composition between              the stream with a theodolite (Leica TC805) and then merged
different additions. We consider these variations neglectable        with a 1 × 1 m floodplain area model (based on the official
since we defined the leachates by their measured composi-            laser scan data of the province of Lower Austria) using the
tion and not solely by their source. However, the fluctuations       software package Surface-water Modeling System (Aqua-
broadened the distributions of the measured values, provid-          veo, LLC). The model was calibrated with the discharge data
ing more stable models and a more general picture of the             recorded at the HOAL site by comparing the measured water
uptake processes.                                                    surface elevation with the modelled one. The calibrated 1D
                                                                     model was used to calculate the hydraulic parameters flow
2.4   Analyses                                                       velocity, water depth, wetted width, and water travel time at
                                                                     each sampling point for each sampling day.
Before the lab analyses, samples were filtered through pre-
combusted Whatman glass microfiber filters, Grade GF/F               2.6   Calculating interactions in nutrient spirals using
(0.7 µm). We measured inorganic nitrogen as N-NO−      3 , nitrite         Bayesian regression (INSBIRE)
(N-NO−                               +
        2 ), and ammonium (N-NH4 ) as well as SRP with a
continuous-flow analyser (accuracy ±0.1 µg L−1 ). DOC was            The uptake was calculated using a Bayesian non-linear
measured with a Sievers∗ 900 portable total organic carbon           model and solved with a Markov chain Monte Carlo
analyser (accuracy ±2 %). We measured the DOM quality                (MCMC) algorithm as provided in the R package brms
(excitation–emission matrices, or EEMs) via fluorescence             (Bürkner, 2017) relying on stan (Carpenter et al., 2017).
spectroscopy with a Hitachi F-7000 fluorescence spectropho-          We used the Bayes factor (BF; Goodman, 1999a, b) for hy-
tometer and DOM absorbance with a Shimadzu UV-1700                   pothesis testing and model comparisons. The BF is the ra-
spectrophotometer.                                                   tio of the marginal likelihood of two competing hypothe-
   We analysed the data using R software version 3.5 (R              ses or models. A BF of 10 favouring a particular hypothe-
Development Core Team, 2019) and tidyverse (Wickham et               sis or model means that this model is 10 times more likely
al., 2019). The DOM EEMs (11 sampling points, 16 sam-                to explain the measured data. The interpretation of the BF
pling dates, 176 samples in total) were pre-processed using          was conducted according to Kass and Raftery (1995). There,
eemR (Massicotte, 2019); the fractions by fluorescence mea-          the evidence is “barely noteworthy” (1 < BF < 3.2), “sub-
surements and parallel factor (PARAFAC) analysis was done            stantial” (3.2 < BF < 10), “strong” (10 < BF < 100) or “de-
with staRdom (Pucher et al., 2019). The measured fluores-            cisive” (BF > 100). A BF < 1 corresponds to the inverse of
cence EEMs were corrected for inner-filter effects, samples          the BF but in favour of the other hypothesis. Model selection
of ultra-pure water were subtracted, scatter bands were re-          using the BF also allows removing models prone to collinear-
moved and interpolated, and the samples were normalized              ity problems (Ghosh and Ghattas, 2015). The Bayes R 2 (Gel-
to Raman units. Samples were screened visually, and no un-           man et al., 2019) for each model was calculated to demon-
usual noise was found. After obtaining the first models, three       strate the accuracy of the analysis.
outliers were identified using the samples’ leverages and ex-           We used the equations of the nutrient spiralling concept
cluded from the model. The components’ spectra were visu-            provided by the Stream Solute Workshop (1990) to develop
ally checked for plausibility. After that, a suitable model was      our solute spiralling model, INSBIRE. All equations provid-
validated using a split-half analysis. The final model did not       ing the basis of the model from the Stream Solute Work-
express any problems related to those criteria. The outliers         shop (1990) and all equations derived, transformed, and de-
were included again to calculate loadings under the already-         veloped from these basic equations for the model develop-
fixed components. To calculate the PARAFAC models and                ment are shown and explained in detail in Sect. S1 in the
the split-half validation, we used 256 random initializations,       Supplement. For a straightforward solving scheme like INS-
a tolerance of 10−11 , and staRdom’s standard way of splitting       BIRE, a single-step analysis is necessary to determine all in-

https://doi.org/10.5194/bg-18-3103-2021                                                     Biogeosciences, 18, 3103–3122, 2021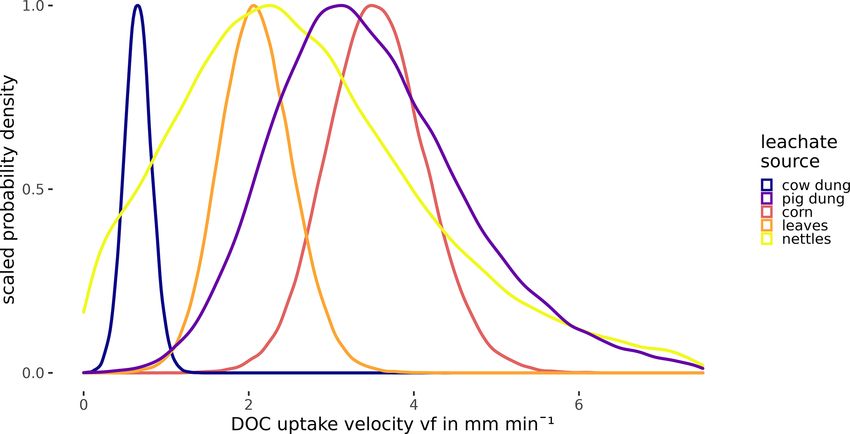
3108                                               M. Pucher et al.: Interactions of in-stream DOM and nutrient spiralling

terdependent parameters’ posterior distributions at once. In-     sampling date for all or at least most nutrients and compo-
teractions, model weaknesses, collinearity (Ghosh and Ghat-       nents can also reveal experimental or analytical problems in
tas, 2015), and the variation of parameters can then be as-       the execution process but was not observed in this study.
sessed and interpreted consistently.                                 The analyses of influencing factors in bulk DOM and
   Commonly, uptake length (sw ), uptake velocity (vf ), and      component-specific uptake (research question 3) required the
areal uptake rate (U ) are used to describe nutrient uptake       adaption of the original concept by including relationships
(Dodds et al., 2002; O’Brien et al., 2007; Trentman et al.,       among different DOM components and co-leached nutrients.
2015; Weigelhofer et al., 2018b). We fitted all three param-      This step was motivated by nutrient addition studies showing
eters to the equations. The uptake length sw is known to          different uptake models such as linear functions, power func-
change with different discharges, while vf is independent         tions (efficiency loss model), and Michaelis–Menten kinetics
of discharge (Dodds et al., 2002) and U is related to the         (Dodds et al., 2002; O’Brien et al., 2007; Trentman et al.,
solvent concentration. We used vf to address our research         2015). We additionally tested an exponential function and an
questions because the exclusion of hydrology provides the         asymptotic regression function. We decided to present only
best conditions for analysing biogeochemical relationships.       the results of the power function (Eq. 1) because its inclusion
In alignment with Bayesian statistics (e.g. McCarthy, 2007),      in the models showed the highest BFs (highest probability
we defined prior distributions for each parameter based on        to explain the observed data) in most cases. A considerable
the knowledge from other studies (e.g. Mineau et al., 2016)       advantage of the power function is that there is only one pa-
to keep the parameters (e.g. vf ) within realistic ranges and     rameter to fit, making it less prone to over-fitting in complex
foster a stable fitting procedure. We provide an exemplary        models (e.g. discussed in McElreath, 2016, chap. 7). Also, in
R script that demonstrates INSBIRE (Pucher, 2020). A de-          our experiment, the concentrations of the DOM components
tailed mathematical description of the INSBIRE approach           and the co-leached nutrients did not reach uptake limits. In
can be found in Sect. S1.                                         such cases, uptake rate curves often exhibit a power func-
   We used data from all experiments combined to perform          tion, probably representing the lower unsaturated part of a
the parameter estimation, thus increasing the number of           saturation model within a concentration range naturally met
points in our model. By doing that, we got a better insight       in stream systems. O’Brien et al. (2007) limited the exponent
into processes and interactions underlying uptake that can        of the power function (mi in Eq. 1) to negative values (m < 1
only be observed with different nutrient and DOM ratios.          for U , but m < 0 for vf ) to describe the efficiency loss be-
In contrast to a fitting algorithm, which determines only the     haviour. However, positive mi can also be used in the models
most suitable value, the result of a Bayesian fitting is a dis-   to describe situations where a substance improves the uptake
tribution of probable parameter values showing the variabil-      of another (e.g. Stutter et al., 2020). In our study, we looked
ity in the stream and between experiments. Furthermore, we        for both positive and negative interactions among compo-
set a threshold for complete retention of the added solutes,      nents, and thus we did not constrain the sign of mi . For posi-
at which the difference between plateau and ambient condi-        tive exponents mi in Eq. (1), the function would pass through
tions was equal to 2 times the accuracy of the lab analyses.      zero, which means that the absence of a stimulating compo-
Measured values below this threshold were removed from the        nent automatically leads to a total collapse of DOM or nu-
analyses. Since the fluorescence of DOM increases linearly        trient uptake. However, such a total collapse is not expected
with concentration (Kothawala et al., 2013), we used Fmax         for DOM fractions since microbes can use other C sources.
of the PARAFAC components analogues to concentrations             Thus, we incorporated an added value l in Eq. (1) as a degree
in these models.                                                  of freedom, whose relevance was tested during the model se-
   We tested trends in the longitudinal nutrient concentra-       lection process.
tions by comparing the assumption of constant concentration          From a modelling point of view, any available variable can
with exponential decay as proposed in the nutrient spiralling     be included and tested at that point. We decided to include the
concept (Stream Solute Workshop, 1990). The BF between            wetted width in the formula because we expected an influ-
those two models was calculated to show which one is more         ence of the available benthic surface on the uptake processes.
likely. For the analysis of the uptake of bulk DOM and indi-      Furthermore, the stream showed a fluctuation of the wetted
vidual components (research questions 1 and 2), we used the       width by a factor of 2.8 between different dates and cross
equations from the nutrient spiralling concept (Stream So-        sections. The considerations made in this chapter resulted in
lute Workshop, 1990) to calculate vf via a one-step fitting       the following equation:
procedure (for details, see Sect. S1 and Eq. S4). By adding                   Y
                                                                                        mi
the leachate source to the uptake models as a random fac-         vf = kw l + i Ci,x,t       ,                                 (1)
tor, we could determine quality-related differences between
the leachate sources. We also added the sampling date as a        where vf is nutrient uptake velocity; k is the uptake rate
random effect to our models to see if there are differences       factor (model parameter); w is wetted width, constant at 1
between the two sampling dates of the same leachate source        to represent no influence (calculated by HEC-RAS and then
(e.g. Ohno and Bro, 2006). A systematic change with the           fixed); l is the additive value (model parameter); i is the index

Biogeosciences, 18, 3103–3122, 2021                                                  https://doi.org/10.5194/bg-18-3103-2021
M. Pucher et al.: Interactions of in-stream DOM and nutrient spiralling 3109
of DOM component or nutrient; Ci,x,t is the concentration of 3.2 Ambient concentrations and introduced material
compound i at point x and date t (measured variable); and
mi is an exponent determining the strength of the relations Peak DOC concentrations were highest for cow dung
(model parameter). leachate, followed by corn and leaves, and lowest in nettles
The same fitting algorithm as for research questions 1 and and pig dung (Fig. 4). Leachates of cow dung, pig dung, and
2 was used to derive the parameters k, mi , and l in Eq. (1). leaves showed the highest concentrations of SRP. The overall
Additional information is provided in Sect. S1 and Eq. (S8). background concentrations of N-NO3 were highly fluctuat-
Relationships among components (including co-leached nu- ing, high in concentration, and hardly influenced by leachate
trients) were tested individually and in different combina- additions. Most components declined during downstream
tions by adding factors of power functions according to the travel, while Hum-ter (C2) and Hum-micter (C3) increased
single factors in Eq. (1). The different combinations were during corn and leaf additions. Concentrations and fluores-
compared to the initial model and to the next simpler mod- cence tended to return to ambient conditions while travelling
els and were rated according to their BFs. When models with downstream. The BFs for an exponential decay during down-
specific variables did not improve the predictability of the ob- stream travel compared to a conservative behaviour (no con-
served data, they were rejected and are not presented in the centration change along the stream course) were 3.3 for DOC
Results section below. By doing that, we determined models and larger than 107 for all DOM components and SRP. Thus,
with meaningful component relationships and derived BFs the evidence for an exponential decay curve was strong to
for each variable included, representing the strength of evi- decisive for these components. N-NO3 only exhibited a BF
dence to support this inclusion. of 0.03, which means that there is strong evidence that the
For comparisons of uptake velocities of all co-leached concentration was constant along the stream course during
nutrients and DOM fractions, we transformed the equation each sampling. The correlations of DOC, N-NO3 , SRP con-
from the nutrient spiralling concept (Stream Solute Work- centrations, and the fluorescence-based concentrations of the
shop, 1990) to derive vf for each nutrient and DOM com- DOM fractions can be found in Table 3.
ponent and between all pairs of sequent sampling points di-
rectly. Uptake velocities between nutrients and DOM frac- 3.3 Uptake velocities of bulk DOC and DOM
tions were compared using a Bayesian test for linear corre- components
lation (Jeffreys, 1998; Ly et al., 2016) implemented in the
R package BayesFactor (Morey et al., 2018) to be aware of Probability densities of DOC uptake velocities from corn
and avoid the effects of collinearity on the models calculated. leachate, leaf leachate, and cow dung leachate were narrow
Furthermore, the distributions of differences between vf of (Fig. 5), allowing for a clear distinction of vf between these
different DOM components and nutrients were calculated us- three leachates (Table 4). Here, corn leachate was taken up
ing a Monte Carlo simulation. In this way, we gained a prob- fastest, followed by leaf and cow dung leachate. During net-
ability distribution of differences that can be used to measure tle and pig dung leachate additions, the DOC peaks were
the evidence favouring a difference (motivated by the poste- lower (Fig. 4) and measurement errors had a stronger relative
rior distribution of the difference in means; Kruschke, 2013). influence, leading to broader posterior probability densities
(Fig. 5). This hampered a clear separation of the vf of nettle
and pig dung leachates from the other leachates’ vf probabil-
3 Results ities. Nevertheless, we can assume that the uptake velocities
of nettles and pig dung leachates did not exceed 6 mm min−1
3.1 PARAFAC components
and that they were faster than the vf of cow dung leachate.
We could successfully fit a six-component PARAFAC model Modelling vf of the different components and nutri-
(Fig. 3, Table 2). Leachates of pig and cow dung exhib- ents without considering interactions or influencing factors
ited high levels of tryptophan-like (Trp, C5) and tyrosine- showed that bulk DOC reflected the average uptake of the
like (Tyr, C6) compounds. Leaf leachate showed high peaks different DOM components. N-NO3 and Hum-mic (C1) were
of microbially produced humic-like (Hum-mic, C1) fluores- taken up slower, whereas SRP, Hum-micter (C3), and Trp
cence, which is assumed to represent low-molecular-weight, (C5) were taken up faster than the bulk DOC and all other
aliphatic DOM originating from microbial degradation. Am- components (Fig. 6, Table 5).
bient water was characterized by humic-like material from
terrestrial sources (Hum-ter, C2) and microbially processed 3.4 Influencing factors and component interactions
terrestrial DOM associated with agriculture (Hum-micter,
C3). Another humic-like fluorophore, which showed a simi- Differences between samplings using the same source can be
lar fluorescence to pure quinone, was identified in all sources caused by day-dependent characteristics, such as discharge
(Qui, C4). The ambient DOM composition resembled the and weather, or by differences in the leachate composition
leachate of pig dung. due to, e.g., degradation during storage. Hence, we tested
whether the date of the different experiments and/or the
https://doi.org/10.5194/bg-18-3103-2021 Biogeosciences, 18, 3103–3122, 20213110 M. Pucher et al.: Interactions of in-stream DOM and nutrient spiralling
Figure 3. Fluorescence spectra of the identified PARAFAC components.
Table 2. PARAFAC components and their comparison to other studies. The abbreviations and symbols used stand for the following: a:
ambient; m: corn; c: cow dung; l: leaves; n: nettles; p: pig dung; N: high; −: intermediate; and H: low.
Component Similar components in Interpretation Relative share in leachates
other studies
a m c l n p
Hum-mic (C1) G2 (Murphy et al., 2011), Microbial humic-like, DOM produced − H H N H −
C2 (Lambert et al., 2016b), during the microbial degradation of ter-
D2 (Shutova et al., 2014) restrial DOM within freshwaters
Hum-ter (C2) C2 (Lambert et al., 2016a), Terrestrial humic-like, high-molecular- N H N H H N
F3 (Heibati et al., 2017) weight and aromatic compounds of ter-
restrial origin
Hum-micter (C3) C5 (Lambert et al., 2017), Microbial humic-like, positively corre- N H H H H N
C4 (Williams et al., 2010), lated with bacterial activity and crop-
C5 (Williams et al., 2013) lands in the catchment, associated with
microbial transformation of terrestrial
organic matter
Qui (C4) C2 (Yamashita et al., 2011), Humic-like, A and C peaks, terrestrial − N N − N −
C2 (Garcia et al., 2015) origin, with an aromatic chemical na-
ture, may be derived from old soil or-
ganic matter, some similarity to pure
quinone
Trp (C5) C7 (Stedmon and Markager, 2005), Tryptophan-like fluorescence, peak al- − − N − − N
C6 (Murphy et al., 2011) most identical to free tryptophan, de-
rived from autochthonous processes,
correlated to terrestrial fluorescent ma-
terial in forested catchments
Tyr (C6) G7 (Murphy et al., 2011), Tyrosine-like, suggested as degradation H − N N N −
C3 (Yamashita et al., 2013), products of peptides/proteins
J3 (Wünsch et al., 2015)
Biogeosciences, 18, 3103–3122, 2021 https://doi.org/10.5194/bg-18-3103-2021M. Pucher et al.: Interactions of in-stream DOM and nutrient spiralling 3111
Figure 4. Measured concentrations of DOC, SRP, and N-NO3 , and Raman units (RUs) of DOM fractions along the stream course for the
different samplings. The values are corrected for dilution effects (see also Table S1 in the Supplement). Arrows show the general trend of
the concentrations/RUs from up- to downstream. The ambient concentrations were interpolated from measurements taken between leachate
additions and are visualized as grey ribbons (see Table S1 for ambient conditions and additional amounts from leachate additions at the
upstream station).
Table 3. Linear correlation of nutrient concentrations and DOM fraction fluorescence; BFs in brackets; only shown if BF > 1.
Hum-mic (C1) Hum-ter (C2) Hum-micter (C3) Qui (C4) Trp (C5) Tyr (C6) DOC
Hum-micter (C3) 0.87 (5.47) 0.62 (2.34)
Qui (C4) 0.86 (3.25) 0.59 (1.46)
Trp (C5) 0.73 (2.45) 0.87 (8.22)
Tyr (C6) 0.58 (1.03)
DOC 0.56 (1.38) 0.80 (12.62) 0.91 (8.83)
SRP 0.47 (1.18) 0.69 (4.74) 0.37 (1.35) 0.41 (1.99)
Table 4. Comparison of vf of DOC depending on leachate source source significantly affected the uptake of the bulk DOC, the
by the BF of one vf being lower than the other one. Additionally, DOM components, and the leached nutrients. Hum-mic (C1)
the table presents median values of the vf distributions in millime- retention was substantially (BF 4.6) and Trp (C5) retention
tres per minute. was decisively (BF 134.2) influenced by the addition date.
Bulk DOC and Tyr (C6) retentions were influenced by both
vf median BF for vf (row) < vf (column)
the DOM source and the date. However, for bulk DOC reten-
in mm min−1 Leaves Nettles Pig dung Corn tion, the source had a stronger effect (BF 1563) than the date
Cow dung 0.66 981 7.04 650 > 1000 (BF 146), while the reverse was true for Tyr (BF 10.7 and
Leaves 2.08 1.40 7.33 38.7 108 for source and date, respectively). Hum-ter (C2), Hum-
Nettles 2.42 2.24 2.74 micter (C3), and Qui (C4) as well as SRP and N-NO3 showed
Pig dung 3.37 1.19 conservative uptake behaviour independent of the source or
Corn 3.54
the addition date (BF < 1; see also Table S3).
To further disentangle the interaction effects between nu-
trient and DOM component uptake, as proposed in Eq. (1),
https://doi.org/10.5194/bg-18-3103-2021 Biogeosciences, 18, 3103–3122, 20213112 M. Pucher et al.: Interactions of in-stream DOM and nutrient spiralling
Table 5. Comparison of vf of DOM components and nutrients by the BF of one vf being lower than the other one. Additionally, the table
presents median values of the vf distributions in millimetres per minute.
vf median BF for vf (row) < vf (column)
in mm min−1 Hum-mic (C1) Hum-ter (C2) DOC Qui (C4) Tyr (C6) Hum-micter (C3) SRP Trp (C5)
N-NO3 0.73 1.60 2.98 3.21 3.52 3.97 6.66 133 38.4
Hum-mic (C1) 0.82 4.73 4.91 5.61 7.68 20.8 > 1000 42.9
Hum-ter (C2) 1.10 1.10 1.18 2.66 6.28 255 25.0
DOC 1.11 1.16 2.51 6.06 235 24.6
Qui (C4) 1.12 2.65 7.56 613 24.2
Tyr (C6) 1.27 3.88 42.9 17.1
Hum-micter (C3) 1.56 10.8 7.44
SRP 2.63 1.58
Trp (C5) 2.76
concentration improved the Hum-mic (C1) model even more
than including the addition date (Table 6). Furthermore, we
found several attenuating or stimulating effects among dif-
ferent components. Bulk DOC uptake velocity was lower at
higher Tyr (C6) concentrations, although there is strong ev-
idence that the leachate source variable offers a better ex-
planation. Hum-ter (C2) retention was stimulated by higher
DOC concentrations, and Qui (C4) retention decreased with
increasing Hum-mic (C1). The Trp (C5) retention decreased
with Hum-ter (C2), but the inclusion of this interaction could
not outperform the model with the sampling date included.
Figure 5. Posterior density distribution curves of uptake velocity Tyr (C6) was also retained more slowly with higher fluores-
vf of DOC depending on the leachate source. cence of Hum-ter (C2). While the Tyr (C6) model including
the interaction with Hum-ter (C2) improved decisively com-
pared to the simple model without interaction terms, the best
performance could still be reached with the Tyr (C6) model
including the sampling date. For Hum-micter (C3) and N-
NO3 , no effects of other variables could be identified with
our models (Table 6, additional information in Tables S2 and
S4).
We also analysed correlations between the uptake veloc-
ities of different DOM components to check for concurrent
retention, indicating interrelations among or dependencies of
different microbial processes, such as the combined need of
these substances in the microbial metabolism (Table S2). We
found a positive correlation between the vf of Qui (C4) and
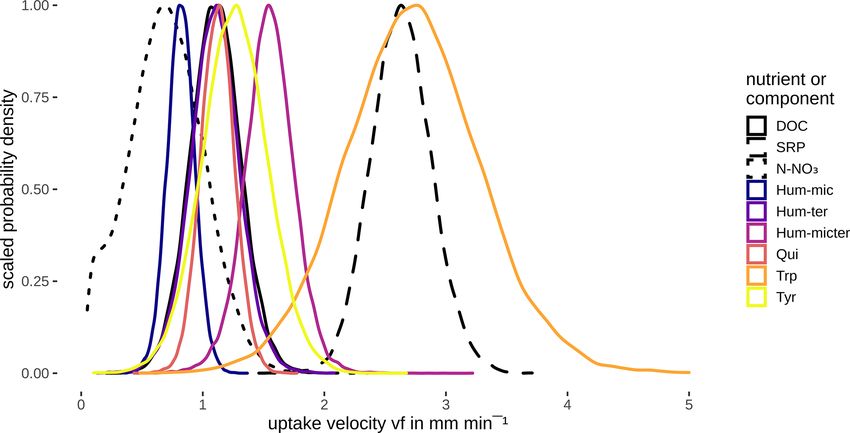
Figure 6. Posterior density distribution curves of uptake velocity the vf of Tyr (C6) and DOC.
vf for different compounds and nutrients.
3.5 Brief propagation of uncertainty
component concentrations or fluorescence and wetted width The simulated probability density of the residuals (Fig. S1)
were included and evaluated in the models (Eq. 1; for details, was compared to the instruments’ expected accuracy for
see Sect. S1 and Eq. S8 in the Supplement). DOC and SRP. The models depended on three measured val-
Efficiency loss effects (i.e. decreasing uptake velocities ues (Cx,t , Camb,t , Cx−1,t ). So we multiplied the instrument
of one component with increasing concentrations or fluo- errors by 3 to get the effect of their uncertainty on the model
rescence of the same component) were observed for SRP, results. For DOC measurements with an accuracy of 2 %,
Hum-mic (C1), Qui (C4), Trp (C5), and Tyr (C6) (Table 6, three of our concentrations at around 2000 µg L−1 would
Fig. 7). The uptake velocities of both SRP and Hum-mic (C1) have an approximate effect of 120 µg L−1 on the model un-
also increased with wetted width. Including wetted width and certainty. The 95 % probability interval of the model resid-
Biogeosciences, 18, 3103–3122, 2021 https://doi.org/10.5194/bg-18-3103-2021M. Pucher et al.: Interactions of in-stream DOM and nutrient spiralling 3113
Table 6. Interactions between uptake velocity and concentrations of other nutrients or DOM components using the INSBIRE approach. vf :
uptake velocity; k: uptake rate factor; w: wetted width; Ci : fluorescence of PARAFAC components; mi : exponent of relation; l: additive
parameter.
Fraction/ Most probable model Bayes BF vs. Estimates of
nutrient (Eq. 1) R2 vf parameter values
Hum-mic (C1) vf = kwC1mc1 0.60 16.74 k = 2.11
mc1 = −0.38
Hum-ter (C2) vf = k(l + DOCmc ) 0.34 7.69 K = 0.11
l = 3.16
mc = 0.32
Hum-micter (C3) vf = vf – – –
Qui (C4) vf = kC1mc1 C4mc4 0.44 3.13 K = 0.71
mc1 = −0.25
mc4 = −0.35
Trp (C5) vf = kC2mc2 C5mc5 0.30 3.87 k = 0.85
mc2 = −0.44
mc5 = −0.55
Tyr (C6) vf = kC2mc2 C6mc6 0.45 1.51 × 10⁷ k = 0.27
mc2 = −0.23
mc6 = −0.96
DOC vf = kC6mc6 0.28 10.50 k = 0.30
mc6 = −0.62
NO3 vf = vf – – –
SRP vf = kwSRPmp 0.63 1.45 × 10⁴ k = 26.18
mp = −0.31
uals (mixed model including leachate source) was between 4 Discussion
−172 and 131 µg DOC L−1 , which is already close to the er-
ror assumed from the measurements. Hence, the information 4.1 Uptake of bulk DOC from different sources
drawn from the DOC data is exhausted, and we do not expect
a more sophisticated model to reveal further details. In con- The uptake velocity of bulk DOC varied between leachate
trast, the instrument accuracy for SRP was 0.3 µg L−1 , while sources (Fig. 5), as observed in previous studies (e.g. Bern-
the 95 % probability interval of the residuals was between hardt and McDowell, 2008; Mineau et al., 2016; Mutschlec-
−4.74 and 4.85 µg L−1 for the model including wetted width ner et al., 2018). However, in contrast to our original hypoth-
and SRP concentration (Table 6). Since the model residu- esis, neither a high-SRP content nor an increased amount
als are higher than the assumed effect of the measurements, of low-molecular-weight protein-like compounds could be
the SRP model still has potential for improvement by, e.g., linked to higher vf of bulk DOC (Table 2). Cow and pig
adding other meaningful variables not measured in this study dung leachates, for example, both had high peaks of the
or by increasing the number of observations. Similar uncer- tryptophan-like component C5, which showed the fastest up-
tainty analysis of the PARAFAC components is unfortunately take of all DOM fractions, indicating a high bioavailability.
not feasible because there is no conventional way of calcu- Nevertheless, cow dung leachate was taken up most slowly,
lating the accuracy of the sample loadings of a PARAFAC while pig dung leachate was among the leachates with the
model. fastest uptake. Corn leachate showed the highest uptake of
all sources, while the uptake velocity of leaf leachate was
intermediate. Interestingly, the same sequence of increasing
uptake velocities from cow dung leachate to leaf and corn
leachate was observed in a laboratory flume experiment us-
ing the same organic matter sources as this field study but
different sediments (Weigelhofer et al., 2020). However, in
that study, DOC uptake was positively influenced by the
https://doi.org/10.5194/bg-18-3103-2021 Biogeosciences, 18, 3103–3122, 20213114 M. Pucher et al.: Interactions of in-stream DOM and nutrient spiralling Figure 7. Simulated change of uptake velocity vf with variation of one variable using the fitted models from Table 6. The colours show the 50 % (violet) and the 90 % (yellow) probability intervals. SRP concentrations in the leachates. Comparisons with the Long-term fertilization of trees, for example, resulted in an literature are difficult, as other field and laboratory stud- increased DOC uptake of leaf leachates due to their increased ies have used various organic matter sources. Among those, P content (Mutschlecner et al., 2018). Reported uptake ve- leaf leachates have been used most frequently so far. Leaf locities for leaf leachates range from 0.002 to 7.8 mm min−1 , leachates show a wide range of biodegradability, depend- showing a high variability among leaf sources and aquatic ing on the species, the region, the pre-treatment, and the de- systems (review by Mineau et al., 2016; Graeber et al., 2019). composition or leaching stage (e.g. Wickland et al., 2007). The median vf of our leaf leachate was 2.08 mm min−1 Biogeosciences, 18, 3103–3122, 2021 https://doi.org/10.5194/bg-18-3103-2021
M. Pucher et al.: Interactions of in-stream DOM and nutrient spiralling                                                        3115

and thus lies within this range. Regarding the other sources        e.g., Oviedo-Vargas et al., 2013; Weigelhofer et al., 2020).
used in our study, we only found one addition study using           In general, the bioavailability of a fraction does not only de-
cow manure (Kuserk et al., 1984). There, the median up-             pend on the chemical composition but also on the ecosys-
take velocity was slightly lower (0.31 mm min−1 ; calculated        tem and the involved microbial community (Kamjunke et al.,
in Mineau et al., 2016) than the one observed in our study          2015), the overall availability of different fractions and nutri-
(0.66 mm min−1 ).                                                   ents (Berggren and Giorgio, 2015; Bernhardt and McDowell,
                                                                    2008; Mutschlecner et al., 2018), and transport characteris-
4.2   Uptake of DOM fractions and nutrients                         tics (Ejarque et al., 2017). We performed the experiments in
                                                                    a small homogeneous stretch of a stream and already found
The various DOM fluorophores were retained with different           considerable variability in DOM fluorophore-specific uptake
uptake velocities, whereby the velocity density curves partly       between sampling dates. Thus, we propose that the bioavail-
overlapped (Fig. 6, Table 5). Hum-mic (C1), described as a          ability of DOM fractions and sources should be increasingly
product of microbial degradation of terrestrial organic mat-        determined in situ under different environmental conditions
ter, showed the lowest vf of all components. Hum-ter (C2;           to determine the effective biodegradability range of the re-
high molecular weight, aromatic), Qui (C4; aromatic), and           spective component.
Tyr (C6; tyrosine-like) showed large overlaps and exhibited
uptake velocities comparable to the bulk DOC, followed by           4.3   Relationships between uptake and concentrations
slightly higher uptake velocities for Hum-micter (C3). As ex-             of other compounds
pected, the fastest uptake was observed for the tryptophan-
like component Trp (C5), concordant with previous stud-             In contrast to our assumptions, we found no influence of
ies of different amino-acid-like fractions (Findlay and Sins-       the co-leached SRP on the bulk DOC uptake, although there
abaugh, 2003). Several studies report a high biodegradabil-         is evidence in other studies that DOC uptake can be stim-
ity of protein-like components, while humic-like, aromatic          ulated by P, especially in P-limited systems (Mutschlecner
components have proved to be much more refractory (e.g.             et al., 2018; Stutter et al., 2020). However, the molar C : P
Fellman et al., 2009a, b; Casas-Ruiz et al., 2017). However,        ratios were low in our stream, showing no P limitation. Fur-
in contrast to Trp (C5), the tyrosine-like Tyr (C6) showed          thermore, most P peaks during the additions were relatively
only medium uptake velocities. This may have been caused            small, containing only the leached P from the DOM sources.
by the release of Tyr (C6) as a degradation product of hu-          Thus, potentially stimulating effects of SRP on the DOC re-
mic substances during the experiment (Stevenson and He,             tention may have remained undetected. Although the source-
1990; Tsutsuki and Kuwatsuka, 1979). Other studies also re-         independent model showed a relationship between the bulk
port the generation of protein-like components during pas-          DOC uptake velocity and the Tyr (C6) fluorescence, the
sage through the system due to either the release of algal exu-     mixed-effects model, including the leachate source, showed
dates or the decomposition of humic substances (Casas-Ruiz          a higher probability of explaining the measured values. The
et al., 2017; Weigelhofer et al., 2020).                            better performance of the mixed-effects model indicates that
   The uptake of N-NO3 was the lowest of all components             other, probably non-fluorescent components, which we could
due to its high background concentrations in the water col-         not detect with our methods, influenced the bulk DOC uptake
umn exceeding even those of the ambient DOC (Fig. 4). In            apart from Tyr. Almost all DOM fractions showed a neg-
contrast, the co-leached SRP showed the highest uptake ve-          ative relationship between uptake and concentration of the
locity (together with Trp, C5). An equally fast uptake was          same component. Decreasing uptake velocities with increas-
observed in flume experiments, especially in the presence of        ing concentrations have been previously described for nitro-
algae (Weigelhofer et al., 2020). Despite the low-to-moderate       gen as nutrient efficiency loss (Dodds et al., 2002; O’Brien
background concentrations of P in the stream water (Fig. 4),        et al., 2007). This efficiency loss may occur especially in
background molar C : P ratios in the water column of our            streams where the microbial community is adapted to chronic
study stream were usually below 80 : 1, displaying an ideal         loading, showing high flexibility towards increasing nutrient
ratio for a vast number of bacterial strains (Cross et al., 2005;   (or DOC) concentrations and thus a delayed saturation (e.g.
Godwin and Cotner, 2018). The C : P ratios were even de-            O’Brien et al., 2007; Mulholland et al., 2009; Merseburger
creased by the additions to < 30 : 1 at point 1, followed by        et al., 2011). Furthermore, transport limitations between the
an increase to background ratios in the downstream sections.        source in the water column and the reactive sites in the sed-
While stoichiometry is a key factor for C, N, and P uptake          iments (e.g. due to eutrophication and sediment clogging)
(e.g. Cross et al., 2005; Gibson and O’Reilly, 2012; Stutter et     may lead to delays and reductions in the microbial response
al., 2020), we thus do not believe that stoichiometric control      to short nutrient peaks (Weigelhofer et al., 2018a, b; Teissier
played a significant role in the P uptake in our study stream.      et al., 2007; Ribot et al., 2013). Hum-mic (C2), Hum-micter
Instead, we assume that the co-leached P was taken up faster        (C3), and DOC retention showed no evidence of efficiency
than the DOC due to the P demand of both bacteria and algae         loss (BF was around 1) at the measured concentrations, in-
(in contrast to the exclusive OC demand of heterotrophs; see,       dicating that the microbial community would have been able

https://doi.org/10.5194/bg-18-3103-2021                                                    Biogeosciences, 18, 3103–3122, 2021
3116 M. Pucher et al.: Interactions of in-stream DOM and nutrient spiralling to retain more of these substances without a decline in up- The conductivity around 630 µS cm−1 , which was measured take velocity. So far, we have not found any other studies during the experiment, and the clay-dominated sediments presenting efficiency loss or any other uptake–concentration offered good conditions for adsorption (Theng, 2012). The relationship for DOM fractions. role of the sediment surface in the uptake of solutes is not Additionally, we observed both positive and negative in- surprising and has been observed elsewhere (Romani et al., teractions among different DOM fractions, with higher/lower 2004; Sabater et al., 2002; Battin et al., 2016). However, the uptake velocities of one component at increased concentra- component-specific influence of wetted width suggests that tions of another component. These interactions can have var- different DOM components are preferably taken up in differ- ious reasons and are, therefore, difficult to interpret. Posi- ent stream compartments. Unlike the common assumption tive effects on vf can arise, e.g., from the stimulation of the that uptake processes are dominated by the benthic commu- uptake of one substance by the presence of another through nity (Battin et al., 2016; Wiegner et al., 2005), Graeber et priming (but see critical discussion in Bengtsson et al., 2018). al. (2018) and Kamjunke et al. (2015) proposed a potentially Direct negative effects can be caused by the preferential up- important impact of planktonic bacteria on in-stream DOM take of one fraction over another (Brailsford et al., 2019) or uptake processes. In our study stream, such planktonic up- inhibitory effects between different substances (Freeman et take might have controlled the uptake of most DOM fractions al., 1990). Furthermore, the degradation of DOM can cause except Hum-ter (C1), where the substantial influence of wet- one molecule to break down into others, causing an increase ted width indicates the importance of the benthic community. of the degradation product, while the degraded component decreases (Kamjunke et al., 2017). In our study, the reten- 4.4 Potential and limitations of the INSBIRE approach tion of Qui (C4) was lower at higher Hum-mic (C1) flu- orescence. The molecular structures found in the literature The INSBIRE approach was only developed after the data (Stevenson and He, 1990; Tsutsuki and Kuwatsuka, 1979) from the experiment were acquired. Thus, our study repre- suggest that Qui (C4) is a product of Hum-mic (C1) degrada- sents a case study for the application of INSBIRE in the tion, resulting in reduced net retention due to simultaneous analysis of DOM uptake but does not claim to be a system- production and degradation processes. Similarly, Trp (C5) atic check of the developed approach. Nevertheless, we can and Tyr (C6) might have been degradation products of Hum- make some statements about the potential and the limitations ter (C2). In contrast, Hum-ter (C2) degradation was stimu- of INSBIRE. INSBIRE helped to reveal positive and nega- lated by high DOC concentrations, probably due to the sup- tive interactions among different DOM fractions previously ply of energy in the form of carbohydrates or other essential not possible in such detail. We based our model on concepts, components needed for degradation (Bengtsson et al., 2018; such as nutrient spiralling (Stream Solute Workshop, 1990) Bianchi et al., 2015). We also saw a weak probability that and Bayesian statistics, which have been investigated and de- the uptake velocity of Hum-ter (C2) was stimulated by Qui veloped for at least some decades. With this available knowl- (C4; BF = 1.9) and Tyr (C6; BF = 1.8). Based on the corre- edge, it was possible to develop the approach on a solid the- lation of the uptake velocities, we found substantial evidence oretical basis and with existing algorithms. However, INS- that Qui (C4) was degraded simultaneously with Tyr (C6; BIRE can be adapted to various research questions by chang- BF = 6.10) and bulk DOC (BF = 4.63). Good degradation ing the underlying equations, using different solving schemes conditions – such as low transport limitations (Weigelhofer et and different types of data. While we used fluorescence mea- al., 2018b), ideal stoichiometric C : N : P ratios of the organic surements to determine the DOM quality, INSBIRE can in- source for the microbial metabolism (Cross et al., 2005; God- corporate any other data of solvents (e.g. toxins or pesticides) win and Cotner, 2018; Stutter et al., 2018), or stretch-wise and methods (e.g. mass spectroscopy, liquid chromatogra- more productive microbial communities – can foster simul- phy). The power function has proven useful in our study, but taneous turnover (Guillemette and Giorgio, 2012). We con- the approach also facilitates the use of other equations. Due sider concurrent degradation and negative and positive inter- to the formal description of the uptake processes, extrapola- actions to be essential characteristics of the complex DOM tions to ambient or event-related concentrations can be per- degradation processes. Using the INSBIRE approach in fu- formed (Payn et al., 2005). ture experiments may help to elucidate which of the proposed The presented plots of the vf posterior density curves are mechanisms is responsible under certain environmental con- intuitive to interpret and can support our understanding of the ditions. retention processes. The presentation in the form of probabil- Our models also revealed some hydromorphological ef- ity distributions instead of single values reflects the hetero- fects on DOM fluorophore and nutrient uptake. The wetted geneity of ecosystems (McCarthy, 2007). For further stud- width could partly explain the uptake of Hum-mic (C1) and ies, these posterior density curves can be directly used as SRP, probably due to adsorption to sediments or extracellular prior information for similar models. The Bayesian nature polymeric substances playing a role in retaining these com- of the analysis allows even weak relations to be evaluated, pounds. The adsorption of humic substances to clay is gen- which can be tested in further experiments. We could also erally strong when the ionic strength is high (Theng, 2012). show the limitation of the bulk DOC retention model due to Biogeosciences, 18, 3103–3122, 2021 https://doi.org/10.5194/bg-18-3103-2021
You can also read