Assessment of the geomorphic effectiveness of controlled floods in a braided river using a reduced-complexity numerical model
←
→
Page content transcription
If your browser does not render page correctly, please read the page content below
Hydrol. Earth Syst. Sci., 24, 3229–3250, 2020
https://doi.org/10.5194/hess-24-3229-2020
© Author(s) 2020. This work is distributed under
the Creative Commons Attribution 4.0 License.

Assessment of the geomorphic effectiveness of controlled floods
in a braided river using a reduced-complexity numerical model
Luca Ziliani1 , Nicola Surian1 , Gianluca Botter2 , and Luca Mao3
1 Department of Geosciences, University of Padua, Padua, Italy
2 Department of Civil, Environmental and Architectural Engineering, University of Padua, Padua, Italy
3 School of Geography, University of Lincoln, Lincoln, UK

Correspondence: Nicola Surian (nicola.surian@unipd.it)

Received: 13 August 2019 – Discussion started: 30 September 2019
Revised: 30 April 2020 – Accepted: 14 May 2020 – Published: 22 June 2020

Abstract. Most Alpine rivers have undergone significant al-       1   Introduction
terations in flow and sediment regimes. These alterations
have notable effects on river morphology and ecology. One
option to mitigate such effects is flow regime management,        Human activities in riverine areas (i.e. river damming and
specifically through the reintroduction of channel-forming        engineering, gravel mining and land use change in the
discharges. The aim of this work is to assess the mor-            drainage basin) have historically led to notable changes in
phological changes induced in the Piave River (Italy) by          flow regimes (Gore and Petts, 1989; Poff et al., 1997, 2007;
two distinct controlled-flood strategies, the first character-    Magilligan and Nislow, 2005; Zolezzi et al., 2011; Magilli-
ized by a single artificial flood per year and the second         gan et al., 2013; Ferrazzi and Botter, 2019) and in the eco-
by higher-magnitude but less frequent floods. This work           logical (Collier, 2002; Céréghino et al., 2004; Paetzold et al.,
involved applying a two-dimensional reduced-complexity            2008; McDonald et al., 2010; Overeem et al., 2013; Espa
morphodynamic model (CAESAR-LISFLOOD) to a 7 km                   et al., 2015) and geomorphic functioning of river systems
long reach, characterized by a braided pattern and highly reg-    (Hicks et al., 2003; Petts and Gurnell, 2005; Melis, 2011; Zil-
ulated discharges. Numerical modelling allowed the assess-        iani and Surian, 2012; Magilligan et al., 2013; Mueller et al.,
ment of morphological changes for four long-term scenar-          2014; Lobera et al., 2016). Dam construction is now consid-
ios (2009–2034). The scenarios were defined considering the       ered a viable strategy to meet energy and water demands due
current flow regime and the natural regime, which was es-         to climate change and population growth (World Bank, 2009;
timated by a stochastic physically based hydrologic model.        Lehner et al., 2011). As outlined by Overeem et al. (2013),
Changes in channel morphology were assessed by measuring          large reservoirs with volumes greater than 0.5 km3 intercept
active-channel width and braiding intensity. A comparison of      globally more than 40 % of river discharge and ∼ 26 % of the
controlled-flood scenarios to a baseline scenario (i.e. no con-   sediments transported by the rivers, reducing global sediment
trolled floods) showed that artificial floods had little effect   delivery to oceans and commonly leading to coastal erosion.
on channel morphology. More channel widening (13.5 %) re-            Several metrics have been developed to assess the magni-
sulted from the high-magnitude flood strategy than from the       tude and temporal trends in alterations in river flow regimes
application of the other strategy (8.6 %). Negligible change      induced by hydraulic infrastructure (Richter et al., 1996,
was observed in terms of braiding intensity. The results in-      1997; Martínez Santa-María and Fernández Yuste, 2008; Yin
dicate that controlled floods do not represent an effective       et al., 2015). Additionally, extensive sediment monitoring ef-
solution for morphological recovery in braided rivers with        forts and sediment budget estimations have quantified sedi-
strongly impacted flow and sediment regimes.                      ment flux alterations (Surian and Cisotto, 2007; Schmidt and
                                                                  Wilcock, 2008; Melis, 2011; Trinity Management Council,
                                                                  2014; Espa et al., 2015). Several studies have documented
                                                                  the hydrologic impacts of extensive dam systems, in partic-

Published by Copernicus Publications on behalf of the European Geosciences Union.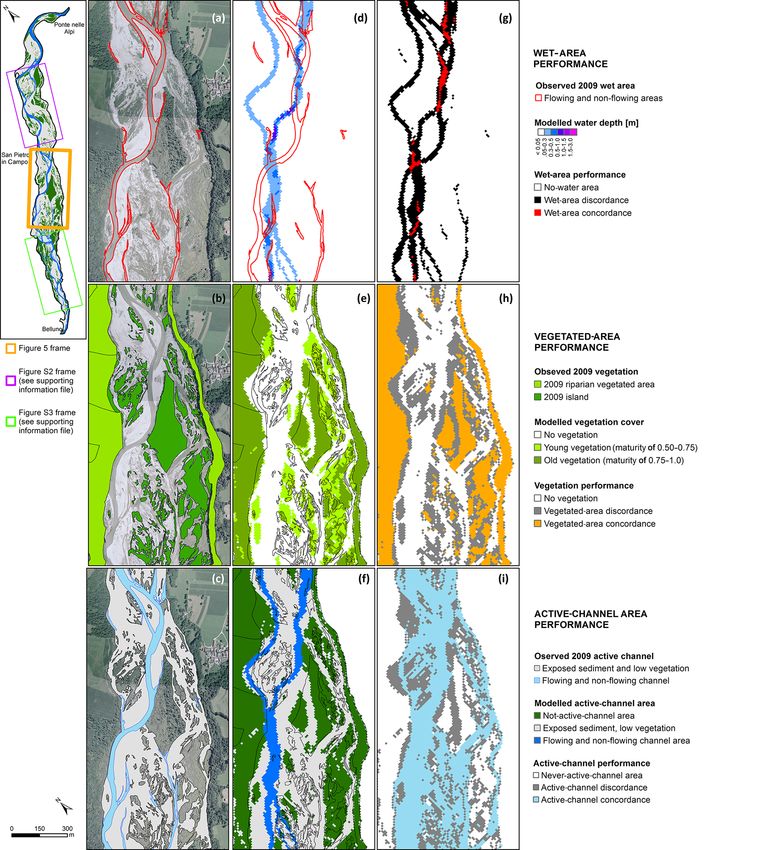
3230                   L. Ziliani et al.: Assessment of the geomorphic effectiveness of controlled floods in a braided river

ular in the Alpine region over the 20th century (Botter et         continuum (Bliesner et al., 2009; McDonald et al., 2010;
al., 2010; Comiti, 2012; Bocchiola and Rosso, 2014). Over-         Melis, 2011; Coulthard and Van De Wiel, 2013; Gaeuman,
all, flow regime alteration has implied significant changes in     2014).
flow magnitude, frequency, timing and duration, and thermo-           The evolutionary trajectory of channel morphology can
peaking (Gore and Petts, 1989; Frutiger, 2004; Zolezzi et al.,     be assessed using conceptual (e.g. channel evolution mod-
2009, 2011). The effects of damming on sediment flux have          els – CEMs, as described in Schumm et al., 1984; Si-
been assessed in reaches which were directly affected (Graf,       mon and Hupp, 1986; Simon, 1989), empirical (Lane, 1955;
1980; Williams and Wolman, 1984; Gaeuman et al., 2005;             Schumm, 1977; Rhoads, 1992) and numerical models, ei-
Petts and Gurnell, 2005; Schmidt and Wilcock, 2008; Grant,         ther computational-fluid-dynamic (CFD) models or reduced-
2012), as well as in lowland gravel-bed rivers affected by cas-    complexity models (RCMs; Larsen et al., 2014). Previ-
cading connected reservoirs and other human disturbances at        ous applications of RCMs on braided rivers have focused
the basin scale (Rinaldi and Simon, 1998; Surian and Rinaldi,      mainly on theoretical scale-independent analysis (Murray
2003; Bilotta and Brazier, 2008; Surian et al., 2009b; Zaw-        and Paola, 1994), laboratory experiments (Doeschl-Wilson
iejska and Wyżga, 2010; Ziliani and Surian, 2012; Scorpio et      and Ashmore, 2005; Doeschl et al., 2006; Nicholas, 2010) or
al., 2015).                                                        short gravel-bed river reaches (Coulthard et al., 2002, 2007;
   It is widely acknowledged that reduced sediment flux due        Thomas and Nicholas, 2002; Thomas et al., 2007; Van De
to dam construction or sediment supply alteration at the           Wiel et al., 2007). In this study, as in Ziliani et al. (2013)
basin scale (e.g. due to afforestation or torrent control works)   and Ziliani and Surian (2016), we apply an RCM model
produces channel changes, namely, narrowing, incisions, re-        at mesospatial (i.e. 5–50 km) and mesotemporal (i.e. 10–
duced braiding intensity and the coarsening of bed sedi-           100 years) scales. In particular, the CAESAR-LISFLOOD
ment. There has been increasing attention since the 1970s          model (Bates et al., 2010; Coulthard et al., 2013) is applied
on the environmental effects of large dams (Turner, 1971;          to a 7 km long braided reach of the Piave River (Italy), one
Vörösmarty et al., 2003). Different river management strate-       of the most heavily and historically regulated river systems
gies have been adopted to address dam-related impacts using        in Italy.
structural, operational (e.g. Kondolf et al., 2014) or process-       We applied the CAESAR-LISFLOOD model (hereafter C-
based approaches to restore water and sediment fluxes (Wohl        L) to assess the morphological effects of two flow regime
et al., 2015a). Flow releases from dams have been regulated        management strategies. The first is characterized by yearly
to reproduce aspects of natural regimes (flow and sediment),       controlled floods with peaks capable of transporting sedi-
via increasing or recovering seasonal baseflow (McKinney           ments, while the second consists of less frequent higher-
et al., 2001; Sabaton et al., 2008), controlling the timing        magnitude floods (i.e. floods with 5-year recurrence inter-
and recession rates of releases (Rood et al., 2003; Shafroth       vals), released only when notable channel narrowing is ob-
et al., 2010), artificial gravel augmentation or sediment by-      served in the evolutionary trajectory. Both strategies have
passing (McManamay et al., 2013; Kondolf et al., 2014),            been developed according to two main criteria: (i) the max-
flood releases (Collier, 2002; Dyer and Thoms, 2006) and           imization of the flow regime re-naturalization, meaning that
experimental high-flow releases (Melis, 2011; Olden et al.,        the duration of the controlled flood (CF) is designed to ap-
2014). In other cases, management strategies have focused          proach natural conditions as much as possible, and (ii) the
directly on recovering morphological features by removing          feasibility of the strategy, which is verified by the fact that
dams (Poulos et al., 2014; O’Connor et al., 2015) or by            the cumulative volume released per year is less than the max-
mechanically removing vegetation (Environment Canterbury           imum volume in the reservoirs upstream from the studied
Regional Council, 2015).                                           reach.
   Environmental flow management plans are aimed at miti-             This paper addresses two main issues: (i) the effective-
gating undesired channel adjustments due to dam operations.        ness of controlled floods for the geomorphic recovery of a
Given the costs of these programmes, decision-makers are           strongly regulated braided river and (ii) the suitability and
increasingly requesting the scientific community to develop        reliability of the reduced-complexity CAESAR-LISFLOOD
appropriate tools capable of (i) identifying and controlling       morphodynamic model to reproduce the morphological evo-
the factors that cause channel alterations and (ii) assessing      lution of large gravel-bed rivers at given mesoscales. In the
the effectiveness of management programmes. Environmen-            first section of the paper, we provide a brief description of the
tal agencies in several countries require dam operations to re-    studied river reach. The second section presents the available
spect release protocols to mitigate adverse impacts on down-       data, the two models used, the morphodynamic CAESAR-
stream ecosystems (Schmidt and Wilcock, 2008; Olden and            LISFLOOD model (Bates et al., 2010; Coulthard et al., 2013)
Naiman, 2010; Watts et al., 2011; Konrad et al., 2012). Al-        and the hydrological model (Botter et al., 2007), and the
though successful empirical experiences do exist (Souchon          criteria to design the scenario strategy. The third section
et al., 2008; Konrad et al., 2011), robust predictive tools and    presents the results in terms of (i) historical morphological
models are urgently needed to predict channel responses to         river reach adjustments, (ii) flow regime alterations, (iii) the
dam operations and the interruption of the longitudinal river      CAESAR-LISFLOOD calibration and (iv) the simulations of

Hydrol. Earth Syst. Sci., 24, 3229–3250, 2020                                       https://doi.org/10.5194/hess-24-3229-2020
L. Ziliani et al.: Assessment of the geomorphic effectiveness of controlled floods in a braided river                       3231

three controlled-flood release scenarios. Finally, we critically   43 and 452 m and is 241 m on average, while the fluvial cor-
discuss the results and examine the strengths and weaknesses       ridor width, defined by the presence of Holocene fluvial ter-
of CAESAR-LISFLOOD and the effectiveness of the flow               races (Surian, 1996), ranges between 106 and 1110 m and is
management strategies under investigation.                         672 m on average. Previous studies (Surian, 1999; Surian et
                                                                   al., 2009c; Comiti et al., 2011; Picco et al., 2017) have out-
                                                                   lined that over the last 200 years, the studied reach has un-
2     General setting of the study area                            dergone notable lateral adjustments (narrowing up to 66 %)
                                                                   but with no significant changes in channel patterns. Two
2.1    The Piave River basin
                                                                   phases have been identified in terms of changes in bed levels,
The Piave River is located in northeastern Italy. It flows for     with first a phase of moderate incision (1970 to 1990s) fol-
about 220 km from the Alps to the Adriatic Sea (Fig. 1). The       lowed by a more recent phase (1990s to 2003–2007), during
basin area is about 3900 km2 , and its average elevation is        which the river has exhibited equilibrium or slight aggrada-
about 1300 m a.s.l. (maximum elevation is 3364 m a.s.l.). The      tion (Surian et al., 2009c; Comiti et al., 2011).
climate is temperate and humid, with average annual pre-
cipitation of approximately 1350 mm. Annual rainfall varied        3     Materials and methods
substantially over the 20th century but without any statisti-
cally significant trends (Surian, 1999).                           3.1    Channel morphology and the reconstruction of
   Like most Italian Alpine rivers (Surian and Rinaldi, 2003;             evolutionary trajectory
Surian et al., 2009c; Comiti, 2012), the Piave River has suf-
fered heavy human impact, which has altered the basin and          Channel morphology was analysed to gather (i) input data
river channel dynamics (Surian, 1999; Botter et al., 2010;         for the CAESAR-LISFLOOD model, (ii) data for model cal-
Comiti et al., 2011; Comiti, 2012). The Piave basin expe-          ibration and (iii) evidence of the evolutionary trajectory of
rienced a rapid increase in anthropogenic exploitation in          the studied reach. The river channel, islands, flowing chan-
the 20th century, with the construction of a series of dams        nels, bank protection structures and groynes were digitized
and reservoirs between the 1930s and 1960s. There are now          using the available aerial photos and terrain models covering
13 major reservoirs along the main stem and some tributaries       the studied reach (i.e. 2003 and 2009; Table 1). The analy-
(Botter et al., 2010). A complex regulation scheme is in place     sis employed ArcGIS 10.2. The flowing channels and bars
(for details see Surian, 1999; Botter et al., 2010) to maxi-       with little or no vegetation were merged to measure chan-
mize hydroelectric power production and provide irrigation         nel width. The braiding index was calculated using the aver-
water (Fig. 1). Flow regulation alters both flow duration and      age number of anabranches across the river (Ashmore, 1991;
the volume of annual runoff in the river. The reservoirs and       Egozi and Ashmore, 2008). The historical analysis of Comiti
diversions along the river and its tributaries also affect sedi-   et al. (2011), which covered the period of 1805–2006, was
ment transport and supply.                                         extended to 2009.
   The Piave basin has historically experienced strong                A lidar digital elevation model (DEM) was provided by
changes due to land use modifications. Since the 1950s, tra-       the Autorità di Bacino delle Alpi Orientali. It was created
ditional agricultural production on mountain slopes has been       using an airborne lidar survey in July 2003 (orthometric el-
abandoned largely because of the development of industry           evations adopted and vertical error estimate of ±20 cm), al-
and tourism, resulting in natural reforestation in the upper       most contemporary to an aerial photo used in this study (Ta-
parts of the basin (Del Favero and Lasen, 1993). In addi-          ble 1). Even though the river reach is characterized at low
tion to trapping by dams and reforestation, intense in-channel     flow by the presence of rather small inundated areas, it was
gravel mining has contributed to reducing sediment fluxes          not possible to obtain bed elevation in the flowing channel ar-
since the 1960s. Human pressure on river channel dynam-            eas with the standard lidar data. To obtain bed elevation, the
ics has also resulted from the construction of bank protection     water depth was estimated by applying the method proposed
structures and torrent control works, as a result of which the     by Bertoldi et al. (2011) using the 2003 aerial photos. This is
river can still move laterally, although the available width for   an optical remote sensing technique (Marcus, 2012) for re-
planform shifting is narrower than its natural braided belt.       trieving shallow-water depth information using the colour of
                                                                   the pixel. Legleiter et al. (2009) demonstrated that the log
2.2    Study reach                                                 transformation of the ratio of the green over the red band
                                                                   correlates linearly with water depth across a wide range of
The studied reach is ∼ 7 km long (Fig. 1) and is located be-       substrate types. The linear regression is usually calibrated by
tween Ponte nelle Alpi and Belluno (the drainage area at Bel-      direct measurement of water depths at the time of the aerial
luno is 1826 km2 ). The morphology of the reach is mainly          survey. Since such data were not available, we calibrated the
braided and wandering. The average slope is 0.47 %, and            regression coefficients by referring to the topography of the
the median surface grain size ranges between 18 and 32 mm          2003 and 2009 cross-section surveys.
(Tomasi, 2009). The active-channel width ranges between

https://doi.org/10.5194/hess-24-3229-2020                                       Hydrol. Earth Syst. Sci., 24, 3229–3250, 2020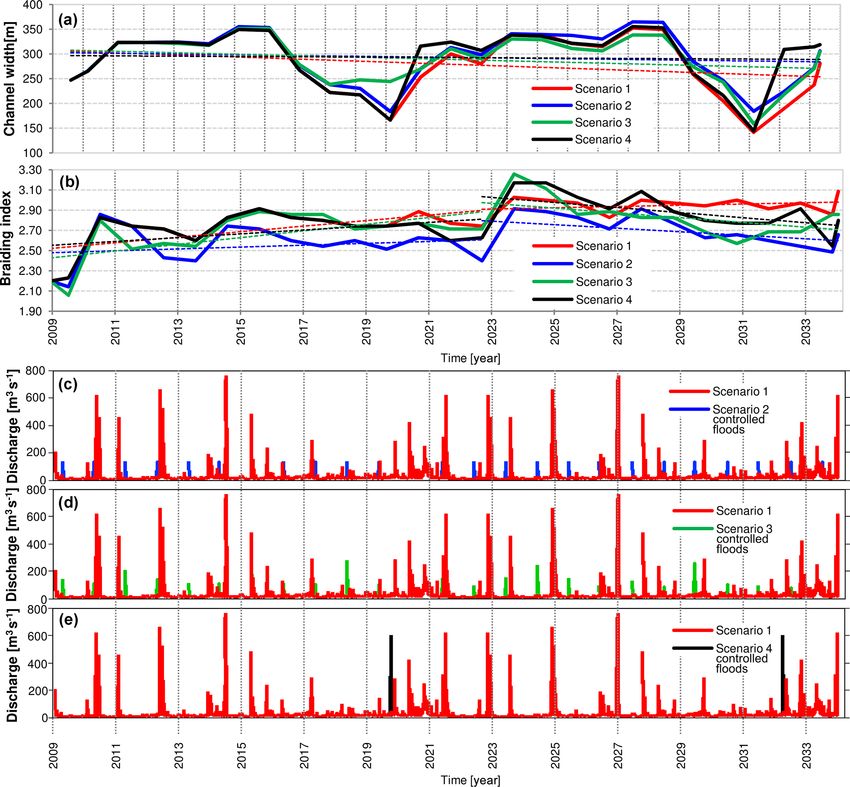
3232 L. Ziliani et al.: Assessment of the geomorphic effectiveness of controlled floods in a braided river
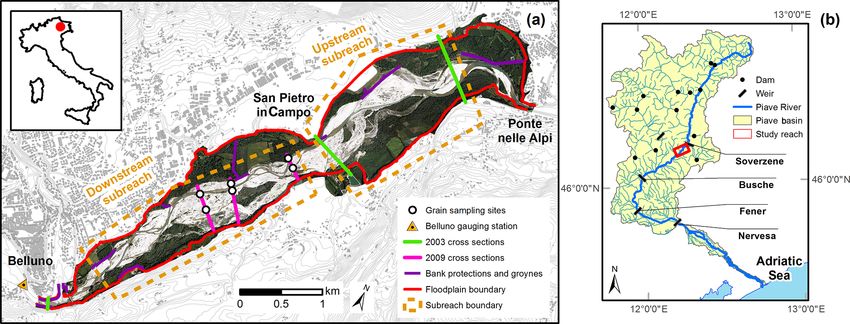
Figure 1. (a) Study reach location. (b) Water infrastructure system in the Piave basin.
Sediment grain sizes were surveyed in 2009 (Tomasi, density function (PDF) by means of climate, soil and veg-
2009) using volumetric sampling of the surface layer (Fig. 1). etation parameters. After applying a preliminary model to
A single probability density curve was extracted (D50 ∼ smaller unregulated sub-catchments (that allowed for prop-
24.5 mm, D15 ∼ 2 mm and D84 ∼ 77 mm) with nine size erly verifying the capability of the model to reproduce the
classes, as required by the C-L morphodynamic model. natural streamflow regime locally), the author applied the
model to several regulated sections of the Piave River, includ-
3.2 Analysis of the hydrologic regime of the Piave River ing Soverzene (about 5 km upstream from Ponte nelle Alpi;
Fig. 1), in order to evaluate the natural flow regime in reg-
There are several approaches to analyse the impact of the ulated cross sections and, based on the difference, the effect
regulation on the natural flow regime of rivers (Richter et of regulation on the statistical hydrographic features. The ap-
al., 1996, 1997; Martínez Santa-María and Fernández Yuste, proach conceptualizes the dynamics of daily streamflow as
2008; Yin et al., 2015). In the case of the Piave River, al- a sequence of peaks in response to rainfall and decays in
though several studies have investigated the degree of alter- between these jumps. These jump-decay dynamics are then
ation to its hydrological regime (Villi and Bacchi, 2001; Bot- linked to a catchment-scale soil–water balance in which the
ter et al., 2010; Comiti et al., 2011), such an analysis has been input is represented by stochastic daily rainfall. In this set-
hampered by (i) the lack of a long-term flow data series and ting, flow-producing rainfall events (that lead to streamflow
(ii) the difficulty in distinguishing between natural and artifi- jumps) result from the censoring operated by catchment soils
cial components of the flow regime. In Da Canal et al. (2007) on daily rainfall, which are modelled as a marked Poisson
and Comiti et al. (2011), flow records derived from two gaug- process with mean depth α and mean frequency λ. The pa-
ing stations (Busche and Segusino; Fig. 1) were modified us- rameter α identifies the average intensity of daily rainfall
ing a specific corrective factor (Villi and Bacchi, 2001) and events, while λ is the frequency of flow-producing events,
then merged. Comiti et al. (2011) confirmed that the largest which is less than the underlying precipitation frequency be-
flood event at Busche (Fig. 1) occurred in 1966 and reached cause of the effect of soil moisture dynamics and evapotran-
almost 4000 m3 s−1 . Furthermore, their analysis showed that spiration. As a consequence, several climate variables (such
discharges with a recurrence interval (RI) of 2 years were as rainfall attributes), as well as soil and vegetation proper-
not statistically different if calculated separately for pre- and ties, are embedded in λ. In this framework, streamflow re-
post-regulation periods (1954 was used as the separation date cessions between flow pulses are assumed to be exponential,
between the periods). However, the peak discharges of the with a mean rate equal to k, which defines the inverse of the
more frequent events (RI ≤ 1.5 years) decreased after 1954. timescale of the hydrological response (i.e. the mean water
Picco et al. (2017) reported similar outcomes. retention time in the upstream catchment). Under these as-
Botter et al. (2010) offered a more detailed analysis of sumptions, it can be shown that the steady-state PDF of the
the impact of regulation on river regimes with the applica- specific daily discharge (discharge per unit catchment area)
tion of physically based modelling to assess alterations in is a gamma distribution with shape parameter λ/k and scale
the streamflow regime observed in various cross sections parameter αk. The model is applied at the seasonal timescale,
of the drainage network downstream from dams and weirs. and then the annual PDF is calculated as the average of the
The authors applied an analytical stochastic model (Bot- four seasonal distributions. The presence of snow dynamics
ter et al., 2007) to characterize the streamflow probability
Hydrol. Earth Syst. Sci., 24, 3229–3250, 2020 https://doi.org/10.5194/hess-24-3229-2020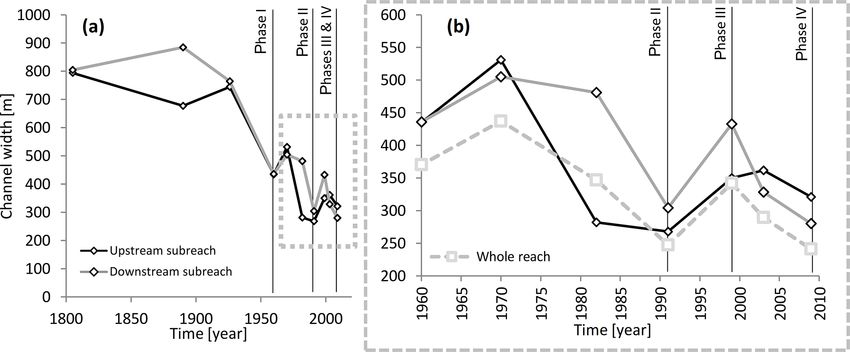
L. Ziliani et al.: Assessment of the geomorphic effectiveness of controlled floods in a braided river 3233
in winter in the uppermost regions of the catchment is ac-
Table 1. Summary of the data used for the historical adjustment analysis and modelling activity. DGPS: differential global positioning system; RTK: real-time kinetic; DEM: digital
counted for by reducing the size of the active contributing
The whole study reach
The whole study reach
The whole study reach
catchment and increasing the recession rates as described by
Schaefli et al. (2013), with an elevation threshold of about
1900 m a.s.l. In spring, a base flow value is added to the mod-
See Fig. 1
See Fig. 1
See Fig. 1
elled streamflow distribution, which corresponds to a rigid
Location
rightward shift of the PDF. The probability distribution of
natural daily streamflows estimated by the model is then
compared to the PDF of the observed daily flows to assess the
Six samples; volumetric method; sampled depth of 0.5 m
extent of the impact of regulation in the lower reaches of the
Piave River and to obtain guidelines for devising meaningful
Lidar DEM and DSM; grid dimension of 2 m
flow regime management strategies. In particular, the daily
streamflow series used in this study was recorded from 1995
to 2009 at the Belluno gauging station located at the down-
stream section of the studied reach (Fig. 1). The highest flood
event peaks observed in the reference periods (1996, 2000
RTK DGPS topographic survey
and 2002) were checked and modified, combining data from
Belluno and discharge measurements at the Soverzene weir
DGPS topographic survey
(Braidot, 2003).
Main characteristics
Resolution of 30 cm
Resolution of 15 cm
3.3 The CAESAR-LISFLOOD model
The application of hydro-morphodynamic physically based
numerical models (generally known as computational-fluid-
dynamic models – CFDs) over the last 20 years has mainly
been focused on idealized channel configurations at the lab-
5 August 2009
oratory scale (Wu et al., 2000; Defina, 2003; Rüther and
March 2009
5 July 2003
5 July 2003
Olsen, 2005; Abad et al., 2008) or the morphological dy-
July 2008
namics of natural channels over short time periods (Darby
2003
Data
et al., 2002; Chen and Duan, 2008; Li et al., 2008; Wang et
al., 2008; Zhou et al., 2009). The limited range of application
of these models reflects unresolved issues of data availability
Department of Geosciences, University of Padua
Department of Geosciences, University of Padua
and high computational demands (Escauriaza et al., 2017).
Only a few recent works (i.e. Nicholas, 2013a; Williams et
al., 2016) have shown that CFD models can be applied at
Autorità di Bacino delle Alpi Orientali
Autorità di Bacino delle Alpi Orientali
Autorità di Bacino delle Alpi Orientali
larger spatial and temporal scales. This limitation has led
to the development of alternative two-dimensional models
that are commonly referred to as cellular automata (Murray,
2007), cellular models (Murray and Paola, 1994; Coulthard
et al., 2002, 2007; Thomas and Nicholas, 2002; Parsons and
Fonstad, 2007; Van De Wiel et al., 2007), exploratory mod-
Tomasi (2009)
els or reduced-complexity models (RCMs; Murray, 2007;
elevation model; DSM: digital surface model.
Nicholas et al., 2006, 2012). These models have a common
solution to the problem, which is the adoption of simplified
Source
hydrodynamic and sediment transport equations derived by
abstractions of the governing physics.
A major advantage of RCMs is their computational effi-
Bed grain size measurements
ciency, which allows for simulating river evolution over his-
toric and Holocene timescales (e.g. Coulthard et al., 2002,
Cross-section survey
2005; Nicholas and Quine, 2007; Thomas et al., 2007;
DEM and DSM
Van De Wiel et al., 2007). However, the physical realism of
Aerial photos
these models has received relatively little attention (Nicholas,
2009, 2013b; Ziliani et al., 2013), and there have been only
a few studies that deal with the high sensitivity of these
Type
models to the grid resolution of the computational domain
https://doi.org/10.5194/hess-24-3229-2020 Hydrol. Earth Syst. Sci., 24, 3229–3250, 20203234 L. Ziliani et al.: Assessment of the geomorphic effectiveness of controlled floods in a braided river
(Doeschl-Wilson and Ashmore, 2005; Doeschl et al., 2006;
Nicholas and Quine, 2007). Despite the progress made in
several works (Nicholas, 2009, 2013a), there are still few ap-
plications to natural rivers characterized by complex channel
morphology (Ziliani et al., 2013; Ziliani and Surian, 2016).
In this study, we applied the CAESAR–LISFLOOD model
(1.2 version, reach mode; see the Supplement for details
about the model; Coulthard et al., 2013), which is an inte-
gration of the LISFLOOD-FP (Bates et al., 2010) and CAE-
SAR (Coulthard et al., 2007; Van De Wiel et al., 2007)
models. The C-L model links the hydraulics of the former
with the erosion and deposition components of the latter. Figure 2. (a) 1 June 1995–31 December 2009 hourly discharge
LISFLOOD-FP is a one-dimensional inertial model derived series used for the scenarios runs; (b) hourly discharge series
from the full shallow-water equations applied in the x and y measured at Belluno gauge station used for the calibration run
directions to simulate two-dimensional flow over a rasterized (5 July 2003–5 August 2009).
spatial domain (Bates et al., 2010). LISFLOOD-FP has been
successfully tested to simulate hydraulics in shallow-water
environments affected by strongly unidirectional flow (Bates cess and the number of parameters to be estimated (For-
et al., 2010; Neal et al., 2012; Coulthard and Van De Wiel, mann et al., 2007; Papanicolaou et al., 2008). Despite this
2013; Lewis et al., 2013; Skinner et al., 2015; Wong et al., intrinsic complexity, it is crucial to understand the limita-
2015) and for flood simulations characterized by rapid wet- tions and performance of RCMs (Aronica et al., 2002; Hall
ting and drying condition (Bates et al., 2010). The CAESAR et al., 2005; Lane, 2006), adopting methods that (i) can in-
model (Coulthard et al., 2007; Van De Wiel et al., 2007; Zil- clude all the limitations inherent in calibrating this type of
iani et al., 2013) represents the morphodynamic component model and (ii) are mainly based on field and remote sensing
of the integrated C-L model. Ziliani et al. (2013) submitted data (Nicholas, 2010). There are currently no standard inter-
CAESAR to a rigorous and objective performance evaluation national methods for the calibration and validation of fluvial
and found that CAESAR (i) can be a very powerful tool for morphodynamic models (Mosselman, 2012), and those pre-
modelling spatial and temporal scales that are not well sup- viously proposed are typically designed for hydrodynamic
ported by two-dimensional to three-dimensional morphody- CFD models (ASME, 1993; Lane et al., 2005). It must also
namic CFD models, (ii) can be very useful for setting “what- be kept in mind that a calibrated RCM model can be simply
if scenario” strategies over mesospatial and mesotemporal empirically adequate (Van Fraassen, 1980) and its validation
scales, and (iii) provides reliable bedload sediment budget is simply a confirmation (Oreskes et al., 1994) that cannot be
estimations. From a morphological point of view, Ziliani et considered conclusive (Haff, 1996; Lane et al., 2005; Mur-
al. (2013) showed that CAESAR can reproduce the average ray, 2007). Calibration of the C-L model was specifically ad-
change in channel width but performs poorly in reproduc- dressed by Feeney et al. (2020), who pointed out the need for
ing braided in-channel pattern dynamics and the typical to- reach-specific calibration to increase model performance.
pographic complexity of a braided river at low-water stages Given all of the above, the C-L was calibrated with ref-
(e.g. braiding intensity). LISFLOOD-FP and CAESAR have erence to the 5 July 2003–5 August 2009 period (Fig. 2)
been efficiently integrated and tested in the new CAESAR– by comparing the model output (i.e. morphological features
LISFLOOD model (see Coulthard et al., 2013, for details). such as channel boundaries, islands and wet-channel po-
The C-L model has been applied at reach (Feeney et al., sitions) to the digitized channel morphology based on the
2020) and catchment scales (Coulthard and Van De Wiel, 2009 aerial photos (see the Supplement for a detailed de-
2017), and Skinner et al. (2018) assessed the sensitivity of scription of the model calibration). The hourly discharge se-
the model. Feeney et al. (2020) used the model to reconstruct ries was used as an upstream flow boundary condition. At
geomorphic changes for 10 alluvial reaches in northern Eng- the downstream end of the reach, a constant energy slope
land and found that the model accurately reproduces channel was fixed at 0.0047 m m−1 , equal to the local bed slope.
and floodplain dynamics at mesotemporal scales. The initial bed sediment grain size was set according to
Tomasi (2009). Nine grain size classes were used to de-
3.4 Morphodynamic-model performance assessment fine the size distribution, which was considered homoge-
neous throughout the reach. Due to the lack of field estimates
Several works (Darby and Van De Wiel, 2003; Hoey et al., of bedload at the upstream end of the reach, we assumed
2003; Wilcock and Iverson, 2003) have emphasized the chal- the sediment recirculation option available in C-L (i.e. sed-
lenge of the proper calibration of process-based models in iment input equals the output at the downstream end of the
fluvial geomorphology due to the increasing uncertainty pro- reach). The model factor termed sediment proportion recir-
portional to the increased complexity of the modelled pro- culated (SPR) was assumed to be 1, which assumes that sed-
Hydrol. Earth Syst. Sci., 24, 3229–3250, 2020 https://doi.org/10.5194/hess-24-3229-2020L. Ziliani et al.: Assessment of the geomorphic effectiveness of controlled floods in a braided river 3235
iment load upstream is the same as it is downstream (i.e. sed- Mueller et al., 2014). The Trinity River (California, USA)
iment transport equilibrium condition). Vegetated areas (i.e. represents another excellent case study, in which morpholog-
islands and recent and old terraces covered by arboreal veg- ical goals were among the multiple flow objectives (Trinity
etation) and channelization structures (i.e. bank protection Management Council, 2014). Nevertheless, with the excep-
structures, groynes and levees) were digitized combining the tion of the lower Waitaki River in New Zealand, there are
2003 aerial photos and the lidar digital surface model (DSM; no examples of morphological recovery or conservation of
2 m grid dimension; Table 1). The vegetation cover was used braided rivers, and no controlled floods have been used on
as the initial modelled vegetation condition (maturity fixed the Waitaki (Hicks et al., 2003, 2006; Environment Canter-
at 1). The initial bed elevation was established using a 10 m bury Regional Council, 2015).
DEM cell obtained by resampling the 2003 lidar DEM (bi- Provoking controlled floods or removing vegetation are
linear interpolation; original cell dimension of 2 × 2 m). The costly and can preclude other actions, so it is worthwhile
10 m cell dimension was chosen to ensure a reasonable com- to assess these strategies and consider the morphological ef-
putational time for long-term scenario runs and for a spatial fects of different channel-forming discharges (Surian et al.,
resolution higher than previous works (e.g. 25 m in Ziliani et 2009a). Rathburn et al. (2009) stressed that flow releases
al., 2013). The DEM was corrected in the wetted areas (about from dams must exceed a series of thresholds to be mor-
8 % of the total spatial domain) through the application of phologically effective. Four discharge thresholds of increas-
the method proposed in Bertoldi et al. (2011) and forced to ing intensity should be identified in a morphological re-
be nonerodible in the areas occupied by both channelization covery and conservation plan, each capable of activating a
structures still effective in 2003 and undamaged structures specific morphological process: (i) the mobilization of in-
built since the 19th century. terstitial sediment essential for hyporheic exchange main-
tenance, (ii) the mobilization of the streambed to maintain
3.5 Flow regime management strategies natural bedforms, (iii) the inundation of overbank units (i.e.
berms, floodplains and terraces) to confine encroachment by
Water management of historically regulated rivers may be xeric plants, and (iv) the lateral channel mobility that can re-
oriented to restoring the flow regime to close to that before move senescent woody vegetation and create opportunities
impact, typically aimed at reactivating physical processes for seedlings to germinate and mature. Once each threshold
linked to specific components of the flow regime (Wohl, discharge value or range is quantified, the flow duration can
2011). Nevertheless, existing priorities in water resource use be tuned within the limits imposed by the available flow, us-
often limit the feasibility and effectiveness of flow regime ing the natural flow regime as a reference.
re-naturalization strategies, and in most cases the strategy is The flow regime management scenarios used in this work
merely reduced to the definition of a minimum volume of wa- were defined in reference to three flood threshold levels that
ter released for partial restoration goals. Olden et al. (2014) partially match those proposed by Rathburn et al. (2009):
systematically reviewed flood experiments to evaluate glob- (i) full in-channel transport discharge assumed to be capable
ally the success of this practice in flow regime management. of mobilizing interstitial sediment, (ii) the bankfull discharge
They considered 113 flood experiments in 20 countries and capable of maintaining natural bedforms and (iii) overbank
found that only 11 % of the case studies were aimed directly discharge capable of affecting the main lateral units by in-
at morphological effects, while around 80 % involved only undation. A field study conducted in the reach using painted
low-magnitude flow events. Most experimental flow releases sediments similar to those used in Mao and Surian (2010)
are focussed on biological variables (primarily fish), aquatic and Mao et al. (2017) resulted in an estimate of the first ref-
organisms (Konrad et al., 2011) and re-establishing vegeta- erence threshold at 80 m3 s−1 (RI < 1 year; full transport dis-
tion (Shafroth et al., 2010), rather than on abiotic factors (e.g. charge capable of mobilizing sediments, irrespective of their
channel morphology; Wohl et al., 2015b). What are termed size). The bankfull discharge was estimated using the cal-
“environmental flows” and “Green Hydro” are widely ac- ibrated C-L model and was approximated to the discharge
cepted concepts that refer mainly to the quantity, timing, du- filling the active channels and bars without overflowing onto
ration, frequency and quality of water flow releases, as re- the oldest island assumed to be morphologically equivalent
quired to sustain freshwater, estuarine and near-shore ecosys- to the recent fluvial terraces (Williams, 1978; Pickup and
tems according to social interests (Acreman and Ferguson, Rieger, 1979; Surian et al., 2009a). The bankfull discharge
2010; Rivaes et al., 2017). is about 500 m3 s−1 and corresponds to a 2.5-year RI, which
Thus, there have been few examples of flow regime recov- is consistent with other references in the literature (Leopold,
ery strategies with primarily morphological goals. The Col- 1994). Only > 1000 m3 s−1 floods were identified as capable
orado River below the Glen Canyon Dam represents the most of completely inundating the oldest island and overflowing
important exception. Several controlled floods (i.e. five high locally into recent fluvial terraces.
flood experiments) were released between 1996 and 2013 to Four simulation scenarios were considered, all covering
maintain and rehabilitate sandbars that occur in lateral flow the same 25-year period (2009–2034; Table 2). The first
separation eddies (Schmidt and Wilcock, 2008; Melis, 2011; scenario (i.e. baseline scenario, SC1) is the current con-
https://doi.org/10.5194/hess-24-3229-2020 Hydrol. Earth Syst. Sci., 24, 3229–3250, 20203236 L. Ziliani et al.: Assessment of the geomorphic effectiveness of controlled floods in a braided river
dition, characterized by a strongly altered flow regime. In 4 Results
this case, the discharge series for 1995–2009 (hourly data
at the Belluno gauge station) was repeated twice. Both sce- 4.1 Evolutionary trajectory of channel morphology
narios 2 (SC2) and 3 (SC3) used a flow regime strategy char-
acterized by one CF per year. The yearly CF in SC2 had a Using the available dataset on morphological changes of
constant value of 135 m3 s−1 (RI ∼ 1.08 years), which was the Piave River (Comiti et al., 2011), we reconstructed and
calculated as the average of the maximum annual floods updated the channel adjustments to 2009. The analysis fo-
observed in 1995–2009. This was higher than the refer- cused on two sub-reaches, upstream and downstream from
ence threshold discharge, i.e. the full in-channel transport San Pietro in Campo, respectively, where the river is nat-
discharge (80 m3 s−1 ). The yearly CF values for SC3 were urally more confined (Fig. 1). The reach was divided into
randomly selected above the threshold discharge using the two sub-reaches to better describe the morphological ad-
natural streamflow PDF estimated by the model (minimum justments over the 1800–2009 period. The trends in aver-
value of 80 m3 s−1 ; maximum value of 276 m3 s−1 ; RI of age width in the sub-reaches are similar and characterized
∼ 1.4 years). In this case, the average of all the CF values by four main adjustment phases (Fig. 3): (i) a first period
is equal to the yearly CF discharge for SC2, assuming val- (during the 19th century and the first half of the 20th cen-
ues included in the [80–276] m3 s−1 range. All the CFs had a tury) dominated by a braided pattern, with channel width
fixed duration of 5 d, according to the re-naturalization max- equal to about 80 % of the alluvial plain width, negligible
imization criteria. In SC2 and SC3, the cumulative likeli- morphological changes and the absence of a dominant pro-
hood to occur associated with the released peaks increased cess (i.e. channel widening or narrowing); (ii) a second phase
from 0.025 (actual observed altered regime) to 0.04, with of adjustment with channel narrowing of about 60 % from
the natural reference value being 0.14. Scenario 4 (SC4) was the 1950s to the early 1990s (the channel width of the entire
planned to represent a different management strategy, con- reach was 370 in 1960 and 247 in 1991), interrupted by a
sisting of larger CFs released by dams (constant value for large flood event in 1966 (RI of ∼ 200 years; Comiti et al.,
1 d) only following the observation of notable channel nar- 2011), which caused temporary widespread channel expan-
rowing. Specifically, we assumed 200 m to be a threshold for sion; (iii) a phase of channel widening during the 1990s (the
average channel width, considering the evolutionary trajec- channel width of the entire reach was 342 m in 1999), mainly
tory over the last 200 years and, in particular, the most in- related to the 1993 flood event, characterized by a 12-year RI
tense narrowing that took place in the early 1990s (Fig. 3). (Comiti et al., 2011); and (iv) the most recent adjustment
Based on channel width measurements taken by a 1-year phase characterized by channel narrowing. Focusing on the
step in the SC4 simulation, only two CFs were released, one last 20–25 years following the 2002 flood, the river entered a
in 2020 and the other in 2032. The released discharge was new phase (IV in Fig. 3) characterized by narrowing: chan-
fixed at 600 m3 s−1 (RI of 5 years), ranging between the sec- nel width in 2009 (i.e. 241 m) was the lowest observed in the
ond and the third reference threshold discharges discussed studied reach over the last 200 years. While widening dur-
above so that it would undoubtedly be capable of maintaining ing phase III was likely due to the termination of in-channel
in-channel bedform dynamics while completely avoiding any gravel mining (Comiti et al., 2011), the most recent narrow-
hydraulic risks and damages in the overbank units (i.e. recent ing phase (phase IV) was likely due to the absence of major
terraces), locally occupied by secondary roads and cultivated floods (see also Fig. 2).
fields.
All the CFs were released in November, while overlapping 4.2 Flow regime alterations
floods were avoided. All the scenarios made use of the same
model setting, which was obtained in the calibration phase, A comparison of the frequency distribution of observed daily
using the 2009 calibration output data in a raster format as streamflows at the Belluno cross section and the model-based
the initial boundary conditions (i.e. bed elevation, nonerodi- estimate of streamflow PDF under unregulated conditions
ble hydraulic structures, vegetation cover and grain size dis- (Fig. 4) shows the significant impact of regulation in the
tribution). As reported in Table 2, all the scenarios required lower reaches of the Piave River. The mean and the mode of
the release of a cumulative volume per year (i.e. per flood) the streamflow distribution are significantly reduced by an-
which was considerably less than the maximum volume in thropogenic exploitation of water resources (i.e. bypass flows
the reservoirs upstream from the studied reach (90.8 M m3 ). and diversions). Accordingly, the exceedance probability of
SC2 and SC3 required similar volumes of about 58 M m3 of moderate-to-high flows is significantly reduced under current
water, or around 1.45 × 10³ M m3 over the entire scenarios regulated conditions. In particular, the probability to observe
period. SC4 represents the last expensive scenario because it discharges larger than 80 m3 s−1 is reduced by about 1 order
needed 51.8 M m3 per year and 104 M m3 globally, 1 order of magnitude (i.e. from 0.14 to 0.025). Such results are cru-
of magnitude less than in the other scenarios. cial for setting the flow regime management scenario, since
(i) they show that a strategy aimed at improving the current
flow regime is needed and (ii) this strategy should compen-
Hydrol. Earth Syst. Sci., 24, 3229–3250, 2020 https://doi.org/10.5194/hess-24-3229-2020L. Ziliani et al.: Assessment of the geomorphic effectiveness of controlled floods in a braided river 3237
Figure 3. (a) Changes in channel width over the period of 1805–2009; (b) changes in channel width over the period of 1960–2009.
Table 2. Main hydrological characteristics of the four scenarios.
Scenario Controlled-flood Maximum Controlled- Recurrence Controlled- Cumulative Cumulative
release frequency controlled-flood flood peaks interval flood volume volume
peaks (m3 s−1 ) range (m3 s−1 ) maximum duration released released
controlled (d) per flood per scenario
flood (year) (Mm3 ) (Mm3 )
SC1 No releases No releases No releases – – 0 0
(baseline
scenario)
SC2 One per year 135 Constant 1.08 5 58.32 1.46 × 10³
SC3 One per year 276 [80–276] 1.4 5 58.18 1.45 × 10³
SC4 In case of average 600 Constant 5 1 51.84 1.04 × 10²
channel width
narrowing under
200 m (twice in
34 years)
sate the expected low morphological dynamism of the river 4.3 Calibration of the morphodynamic model
caused by the decreased occurrence of discharges capable of
mobilizing sediments and producing significant morphologi-
cal changes in the studied reach. The results of Ziliani et al. (2013) and Coulthard et al. (2013)
It is worth noting that the hydrological model underes- were used as a reference to calibrate the C-L model. Ac-
timates the frequency of the highest flows (i.e. discharges cording to the results of the sensitivity analysis in Ziliani
of more than 300 m3 s−1 ) because all the non-linearities of et al. (2013), the lateral erosion rate and maximum ero-
the hydrological response (e.g. the presence of different flow sion limit were the most sensitive factors that required ac-
components such as surface runoff) are neglected in this ver- curate tuning. The other factors (see Table 3), including the
sion of the model (Basso et al., 2015). As a consequence, main new parameters introduced in the C-L version, were
the probability associated with the highest flows in regulated tuned manually by trial and error (75 runs in total). Follow-
conditions is greater than the corresponding value estimated ing the performance evaluation techniques used by Ziliani
by the stochastic model for the natural setting. However, this et al. (2013), the calibration was based on performance in-
limitation of the model does not have any significant conse- dices developed specifically for data available in a raster for-
quences for the analysis carried out in this paper, provided mat (Bates and De Roo, 2000; Horritt and Bates, 2001). The
that the frequency of such high flows is relatively low. performance indices reported in Table 4 were calculated for
all the calibration runs at the end of the simulation (2009),
with these being (i) the vegetation performance index (Fveg ),
(ii) the wet-area performance index (Fwet ) and (iii) the active-
channel performance index (Fc ). In addition, several plani-
https://doi.org/10.5194/hess-24-3229-2020 Hydrol. Earth Syst. Sci., 24, 3229–3250, 20203238 L. Ziliani et al.: Assessment of the geomorphic effectiveness of controlled floods in a braided river
4.4 Channel response to flow regime management
strategies: scenario results
The channel adjustments induced by the different scenar-
ios were assessed by comparing active-channel width and
braiding intensity (BI) in each year (in February) using the
same techniques adopted in the calibration phase (Fig. 6).
The channel width in SC2, SC3 and SC4 was almost al-
ways greater than in SC1 (the baseline scenario). The aver-
age channel widening in SC2 and SC4 was similar through-
out the scenarios, being approximately 6.4 % (∼ 14 m), while
at the end of the scenarios (2034), widening was about
9 % (∼ 25 m) and 13.5 % (∼ 38 m) in SC2 and SC4, re-
spectively. SC3 induced slightly less widening, about 5.4 %,
throughout the period, and 8.6 % (∼ 24 m) at the end of the
simulated period. The maximum annual widening was ob-
served in SC4 (∼ 120 m in 2033), followed by SC3 (∼ 77 m
in 2020) and SC2 (∼ 43 m in 2032; Fig. 7).
Figure 4. Effect of the anthropogenic regulations in the Piave River
Results suggest that the CFs scenarios (SC2, SC3 and
at the Belluno cross section. Comparison between the PDF p(Q) (a)
and the cumulative distribution D(Q) (b) of observed streamflow SC4) and the baseline scenario (SC1) provide similar long-
in the period of 1995–2009 and the natural streamflow PDF and term morphological trajectories characterized by alternate
D(Q) predicted by the model developed by Botter et al. (2010). phases of widening and narrowing and notable changes in
active-channel width (width varies between 150 and 360 m).
Figure 7 shows that channel width oscillations take place
metric features were calculated, including the (i) average over a period of 6 to 7 years and have an amplitude of 160 m
active-channel width, (ii) equivalent wet-area width (Lw ) and in response to the alternation of periods characterized by
(iii) mean braiding index (Egozi and Ashmore, 2008). The floods of different magnitudes in the 2011–2015 and 2022–
results (see Table 4 and Figs. 5, S3 and S4) show a very 2028 periods, during which seven floods > 400 m3 s−1 (RI
good performance (performance class as defined in Henrik- of ∼ 1.9 years) occur, and the channel width follows a quasi-
sen et al., 2003; Allen et al., 2007) for both the vegetation steady trend and is greater than 300 m. Instead, channel width
cover (Fveg 69.7%) and the active-channel area (Fc 54.2 %). decreased during periods (2017–2021 and 2029–2031) af-
Output values of the active-channel width and braiding in- fected by lower-magnitude floods (maximum peak value of
dex confirmed these results. The difference between real and 200 m3 s−1 ). SC1 had a slightly decreasing trend over the en-
modelled 2009 active-channel width (6 m) is less than the in- tire 25 years (Fig. 7). Channel width has quasi-zero slopes in
put DEM cell size (10 m), and the modelled braiding index the CF scenarios, even if the channel width at the end of the
value (1.71) is very close to the real value (1.69). The model simulation is about [8.6 %–13.5 %] more than in the baseline
only performed poorly in reproducing the flowing channel scenario.
position (Fw of 15.7 %), which partially confirms the results The braiding indices of SC2, SC3 and SC4 were similar
of Ziliani et al. (2013). to or lower than that of SC1. SC4 was the most similar sce-
We estimated mean annual bedload sediment yield at the nario to that of SC1, with an average BI in-time value of 2.78,
downstream end of the reach and along the entire reach to which was slightly lower than that of SC1 (−1.5 %). Dif-
integrate morphological performance evaluations. Average ferences in BI were higher in SC2 than in SC1 (−7.3 %;
modelled bedload sediment yield in the 2003–2009 period BI value of 0.21; Fig. 7), although these differences were
was around 21.5×10³ m3 yr−1 . Modelled yield varies signif- small. The behaviour of braiding intensity was different from
icantly along the reach (up to 30 %), with higher yearly val- channel width in that there was one period (2009 to 2023)
ues in the sub-reach upstream of San Pietro in Campo. Max- with no clear oscillations and a clearly increasing trend, fol-
imum and minimum annual values differ significantly. The lowed by a decreasing or quasi-steady (SC1) period until the
2006 minimum is about 260 m3 yr−1 versus the 2008 maxi- end of the simulation. There is a non-linear correlation be-
mum of about 53.3 × 10³ m3 yr−1 . These sediment transport tween BI and flooding series magnitude or the CFs. In par-
values agree with estimates for gravel-bed rivers with simi- ticular, SC1 is the only scenario that did not show an inverse
lar characteristics to those of the Piave River reach (Martin trend after 2023, while the SC2 scenario anomalously had a
and Church, 1995; Ham and Church, 2000; Nicholas, 2000; consistently lower BI value steadily lower the other CF sce-
Liebault et al., 2008; Ziliani et al., 2013; Mao et al., 2017). narios, while SC3 and SC4 had very similar BI values.
Hydrol. Earth Syst. Sci., 24, 3229–3250, 2020 https://doi.org/10.5194/hess-24-3229-2020L. Ziliani et al.: Assessment of the geomorphic effectiveness of controlled floods in a braided river 3239 Figure 5. Model performance assessment at the end of the calibration runs (mid frame; see the Supplement for the others frames): (a) wet area, (b) vegetated area and (c) active channel digitalized using 5 August 2009 aerial photos; (d) overlay between modelled and observed flowing channel; (e) overlay between modelled and vegetated area; (f) overlay between modelled and observed active channel; (g) wet-area performance index calculation; (h) vegetated-area performance index calculation; and (i) active-channel performance index calculation. https://doi.org/10.5194/hess-24-3229-2020 Hydrol. Earth Syst. Sci., 24, 3229–3250, 2020
3240 L. Ziliani et al.: Assessment of the geomorphic effectiveness of controlled floods in a braided river
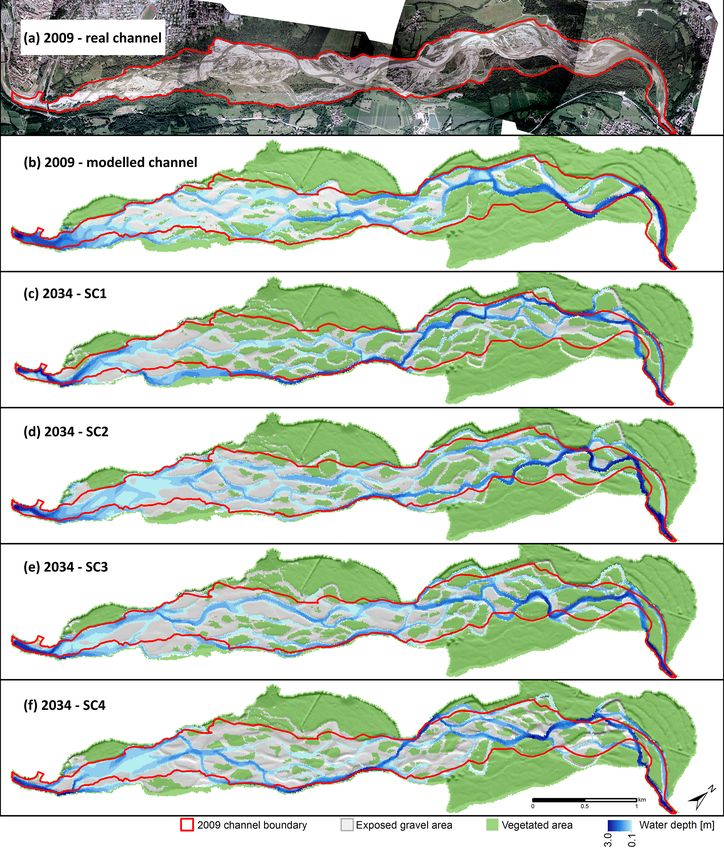
Figure 6. (a) 2009 real channel, (b) 2009 modelled channel used as starting point for the scenario runs; (c–f) results of scenarios 1–4 at the
end of the runs (2034).
5 Discussion in all four future scenarios (in the periods of 2015–2016
and 2028–2029) are close to the width in 1999; (ii) the mini-
5.1 Geomorphic effectiveness of controlled floods mum widths achieved in all future scenarios (2020 and 2032)
are less than 185 m (with the exception of the first minimum
Several insights can be obtained from comparing future sce- in scenario 3) and are significantly lower than the historical
narios to the historical evolutionary trajectory (Fig. 3), de- minimum observed in 2009 (241 m); (iii) despite a low con-
spite the evident mismatch between the temporal frequency fidence level, we can state that the trajectory between 1991
of the past and future channel width series (one value every and 2009 (phase III and IV described in Sect. 4.1) follows
16.5 years in the 1805–1970 period and every 6.5 years in the an oscillating evolution with half of the frequency of the os-
1970–2009 period; yearly values for the future series). It can cillation modelled between 2009 and 2034; and (iv) there is
be observed that (i) the maximum channel widths reached a good correlation between the variation of channel width
Hydrol. Earth Syst. Sci., 24, 3229–3250, 2020 https://doi.org/10.5194/hess-24-3229-2020L. Ziliani et al.: Assessment of the geomorphic effectiveness of controlled floods in a braided river 3241 Figure 7. Scenario results expressed in terms of channel width (a) and braiding index (b) variations, coupled to the simulated upstream inflow series with controlled-flood releases: (c) scenarios 1 and 2, (d) scenario 3 and (e) scenario 4. and the flow regime in the future scenarios, whereas this is The comparison of our four simulations shows that a few not always the case in the past evolution. This is exempli- high-magnitude floods provide slightly better morphological fied by the major 2002 flood event, which did not re-widen recovery and conservation than small yearly floods and at a the river to the levels of 1999 (about 342 m), despite being significantly lower operational cost. Therefore, SC4 is prefer- significant in terms of magnitude (13-year RI). Indeed, the able to SC2 and SC3 from a purely morphodynamic point of width the following year (2003) was approximately 289 m, view. Nevertheless, the comparison suggests that (i) none of about 15 % less than in 1999. This suggests that after a pe- the CF scenarios can significantly change long-term chan- riod (phases I and II in Fig. 3) of morphological instabil- nel width and braiding intensity trends and (ii) CF releases ity characterized by a narrowing tendency, the studied reach have no significant morphological benefits and do not rep- had acquired a new morphological equilibrium configura- resent a solution for the morphological recovery of braided tion characterized by periodic oscillations in channel width. rivers that suffered strong and historical impacts in terms of Similar new equilibrium conditions, mainly controlled by the flow and sediment supply regimes. It is worth noting that flow regime (i.e. frequency and magnitude of formative dis- the selected CFs are feasible, i.e. taking into account the wa- charges) and vegetation establishment, have been observed ter infrastructure in the Piave River basin, and it is unlikely in the Tagliamento River (Ziliani and Surian, 2016). that higher-magnitude or more frequent floods could be re- https://doi.org/10.5194/hess-24-3229-2020 Hydrol. Earth Syst. Sci., 24, 3229–3250, 2020
3242                   L. Ziliani et al.: Assessment of the geomorphic effectiveness of controlled floods in a braided river

Table 3. Description of the CAESAR-LISFLOOD model calibrated factors.

                         Factora                                                              Investigated range          Calibration
                                                                                                Min             Max             setting
                         Lateral erosion rate (–)                                             0.002             600                 30
                         Maximum erosion limit (m)                                            0.001           0.075               0.01
                         Active-layer thickness (m)                                           0.004            0.28               0.04
                         Number of passes for edge-smoothing filter (–)                          30             200                150
                         Water depth above which erosion can happen (m)                        0.01            0.15               0.15
                         Bedload solid transport formulab                                          0               1                  1
                         Vegetation critic shear (N m−2 )                                        0.7            180                 0.9
                         Vegetation maturity (year)                                            0.06               20                  4
                         Courant number (–)                                                      0.1             0.7                0.2
                         Input–output difference allowed (m3 s−1 )                                 1               5                  5
                         In-channel lateral erosion rate (N m−2 )                                  1              30                 10
                         Slope for edge cellsc (–)                                                 –               –             0.005
                         Sediment proportion recirculatedd (–)                                     –               –                  1
                       a All factors are configurable using the graphical user interface; b 0 – Einstein (1950) formula; 1 – Wilcock and
                       Crowe (2003) formula; c factor not included in the old CAESAR model version; d factor not calibrated.

Table 4. Results of CAESAR-LISFLOOD calibration.

                                                                                                        Observed         CAESAR-
                                                                                                            active      LISFLOOD
                                                                                                          channel            result
                                                                                                             2009
                                                                                                       (rasterized
                                                                                                           data at
                                                                                                       10 × 10 m)
                         Active-channel width (m)                                                             241                 247
                         Active-channel width change in 2003–2009 period (m)                                  −35                −29
                         Wet-area width (m)                                                                     51                 66
                         Braiding index (channel counted)                                                     1.69               1.71
                         Performance of active channel (%)                                                                     54.2 %
                         Performance of vegetated area (%)                                                                     69.7 %
                         Performance of wet area (%)                                                                           15.7 %

leased. These results partially confirm the outcomes of Hicks                       part) of non-strategic bank protections along the reach. How-
et al. (2003) on the Waitaki River, a gravel-bed river with                         ever, as Picco et al. (2017) suggested, this kind of strategy
similar characteristics to those of the Piave River. The au-                        should be a last resort, since these structures are still viewed
thors state that the frequent release of “channel maintenance                       by local populations as necessary to protect riparian wood-
floods” from dams should be pursued if wider and more ac-                           lands that are highly appreciated for recreation and timber
tive channels are desired. Hicks et al. (2003) showed that this                     production.
kind of strategy has been unsuccessful and only multi-year                             Overall, this work gives useful insights for the manage-
high-magnitude CFs can produce effective channel widen-                             ment of the Piave River and, in general, for the management
ing.                                                                                of braided rivers with heavily impacted flow and sediment
   The cost of CFs is probably less than that of alterna-                           regimes: (i) none of the tested controlled-flood strategies can
tive strategies focused on increasing sediment supply, such                         significantly change ongoing morphological evolution and
as sediment augmentation, because flood releases often do                           (ii) the baseline scenario, without controlled-flood releases
not require redesigning reservoir structures. Nevertheless, the                     (i.e. the no-action strategy), provides a similar morphologi-
reintroduction of flood flows implies a “loss” of resources                         cal evolutionary trajectory to that induced by the controlled-
stocked for other purposes (e.g. hydroelectric production and                       flood release scenarios. Therefore, a main outcome is that
the supply of drinking or irrigation water). Another feasible                       controlled-floods (including high-magnitude floods; e.g. 5-
way for sediment augmentation is the removal (at least in                           year RI) may not have any significant effects on regulated

Hydrol. Earth Syst. Sci., 24, 3229–3250, 2020                                                               https://doi.org/10.5194/hess-24-3229-2020
You can also read