Drivers of population divergence and species differentiation in a recent group of indigenous orchids (Vanilla spp.) in Madagascar
←
→
Page content transcription
If your browser does not render page correctly, please read the page content below
Received: 21 September 2020    |   Revised: 16 December 2020    |   Accepted: 22 December 2020

DOI: 10.1002/ece3.7224

ORIGINAL RESEARCH

Drivers of population divergence and species differentiation
in a recent group of indigenous orchids (Vanilla spp.) in
Madagascar

Cathucia F. Andriamihaja1,2  | Aro V. Ramarosandratana2                                                    | Michel Grisoni3 |
Vololoniaina H. Jeannoda2 | Pascale Besse1

1
 Université de la Réunion, UMR PVBMT, St
Pierre, France                                    Abstract
2
 Department of Plant Biology and Ecology,         With over 25,000 species, orchids are among families with remarkable high rate of
University of Antananarivo, Antananarivo,
                                                  diversification. Since Darwin's time, major advances attributed the exceptional diver-
Madagascar
3
  CIRAD, UMR PVBMT, Toamasina,
                                                  sity of orchids to plant–pollinator interactions. However, unraveling the processes and
Madagascar                                        factors that determine the phenotypic and genotypic variation of natural orchid pop-

Correspondence
                                                  ulations remains a challenge. Here, we assessed genetic population structure and flo-
Pascale Besse, Université de la Réunion,          ral differentiation in recently diverged leafless Vanilla species in a world biodiversity
UMR PVBMT, St Pierre, La Réunion, France.
Email: pascale.besse@univ-reunion.fr
                                                  hotspot, Madagascar, using seven microsatellite loci and 26 morphometric variables.
                                                  Additionally, analyses were performed to test for the occurrence of any patterns of
Funding information
Université de La Réunion; Chanel Parfum
                                                  isolation by distance, isolation by environment, and isolation by adaptation and to de-
Beauté; Regional Council of La Reunion,           tect possible physical barriers that might have caused genetic discontinuities between
Grant/Award Number: 263105; Université
d'Antananarivo; Centre de Coopération
                                                  populations. Positive inbreeding coefficients detected in 22 populations were prob-
Internationale en Recherche Agronomique           ably due to the presence of null alleles, geitonogamy and/or some admixture (sympat-
pour le Développement
                                                  ric species). In contrast, the only high-altitude population showed an important rate of
                                                  clonality leading to heterozygote excess. Genetic diversity was maximum in western
                                                  populations, suggesting a postglacial colonization to the north and south. Clustering
                                                  analyses identified seven genetic groups characterized by specific floral traits that
                                                  matched five botanical descriptions in the literature. A contribution of montane refu-
                                                  gia and river barriers on population differentiation was detected. We also detected
                                                  combined effects of IBD/IBE and IBE/IBA on genetic differentiation and suggested
                                                  this pattern is more likely determined by ecological isolation, although pollinator-me-
                                                  diated divergent selection could not be ruled out for some of the species. Overall, this
                                                  study provides further insights on speciation in orchids, a group for which Madagascar
                                                  shows one of the world's highest level of endemism and confirms the importance of
                                                  the peculiar biogeography of the island in shaping species differentiation.

                                                  KEYWORDS

                                                  ecological distances, flower traits, geographic distances, leafless, microsatellite, speciation,
                                                  Vanilla

This is an open access article under the terms of the Creative Commons Attribution License, which permits use, distribution and reproduction in any medium,
provided the original work is properly cited.
© 2021 The Authors. Ecology and Evolution published by John Wiley & Sons Ltd.

Ecology and Evolution. 2021;11:2681–2700.	                                                                                      www.ecolevol.org   |   2681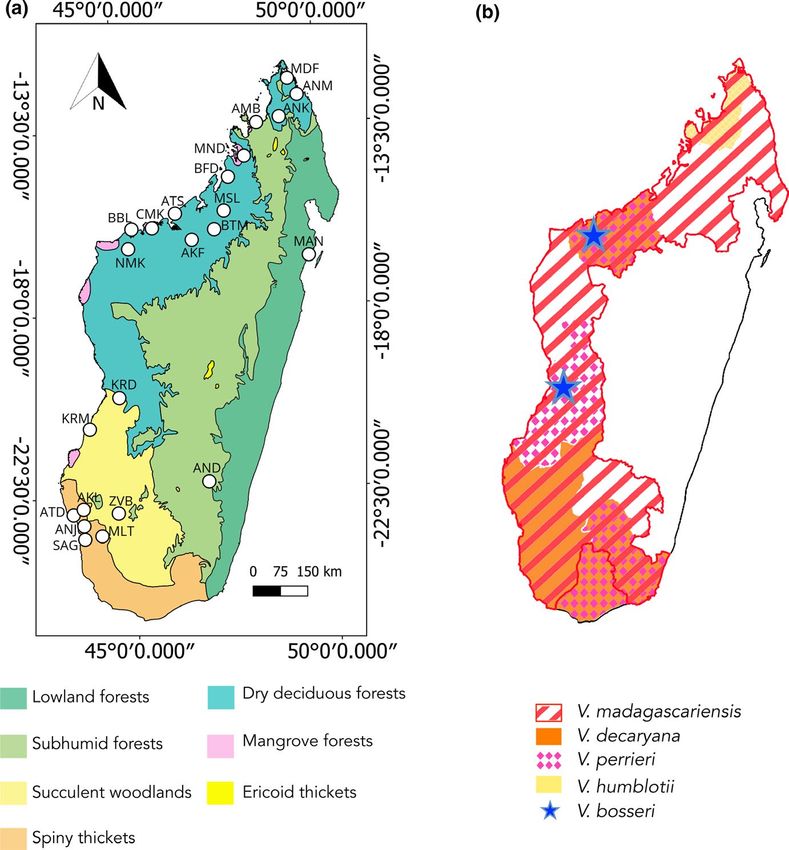
2682   |                                                                                                                    ANDRIAMIHAJA et al.

1 | I NTRO D U C TI O N                                                   caused by the reduction of exchanges between populations from
                                                                          ecologically divergent habitats due, for example, to the low recruit-
Understanding how and at what rate phenotypic and genetic                 ment in local environment. The roles of spatial isolation-by-distance
differentiation occurs across natural populations is one of the           and isolation-by-ecology patterns are complex in population differ-
most fundamental questions in evolutionary biology (Ghalambor             entiation and speciation processes, as they can be highly correlated
et al., 2007; Lekberg et al., 2012; Schmid & Guillaume, 2017). It is      and often act together as isolation mechanisms. Evolutionary pat-
now well established that three mechanisms and their interactions         terns can be quite complex in plants (Lowry et al., 2008; Waser &
shape the patterns of population diversity and structure, which           Campbell, 2004), particularly in Orchidaceae. Indeed, orchid species
are reduced gene flow, genetic drift, and natural selection (Gandon       evolve occasionally in sympatry (Barone Lumaga et al., 2012; Nielsen
& Nuismer, 2009; Johnson et al., 2018; Wright, 1931). They are            & Siegismund, 1999; Pansarin & Ferreira, 2019), produce numerous
strongly influenced by many interrelating factors including histor-       seeds with long-range dispersal ability (Arditti & Ghani, 2000), can
ical events, human activities, distance and barriers, and ecological      reproduce clonally (Batygina et al., 2003), and hybridize (Arduino
variations (Gomez et al., 2009; Wright, 1943; Zhang et al., 2014).        et al., 1996; Nielsen & Siegismund, 1999). Potential ecological drivers
However, the last two factors were identified as the most import-         of orchid diversification are multiple, such as adaptation to pollina-
ant ones (Mallet et al., 2014; Noguerales et al., 2016; Rundle &          tors (Ayasse et al., 2011; Dressler, 1982; Van der Niet et al., 2014),
Nosil, 2005; Wright, 1931, 1943). First, geographic barriers can af-      mycorrhizal specificity (Otero et al., 2007), differences in flower-
fect evolutionary processes by interrupting gene flow and therefore       ing phenology, and floral characteristics (color, form and fragrance)
increasing population divergence (Capparella, 1987; Sobel, 2016).         resulting from adaptation to different environmental conditions
Nevertheless, in the absence of barriers, genetic differentiation         (Givnish et al., 2015; Pansarin & Ferreira, 2019; Sun et al., 2015)
can still occur. The pattern of isolation by distance (IBD) suggests      and leading to isolation by ecology. Although the various patterns
a decrease of gene flow between populations as distance increases,        namely IBD, IBE, and IBA have gained attention in the literature
triggering genetic differentiation via genetic drift and/or selection     (e.g., Garot et al., 2019; Liu et al., 2018; Noguerales et al., 2016;
(Frankham et al., 2010; Ramírez-Barrera et al., 2019; Wright, 1943).      Orsini et al., 2013; Shafer & Wolf, 2013), few studies have evalu-
On the other hand, selection is the primary factor for divergence         ated their joint contribution in orchid species differentiation (e.g.,
in isolation by ecology or ecological speciation lato sensu (Orsini       Jaros et al., 2016; Mallet et al., 2014), and no research efforts, to
et al., 2013; Shafer & Wolf, 2013; Wang & Bradburd, 2014): In this        our knowledge, have been invested so far on this subject regarding
case, gene flow between populations is reduced due to local adapta-       Vanilla species divergence.
tion to divergent environments (Shafer & Wolf, 2013).                        The Vanilla Plumier ex Miller (34.6 Ma, Bouetard et al., 2010)
   Past climatic oscillations have been argued to be the major            belongs to the Orchidaceae, one of the most diverse family of an-
factors affecting current distributions and diversity of many plant       giosperms (Bouetard et al., 2010; Gigant et al., 2011). It comprises
species (Gomez et al., 2009; Médail & Diadema, 2009; Zhang                about 132 species (Andriamihaja et al., 2020) distributed through-
et al., 2014). Climatic variations can threaten several plant spe-        out tropical forests between the 27th north and south parallels, but
cies and reduce plant community diversity, as shown by the ex-            are absent in Australia (Gigant et al., 2011; Portères, 1954). With
tinction of European tree species during the Plio-Pleistocene             nine wild Vanilla species described, the Southwest Indian Ocean
(Svenning, 2003). However, they can also be an important force            (SWIO) region ranks fourth among the richest regions and first in
driving genetic differentiation and speciation (Hewitt, 1996; Vences      terms of leafless species, most being located in Madagascar (Gigant
et al., 2009). For example, climatic variations along latitudinal gra-    et al., 2011; Portères, 1954). Leaflessness has evolved independently
dients may affect organism functional traits such as phenology            at least three times in the Vanilla genus (Bouetard et al., 2010).
(Olsson & Ågren, 2002), physiology (Bognounou et al., 2010; De            Within the SWIO region, seven leafless species can be found, en-
Frenne et al., 2012), and morphology (Feijó et al., 2019; Olsson &        suing from the adaptation of an African leafy ancestor to xeric
Ågren, 2002; Winn & Gross, 1993) and lead to plastic or genotypic         conditions (Bouetard et al., 2010). As they are part of a recent mono-
shifts (Byars et al., 2007). Correlation analysis of neutral genetic      phyletic group (4.4 Ma) (Bouetard et al., 2010), these species retain
variations versus geographic distances allows testing for IBD. On         numerous similarities in their morphology (Allorge-Boiteau, 2013;
the other hand, a correlation between genetic divergence and mor-         Andriamihaja et al., 2020; Cribb & Hermans, 2009; Portères, 1954;
phological divergence can reveal isolation by adaptation (IBA) where      Soto-Arenas & Cribb, 2010), making their identification difficult.
barriers to gene flow between populations from different habitats         Chloroplast DNA phylogenetic analyses also failed to distinguish the
arise following adaptive trait divergence (Nosil et al., 2008; Shafer &   various species from this group (Bouetard et al., 2010). Such recent
Wolf, 2013; Wang & Bradburd, 2014). When adaptive traits cannot           and closely related species have always been recognized to be an
be targeted, various cofactors may be used to test for isolation by       interesting model for understanding speciation processes (Lowry,
ecology (Ramírez-Barrera et al., 2019; Shafer & Wolf, 2013; Wang          Modliszewski, et al., 2008; Van der Niet et al., 2014).
& Bradburd, 2014). For this purpose, environmental data (excluding           Our aim is to unravel wild leafless Vanilla species diversification
geographic data) may serve as a proxy in correlation analysis with        processes in Madagascar. The island of Madagascar is a perfect
neutral genetic data to assess isolation by environment (IBE). IBE is     place for studying evolution, thanks to a high level of endemism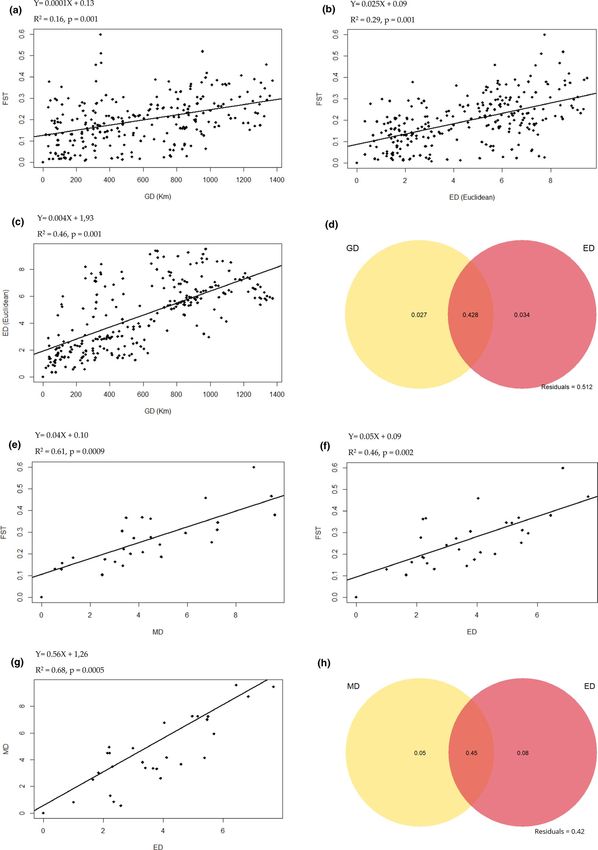
ANDRIAMIHAJA et al.                                                                                                                    |   2683

attributed to a large heterogeneity of habitats, a small spatial scale,   2 | M ATE R I A L S A N D M E TH O DS
and a long history of geographic isolation (Vences et al., 2009;
Warren et al., 2015; Wilmé et al., 2006). Actually, the level of          2.1 | Study site
endemism is more than 80% among plant species (Callmander
et al., 2011; Goodman & Benstead, 2005; Phillipson et al., 2006)          Fieldworks were performed in 23 sites (Table S1, Figure 1)
and even higher for animal taxa, ranging from 52% in birds to 100%        within the distribution range of Malagasy leafless Vanilla species
in amphibians and lemurs (Goodman & Benstead, 2005). Habitat              (Figure 1). Madagascar is located in the Indian ocean, southeast
diversity is expressed by different biomes with unique vegeta-            of Africa, around 20°S and 47°E, in the intertropical zone. A rug-
tion composition and sharp borders, for instance, the long central        ged chain of mountains separates the island from north to south,
highland plateau that rises along a latitudinal axis and separates        into dry forests (in the west) and rain forests (in the east) (Waeber
west and east bioclimatic regions (Vences et al., 2009; Wilmé             et al., 2015). Several factors shaped the island climatic conditions
et al., 2006). Madagascar hosts more than 1,000 orchid species            such as topography, landform, maritime influence, and prevailing
(Cribb & Hermans, 2007) including five leafless and two leafy Vanilla     wind conditions (Cornet, 1973). During the dry season from May
species (Allorge-Boiteau, 2005, 2013; Cribb & Hermans, 2009;              to October, the “Alizé” brings humid air masses from the Indian
Portères, 1954). Over 90% of Malagasy orchids are endemic to the          Ocean to the east coast causing precipitations (Cornet, 1973).
island (Cribb & Hermans, 2007). In this study, we generated eco-          These foggy masses move inland and drizzle in the elevated areas
logical, genotypic (using variable microsatellite markers), and mor-      of the central domain. The winds become hot and dry beyond
phological data for leafless Vanilla populations from Madagascar.         the mountains in the west, causing an accentuated dry season.
We determined the genetic, morphological structure and differen-          During the wet season from November to April, on the other
tiation of populations, to identify possible geographic barriers and      hand, the “Mousson” brings heavy rains over most of the island
to quantify the effects of isolation by distance (IBD), isolation by      (Cornet, 1973). As a result, Madagascar is ecologically heteroge-
adaptation (IBA), and isolation by environment (IBE) in diversifica-      neous and displays five bioclimatic regions: dry, subhumid, humid,
tion processes.                                                           montane, and subarid (Vences et al., 2009). These ecoregions

F I G U R E 1 Map of studied populations,
habitat types, and distribution of
leafless Vanilla species in Madagascar.
(a) Map shows the seven ecoregions of
Madagascar based on WWF’s ecoregions
in Burgess et al. (2004). Circles indicate
geographic positions of the 23 localities
with Vanilla populations. (b) Map
represents the distribution area of the
five known leafless Vanilla species in
Madagascar according to Portères (1954),
Cribb and Hermans (2009) and Allorge-
Boiteau (2013)
2684   |                                                                                                                    ANDRIAMIHAJA et al.

host seven typical vegetation formations: spiny thicket, succulent       BRC Vatel collection (La Réunion). Each individual was amplified and
woodland, dry deciduous forest, subhumid forest, lowland (humid)         genotyped using seven microsatellite markers developed by Gigant
forest, ericoid thicket, and mangrove forest (Figure 1a) (Burgess        et al. (2012) (Table S2). Polymerase chain reaction (PCR) with fluores-
et al., 2004).                                                           cently labeled primers was performed in a total volume of 25 µl using
                                                                         Promega kit (Promega, 2007) by mixing 12.5 µl of GoTaq Colorless
                                                                         Master Mix 2X, 2 μl of DNA solution (5 < DNA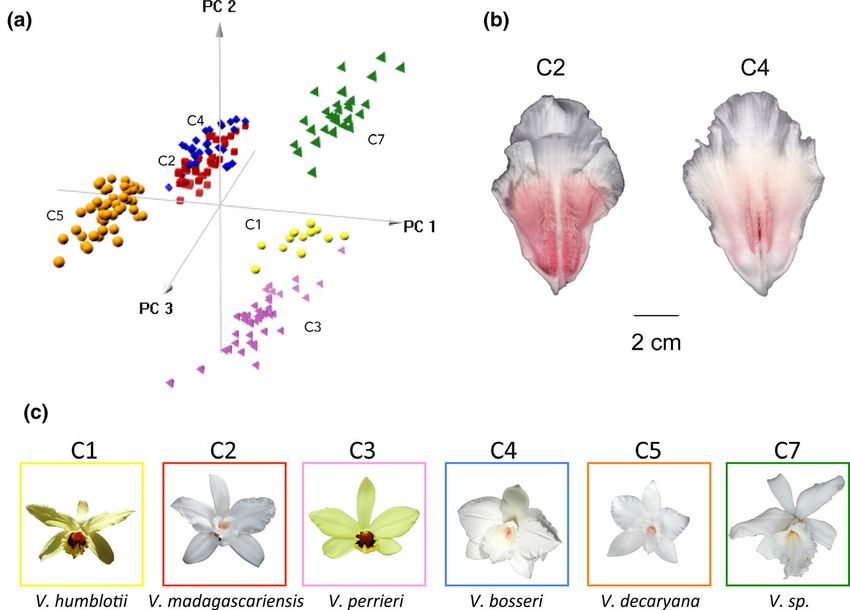
ANDRIAMIHAJA et al. | 2685
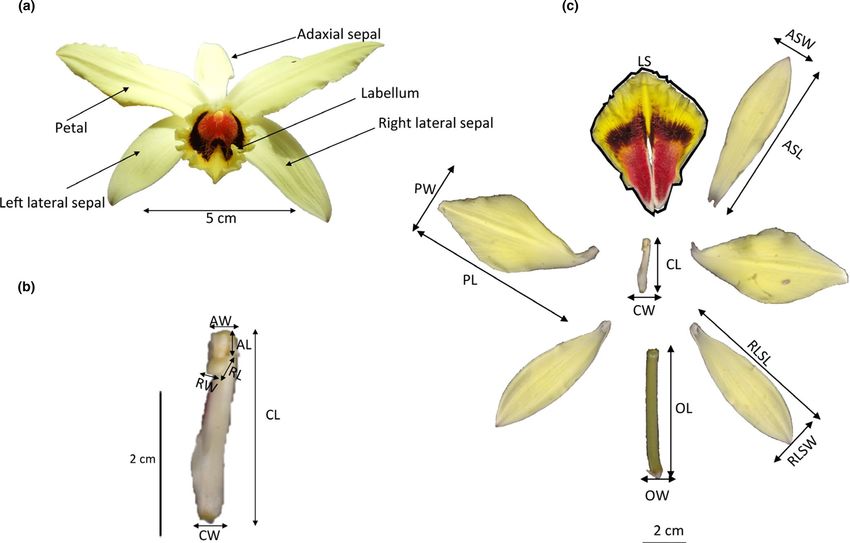
were checked by INEst v.2.2 (Chybicki & Burczyk, 2009) using a and classical taxonomic morphometric parameters were assessed
Bayesian approach (IIM). (Gigant et al., 2014; Gigant, De Bruyn, et al., 2016; Petersson, 2015;
Portères, 1954; Soto-Arenas & Cribb, 2010). We directly measured
in situ ten parameters using a digital caliper and a precision balance,
2.6 | Genetic structure and differentiation that is, total flower weight (TFW), ovary weight (OWE), ovary length
(OL), ovary width (OW), column length (CL), column width (CW),
The “genets” dataset was used to estimate the global differentia- rostellum length (RL), rostellum width (RW), anther length (AL), and
tion index (FSTg) among populations (Weir & Cockerham, 1984) and anther width (AW) (Figure 2).
the pairwise genetic differentiation (FSTp) between pairs of popu- Thereafter, flower parts were digitalized using a canoScan LiDE
lations using the GENEPOP package under R software. Analysis of 120. The resulting images were processed under IMAGEJ software
molecular variance (AMOVA) (Excoffier et al., 1992) implemented (Abràmoff et al., 2004) in order to measure complementary traits,
in GenAlEx 6.5 (Peakall & Smouse, 2006) was conducted to assess that is, adaxial sepal width (ASW), adaxial sepal length (ASL), right
the genetic differentiation level among and within populations and lateral sepal length (RLSL), right lateral sepal width (RLSW), label-
among populations from different habitat types. Each population lum surface (LS), petal length (PL), and petal width (PW) (Figure 2).
was associated to its corresponding ecoregion of Madagascar based Scanned flower images were also transformed into CIE (L*a*b*)
on geographic location. color space according to the Kendal et al. (2013) script using the
Assignment of multilocus genotypes to different clusters was “convertColor” function in the grDevices package in R (R Core
inferred by conducting Bayesian clustering analyses implemented Team, 2019). The (L*) dimension values vary between 0 (black) and
in STRUCTURE (Pritchard et al., 2000) on the “genet” dataset, with 100 (white reference) and represent the luminance. The (a*) and
ten independent runs for each value of K (1 to 10 for the complete (b*) dimension values vary between −100 and 100 and represent
dataset), a burn-in period of 100,000 and 1,000,000 Markov chain the colors between red and green, and between yellow and blue,
Monte Carlo (MCMC) replications. To overcome sampling imbalance respectively (Najjar & Zagrouba, 2012). Color variables estimated
and thus correctly assign individuals to clusters, we used the model were L* of inside of labellum (LIL), a* of inside of labellum (AIL), b*
with admixture and independent allele frequencies and reduced the of inside of labellum (BIL), L* of outside face of sepal (LOFS), a* of
default alternative ancestry prior Alpha in STRUCTURE, as recom- outside face of sepal (AOFS), b* of outside face of sepal (BOFS),
mended by Wang (2017), with Alpha = 1/K. In our case, an Alpha L* of inside face of petal (LIFP), a* of inside face of petal (AIFP),
equal to 1/10 was chosen, as the number of K tested was 10. An in- and b* of inside face of petal (BIFP). In total, 26 morphometric pa-
dividual was considered to belong to a particular genetic group when rameters were used in principal component analysis (PCA) using
at least 80% of its genome was assigned to that genetic group. The FACTOMINER (Lê et al., 2008) with R software. Three dimensions
summary likelihood statistics ΔK (Evanno et al., 2005), which is the of PCA plot were generated with R package PCA3D (Weiner, 2019).
most used method to find the best K, was plotted. As the ΔK method PCA allows, by equal weighting of each character, reducing the
alone is not recommended by some authors to determine the best number of variables in fewer dimensions and therefore investi-
clustering (Janes et al., 2017; Wang, 2017), the posterior probabili- gating the overall morphological patterns. Means and standard
ties of K, called “Ln P(X|K),” implemented in STRUCTURE were also deviations of the ten most explanatory variables from PCA were
examined (Pritchard et al., 2000). The best K usually corresponds to computed for each genetic group. Differences in these floral traits
the highest value of mean Ln P(X|K) (Evanno et al., 2005; Pritchard between groups were detected using a Bonferroni-corrected pair-
et al., 2000; Rosenberg et al., 2001; Wang, 2017). Bar plot of genetic wise t test. Multivariate analysis of variance (MANOVA) was also
structuring obtained from STRUCTURE was generated using the conducted to test the statistical significance of overall floral differ-
POPHELPER package in R (Francis, 2017). ences based on a priori groupings. All analyses were done with R
software V3.5.1.
2.7 | Floral differentiation
2.8 | Geographic and environmental
Eight populations assumed to represent all clusters from genetic characterization of populations
structuring analysis were targeted during their flowering season
based on bibliographical information (Andriamihaja et al., 2020): Recorded GPS coordinates (Table S1) were used to calculate the
MSL and MND (October), BFD and MDF (November), and AJA, geographic distances between Vanilla populations in Madagascar.
ATD, MLT, and AND (December) (Table S1). One herbarium speci- Sample site elevation data were obtained from GPS (Table S1). To
men of each genetic group was deposited at the herbarium of the highlight the heterogeneity of habitats, 19 present-day bioclimatic
Botanical and Zoological Park of Tsimbazaza (N°51/20/MESupRES/ variables (means over thirty years) downloadable from the WorldClim
SG/DGRS/PBZT/Flore). Twenty to thirty mature flowers per popula- website (https://www.worldclim.org/) were extracted for each sam-
tion were randomly sampled. In total, 198 flowers were dissected pling sites in Madagascar (Tables S3 and S4). In addition, the annual2686 | ANDRIAMIHAJA et al. F I G U R E 2 Floral measurements carried out on a Vanilla specimen with yellow flowers collected within the Montagne des Français (MDF, north) population. See text for morphological parameters abbreviations. Panel a: flower. Panel b: column. Panel c: flower parts average values of maximum Normalized Difference Vegetation Index 2.9 | Effect of environmental, morphological, and (NDVI) for each locality and four soil variables were also extracted geographic distances on genetic divergence from raster data at 250 m of resolution provided by GIMMS Global Agricultural Monitoring System (Becker-Reshef et al., 2010) and To detect possible patterns of IBD and IBE, we performed multiple World Reference Base for Soil Resources (WRB) (Tables S3 and S4) matrix regression with randomization (MMRR) as implemented in (Ribeiro et al., 2018). Pearson's correlation tests were performed to the R function “MMRR” (Wang, 2013) on the 23 populations. This detect collinearity between variables, and a combination of variables approach is similar to Mantel test but can incorporate several dis- with a correlation of less than 0.3 was chosen. Habitat heterogeneity tance matrices, thus providing an interpretable result in the form of between the 23 populations was shown by applying a PCA to these a multiple regression equation (Wang, 2013). In the case of MMRR, uncorrelated variables. Environmental dissimilarity between each significance values for the regression coefficient (β) and coefficient of pair of populations was obtained by calculating the Euclidian dis- determination (R2) were estimated by performing 9,999 randomized tances of the PC scores of the three first principal components (PCs). permutation procedure (Wang, 2013). MMRR was also applied for As the landscape discontinuity could be an important factor to testing the correlation between geographic and environmental dis- differentiation processes, we performed Monmonier algorithm anal- tances. Genetic differentiation between populations was primarily ysis using BARRIER 2.2. (Manni et al., 2004) to identify where ge- estimated using pairwise FST values (Weir & Cockerham, 1984) using netic barriers might occur. GPS coordinates of each population were the “genet dataset” after discarding null alleles using FreeNa (Chapuis entered to construct Voronoï tessellation that determines which & Estoup, 2007). The geographic distance matrix was obtained with populations are neighbors and adjacent. The pairwise genetic dis- the SP package in R (Pebesma & Bivand, 2020). For environmental pa- tance (FSTp) was used to identify the top eleven potential barriers. rameters, we used the Euclidean distance calculated from PC scores as Then, 100 resampled bootstrap Nei's standard genetic distances explained in the previous section. Additionally, one powerful approach (Dn) matrices (Nei, 1972) were generated with MSA 4.05 (Dieringer called “distance-based redundancy analysis with randomization” & Schlötterer, 2003) for testing the robustness of each barrier (dbRDA), based on a linear ordination method that combines principal (Manni et al., 2004). component analysis (PCA) and multiple linear regression (Legendre &
ANDRIAMIHAJA et al.                                                                                                                                  |   2687

TA B L E 1    Summary of genetic diversity at 7 microsatellite loci in 23 of leafless Vanilla populations from Madagascar

 Pop            N           G/N           HWE        Ho            He            FIS             Na            Al                     Pa      Ar

 MDF            29          1.00          ***        0.58          0.70           0.17            60            8.57 ± 1.65            5      5.57 ± 2.46
 ANM            27          0.93          ***        0.57          0.66           0.14            53            7.57 ± 1.46            1      5.52 ± 2.45
 ANK            22          1.00          ***        0.58          0.65           0.11            49            7.00 ± 1.11            2      5.04 ± 2.27
 AMB            27          0.93          ***        0.51          0.61           0.16            51            7.29 ± 1.34            2      4.95 ± 2.19
 MND             41         0.93          ***        0.52          0.67           0.22            84           12.00 ± 1.38           10      5.86 ± 2.17
 BFD             24         1.00          ***        0.62          0.80           0.22            73           10.43 ± 1.09            5      6.58 ± 1.39
 ATS            27          0.93          ***        0.58          0.82           0.30            80           11.43 ± 1.80            3      7.31 ± 2.65
 MSL             41         0.93          ***        0.61          0.82           0.26            95           13.57 ± 2.35            3      7.68 ± 2.86
 CMK            26          1.00          ***        0.57          0.79           0.28            78           11.14 ± 1.72            2      7.05 ± 2.55
 BTM            34          1.00          ***        0.63          0.74           0.15            75           10.71 ± 0.97            9      5.86 ± 1.28
 BBL            26          1.00          ***        0.59          0.82           0.28            92           13.14 ± 2.38            0      7.70 ± 3.10
 AKF             24         1.00          ***        0.68          0.81           0.16            96           13.71 ± 2.37            5      7.90 ± 3.05
 NMK             24         0.96          ***        0.68          0.78           0.13            93           13.29 ± 2.38            1      7.82 ± 3.17
 KRD            33          1.00          ***        0.67          0.83           0.20           112           16.00 ± 2.48            7      8.27 ± 2.70
 KRM            29          0.90          ***        0.41          0.53           0.22            51            7.29 ± 1.48            4      4.58 ± 2.52
 AKL            25          0.80          ***        0.61          0.81           0.25            57            8.14 ± 0.94            3      6.29 ± 1.57
 ZVB             17         1.00          ***        0.68          0.76           0.10            59            8.43 ± 1.31            0      6.39 ± 2.50
 ATD            23          0.91          ***        0.33          0.50           0.35            41            5.86 ± 1.18            3      4.07 ± 1.92
 ANJ             24         0.83          **         0.23          0.35           0.32            16            2.29 ± 0.47            2      2.12 ± 1.02
 MLT            38          0.82          ***        0.45          0.61           0.27            55            7.86 ± 1.74            3      4.74 ± 2.53
 SAG              9         1.00          *          0.29          0.43           0.34            25            3.57 ± 0.97            4      3.38 ± 2.35
 MAN             11         0.82          ***        0.49          0.62           0.21            33            4.71 ± 0.68            6      3.46 ± 1.58
 AND            30          0.27          ***        0.59          0.42          −0.40            20            2.86 ± 0.74            1      2.86 ± 1.95

Note: Pop, population; N, number of samples per population; G/N, genotypic diversity; HWE, results of test for departures from Hardy–Weinberg
equilibrium (*p < .05, **p < .01, ***p < .001); Ho, observed heterozygosity over all loci; He, expected heterozygosity over all loci; FIS, fixation index;
Na, total number of alleles for all loci; Al, mean number of alleles per locus ± SD; Pa, total number of private allele; and Ar, mean allelic richness per
locus ± SD (Mousadik & Petit, 1996).

Anderson, 1999), was applied using the “dbrda” function in the VEGAN             on a reduced sampling of eight populations for which phenotypic data
package (Dixon, 2003) in R. Again, FST was tested against the geo-               were available to test, in addition to IBD and IBE, a possible correlation
graphic distances and population's PC scores from the PCA performed              between morphological distances and genetic distances (IBA). For that,
on the environmental data. Prior to IBD analysis, it was necessary               a Pearson's correlation test on the 26 morphometric variables was car-
to transform the geographic distances matrix into a continuous rec-              ried out to choose a combination of uncorrelated variables (cor < 0.3).
tangular vector by principal coordinates analyses (PCoA) using the               The PC scores of the first three principal components resulting from
“pcnm” function included in the VEGAN package in R. Significance of              the PCA of these selected variables were, then, used to calculate the
the predictors was evaluated using multivariate F-statistics with 9,999          phenotypic distance between the eight populations in order to per-
permutations using the “ANOVA” function in VEGAN. Three different                form MMRR and dbRDA.
types of dbRDA were performed: (a) a global dbRDA using all explana-
tory variables (geographic and environmental distances), (b) marginal
tests evaluating independently the relationship between the genetic              3 | R E S U LT S
distance matrix and each of the two explanatory variables (geographic
and environmental factors), and (c) a partial dbRDA (conditional test)           3.1 | Genetic diversity
estimating the relative contribution of one explanatory variable (geo-
graphic distance or environmental factors) to genetic differentiation,           A total of 555 genets and 56 clones were identified among the 611
while controlling the effect of the other one. The amount of variance            studied samples (ramets), representing approximately 9% of clon-
explained by the intersection of IBD and IBE was obtained by variance            ality. At the population level, the clonality rate was generally low
partitioning using the function “varpart” included in VEGAN package.             (G/N > 0.7) except for AND population where genotypic diversity
The adjusted coefficient of determination R2adj was calculated to eval-          was only 0.27 (Table 1). The multilocus exact test p-values for each
uate the quality of the model. MMRR and dbRDA were also conducted                population showed a significant deviation from HWE (p-value < .05)
2688   |                                                                                                                      ANDRIAMIHAJA et al.

(Table 1). For 22 populations, the observed heterozygosity (Ho) was        up to 0.60 between AND (central highland) and ANJ (southwestern)
lower than the expected heterozygosity (He), with positive FIS val-        (Table S5). A strong linear positive correlation (Pearson correlation
ues, while Ho was higher than He (negative FIS value) for the AND          coefficient = 0.81, r-squared = 0.63; p < .001) was obtained be-
population (Table 1). Overall diversity was high with He values rang-      tween r2 and the product of two FST values for pairs of loci, sug-
ing from 0.42 to 0.83. The seven primers revealed a high level of          gesting a substructure of the sample (Figure 3).
polymorphism with 262 alleles across the 23 studied populations.              AMOVA estimated that 79% of the total genetic variation was
The total number of alleles over all loci per population varied from 16    found within populations, a moderate proportion (15%) was found
(ANJ) to 112 (KRD), with a mean of 9 alleles/locus/population. Two         among populations, and only 6% was found among ecoregions. The
populations (BBL, ZVB) had no private alleles, while the highest pro-      distribution of ∆K values in the Bayesian assignment of STRUCTURE
portion was attributed to MND with 10 private alleles across all loci      showed a modal value at K = 4 and the maximum value of the pos-
(Table 1). The mean allelic richness per locus (Ar) was lowest (2.86) in   terior probability “Ln P(X|K)” corresponded to K = 7 (Figure S1).
AND and highest (8.27) in KRD (Table 1). The Pearson's correlation         According to Wang (2017), with unbalanced sampling, it is preferable
showed that allelic richness (Ar) and expected heterozygosity (He)         to choose the method of Pritchard et al. (2000) based on “Ln P(X|K)”
increased slightly (rAr-latitude = 0.43, rHe_latitude = 0.47) but sig-     to find the best K. Consequently, seven distinct genetic clusters
nificantly (p < .04) with latitude, with southern populations showing      were retained as the optimal K in STRUCTURE analysis (Figure 4b,
the lowest diversity and western populations showing the highest           c). If most populations were rather homogeneous in terms of genetic
diversity (Table 1).                                                       structure, some showed evidence of admixture, of which the most
   Of the 21 combinations of loci tested for LD across the popu-           obvious were AKL (southwest) and CMK (northwest) (Figure 4b, c).
lations, two-locus combinations were significantly in LD after SB             FST-based analysis of genetic barriers revealed eleven boundar-
correction. LD analysis in each population revealed one-locus to           ies. Six of them were well supported with bootstrap values exceed-
seven-locus combinations in LD after SB correction in only 8 popu-         ing 60%. These genetic barriers separated, in majority, the seven
lations of the 23 studied, and with no pair of markers consistently in     different genetic groups obtained from STRUCTURE (Figure 4b).
LD across all populations, as would be expected if LD resulted from
physically linked loci (Slatkin, 2008). Therefore, all microsatellite
loci were considered independent as shown by the original study of         3.3 | Floral morphology differentiation
Gigant, De Bruyn, et al. (2016). A high frequency of null alleles rang-
ing from 0.12 (HU03, HU07, HU08) to 0.26 (HU06) was detected.              The first three principal components of PCA (Figure S2), explain-
                                                                           ing 80.6% of the total variation, were chosen to explain the total
                                                                           variation of 26 quantitative flowers traits, in relation with genetic
3.2 | Genetic structure, differentiation, and barriers                     clusters defined by STRUCTURE (K = 7). PCA1 explained 53.7% of
                                                                           the total variation and separated three clusters from three others
The global FST value calculated (0.19) indicated a significant             by the weight and size of the flowers (Figure 5a, Figure S2). Color of
(p < .001) overall differentiation among populations. Pairwise FST         the petals and of the inside face of labellum differentiated flowers
was all significant (p < .001), with high amplitude values ranging         from clusters 1 and 3 from the others on the second axis of the PCA
from 0.01 between two northwestern populations (BBL and MSL)               with 19.3% of explained variance. Indeed, populations from these

                                                                                                     F I G U R E 3 Scatterplot shows linear
                                                                                                     relationship between r2 (Waples, 2006)
                                                                                                     and the product of two FST values for
                                                                                                     21 pairs of microsatellite loci across 23
                                                                                                     populations of leafless Vanilla species
                                                                                                     from Madagascar
ANDRIAMIHAJA et al. | 2689 F I G U R E 4 Genetic structuring and boundaries of leafless Vanilla populations from Madagascar. Panel a: topography of Madagascar with major rivers based on open street map data available on QGIS and USGS data (https://earthexplorer.usgs.gov/). The location of the 23 populations is indicated by circles. Panel b: distribution of leafless Vanilla genetic clusters in Madagascar based on Bayesian inference from STRUCTURE software and genetic barriers. Pie charts represent the mean proportion membership to K = 7 clusters and their sizes are proportional to sample sizes (N). Results of BARRIER analysis revealed regions of genetic discontinuity (in arrowed red lines) indicated by the letters a to k in descending order of FST values relative importance, with bootstrap values (in %) shown in black numbers calculated based on 100 Nei's standard genetic distances bootstrap matrices. Panel c: genetic assignment plot of individuals assessed by STRUCTURE program (K = 7). Each individual is represented by a vertical bar partitioned into K-colored segments that represent the individual's probability of belonging to the cluster with that color. Corresponding species are indicated, according to population morphological analyses (Figure 5) two clusters have yellow flowers, while the others have white flow- absence of hairs inside the labellum, as detected during floral obser- ers (Figure 5c). Color of the outside face of sepals and size of flowers vation (Figure 5b). This morphological feature could not be included contributed most strongly to PCA3 (7.6%) and separated populations in the PCA analysis as it is a qualitative character. The MANOVA from the south of Madagascar (cluster 5) and those situated in the demonstrated significant differentiation of overall floral morphol- north and west of Madagascar (clusters 2 and 4) (Figure 5a). Clusters ogy between genetic groups (p < .0001). Means of the ten most 2 and 4 overlapped on the PCA axes. However, flowers from clus- explanatory variables of the first three PCA dimensions and results ter 4 could readily be differentiated from those in cluster 2 by the of pairwise t test are shown in Table 2. Seven to nine floral traits
2690    |                                                                                                                                   ANDRIAMIHAJA et al.

                                                                                                                   F I G U R E 5 PCA of 26 quantitative
                                                                                                                   floral morphometric characters and
                                                                                                                   labellum hair qualitative character. (a) 3D
                                                                                                                   plotting of the first three components
                                                                                                                   of the PCA, with genetic groups from
                                                                                                                   STRUCTURE analysis (K = 7) indicated
                                                                                                                   by matching colors. C1: MDF; C2: MND;
                                                                                                                   C3: BFD; C4: MSL; C5: ANJ, ATD, MLT;
                                                                                                                   C7: AND. For the contribution of the 26
                                                                                                                   variables to the three axes of the PCA,
                                                                                                                   see Figure S1. (b): Photograph of labellum
                                                                                                                   of individuals from populations MND (C2)
                                                                                                                   and MSL (C4) showing presence/absence
                                                                                                                   of hairs. (c): Flower images representative
                                                                                                                   of the 6 clusters: photographies by (C1)
                                                                                                                   Johnson G. Andrianantenaina, (C2, C3, C4,
                                                                                                                   C5): Cathucia F. Andriamihaja, (C7): Hoby
                                                                                                                   Nomenjanahary

TA B L E 2 Comparison of ten floral parameters (mean ± SD) among six genetic groups derived from analysis with STRUCTURE. Means
followed by the same letter in the same row are not significantly different (p-value > .05)

 Floral traits         C1                      C2                      C3                      C4                        C5                     C7

 Species               VHUM                    VMAD                    VPER                    VBOS                      VDEC                   VSP
                                      a                       b                        c                       b                        d
 TFW (g)                6.08 ± 1.13             2.88 ± 0.40              4.22 ± 0.85             3.33 ± 0.49              1.76 ± 0.49            7.93 ± 1.02 e
 BIFP                  41.42 ± 5.86a           −2.61 ± 0.70 b           58.48 ± 8.75c          −2.25 ± 0.78b             −2.39 ± 0.73b          −1.80 ± 0.64b
                                       a                      b                        c                       b                        b
 AIFP                  −8.07 ± 1.06             1.83 ± 0.35            −10.31 ± 1.70             2.25 ± 0.44              1.76 ± 0.73            1.80 ± 0.53b
 LS                    16.63 ± 2.28a            7.27 ± 0.83b            13.74 ± 1.94c            9.36 ± 1.23d             4.82 ± 0.36 e         21.44 ± 2.50 f
                                       a                      b                        c                       b                        d
 PL                      7.46 ± 0.49            5.84 ± 0.52              6.55 ± 0.64             5.88 ± 0.55              4.23 ± 0.30            8.79 ± 0.48 e
 RLSL                    7.18 ± 0.36a           5.74 ± 0.51b             6.42 ± 0.60 c           5.87 ± 0.54b             4.14 ± 0.20 d          8.57 ± 0.40 e
                                      a                       b                        a                     b                          c
 ASL                     7.08 ± 0.57            5.92 ± 0.59              6.61 ± 0.70             5.93 ± 0.51              4.21 ± 0.30            8.48 ± 0.52d
 BIL                   40.53 ± 1.97a            2.48 ± 0.88b            39.81 ± 6.64a            2.21 ± 1.32b            −0.72 ± 0.53c          0.82 ± 0.64b,c
                                       a                      b                        c                       b                        d
 OW                      4.92 ± 0.52            3.64 ± 0.26              4.11 ± 0.46             3.76 ± 0.29              3.32 ± 0.30            5.85 ± 0.58 e
 OWE                    1.25 ± 0.43a            0.54 ± 0.11b             0.80 ± 0.23c            0.59 ± 0.10 b            0.49 ± 0.12b           1.71 ± 0.29d

Note: BIFP: b* of inside face of petal, AIFP: a* of inside face of petal, BIL: b* of inside of labellum
Abbreviations: TFW, total floral weight; LS, labellum surface; PL, petal length; RSLS, right lateral sepal length; ASL, adaxial sepal length; OW, ovary
width; OWE, ovary weight; VHUM, V. humblotii; VMAD, V. madagascariensis; VPER, V. perrieri; VBOS, V. bosseri; VDEC, V. decaryana; and VSP, V. sp.

of the ten most discriminant variables varied significantly among all              from AND (central highlands of Madagascar) that can be distin-
genetic groups, except for clusters 2 and 4, which presented many                  guished from the others by its altitude (mean elevation: 887 m)
similarities as previously mentioned. The surface of the labellum was              (Figure S3). Scores of the three principal components (PCs) ex-
significantly different between all genetic groups.                                plaining 85.6% of the environmental variance were used to cal-
                                                                                   culate environmental distances between the 23 populations. The
                                                                                   results of MMRR on 23 populations revealed that genetic differ-
3.4 | Geographic, environmental, and morphological                                 entiation was weakly positively correlated to geographic distances
effects on genetic differentiation                                                 (IBD) (β = 0.0001, p = .001) and with a higher coefficient of deter-
                                                                                   mination (R 2 = 0.29) to environmental distances (IBE) (β = 0.025,
In general, PCA on the 14 uncorrelated environmental vari-                         p = .001) (Figure 6a, b). However, geographic and environmental
ables distributed samples between four types of habitat: east                      distances showed autocorrelation (Figure 6c). Marginal tests of
of Madagascar (MAN) with high NDVI and precipitation, north                        dbRDA showed significant effect of IBD and IBE on genetic dis-
of Madagascar characterized by high annual temperature, west of                    tance, whereas partial dbRDA revealed no pure contribution of IBD
Madagascar with high pH and temperature, and finally population                    (p = .268) but a weak independent pattern of IBE (R 2adj = 3.41%,
ANDRIAMIHAJA et al. | 2691
p = .001) (Table 3). The intersection IBD ∩ IBE constituted the alleles detected for all loci (0.12–0.26), although the substructure
most important contributor to genetic divergence explaining of some populations with different sympatric species (as will be
42.8% of the total variation (Figure 6d). Analyses carried out on further discussed), as well as possible inbreeding due to geito-
the reduced sample (eight populations) indicated no contribution nogamy (as demonstrated for a V. humblotii Rchb. f. population in
of geographic distance on genetic distance (no IBD) (Table 3) and Mayotte, (Gigant, De Bruyn, et al., 2016), could be other factors
eliminated its correlation with environmental distance. However, explaining these deficits.
MMRR and dbRDA revealed a significant association between
genetic distance and morphological distance (PC1) and between
genetic distance and environmental distance (PC1) (Figure 6e,f) 4.2 | Genetic and morphological differentiation
(Table 3). The PC1 axis from PCA of morphological data grouped
together several variables related to flower size: TFW, PL, RLSL, At the scale of Madagascar, a strong significant population sub-
ASL, OW, OWE, CL, and AL (Figure S4). The PC1 axis from PCA structure was detected by the Wahlund effect test for overall
on environmental data assembles a pool of ecological variables individuals as suggested by Waples (2015, 2018) (Figure 3). The
related to temperature (BIO8, BIO10, BIO5), elevation, pH, and microsatellite-based structuring corroborated this, by reveal-
percentage of silt (Figure S5). However, environmental (PC1) and ing seven well differentiated genetic groups (Figure 4b, 4c).
morphological predictors (PC1) were not significant after account- Morphological analysis of Madagascar leafless Vanilla flowers re-
ing for the influence of each other in partial dbRDA tests (Table 3), vealed a similar grouping pattern to that found using microsatel-
as they were highly intercorrelated (Figure 6g). The intersection lite markers (STRUCTURE). Indeed, flower morphology was clearly
IBE ∩ IBA constituted the most important contributor to genetic specific for each of six STRUCTURE clusters (Figure 5), with size
divergence explaining 45% of the total variation (Figure 6h). of flowers and particularly size of labellum as the determining fea-
ture of this differentiation (Table 2, Figure S2). In Vanilla plants,
the difference in flower sizes is often a discriminating trait. For
4 | D I S CU S S I O N example, in the taxonomic review done by Soto-Arenas and Cribb
(2010), petal size was the determination key between V. mexicana
4.1 | Genetic diversity of leafless Vanilla populations and V. ovata, two closely related species from South America.
Unfortunately, no flowers belonging to the genetic group C6
Numerous mechanisms can maintain genetic diversity, the most MAN could be observed. This morphometric pattern, combined to
important of which are mutation, migration and balancing selection geographic distribution of known species (Figure 1b), allowed to
where population sizes play a major role (Frankham et al., 2010). clearly link five of the STRUCTURE clusters to the five botanical
Genetic diversity organization in plants is also highly dependent species already described in Madagascar (Allorge-Boiteau, 2005,
on the life cycle, reproduction system, pollination, and seed dis- 2013; Cribb & Hermans, 2009; Portères, 1954). Flowers from clus-
persion mechanisms. For example, long-lived, allogamous taxa, ters 1 and 3 matched the V. humblotii and V. perrieri Schltr. de-
with wind or ingested dispersed seeds, are more variable within scriptions, respectively. Their weights and the amount of yellow
populations than between, with high He (0.61–0.73) and lower FST in their flowers were significantly different according to our re-
(0.12–0.26) values, with an opposite organization for annual auto- sults (Figure 5, Table 2) and also as noted by Portères (1954). The
gamous plants with gravity-dispersed fruits (Nybom, 2004; Ronfort presence of these two species in Madagascar has already been
et al., 2005). AMOVA results suggested that genetic variation was confirmed (Cribb & Hermans, 2009), although V. humblotii is sup-
mainly (79%) allocated within Vanilla populations in Madagascar. posedly endemic to the Comoros archipelago (Portères, 1954). The
The levels of genetic diversity were relatively high for 20 popula- genetic groups with white flowers (C2, C4, C5, C7) could be dif-
tions out of the 23 (0.42 < He < 0.84, 3.45 < Ar < 7.65), with an ferentiated mainly by the variation in their flower sizes (Table 2).
overall low genetic differentiation (FST = 0.19). These results are Cluster 5 (ATD, MLT, KRD, SAG) flowers, which were the smallest
compatible with what was expected for Vanilla species, which are (PL≈4 cm), were identified as morphologically close to the V. decar-
long-lived thanks to vegetative growth, mostly allogamous (Gigant yana H. Perrier description by Allorge-Boiteau (2005) in southern
et al., 2014; Gigant, De Bruyn, et al., 2016; Gigant, Rakotomanga, Madagascar. V. bosseri L. Allorge and V. madagascariensis Rolfe de-
et al., 2016; Petersson, 2015), with most likely bee-mediated pol- scriptions matched with clusters C4 and C2, respectively. Clusters
lination and suspected zoochorous seed dispersion (by bees or 2 and 4, well differentiated on STRUCTURE analysis, are relatively
bats) (Gigant et al., 2011; Gigant, De Bruyn, et al., 2016). These close morphologically on the PCA, but they can be readily sepa-
results also agree with expectations for orchids species for which rated by the presence/absence of hairs on the labellum (Figure 5b).
high He ranging from 0.3 up to 0.9 is reported (Chen et al., 2014; The absence of hairs is an originality of V. bosseri (C4) compared
Soliva & Widmer, 2003; Stone et al., 2012; Swarts et al., 2009). to all the other species (Allorge-Boiteau, 2013; Petersson, 2015).
Significant deviation from HW equilibrium was detected for all Finally, the genetic group constituted by AND (cluster 7) was well
populations with a strong significant heterozygote deficit (FIS > 0) differentiated and showed morphological traits different from the
for 22 populations. This could be due to the high frequency of null others that, however, have never been described in the literature.2692 | ANDRIAMIHAJA et al.
ANDRIAMIHAJA et al.                                                                                                                              |   2693

F I G U R E 6 Multiple matrix regression with randomization (MMRR) analysis and distance-based redundancy analysis (dbRDA) based on
23 populations (a, b, c, d) and 8 populations (e,f,g,h). (a) MMRR between genetic distance (FST) and geographic distance (GD), (b) MMRR
between genetic distance (FST) and environmental distance (ED), (c) MMRR between environmental distance (ED) and geographic distance
(GD). Regression lines are drawn for the three models a, b, c. (d) shows variance partitioning results of dbRDA on GD and ED. Geographic
distance (GD) comprises eleven continuous rectangular vectors from principal coordinates analyses. Environmental factors include PC
scores of three first components of the PCA (Figure S3). The overlapping zone represents the intersection between IBD and IBE. (e) MMRR
between morphological distance (MD) and FST. (f) MMRR between ED and FST. (g). MMRR between MD and ED. Regression lines are drawn
for the three models e,f,g. (h) shows variance partitioning results of dbRDA on MD and ED. Morphological factors include PC scores of the
first three components of the PCA based on selected uncorrelated variables (Figure S4). Environmental factors include PC scores of three
first components of the PCA (Figure S5). The overlapping zone represents the intersection between IBA and IBE

TA B L E 3 Results of distance-based redundancy analyses (dbRDA) testing the effects of geographic distance (GD), environmental
distance (ED), and morphological distance (MD) on genetic differentiation (FST) among 23 populations and 8 populations of leafless Vanilla
species from Madagascar

 dbRDA (23 populations)                                                          dbRDA (8 populations)

 Marginal tests

 Variables                    F              p           % of variables          Variables                  F           p               % of variables

 FST-GD-ED                        2.91       0.007       48.83                   FST-GD                     0.57        0.855           0
 FST-GD                           2.66       0.006       45.42                   FST-ED (PC1)c              8.74        0.001           52.51
                a                                                                                d
 FST-ED (PC1)                     3.94       0.013       11.80                   FST-MD (PC1)               8.02        0.005           50.06
 FST-ED (PC2)b                12.33          0.001       33.99

 Partial dbRDA

 Variables/                                                                   Variables/
 controlled            F                 p                 % of variables     controlled             F              p                  % of variables

 FST-GD/ED             1.23              0.268             2.65               FST-MD/ED              1.77           0.159              5.42
 FST-ED/GD             6.10              0.001             3.41               FST-ED/MD              2.12           0.09                7.86

Note: In marginal tests of dbRDA, contribution of each explanatory variable (GD, ED, MD) to genetic differentiation was tested separately, while in
partial (conditional) tests, the pure contribution of each factor was obtained after removing the covariate effects of the other factors. For the effects
of ED and MD, only the PC axes that contributed significantly to genetic differentiation were represented. Explanatory variables: aPC1 = BIO6, BIO4,
BIO9, BIO16, BIO13, BIO7, BIO1, BIO3, BIO18; bPC2 = BIO8, ELV, pH; cPC1 = BIO8, BIO10, BIO5, ELV, pH, SILT; dPC1 = TFW, PL, RLSL, ASL, OW,
OWE, CL, AL.

   Where species distribution overlap (Allorge-Boiteau, 2013; Cribb            for many taxa in Madagascar: ecological constraint influenced by bi-
& Hermans, 2009; Portères, 1954) (Figure 1), a combination of strati-          oclimatic disparities, western rainforest refugia, montane refugial di-
fied populations and admixed individuals was detected, mainly in the           versification, riverine barriers, and watersheds (Vences et al., 2009).
northwest (CMK, ATS, BBL, MSL, AKF) and southwest (AKL, MLT)                   Interestingly, a genetic diversity center was revealed in the popula-
populations. These results, therefore, confirm possible sympatry               tions from west of Madagascar (highest He and Ar values, Table 1).
and suggest that genetic exchanges are possible between sympat-                Diversification could have resulted from a postglacial colonization
ric species. Hybridization is a common phenomenon among Vanilla                from a western refuge area (Vences et al., 2009), to the north and
species (Bory et al., 2010; Divakaran et al., 2006; Gigant et al., 2011;       the south, if considering the cline in diversity as the direction of
Nielsen & Siegismund, 1999), with an absence of interspecific ge-              spread (Hewitt, 1996). A similar scenario was suggested on the basis
netic incompatibility, particularly between closely related species            of paleoclimatic data for palm trees in the northeast of Madagascar
(Bory et al., 2010).                                                           (Rakotoarinivo et al., 2013), that have then recolonized the eastern
                                                                               corridor. The general pattern of genetic diversity showed a weak
                                                                               but significant latitudinal shift in the genetic diversity distribution
4.3 | Genetic discontinuities and speciation:                                  (rHe-Latitude = 0.47, p < .04) along the western coast of Madagascar.
forest and montane refugia, and riverine barriers                              In addition to the probable effect of climatic oscillation explained
                                                                               previously, the lowest genetic diversity detected in southern popula-
As genetic groups potentially corresponded to different species, di-           tions might be partially linked to population size reductions (bottle-
versification processes of leafless Vanilla populations in Madagascar          necks), as small and isolated populations are characterized by a low
could be interpreted as speciation mechanisms. Five mechanisms of              genetic diversity and linkage disequilibrium among loci (Frankham
speciation are recognized to be a pattern of diversification common            et al., 2010; Ouborg et al., 2006). Indeed, populations in the south of
2694 | ANDRIAMIHAJA et al.
Madagascar are often exploited for medicinal use (Randrianarivony and environmental distance (IBD ∩ IBE) was the most explanatory
et al., 2017) and reduced by deforestation, as the two southwestern (R 2adj = 42.8%). Indeed, spatial autocorrelation was detected be-
populations (ANJ and SAG) are found in unprotected areas close to tween geographic and environmental distance (Figure 6c). This
villages. Low genetic diversity in fragmented habitats was also ob- can be explained by the presence of clear ecoregions determined
served for some tropical tree populations in Africa (Andrianoelina by the presence of a central mountain range and bioclimatic differ-
et al., 2006, 2009; Farwig et al., 2007). Also, conjugated effects of ences between west/east and north/south, which can lead to eco-
deforestation and climate crisis, particularly emphasized in the south, geographic constraint speciation (Vences et al., 2009). The analysis
could impact on seedlings recruitment (Moles & Westoby, 2004; of the reduced dataset (eight populations) revealed no IBD and no
Rasmussen, 2002). correlation between IBD and IBE. The suppression of this correla-
Significant regions of genetic discontinuities were revealed with tion allowed the pure contribution of these processes to be deter-
BARRIER analysis, between adjacent populations belonging to dif- mined (Wang & Bradburd, 2014). Results from this reduced dataset
ferent genetic groups/species and indicating limited gene flow be- confirmed the significant occurrence of IBE (R 2adj = 52.51%) (with
tween these groups (Figure 4b). The most significant genetic barrier most discriminant variables being related to temperature, eleva-
(0.23 < FST < 0.6) was observed between the genetic group C7 (AND), tion, and soil pH) (Table 3). Moreover, significant IBA (R 2adj = 50.06)
encountered in high altitude (up to 800 m) (Figure 4a, b) in a 49 ha con- (concerning flower size-related measures) was also revealed in this
served forest (Gould & Gabriel, 2015), and the others localized in low dataset. But, there was a strong correlation between environment
altitude, confirming probable differentiation by isolation. AND popu- and morphological variables, making it difficult to disentangle their
lation could be the result of a “montane refugia speciation” supposing relative contribution to the genetic differentiation. Two evolutionary
that population may have survived in high altitude during the climate patterns can possibly explain this situation: Either IBA of floral traits
shift, has adapted over time and remained isolated from the others could indicate pollinator-mediated ecological selection, or ecological
(Fjeldsaå & Lovett, 1997; Vences et al., 2009). Moreover, the AND pop- isolation could have led to drift-induced morphological variations in
ulation showed a high clonality (73%) which probably explains the sig- flower size (Waser & Campbell, 2004). Pollinator-mediated divergent
nificant heterozygote excess (FIS < 0) detected (Halkett et al., 2005). ecological selection acts on flower traits (size, color, shape, odor…),
Rivers can constitute permanent geographic barriers that sep- therefore promoting isolation by adaptation (IBA) via floral isola-
arated the continuous distribution range of populations leading to tion (Van der Niet et al., 2014). In orchids, pollinator specialization
vicariant divergence (Vences et al., 2009). Five genetic boundaries is common (Darwin, 1859; Peter & Johnson, 2014; Tremblay, 1992)
identified by BARRIER analysis matched river separations. Indeed, and requires association between floral characteristics and insect
population KRD and KRM belonging to different genetic groups are traits (Micheneau et al., 2009; Petersson, 2015; Tremblay, 1992). For
geographically separated by two small rivers in the west: Morondava example, an association between spur length of some Angraecoid
and Maharivo (barrier g) (Figure 4a, b). The genetic barrier numbered species and proboscis length of pollinators has been observed in
d traces the path of the great Mangoky river separating the mid- Madagascar (Micheneau et al., 2009). Flower-size variations in Vanilla
West population (KRM) from southwest populations (Figure 4a, b). species could be indicative of a pollinator specialization. Indeed, as
Barriers h, i, and k can be linked to rivers in the north (Figure 4a, noticed in Costa Rica, given the major size differences observed be-
b). To what extent gene flow can be impeded by riverine barriers tween V. planifolia and a newly described species V. sotoarenasii, it is
will have to be further assessed when better knowledge will be ob- unlikely that the same bee species can perform pollination efficiently
tained regarding leafless Vanilla species pollinators and dispersers. in both species (Azofeifa-Bolaños et al., 2017). Similarly, in Peru,
Nevertheless, those riverine barriers might explain part of, but not all small size bees (Melipona sp., Euglossa sp.) were shown to be unable
the genetic differentiation observed between populations/species. to remove pollen from the large flowers of V. grandiflora, as opposed
The occurrence of IBD, IBE, and IBA was therefore also assessed. to Eulaema meriana (Householder et al., 2010; Lubinsky et al., 2006).
Therefore, the eastern populations, with much larger flowers (as
shown for AND), might be characterized by different pollinators
4.4 | Combined effects of IBA and IBE as drivers of than the western ones, and southwestern populations of V. decary-
genetic divergence ana (C5), with the smallest flowers, could be concerned as well by a
certain level of pollinator specificity. However, various arguments
Considering the geographic distribution of the genetic groups iden- are more in favor of the fact that most Vanilla species probably share
tified (Figure 4), some of them seem to be confined to well-defined the same pollinators in Madagascar. For V. bosseri in the Kirindy for-
biomes (e.g., C5, C6 and C7) and AMOVA showed a weak but signifi- est (KRD), Petersson (2015) identified three visiting bee species as
cant (6%) genetic variation between ecoregions. Tested separately on possible pollinators: Macrogalea ellioti, Liotrigona madecassa, and
23 populations, IBD and IBE played a significant role (R 2adj = 45.42% Liotrigona mahafalya. These three bees have a north-west-south dis-
and R 2adj = 45.79%, respectively) on genetic differentiation. tribution (Pauly et al., 2001) matching the combined distributions of
However, partial dbRDA showed a relatively weak (R 2adj = 3.4%), but western Vanilla species. Another potential bee pollinator was also
significant influence of environmental factors on genetic differentia- indicated based on floral morphology traits, Lithurgus pullatus which
tion and no contribution of IBD. The combined effect of geographic has a disjunct southwestern and northeastern distribution (PaulyYou can also read