Divergent selection and heterogeneous genomic divergence
←
→
Page content transcription
If your browser does not render page correctly, please read the page content below
Molecular Ecology (2009)                                                                                   doi: 10.1111/j.1365-294X.2008.03946.x

INVITED REVIEW
Blackwell Publishing Ltd

Divergent selection and heterogeneous genomic divergence
PAT R I K N O S I L ,*§ D A N I E L J . F U N K † and D A N I E L O RT I Z - B A R R I E N T O S ‡
*Zoology Department and Biodiversity Research Centre, University of British Columbia, Vancouver BC, Canada, V6T 1Z4,
†Department of Biological Sciences, Vanderbilt University, Nashville, Tennessee 37235, USA, ‡School of Integrative Biology,
University of Queensland, St Lucia, Qld 4702, Australia

                           Abstract
                           Levels of genetic differentiation between populations can be highly variable across the
                           genome, with divergent selection contributing to such heterogeneous genomic divergence.
                           For example, loci under divergent selection and those tightly physically linked to them may
                           exhibit stronger differentiation than neutral regions with weak or no linkage to such loci.
                           Divergent selection can also increase genome-wide neutral differentiation by reducing
                           gene flow (e.g. by causing ecological speciation), thus promoting divergence via the stochastic
                           effects of genetic drift. These consequences of divergent selection are being reported in
                           recently accumulating studies that identify: (i) ‘outlier loci’ with higher levels of divergence
                           than expected under neutrality, and (ii) a positive association between the degree of adaptive
                           phenotypic divergence and levels of molecular genetic differentiation across population
                           pairs [‘isolation by adaptation’ (IBA)]. The latter pattern arises because as adaptive diver-
                           gence increases, gene flow is reduced (thereby promoting drift) and genetic hitchhiking
                           increased. Here, we review and integrate these previously disconnected concepts and liter-
                           atures. We find that studies generally report 5–10% of loci to be outliers. These selected
                           regions were often dispersed across the genome, commonly exhibited replicated diver-
                           gence across different population pairs, and could sometimes be associated with specific
                           ecological variables. IBA was not infrequently observed, even at neutral loci putatively
                           unlinked to those under divergent selection. Overall, we conclude that divergent selection
                           makes diverse contributions to heterogeneous genomic divergence. Nonetheless, the
                           number, size, and distribution of genomic regions affected by selection varied substantially
                           among studies, leading us to discuss the potential role of divergent selection in the growth
                           of regions of differentiation (i.e. genomic islands of divergence), a topic in need of future
                           investigation.
                           Keywords: chromosomal inversions, ecological genetics, FST, introgression, neutral gene flow,
                           outlier loci, population genomics, QTL mapping, speciation

                           Received 21 February 2008; revision received 1 August 2008; accepted 27 August 2008

                                                                                 2005; Mallet 2005; Turner et al. 2005; Harr 2006; Noor &
Introduction
                                                                                 Feder 2006; Begun et al. 2007; Mallet et al. 2007; Via & West
Levels of genetic differentiation can be highly variable                         2008; see glossary for terminology). Genomic divergence
across the genome, a pattern we refer to here as ‘hetero-                        may be particularly heterogeneous during the process of
geneous genomic divergence’ (Harrison 1991; Avise 2000;                          population divergence and speciation, during which genetic
Rieseberg 2001; Via 2001; Wu 2001; Ortiz-Barrientos et al.                       differentiation accumulates in some regions, while the
2002; Orr et al. 2004; Wu & Ting 2004; Gavrilets & Vose                          homogenizing effects of gene flow or inadequate time for
                                                                                 random differentiation by genetic drift precludes divergence
Correspondence: Patrik Nosil, Fax: +493089001-300.                               in other regions (Wu 2001; Gavrilets & Vose 2005). Many
E-mail: patrik.nosil@wiko-berlin.de                                              factors potentially contribute to heterogeneous genomic
§Present address: Wissenschaftskolleg zu Berlin, Institute for                   divergence, including selection arising from ecological causes
Avanced study, Wallostrasse 19, 14193, Berlin.                                   (Schluter 2000; Wu 2001) or genetic conflict (Rice 1998;

© 2009 The Authors
Journal compilation © 2009 Blackwell Publishing Ltd
2 P. N O S I L , D . J . F U N K a n d D . O RT I Z - B A R R I E N T O S
Fig. 1 Predicted patterns of genetic differentiation for different classes of loci (highlighted by grey coloration in the FST distributions) when
divergent selection is present and absent (ecologically divergent and ecologically similar population pairs, respectively), for divergence both
without and with gene flow (allopatry and nonallopatry, respectively). When divergent selection occurs, the processes expected to most
strongly affect differentiation for each class of locus are noted above the expected degree of divergence. When divergent selection is absent,
only drift or gene flow affect each class of locus (FST distributions would look similar but with a less extreme right-hand tail). Ecological
divergence yields outlier status under both geographic scenarios. Class II loci should exhibit IBA in both allopatry and nonallopatry, while
class III loci should only exhibit IBA under the nonallopatric scenario because neutral divergence in allopatry is independent of degree of
ecological divergence. Patterns of heterogeneous genomic divergence are evident, such that genetic divergence generally varies among
classes of loci as follows: class I > class II > class III.
Presgraves et al. 2003; Haig 2004; Arnqvist & Rowe 2005; mechanism facilitates differentiation by a different process
Crespi 2007; Presgraves 2007), the stochastic effects of (drift). This second mechanism applies only to divergence
genetic drift (Kimura 1968, 1986; King & Jukes 1969; Ohta with gene flow because in allopatric scenarios, divergent
1992, 2002), variable mutation rates (Balloux & Lugon- selection is not required to counter gene flow in order for
Moulin 2002; Hedrick 2005; Noor & Feder 2006), the genomic neutral population differentiation to proceed. While these
distribution and effect size of genes under selection basic mechanisms account for heterogeneity in the origin
(Orr 2005), and chromosomal structure (Noor et al. 2001; and frequency of highly differentiated genomic regions,
Rieseberg 2001; Ortiz-Barrientos et al. 2002). and in their degree of differentiation, selection may also
We focus here on the contributions of divergent selec- affect the actual size of such ‘islands of genomic diver-
tion, defined as selection that acts in contrasting directions gence’ on a chromosome (Turner et al. 2005; Harr 2006;
in two populations (cf. Schluter 2000; Rundle & Nosil Begun et al. 2007; Turner & Hahn 2007; see glossary).
2005). Divergent selection itself can promote molecular Here, we review these roles for divergent selection in
genetic differentiation via two main mechanisms: (i) by generating heterogeneous genomic divergence, and further
acting on specific loci and those physically linked to them consider the nature and growth of islands of genomic
(Fisher 1930; Haldane 1930, 1932; Endler 1973; Lewontin divergence. We consider mainly conceptual issues and
& Krakauer 1973; Barton 2000), and (ii) by promoting empirical patterns, because methodology has been well
reproductive isolation that causes barriers to gene flow covered elsewhere (e.g. Beaumont & Nichols 1996; Andol-
(i.e. ‘ecological speciation’, Mayr 1963; Funk 1998; Schluter fatto 2001; Black et al. 2001; Schlötterer 2002; Luikart et al.
2000; Rundle & Nosil 2005), thereby facilitating even 2003; Beaumont & Balding 2004; Beaumont 2005; Nielsen
genome-wide neutral divergence via genetic drift. The first 2005; Storz 2005; Vasemagi & Primmer 2005; Hahn 2006;
mechanism involves a relatively direct role for selection in Hedrick 2006; Noor & Feder 2006; Bonin et al. 2007; Foll
genetic differentiation and promotes divergence both in & Gaggiotti 2008; Riebler et al. 2008; Stinchcombe &
the presence and absence of gene flow (Fig. 1). The second Hoekstra 2008). We focus on divergence during the process
© 2009 The Authors
Journal compilation © 2009 Blackwell Publishing LtdSELECTION AND GENOMIC DIVERGENCE 3
of population differentiation and speciation, and note that 2000; Andolfatto 2001). In essence, under hitchhiking, the
during this process, loci under divergent selection and loci effect of selection on loci affecting fitness spills over to
causing reproductive isolation behave similarly, differenti- neutral loci. The effect of hitchhiking depends on a number
ating more strongly (even during allopatric divergence), and of factors, but strongly on the ratio of recombination
introgressing less freely than other loci (Barton 1979, 1983; frequency and selection strength (r/s), with stronger selection
Barton & Hewitt 1989; Mallet 1995, 2005, 2006; Wu 2001; and lower recombination yielding greater effects on linked
Wu & Ting 2004; Nosil et al. 2005). While acknowledging loci (Bodmer & Parsons 1962; Felsenstein 1981; Charlesworth
this similarity (see the Supporting information for further et al. 1997; Barton 2000; Andolfatto 2001; Ortiz-Barrientos
discussion), we focus on divergent selection per se. Our et al. 2002; Butlin 2005). This concept is illustrated in
frequent use of ‘selection’ is shorthand for ‘divergent selec- Fig. 2A and also implicit in Fig. 2B, which further illustrates
tion’, while ‘genetic differentiation’ refers to ‘molecular how genetic divergence at neutral loci decreases with
genetic differentiation’. distance from a selected locus. Hitchhiking can also have
In the order presented, the specific aims of this study are stochastic effects; by reducing Ne at loci affected by selection,
to: (i) discuss theory and make explicit predictions about it can amplify divergence via genetic drift (Robertson 1961;
divergent selection and heterogeneous genomic diver- Hill & Robertson 1966; Santiago & Caballero 1998).
gence (Table 1), aided by the metaphor of genomic islands Thus, loci under selection and those tightly physically
of divergence, (ii) review empirical studies testing for loci linked to them should exhibit greater differentiation than
whose genetic divergence exceed neutral expectations, that distantly linked or unlinked neutral regions (Fig. 2;
is, ‘outlier loci’, which putatively represent the genetic Lewontin & Krakauer 1973; Bowcock et al. 1991; Beaumont
signature of divergent selection, (iii) review empirical & Nichols 1996; Black et al. 2001; Schlötterer 2002; Luikart
studies testing whether adaptive phenotypic divergence et al. 2003; Beaumont & Balding 2004; Beaumont
facilitates molecular genetic differentiation, (iv) describe 2005; Nielsen 2005; Storz 2005; Vasemagi & Primmer 2005;
how selection may promote the growth of genomic islands Nachman 2006; Foll & Gaggiotti 2008; Riebler et al. 2008;
of divergence, and (v) integrate our findings and offer Stinchcombe & Hoekstra 2008). Divergent selection thus
suggestions for future research. results in outlier loci whose genetic divergence exceeds
neutral expectations. When testing for outliers, simulations
are generally used to determine the upper level of genetic
How selection generates heterogeneous genomic
divergence expected under neutrality, and loci whose
divergence: processes and patterns
genetic differentiation exceeds this neutrality threshold are
We classify loci into three categories according to how they deemed outliers (Fig. 3A). Genetic differentiation itself is
are affected by selection: (i) loci under divergent selection often quantified using FST, a fixation index that measures
and those tightly linked to them, (ii) loci loosely linked to the degree of population differentiation (Wright 1940;
those under selection, and (iii) neutral loci that are unlinked Hudson et al. 1992). A final point is that new mutations are
to selected loci. This categorization scheme is somewhat more likely to diverge between populations if they arise in
arbitrary because the effects of selection vary continuously, genomic regions already under divergent selection (i.e.
but is nonetheless useful because it relates to what can be that already exhibit reduced introgression). Consequently,
empirically determined, for example, whether an affected regions of strong differentiation are predicted to accu-
locus is an outlier (see Fig. 1 and below). mulate in clusters within the genome, rather than being
randomly distributed throughout it (see discussion of
genomic island growth) (Rieseberg 2001; Navarro &
Direct selection and its effect on tightly linked neutral loci
Barton 2003; Gavrilets 2004, chapter 6; Kirkpatrick &
(outlier loci)
Barton 2006).
Divergent selection on a locus will cause its adaptive Here, we review findings from studies testing for outlier
divergence to a degree that often reflects a balance between loci in natural populations. Other methods of evaluating
the strength of selection and rates of gene flow (Fisher the molecular signatures of selection exist, such as McDonald–
1930; Haldane 1930, 1932; Wright 1931, 1940; Bulmer 1972; Kreitman tests and candidate gene approaches (see Nielsen
Endler 1973; Felsenstein 1976, 1981; Barton 1983; Slatkin 2005; Nachman 2006 for reviews; O’Malley et al. 2007).
1985; Hendry et al. 2001; Butlin 2005). However, selection However, because our study concerns population-level
on one locus can also strongly affect the frequency of alleles patterns of genomic heterogeneity, we focus on methods
at physically close or ‘tightly linked’ loci, even when the that can evaluate divergent selection in large numbers of
latter are selectively neutral. This process, whereby the gene regions across the genome. In particular, we discuss
frequency of alleles changes in concert with linked selected ‘genome scans’, in which many individuals are screened
ones, has been termed genetic hitchhiking (Maynard Smith for variation in dozens or hundreds of molecular markers
& Haigh 1974; Kaplan et al. 1989; for reviews see Barton (Lewontin & Krakauer 1973; Bowcock et al. 1991; Beaumont
© 2009 The Authors
Journal compilation © 2009 Blackwell Publishing Ltd4 P. N O S I L , D . J . F U N K a n d D . O RT I Z - B A R R I E N T O S
& Nichols 1996; Andolfatto 2001; Black et al. 2001; Vitalis
et al. 2001, 2003; Schlötterer 2002; Luikart et al. 2003; Beaumont
& Balding 2004; Beaumont 2005; Nielsen 2005; Storz 2005;
Vasemagi & Primmer 2005; Hahn 2006; Hedrick 2006; Noor
& Feder 2006; Bonin et al. 2007; Foll & Gaggiotti 2008;
Riebler et al. 2008; Stinchcombe & Hoekstra 2008). By dis-
tinguishing outliers from putatively neutrally evolving
(nonoutlier) loci, genome scans enable the quantification of
regions under selection, the evaluation of their distribution
across the genome [e.g. by evaluating linkage disequilib-
rium(LD)], tests for replicated differentiation across popu-
lation comparisons, the comparison of evolutionary patterns
at outlier vs. neutral loci, etc. Genome scans therefore allow
the investigation of how and why divergence varies across
the genome, outstanding questions in evolutionary genetics
(Orr 2005). Genome scans typically employ anonymous
molecular markers whose chromosomal positions are
unknown, but may also be combined with classical genetic
approaches such as quantitative trait locus (QTL) mapping
(Rogers & Bernatchez 2005; Via & West 2008; see Fig. 3B.)
Loosely linked neutral loci: additional effects of hitchhiking
Loci that are too far removed along a chromosome from a
selected site for hitchhiking to elevate them to outlier status
may nonetheless be somewhat influenced by selection,
because hitchhiking effects can extend a considerable
distance from the selected locus (Charlesworth et al. 1997;
Nielsen 2005; Via & West 2008; Figs. 2B and 3B). Such
nonoutlier loci are referred to as loosely linked (= weakly
linked) and are expected to exhibit moderately elevated
differentiation compared to completely unlinked neutral
loci. Selection acting on loosely linked loci thus further
contributes to heterogeneous genomic differentiation (Fig. 1).
These effects of loose linkage were characterized by
Charlesworth et al. (1997) using a combination of simula-
tions and analytical theory. These authors found that
strong divergent selection (s = 0.5) resulted in elevated
Fig. 2 Divergent selection’s contributions to heterogeneous
differentiation of neutral loci relative to the case where
genomic divergence. (A) Genetic hitchhiking — allele frequencies.
divergent selection was absent, with such effects extending
The net increase in allele frequency of a neutral allele (y-axis) via
hitchhiking, under the spread of an advantageous new mutation far along the chromosome and persisting despite high
(Barton 2000 for further details on scaling of the axes). Nb refers to recombination rates. Under moderate selection (s = 0.1),
neighbourhood (i.e. population) size. Modified from Barton (2000) differentiation was less elevated from neutral expectations
and reprinted with permission of the Royal Society of London. (B) and approached neutral expectations when the distance
Hitchhiking — genetic divergence. Simulation results showing the from the selected site exceeded two Morgans (Fig. 2B).
effects of divergent selection on levels of differentiation at linked
Thus, the effects of hitchhiking on genetic differentiation
neutral sites, for two demes exchanging migrants (background
are positively related to the strength of selection.
selection present, but similar patterns observed in its absence).
Modified from Charlesworth et al. (1997, see for details) with These observations yield the prediction that at neutral
permission of Cambridge University Press. (C) Relationship loci loosely linked to those under selection, levels of genetic
between neutral FST and Nm across empirical studies of animals differentiation among population pairs will be positively
(data from Morjan & Rieseberg 2004). Note that FST increases when correlated with degree of adaptive phenotypic divergence
divergent selection reduces Nm (e.g. by selecting against (a proxy for the strength of divergent selection) across
immigrants). For example, reducing Nm from five to just below
population pairs (Fig. 3C). We hereafter refer to such associ-
one considerably increases FST (see thick arrow).
ations as ‘isolation by adaptation’ (IBA, following Nosil
© 2009 The Authors
Journal compilation © 2009 Blackwell Publishing LtdSELECTION AND GENOMIC DIVERGENCE 5
et al. 2008; see also Foll & Gaggiotti 2006; Faubet & Gaggiotti
2008; D.J. Funk, S.P. Egan, P. Nosil, Vanderbilt University,
Nashville, TN, in preparation). IBA is most convincing
when associations are demonstrated while controlling for
the effects of geographic distance. IBA is analogous (and
complementary) to the well-known pattern of isolation by
distance (IBD; Wright 1943; Slatkin 1993; Rousset 1997), in
which genetic differentiation increases with geographic
distance, rather than adaptive divergence (see also Hendry
& Day 2005 for temporal effects on genetic differentiation).
Unlinked neutral loci: general barriers to neutral gene
flow
Divergent selection can also have more indirect yet
widespread effects on heterogeneous genomic divergence,
by reducing gene flow between populations (Barton &
Bengtsson 1986; Pialek & Barton 1997; Gavrilets & Cruzan
1998; Gavrilets 2004) and thereby facilitating neutral
divergence across the genome via genetic drift (Fig. 2C).
The basic scenario is one in which a population is subject to
continuous immigration. Due to divergent local adaptation,
immigrants have lower fitness than residents, yielding
selection against immigrants (Mallet & Barton 1989; Funk
1998; Via et al. 2000; Hendry 2004; Nosil et al. 2005 for
review). In this fashion, selection against incoming, locally
maladapted alleles will act as a ‘general barrier’ to the spread
of neutral alleles between populations (Bengtsson 1985;
Barton & Bengtsson 1986; Pialek & Barton 1997; Gavrilets &
Cruzan 1998; Navarro & Barton 2003; Gavrilets & Vose 2005).
The effective immigration rate of neutral alleles is
slowed even further under assortative mating (Gavrilets
2004, p. 148; for a theoretical summary, see the Supporting
information). For example, when populations evolve pref-
erences for their native habitat, the resulting decrease in
between-habitat dispersal may reduce opportunities for
between-population mating, yielding habitat isolation and
reducing gene flow between populations. In fact, any
reproductive barrier, by definition, reduces gene flow,
Fig. 3 Empirical patterns illustrating heterogeneous genomic differentiation between clover- and alfalfa-associated pea aphids
divergence. (A) Outlier detection using the genome scan approach, as a function of distance from QTL. On the left, the panel depicts a
for a pair of Neochlamisus bebbianae leaf beetle populations. hypothetical decrease in FST along a chromosome with increasing
Simulations determine the upper level of genetic divergence distance from a QTL. On the right, real data depict markers
expected under neutrality, and loci that exceed this ‘neutrality that were outliers (filled circles) and nonoutliers (open circles).
threshold’ (solid line, in this case 95% quantile) are inferred to have Triangles show the predicted values from a logistic regression of
evolved under divergent selection. If outliers are highly replicated outlier status on distance to the nearest QTL. Modified from Via
across population pairs that have diverged ecologically, then & West (2008) and reprinted with permission of Blackwell
population trees from pooled outlier loci are likely to group Publishing. (C) Pattern depicting IBA, in which neutral genetic
populations according to ecology (e.g. box colour indicates host differentiation between population pairs of Timema cristinae
plant), reflecting divergent selection. In contrast, trees from walking-stick insects is positively correlated with their degree of
putatively neutral nonoutlier loci may group populations adaptive divergence (here measured as the degree of divergence in
according to geography, reflecting spatial opportunities for gene host plant preferences), independent of geographic distance.
flow. Modified from Egan et al. (2008) and reprinted with Modified from Nosil et al. (2008) and reprinted with permission of
permission of the Society for the Study of Evolution. (B) Genetic the Society for the Study of Evolution.
© 2009 The Authors
Journal compilation © 2009 Blackwell Publishing Ltd6 P. N O S I L , D . J . F U N K a n d D . O RT I Z - B A R R I E N T O S
thereby potentially facilitating neutral genetic divergence terintuitive effects of selection on nonselected genomic
via drift. Notably, adaptive divergence can promote the regions (via either loose linkage or general barriers). We
evolution of all such barriers, including ‘nonecological’ discuss factors affecting the prevalence and extent of IBA.
ones such as intrinsic hybrid inviability (Bateson 1909; For example, under the general barriers scenario, the
Dobzhansky 1936, 1937, 1951; Muller 1940, 1942; Orr 1995; proportion of loci exhibiting IBA should vary according to
Orr & Turelli 2001; Gavrilets 2004; Dettman et al. 2007), via factors that affect genetic drift, such as levels of gene flow
by-product models of ecological speciation (Mayr 1947, and effective population size. Another prediction is that if
1963; Funk 1998; Lu & Bernatchez 1999; Schluter 2000; IBA is detected in the absence of gene flow (e.g. at spatial
Ogden & Thorpe 2002; Rundle & Nosil 2005; Funk et al. scales beyond that at which gene flow occurs), then it is
2006; Vines & Schluter 2006). We hereafter refer to this more likely to have arisen via loose linkage than via general
scenario, whereby selection facilitates drift by reducing barriers.
gene flow, as the ‘general barriers’ mechanism.
The ‘general barriers’ mechanism can generate heteroge-
Genomic islands of divergence: an integrated view of
neous genomic divergence due the stochastic nature of
genomic heterogeneity
drift, which causes different neutral loci within a population
to differentiate to varying degrees. The process also predicts To help understand how the above processes combine
that more adaptively divergent populations will experi- to generate heterogeneous genomic divergence, we use
ence greater gene flow reduction and associated neutral the concept of ‘genomic islands of divergence’ (Wu 2001;
differentiation, yielding the pattern of IBA (Thibert-Plant Turner et al. 2005; Harr 2006; Turner & Hahn 2007). Here,
& Hendry, 2008). Under the general barriers scenario, we define a ‘genomic island’ as any gene region, be it a
IBA is particularly analogous to IBD, as both can affect neutral single nucleotide or an entire chromosome, that exhibits
loci unlinked to those under selection. An open empirical significantly greater differentiation than expected under
question is how commonly adaptive divergence restricts neutrality. We conceptually extend the metaphor of genomic
gene flow strongly enough to generate IBA at such loci, islands of divergence by comparing the heterogeneous
given that even small amounts of gene flow can over- genetic differentiation observed along a chromosome to
whelm the ability of drift to cause neutral differentiation the topography of oceanic islands and the contiguous sea
(Fig. 2C; Wright 1931, 1940; Barton & Bengtsson 1986). floor to which they are connected. The concept is visually
Another issue is that if time since population divergence depicted in Fig. 4.
is the main predictor of adaptive and genetic divergence, Following this metaphor, sea level represents the thresh-
then the pattern of IBA may arise without general barriers, old above which observed differentiation is significantly
simply because both types of divergence increase with greater than expected by neutral evolution alone. Thus, an
time (Rogers 1986; Lande 1992; Whitlock 1999; Merila & island is composed of loci — both selected (dark grey) and
Crnokrak 2001; McKay & Latta 2002). Nonetheless, theory tightly linked neutral (white) loci — that should be identi-
indicates that IBA may commonly be generated by general fiable as outliers in a genome scan. Island elevation (differ-
barriers because gene flow represents the predominant entiation) is a function of selection strength. Selection also
force affecting levels of genetic differentiation, even under contributes to island size, representing the length of con-
low migration rates (Wright 1931, 1943; Slatkin 1993; Beau- tiguous highly differentiated chromosome. Loosely linked
mont & Nichols 1996; Hartl & Clark 1997; Rousset 1997; (light grey) loci are depicted as regions far enough from
Balloux & Lugon-Moulin 2002; Hedrick 2005). From an selected loci to fall below sea level as nonoutliers, but still
empirical perspective, recently developed coalescent-based close to the surface, being more highly differentiated than
methods can be used to estimate migration rate (m) sepa- most unlinked neutral loci. The differentiation of such loci
rately from divergence time (Nielsen & Wakeley 2001; Hey will also be a function of selection strength, yielding IBA.
& Nielsen 2004; Hey 2006; Nosil 2008), thereby allowing Farther still from the selected locus, the sea floor drops
IBA to be tested while controlling for time since divergence. more steeply, with variation in its topography representing
Another point is that if IBA arises via selective processes, the variable levels of baseline neutral differentiation
then absolute values of adaptive divergence (e.g. quanti- occurring by genetic drift alone. Thus, the sea floor may
tative trait divergence measured using QST) are expected to be rather homogeneous during divergence with gene flow,
exceed those of FST, despite the correlation of these two where gene exchange between populations homogenizes
measures (Rogers 1986; Lande 1992; Whitlock 1999). Thus, most neutral differentiation However, if selection promotes
time vs. adaptation can potentially be distinguished as general barriers to gene flow during such nonallopatric
alternative causes of IBA. divergence, genome-wide differentiation under drift is
In our review, we focus on the exhibition of IBA by neutral facilitated. This is illustrated by a shallow sea with undersea
loci that are not tightly linked to those under selection, mounts whose proximity to sea level will vary as a function
because such IBA is an expression of the somewhat coun- of selection strength (light grey caps depict loci whose
© 2009 The Authors
Journal compilation © 2009 Blackwell Publishing LtdSELECTION AND GENOMIC DIVERGENCE 7
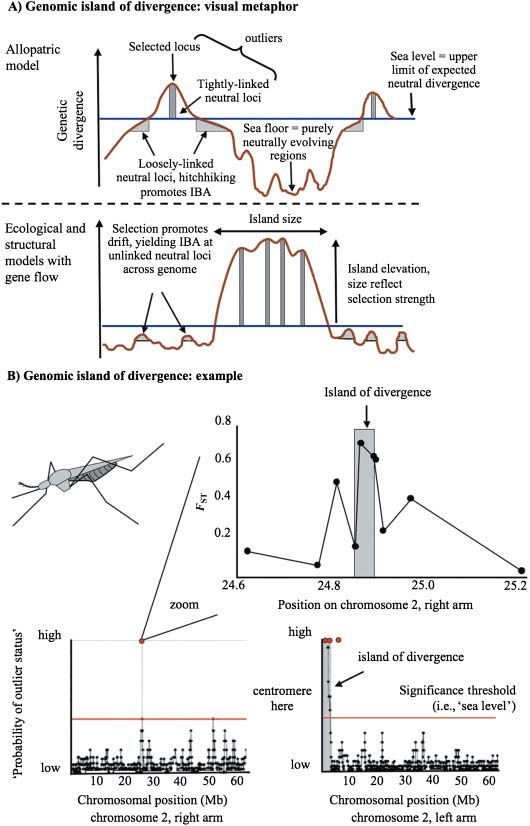
Fig. 4 The metaphor of genomic islands of
divergence. (A) Schematic illustration of
expected patterns of differentiation along
a chromosome under models with and
without gene flow. Sea level represents a
‘neutrality threshold’. Islands are genomic
regions exhibiting greater differentiation
than expected under neutrality, thereby
rising above sea level. See text for further
details. (B) An empirical example involving
incipient species of Anopheles gambiae. The
bottom two panels depict patterns of
differentiation across chromosome 2 (Turner
et al. 2005). Grey areas were identified as
highly differentiated in sliding window
analyses, with differentiation further
confirmed by sequencing loci within these
regions (red circles). A large island is
evident on the left arm, near the
centromere. A small island is also evident
on the right arm. The top panel treats a
subsequent study (Turner & Hahn 2007)
where portions of all annotated genes
within the smaller island were sequenced.
As predicted by Turner et al. (2005),
sequence differentiation peaked within
the ‘island’ (between the grey lines).
However, the fine-scale data from Turner
& Hahn (2007) allow more detailed
characterization of the nature of the island,
showing, for example, that differentiation
drops off rapidly with distance from the
region of maximum differentiation (i.e. the
island is very steep). Modified from the
original studies and reprinted with per-
mission of the Public Library of Science
and the Society of Molecular Biology and
Evolution.
differentiation was facilitated by general barriers such that growth (Rieseberg 2001; Navarro & Barton 2003; Gavrilets
they contribute to IBA). In contrast, the sea floor is expected 2004, chapter 6; Kirkpatrick & Barton 2006).
to be more heterogeneous during allopatric divergence,
where the absence of gene flow allows the stochasticity of
Literature reviews
divergence due to drift and variable mutation rates to
be more fully expressed (Balloux & Lugon-Moulin 2002; We conducted two literature reviews to evaluate critical
Hedrick 2005). Notably, the islands themselves may grow issues relating to genomic heterogeneity. First, we review
through time, because new mutations are more likely to genome scan studies seeking to identify outlier loci
differentiate if they arise in or adjacent to regions already exhibiting elevated divergence (Table 2). Second, we review
subject to divergent selection, thus contributing to island studies that allow the evaluation of IBA (Table 3).
© 2009 The Authors
Journal compilation © 2009 Blackwell Publishing Ltd8 P. N O S I L , D . J . F U N K a n d D . O RT I Z - B A R R I E N T O S
Table 1 Predictions concerning the roles of divergent selection role in heterogeneous genomic divergence. Both effects on particular gene
regions (see also Fig. 1) and models of the growth of differentiated regions (i.e. ‘islands’; Fig. 4) are treated
Type of locus Predictions
Locus directly under selection — strong genetic divergence at these loci (as illustrated by, e.g. outlier status)
Locus tightly physically linked — strong genetic divergence at these loci (as illustrated by, e.g. outlier status)
to those under selection
Locus loosely physically linked — moderately increased genetic divergence compared to neutrality
to those under selection — IBA pattern should be observed even beyond the spatial scale of gene flow
(e.g. among completely allopatric populations)
Neutral, unlinked loci (affected — IBA expected at the spatial scale of gene flow if gene flow is sufficiently reduced to
by ‘general barriers’) allow divergence via genetic drift (i.e. selection and reproductive isolation must be strong);
— likelihood of IBA increases with decreasing Ne (i.e. as drift becomes more effective)
Models for growth of Predictions
differentiated regions
I. Allopatric model — many differentiated regions (i.e. ‘genomic islands’)
— islands need not be clustered within the genome, and will often be small in size
— number and elevation of islands increases with time since population divergence
II. Ecological model (divergent — large islands will occur
selection with gene flow) — genomic clustering of islands, with genes affecting local adaptation and reproductive
isolation residing within these clusters, perhaps fewer islands than the allopatric model
— islands need not involve chromosomal inversions (e.g. supergenes)
— small islands, which have not yet grown, are also possible
III. Structural model — genomic differentiation is facilitated by chromosomal inversions and other factors
that reduce recombination, dependent on the degree to which genes affecting local
adaptation and reproductive isolation reside within inversions
— the extent of this facilitation also depends on how far outside an inversion the
introgression reducing effects of the inversion extend
— islands can be larger than in the other models, and persist for longer periods of time
such studies where appropriate. This approach located 20
Literature review 1: genome scans and outlier loci
relevant studies (Table 2; a few QTL studies are treated
Numerous methodological issues arise when interpreting separately), a modest number that demonstrates the nascent
genome scans, including aspects of experimental design state of this field. Nonetheless, these studies illustrated a
and data collection. Major issues include the relationship number of emerging patterns, which are discussed below.
between type I error and outlier detection (reflecting the
multiple comparisons involved in screening large numbers Proportion of genome exhibiting outlier behaviour We found
of loci), disentangling the effects of mutation rate variation, substantial, but not extreme, variation in the proportion of
demography, and selection on levels of genetic divergence, loci identified as outliers across studies. This observation
and determining the ecological causes of the divergent holds for studies considering all reported outlier loci
selection. We report on the methodological robustness of each (range: 0.4–24.5%, mean: 8.5%, n = 18), those that only
study described here in the Supporting information, and refer tallied outliers observed in multiple population pairs (i.e.
readers to the previous reviews cited in the Introduction for studies examining ‘replicated divergence’: range: 1.4–12.0%,
more detailed treatment of methodological issues. mean: 5.8%, n = 7), and studies examining the distribution
of outliers within and between ecological types (range:
Identifying relevant genome scan studies Relevant papers 0.4–9.0%, mean: 4.5%, n = 5). Note that these percentages
were identified from a Web of Science (WOS) search on quantify the proportion of loci that were outliers in at least
‘genome scan and selection’, and from the studies cited by one (or, in the case of replicated outliers, at least two) of
these papers. In order to focus on genome-wide patterns in a study’s pairwise population comparisons, rather than
natural populations, our review excluded studies that were mean proportions across individual comparisons. These
genomically restricted (e.g. those evaluating a single estimates should be interpreted with great caution, as
chromosome or assaying markers known a priori to be different studies varied in the number of populations and
linked to QTL), treated humans or domesticated species, or individuals examined, molecular markers employed,
did not use divergence-based methods (e.g. those evaluating methods for estimating baseline neutral differentiation and
selective sweeps within populations), although we cite criteria determining outlier status (see Table 2 and the
© 2009 The Authors
Journal compilation © 2009 Blackwell Publishing LtdJournal compilation © 2009 Blackwell Publishing Ltd
© 2009 The Authors
Table 2 Summary of genome scan studies. Provided is the study system, a description of the divergent forms being compared, the type and number of markers used, the study design
(‘compare divergence’ = compare population divergence among loci), the main result with respect to outliers, patterns observed in population trees, and levels of linkage disequilibrium
(LD) among outlier loci. More specifically, the ‘Population trees differ?’ column addresses whether population trees from neutral (nonoutlier) loci group populations by geography,
whereas trees that include (or only use) outlier loci group populations by ecology. Here, ‘Yes’ indicates that outlier-including trees result in groupings that are consistent with monophyly
of the same ecological type, and ‘Partially’ indicates that outlier-including trees are more structured by ecology than neutral trees but do not provide evidence of complete monophyly by
ecological type. For detailed consideration of the methodological robustness of each study, see the Supporting information
Data (marker, no. of Population
Study system Divergent forms loci) Study design Main result — outliers trees differ? LD? Reference
Studies examining parallel divergence/association with ecological parameters
1. Littorina saxatilis Upper vs. lower shore 306 AFLP loci Compare divergence 5% of loci Yes Low, except in middle Wilding et al.
(intertidal snails) ecotypes between sympatric consistently outliers of cline, implying any 2001; Grahame
ecotypes at three between ecotypes at LD is generated by et al. 2006;
different shores all three shores migration Wood et al.
2008
2. Coregonus Dwarf vs. normal lake 440 AFLP loci Compare divergence up to 3.2% of loci Yes Possibly moderate, as Campbell &
clupeaformis ecotypes between sympatric outliers between outlier loci were Bernatchez
(whitefish) ecotypes from four ecotypes, 1.4% nonrandomly 2004
different lakes outliers in all four distributed among
lakes primer combinations
3. Salmo salar Saltwater vs. brackish 95 genomic and EST- Compare divergence 23–26% of loci N/A N/A Vasemagi et al.
SELECTION AND GENOMIC DIVERGENCE 9
(Atlantic salmon) vs. freshwater habitats derived mini- and for four population outliers, 9% of EST 2005
microsatellites pairs occupying derived loci were
different habitats, at outliers at different
local and global spatial scales,
spatial scales population pairs, and
geographic regions
4. Rana temporaria Altitudinal gradient 392 AFLP loci Compare divergence 8–14% of loci outliers, Yes N/A Bonin et al.
(common frog) between twelve roughly 2% of loci 2006
population pairs involved in
differing in altitude altitudinal
adaptation
specifically
5. Hylobius abietis N/A 83 AFLP loci Compare divergence 6% of loci outliers, N/A N/A Joost et al. 2007
(pine weevil) among six forest two loci (2.4%)
regions, and relate strongly correlated
genetic divergence with variation in
to environmental environmental
variables parameters10 P. N O S I L , D . J . F U N K a n d D . O RT I Z - B A R R I E N T O S
Table 2 Continued
Data (marker, no. of Population
Study system Divergent forms loci) Study design Main result — outliers trees differ? LD? Reference
Studies examining divergence within vs. between ecological forms
6. Zeiraphera diniana Sympatric larch- vs. 1291 AFLP loci Compare heterogeneity of N/A Possibly high, Emelianov
(herbivorous insect) pine-feeding host forms heterogeneity of genomic divergence reflecting et al. 2004
genomic divergence between sympatric concentration of
between sympatric host forms, but not loci involved in
host forms (four between geographic between-race
comparisons) vs. populations of the differentiation on just
between populations same form a few chromosomes
of the same form (six
comparisons)
7. Cryptomeria Slender branched, soft- 139 CAPS markers Compare divergence 10% of loci outliers, N/A N/A Tsumura et al.
japonica (coniferous leaved vs. rough based on cDNA using 29 6.5% outliers only 2007
tree) branched hard-leaved sequences populations, between varieties
variety considering
divergence among
populations within
and between
varieties
8. Timema cristinae Adenostoma and 534 AFLP loci Compare divergence 8% of loci outliers in Partially Low, but higher than Nosil et al. 2008
(walking-stick insect) Ceanothus host plant between nine multiple for nonoutliers within
ecotypes population pairs on comparisons, 1–2% both allopatric and
different hosts and outliers only in paraptric
between six between-host populations,
population pairs on comparisons with consistent with some
Journal compilation © 2009 Blackwell Publishing Ltd
the same host weak parallel weak physical linkage
divergence among
pairs
9. Neochlamisus Willow and maple host 447 AFLP loci Compare divergence 15% of loci outliers in Yes Low Egan et al. 2008
bebbinae (leaf beetle) forms between nine multiple
population pairs on comparisons, 5%
different hosts and outliers only in
between six between-host
population pairs on comparisons with
the same host strong parallel
divergence among
© 2009 The Authors
pairsTable 2 Continued
Journal compilation © 2009 Blackwell Publishing Ltd
© 2009 The Authors
Data (marker, no. of Population
Study system Divergent forms loci) Study design Main result — outliers trees differ? LD? Reference
10. Phytomyza Ilex glabra vs. I. coriacea 45 AFLP loci Compare divergence 18% of loci outliers, N/A; but N/A Scheffer &
glabricola (holly holly host forms between two 11–16% of loci mtDNA Hawthorne
leafminer) population pairs on outliers in a between- groups by 2007
different hosts and host pair with 9% of geography
between two pairs loci outliers in both whereas
on the same host between-host pairs AFLPs group
by host (i.e.
ecology)
11. Diabrotica virgifera Crop rotation resistant 253 AFLP loci Compare divergence % overall outliers not N/A N/A Miller et al.
(western corn vs. wild type strains for nine between- reported, < 0.5% (one 2007
rootworm) strain population locus) an outlier in
pairs and between between-strain
six pairs of the same comparisons only
strain
12. Zostera marina Tidal creek vs. tidal flat 25 EST-derived and Compare divergence 12% of loci outliers, N/A N/A Oetjen &
(marine flowering anonymous between with these exhibiting Reusch 2007
plant) microsatellite populations in replicated divergence
markers different habitats for for population pairs
three independent in different habitats,
S E L E C T I O N A N D G E N O M I C D I V E R G E N C E 11
population pairs but not being outliers
in same-habitat
population pairs
Other types of studies
13. Quercus robur High nutrient soil vs. 389 markers Compare divergence 12% of loci outliers N/A Low, outlier loci Scotti-
L. and Q. petraea drier habitat species (isozymes, AFLPs, between species distributed among Saintagne et al.
(oaks) SCARs, using 7–10 many different 2004
microsatellites, and population pairs, linkage groups
SNPs depending on the
marker
14. Picea abies (spruce) N/A 125 AFLPs, 25 SSRs Compare divergence 6% of loci outliers, N/A Low, outlier loci Acheré et al.
and 2 EST mapped for three pairs of but not replicated distributed among 2005
markers populations across population many different
pairs linkage groups
15. Anopheles gambiae M vs. S form Hybridized DNA of Compare divergence 1.2% of the genome, N/A N/A Turner et al.
(African malaria single mosquitoes between forms using from only three 2005; Turner &
mosquito) from samples of M seven M samples genomic regions, Hahn 2007
and S forms to and seven S samples highly differentiated
microarray chips between forms
(1577 probes)12 P. N O S I L , D . J . F U N K a n d D . O RT I Z - B A R R I E N T O S
Table 2 Continued
Data (marker, no. of Population
Study system Divergent forms loci) Study design Main result — outliers trees differ? LD? Reference
16. Mus musculus Mus musculus musculus > 10 000 SNP Compare divergence 7.5% of the N/A N/A Harr 2006
(house mouse) vs. M. m. domesticus markers between subspecies autosomal genome
using 22 wild- highly differentiated,
derived inbred comprising eight
strains genomic regions
17. Crassostrea N/A 215 AFLP loci Compare divergence 1.4% of loci outliers N/A Low Murray &
virginica (oyster) between a Hare 2006
population pair
18. Fagus sylvatica Temperature gradient 254 AFLP loci Compare divergence < 0.5% of loci (one N/A N/A Jump et al.
(beech tree) between five locus) outliers, 2006
population pairs associated with
differing in divergence in
temperature temperature
19. Howea forsteriana Divergent flowering 274 AFLP loci Compare divergence 1% of loci outliers N/A N/A Savolainen
and H. belmoreana times and soil between two species et al. 2006
Journal compilation © 2009 Blackwell Publishing Ltd
(oceanic palms) preferences
20. Peromyscus spp. N/A 10–37 protein– Compare divergence 10.5% outliers N/A N/A Storz &
(mice) coding genes, among populations (percent outliers Nachman 2003
depending on mouse within six different within data sets
species species ranged from 0-30),
parallel divergence
for some loci
© 2009 The AuthorsS E L E C T I O N A N D G E N O M I C D I V E R G E N C E 13
Table 3 Summary of studies providing information on isolation by adaptation (IBA), where IBA refers to a positive association between
the degree of adaptive phenotypic (or ecological) divergence between populations and the level of genetic differentiation at putatively
neutral markers. All findings of IBA provided here control for geographic distance. Detection of isolation by distance (IBD) is also noted.
Three main types of studies are reported: (i) population genetic studies explicitly examining IBA, generally using distance matrices of
adaptive and neutral genetic divergence, (ii) population genetic studies employing an amova framework, and (iii) one illustrative example
of IBA in a mosaic hybrid zone and in a phylogeographic study. For a more complete version of this table, including study design, molecular
markers, and much more detailed results, see the Supporting Information
Organism IBA? IBD? Reference
Population genetic studies generally using distance matrices
1. Isoodon obesulus (brown bandicoot) Yes No Cooper 2000
2. Anolis roquet (anole lizard) Yes No Ogden & Thorpe 2002
3. Poecilia reticulata (guppies) No Yes Crispo et al. 2006
4. Canis lupus (European grey wolf) Yes Yes Pilot et al. 2006
5. Coregonus clupeaformis (whitefish) Yes N/A Lu & Bernatchez 1999
6. Timema cristinae Yes for some AFLP loci Yes (but weak) Nosil et al. 2008
(herbivorous stick-insect) and for mtDNA
7. Dubautia arborea and D. ciliolate Yes No Friar et al. 2007
(silversword plant)
8. Littorina saxatilis (intertidal snail) Yes No Grahame et al. 2006
9. Geum urbanum (forest herb) No No Vandepitte et al. 2007
10. Canis lupus (North American grey wolf) Yes Yes Musiani et al. 2007
11. Hordeum spontaneum (wild barley) Yes Yes Owuor et al. 1999
12. Canis lupus (North American grey wolf) Yes (for some variables) No (but not Carmichael et al. 2007
directly tested)
13. Alopex lagopus (arctic fox) No No Carmichael et al. 2007
14. Zostera marina (marine flowering plant) No Yes Oetjen & Reusch 2007
15. Biscutella laevigata (flowering plant) Yes Yes Parisod & Christin 2008
16. Neochlamisus bebbinae (leaf beetle) Yes for AFLPs, No No for AFLPs, D.J. Funk, S.P. Egan,
for mtDNA Yes for mtDNA P. Nosil, Vanderbilt
University, Nashville,
TN, in preparation
Studies employing primarily an amova
(or similar) framework
17. Parus major (great tit) No N/A Blank et al. 2007
18. Parus caeruleus (blue tit) No N/A Blank et al. 2007
19. Osmerus mordax (rainbow smelt) No N/A Curry et al. 2004
20. Loxia curvirostra complex (red crossbills) Yes No Parchman et al. 2006
21. Hesperotettix viridis (grasshopper) Yes No (but not directly tested) Sword et al. 2005
22. Salamandra salamandra (fire salamander) Yes No Steinfartz et al. 2007
Phylogeographic and hybrid zone studies
23. Halichoeres spp. (tropical reef fish, wrasses) Yes No Rocha et al. 2005
24. Bombina spp. (toads) Yes N/A MacCullum et al. 1998;
see also Vines et al. 2003
Supporting information for details). Nonetheless, the results Machado et al. 2002; Broughton & Harrison 2003; Hoekstra
imply that approximately 5–10% of the genome is strongly et al. 2004; Payseur et al. 2004; Llopart et al. 2005; Basset
affected by divergent selection. More standardization in et al. 2006; Geraldes et al. 2006; Zayed & Whitfield 2008).
the reporting of future results should help to refine the
estimates reported here. What this survey most clearly Genomic distribution of outliers To what extent are outlier
demonstrates is that nontrivial proportions of the genomes loci clustered within the genome, as predicted by some
of disparate taxa show evidence of divergent selection. theory (Gavrilets 2004, chapter 6; Kirkpatrick & Barton
These findings are highly consistent with studies examining 2006)? The data in Table 2 suggest a range of answers, with
a few loci or particular parts of the genome (e.g. sex genomic clustering of outliers ranging from low to reasonably
chromosomes), and those comparing divergence at coding high. Three studies located outliers on a linkage map. Two
vs. noncoding regions, which also regularly report of these mapped them to many different linkage groups
heterogeneous genomic divergence (Wang et al. 1997; (13, 14 in Table 2), while the third observed a clustering of
© 2009 The Authors
Journal compilation © 2009 Blackwell Publishing Ltd14 P. N O S I L , D . J . F U N K a n d D . O RT I Z - B A R R I E N T O S
loci associated with between-race divergence in particular pairs represents a powerful application of the genome-scan
regions on just a few of more than 20 chromosomes approach. This is because replicated divergence across
examined (6 in Table 2). Two other studies also identified multiple population pairs of a given type is unlikely to
the specific location of genomic differentiation. Turner et al. arise via nonselective factors such as type I error, genetic
(2005) found that differentiation between forms of drift, or mutation rate variation (Luikart et al. 2003;
Anopheles gambiae mosquitoes involved 1.2% of the genome Campbell & Bernatchez 2004; Bonin et al. 2006, 2007). Such
and was clustered into three genomic regions comprising studies might further allow the specific ecological causes of
less than 2 Mb. Clustering was somewhat weaker between outlier behaviour to be identified, for example, by contrasting
house mouse (Mus musculus) subspecies, where differentiated genetic differentiation for population pairs that are
regions (7.5% of the autosomal genome) were distributed ecologically similar vs. those that are ecologically (and
among eight genomic regions from the 14–16 chromosomes presumably adaptively) divergent in a specific ecological
examined (Harr 2006). variable (Schluter & Nagel 1995; Funk 1998; Funk et al. 2002;
Four additional studies indirectly examined outlier Nosil 2007). The few studies making explicit comparisons
distribution by quantifying within-population linkage between population pairs with different vs. similar ecologies
disequilibrium (LD) among loci (1, 8, 9, 17 in Table 2). If (studies 6–12 in Table 2) suggest that a relatively large
outlier loci are physically linked, their LD should be elevated proportion (25–100%) of outliers are associated with
relative to neutral loci (Kim & Nielsen 2004), assuming the divergence in a specific ecological variable. A related
latter are widely distributed throughout the genome. approach examines correlations between outliers and
Importantly, physical linkage of outliers is expected to be environmental factors (e.g. studies 5 and 18 in Table 2).
associated with similar levels of LD within allopatric and Consider the specific example of adaptation to different
parapatric populations (Arnold 1992). In contrast, if LD plant species by herbivorous insect populations. Recent
forms between physically unlinked loci, due to migration studies have identified loci that are outliers in comparisons
between differentiated populations (Nei & Li 1973; of multiple ‘different-host’ population pairs, but that are
Kirkpatrick et al. 2002), then LD will be greater where never outliers in comparisons of different populations that
migration is higher, such as within parapatric populations use the same host plant (Egan et al. 2008; Nosil et al. 2008).
(Nosil et al. 2006) or at the centre of a cline (Grahame et al. Such patterns suggest that these loci have likely evolved
2006). For all four relevant studies, levels of LD for outlier under the influence of host-plant-related sources of selec-
loci were very low and, except for one study, similar to tion. By contrast, loci that are outliers only in ‘same-host’
those of nonoutlier (neutral) loci. One study did find population pairs are best interpreted as being affected by
slightly elevated LD for outlier loci relative to nonoutliers host-independent sources of selection (e.g. climate). For
(Nosil et al. 2008). Because levels of within-population example, in a study of nine different-host and six same-
LD among outliers were independent from levels of host population comparisons, Egan et al. (2008) identified
between-population gene flow (migration), this study 23 outlier loci (representing 5% of all loci examined)
provides indirect evidence for weak physical linkage associated exclusively with different-host population pairs
among outlier loci. of Neochlamisus bebbianae leaf beetles, and only five outliers
In summary, the reviewed studies provided evidence for associated exclusively with same-host population pairs.
both genomic dispersion and genomic clustering of outliers. From this, they concluded that host-related selection plays
The former observation suggests that islands of genomic a major role in the adaptive genomic differentiation of
divergence may be greater in number, and perhaps smaller these populations. This same study identified three loci
in size, than currently thought (see also Nakazato et al. that were especially highly differentiated outliers in all
2007; Mäkinen et al. 2008b; Turner et al. 2008; Wood et al. nine different-host population comparisons and none of
2008) and is contrary to both the theoretical predictions the same-host comparisons, thus illustrating how compar-
outlined above and some empirical observations, such as ative genome scans can identify robust candidate loci
quantitative genetic evidence on the tendency of genes (genomic regions) for further molecular characterization
involved in host adaptation to be sex-linked in herbivorous and evolutionary study (e.g. Wood et al. 2008).
insects (Prowell 1998). More studies are required before
explanations for these variable empirical outcomes can be Replicated divergence: adaptation via the same or different
evaluated, although the extent of genomic coverage (e.g. mutations? A major question in evolutionary genetics is
marker density) in a genome scan could contribute to this the extent to which divergent adaptation in different
variability. We suggest that future studies report patterns of geographic localities or taxa involves the same vs. different
LD across different classes of loci and geographic contexts. genes, alleles, and substitutions (Orr 2005). The frequency
with which outliers are replicated across different population
Comparative insights: ‘ecological’ genome scans The evaluation pairs in a given study provides some insight into this
of replicated comparisons of particular types of population question. In the relevant studies, a large proportion of outlier
© 2009 The Authors
Journal compilation © 2009 Blackwell Publishing LtdS E L E C T I O N A N D G E N O M I C D I V E R G E N C E 15
loci (approximately 50%) were replicated in this fashion, populations in a manner more consistent with geography
exhibiting outlier status across multiple population pairs (see also Via & West 2008). The extent to which outlier loci
(Table 2). This tendency implies that divergent adaptation group popu-lations according to ecology should increase as
may often proceed in two ways. First, it may occur by the the frequency of outlier loci and population pairs exhibiting
repeated and parallel fixation of the same allele in different replicated divergence increases, and these studies are
populations (Table 2; see also Storz & Nachman 2003; consistent with this prediction. Another factor is how tightly
Panova et al. 2006; Turner et al. 2008). Second, an adaptive linked the outliers are to the actual targets of selection.
allele may arise and be locally fixed only once, followed by
the subsequent spread of the ecological type carrying the Genome scans incorporating QTL We conclude this section
new allele to multiple geographic localities. by considering studies that complement genome scans
Replicated outlier behaviour is of particular interest with QTL approaches. A major goal of such studies is to
when divergent adaptation in different localities can be determine the phenotypic traits and associated genomic
demonstrated to have evolved independently (e.g. multi- regions that contribute to adaptive population divergence.
ple origins of ecological types), thus providing evidence for This can be achieved by determining which (if any) QTL
truly ‘parallel’ divergence (e.g. as in Coregonus whitefish, from mapping experiments are also outlier loci in genome
Campbell & Bernatchez 2004, and Timema walking-sticks, scans. Such work is relevant to heterogeneous genomic
Nosil et al. 2002, 2008; Table 2). A definitive example of this divergence because it compares levels of genetic divergence
process comes from threespine sticklebacks (Gasterosteus between QTL and other markers. Finding QTL that are also
aculeatus), in which independent instances of adaptation to outlier loci puts the study of heterogeneous genomic
freshwater environments have repeatedly involved the divergence on steadier ‘ecological footing’, as it allows
loss of lateral plates (an antipredator trait) via the fixation stronger inferences about underlying ecological traits and
of the same allele at the ectodysplasin gene (Colosimo et al. associated divergent selection than genome scans of
2005). Alternatively, divergent adaptation may proceed via anonymous markers alone (Stinchcombe & Hoekstra
different mutations/loci in different localities such that 2008). For treatment of allele frequency expectations at
particular outliers are not highly consistently observed neutral loci vs. QTL, we refer readers to past reviews (Latta
across population comparisons (e.g. Acheré et al. 2005; 1998, 2003; Le Corre & Kremer 2003).
Panova et al. 2006). These different mutations could either To date, few studies have combined QTL and genome
be recently derived or reflect the differential sorting of scan approaches. Thus, we focus on a few key examples.
standing genetic variation (Barrett & Schluter 2008). The first involves whitefish (Coregonus clupeaformis)
ecotypes studied by Rogers & Bernatchez (2005, 2007).
Genealogical discordance: population trees from neutral vs. Genetic mapping identified nine QTL for phenotypic traits
selected loci When genetic exchange between populations related to adaptation of the two ecotypes to different lake
varies among loci, different loci can yield different gene environments, while a genome scan of four sympatric pairs
trees (i.e. genealogical discordance) (Maddison 1997; Via 2001; of ecotypes identified 24 outlier loci (among 440 loci exam-
Shaw 2002; Funk & Omland 2003; Hey 2006). Loci involved ined). These outliers were associated with QTL, as opposed
in divergent adaptation and reproductive isolation are to other genomic regions, more often than expected by
expected to reflect boundaries between biological species chance. These findings increased confidence that regions
or ecotypes more strongly than neutral loci, because the under selection had indeed been identified, and that outlier
former flow less readily between populations (Wu 2001; differentiation reflected divergent adaptation to lake envi-
Dopman et al. 2005; Hey 2006; Xie et al. 2007). This process ronments (see also Ólafsdóttir et al. 2006). Although the authors
generates the prediction that selected loci are likely to point out that demographic, spatial, and local selective
group populations by adaptively relevant ecological effects can influence QTL–outlier correlations (Beaumont
variables, whereas neutral loci are likely to phylogenetically & Balding 2004; Hahn 2006), this work clearly illustrates
group populations by geographic proximity (reflecting spatial the inferential advantages of a more integrated approach.
patterns of gene flow). A number of studies that have The second example treats Helianthus annuus and
evaluated genetic structure at each of a few loci report such H. petiolaris sunflowers (Yatabe et al. 2007). These species
patterns (Beltrán et al. 2002; Hoekstra et al. 2004; Dopman hybridize extensively, F1 hybrids exhibit extremely low
et al. 2005; Llopart et al. 2005; Bull et al. 2006; Cano et al. 2006; pollen fertility, and these fertility barriers map to chromo-
Geraldes et al. 2006; Putnam et al. 2007; Roe & Sperling somal rearrangements (Rieseberg et al. 1999). This study,
2007). Five genome scan studies (1, 2, 4, 8, 9 in Table 2) have however, detected no association of outliers with QTL for
analogously compared population trees for data sets that morphological differences or hybrid sterility, and only
either include or exclude outliers. All these studies observed weak associations of outliers with chromosomal inversions.
that outlier loci group populations more as a function of The authors conclude that regions of differentiation between
ecology, whereas putatively neutral (nonoutlier) loci group these species are very small.
© 2009 The Authors
Journal compilation © 2009 Blackwell Publishing LtdYou can also read


