Evaluation of genetic diversity and management of disease in Border Collie dogs - Nature
←
→
Page content transcription
If your browser does not render page correctly, please read the page content below
www.nature.com/scientificreports
OPEN Evaluation of genetic diversity
and management of disease
in Border Collie dogs
Pamela Xing Yi Soh1, Wei Tse Hsu1, Mehar Singh Khatkar2 & Peter Williamson1*
Maintaining genetic diversity in dog breeds is an important consideration for the management of
inherited diseases. We evaluated genetic diversity in Border Collies using molecular and genealogical
methods, and examined changes to genetic diversity when carriers for Trapped Neutrophil Syndrome
(TNS) and Neuronal Ceroid Lipofuscinosis (NCL) are removed from the genotyped population.
Genotype data for 255 Border Collies and a pedigree database of 83,996 Border Collies were used
for analysis. Molecular estimates revealed a mean multi-locus heterozygosity (MLH) of 0.311 (SD
0.027), 20.79% of the genome consisted of runs of homozygosity (ROH ) > 1 Mb, effective population
size (Ne) was 84.7, and mean inbreeding (F) was 0.052 (SD 0.083). For 227 genotyped Border Collies
that had available pedigree information (GenoPed), molecular and pedigree estimates of diversity
were compared. A reference population (dogs born between 2005 and 2015, inclusive; N = 13,523;
RefPop) and their ancestors (N = 12,478) were used to evaluate the diversity of the population that
are contributing to the current generation. The reference population had a Ne of 123.5, a mean F of
0.095 (SD 0.082), 2276 founders (f), 205.5 effective founders (fe), 28 effective ancestors (fa) and 10.65
(SD 2.82) founder genomes (Ng). Removing TNS and NCL carriers from the genotyped population
had a small impact on diversity measures (ROH > 1 Mb, MLH, heterozygosity), however, there was a
loss of > 10% minor allele frequency for 89 SNPs around the TNS mutation (maximum loss of 12.7%),
and a loss of > 5% for 5 SNPs around the NCL mutation (maximum 5.18%). A common ancestor
was identified for 38 TNS-affected dogs and 64 TNS carriers, and a different common ancestor was
identified for 33 NCL-affected dogs and 28 carriers, with some overlap of prominent individuals
between both pedigrees. Overall, Border Collies have a high level of genetic diversity compared to
other breeds.
Border Collies are one of the most popular breeds in the world with at least 25 known inherited disorders1. As
more inherited disorders and causative mutations are identified, a major concern is the level of genetic diversity
available in the population and the impact of removing carriers from the population through breeding manage-
ment. One common example of an inherited disorder in the breed is the autosomal recessive Trapped Neutrophil
Syndrome (TNS) (https://omia.org/OMIA001428/9615/), characterised by static neutropenia and hyperplasia
of myeloid cells in the bone marrow. Affected dogs present with abnormal craniofacial development, are usually
smaller than their littermates, and fail to thrive at a young a ge2,3. The cause of the disease is a 4-bp deletion in
exon 19 of VPS13B on chromosome 13 (bases 1,412,660–1,412,664, CanFam 3.1)3. The mutation was found to
be widespread in the working and show dog groups in several countries around the world, occurring at an allele
frequency of around 5.9–8%3,4. Another example is the autosomal recessive Neuronal Ceroid Lipofuscinosis
(NCL) (https://omia.org/OMIA001482/9615/), a neurodegenerative lysosomal storage disease characterised by
an accumulation of intracellular lipopigments in neurons and other cells, which causes progressive neurological
symptoms such as loss of vision, behavioural changes, and motor disturbances and ultimately leads to premature
death5–8. The disease can arise through several genetic mechanisms, and so far 13 mutations across eight genes
have been characterised in a variety of dog breeds9,10. The causative mutation for NCL in Border Collies is a
nonsense mutation (Q206X) in exon 4 of CLN5 on chromosome 22 (C > T at 30,574,637, CanFam 3.1)11 and
the same mutation has also been found in Australian Cattle Dogs, in a mixed breed dog with German Shepherd
Dog and Australian Cattle Dog ancestry, and a mixed breed dog with uncertain breed background9,12,13. The
frequency of the mutant allele in Border Collies is around 3.5%4,11. A study of NCL carriers and affected Border
1
School of Life and Environmental Sciences, Faculty of Science, The University of Sydney, Sydney, NSW 2006,
Australia. 2Sydney School of Veterinary Science, Faculty of Science, The University of Sydney, Sydney, NSW 2006,
Australia. *email: p.williamson@sydney.edu.au
Scientific Reports | (2021) 11:6243 | https://doi.org/10.1038/s41598-021-85262-x 1
Vol.:(0123456789)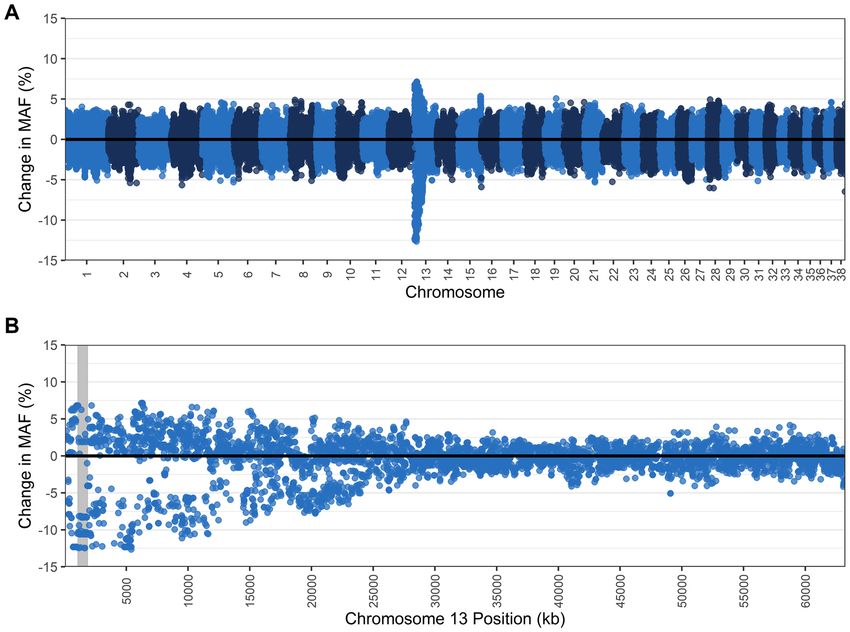
www.nature.com/scientificreports/
Study Wijnrocx et al.23 Leroy et al.18 Shariflou et al.24 Ács et al.25 Current study RefPop
Location Belgium France Australia Hungary Various
Number of Border Collies in pedigree 13,142 18,995 68,535 13,339 26,001
Reference Population 12,250* 6,415 20,173 1,566 13,523
Ref. period 2000–2013 2001–2005 2000–2009 2010–2016 2005–2015
Equivalent generations (EqG) 4.7 2.9 7.6 – 10.38
Mean inbreeding coefficient (F) 0.019 0.008 0.041 0.099 0.095
Rate of inbreeding (ΔF) – – 0.004 – 0.004
Mean kinship coefficient (Φ) 0.008 0.007 – – 0.052
Generation Interval (I) – 4.6 4.4 4.09–4.43 4.41
Effective population size (Ne) 99.1 – 129 – 123.5
Observed founders (f) 1024 – 511 894 2276
Effective founders (fe) 248 95 87 117 205.5
Effective ancestors (fa) 115 90 52 20 28
Effective founder genomes (Ng) 55.5 – 25.2 – 10.65 (SD 2.82)
fe/f 0.24 – 0.17 0.13 0.09
fa/fe 0.47 0.95 0.6 0.17 0.14
Ng/fe 0.22 – 0.29 – 0.05
Table 1. Summary of genealogical estimates of diversity in Border Collies from previous studies and a
comparison to the present study. *Authors reported mean number of pups per year for 2003 to 2012. This value
was multiplied for the length of the reference period.
Wijnrocx et al.23 Leroy et al.18 Mellanby et al.15 Irion et al.26 Lee et al.21 Mastrangelo et al.32 Current study
Location Belgium France UK USA Korea Various Various
Number of Border Collies 1166 20 20 44 18 16 255
170 k and 220 k SNP
Data type 19 MSTs 21 MSTs 15 MSTs 100 MSTs 10 MSTs 170 k SNP chip
chips
N (total number of alleles over all loci) 132 – – – 76 132,281 SNPs 158,122 SNPs
Expected heterozygosity (He)(± SD) 0.665 0.66 0.66 – 0.633 (0.025) – 0.328 (0.146)
Observed heterozygosity (Ho)(± SD) 0.644 0.6 0.65 0.669 (0.018) 0.65 (0.036) – 0.309 (0.147)
Fixation index (FIS) 0.031 0.082 0.028 – – – –
Allelic richness (Ar) 3.84 5.2 – – – – –
F(ST) (mean pairwise genetic differentia-
– – 0.16 – – – –
tion)
FROH – – – – – 0.15 0.037 (> 1 Mb)
Ne13 (effective population size 13 gens ago) – – – – – 50 –
Table 2. Summary of genetic estimates of diversity in Border Collies from previous studies and a comparison
to the current study. MST microsatellite.
Collies in Japan revealed a common ancestor originating from Australia in 19445. Since the discovery of the
causative mutations and the development of polymerase chain reaction (PCR) tests for these diseases, registered
Border Collie breeders have avoided breeding of carriers in an attempt to reduce the incidence of these diseases.
Many studies have primarily examined within-breed or between-breed genetic diversity of popular dog
breeds14–18, which have not been able to utilise comprehensive genetic data across a large sample size for a single
breed. Other studies have also examined genetic diversity of traditional dog breeds in a conservation c ontext19–21.
For example, the Sapsaree is a native Korean dog breed with around 4000 individuals which are protected by the
Korean government and bred with strict regulations, as it was close to extinction during Japanese colonisation
(1910–1945) and the Korean War (1950–1953)20. Genetic diversity in a breed can be estimated through genea-
logical data, or more accurately through DNA markers. Few studies have conducted in-depth analyses of a single
dog breed using both pedigree and molecular data22,23. Genealogical data have previously been used to estimate
genetic diversity in Border Collies in France18, Australia24, Belgium23, and Hungary25 and are summarised in
Table 1. Pedigree data is useful for calculating probabilities of gene origin (genetic contributions of ancestors
and founders), effective population size, inbreeding (mating of related individuals) and can detect historical
genetic bottlenecks16. However, pedigree estimates of inbreeding may not reflect true values due to incomplete
or inaccurate pedigree information. All published molecular estimates of genetic diversity in Border Collies have
been based on small panels of microsatellite m arkers15,18,23,26. The results from these studies are summarised in
Table 2. Although microsatellites are useful for paternity testing and identifying population structure, they often
Scientific Reports | (2021) 11:6243 | https://doi.org/10.1038/s41598-021-85262-x 2
Vol:.(1234567890)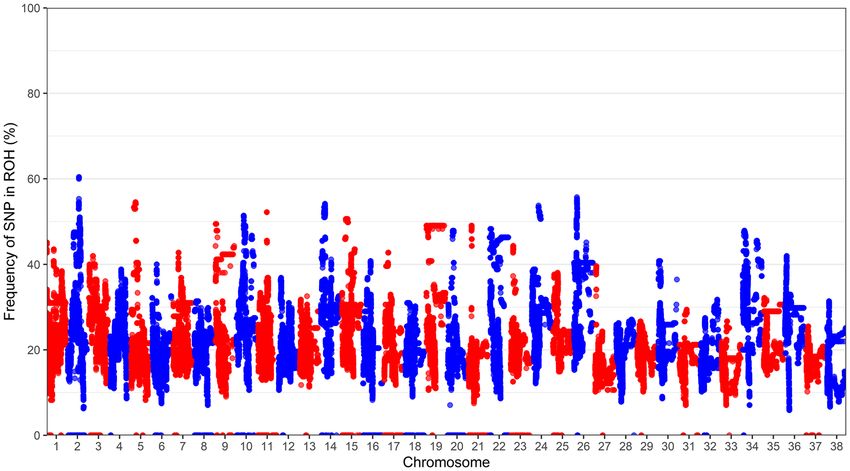
www.nature.com/scientificreports/
have high mutation rates and may not reflect true levels of diversity in a single b reed27–30. However, only a few
studies have used high-density SNP arrays to evaluate genetic diversity in dog b reeds22,31,32.
The aims of this study were to assess genetic diversity in the Border Collie breed using SNP markers and
compare these values to genealogical estimates of diversity, and to examine the impact of removing TNS- and
NCL-affected and carriers dogs on genetic diversity.
Materials and methods
Unless otherwise stated, R version3.6.133 was used for analysis and visualisation.
Study animals. This study was conducted in accordance with guidelines from the Animal Research Act,
NSW, Australia, approved under the Animal Ethics Committee of the University of Sydney under ethics numbers
37/634/6013. Blood from 286 Border Collies (130 males, 149 females, and seven unknown sex; born between
1989 and 2017) was collected in EDTA coated vacutainers by licensed veterinarians from private practices and
were voluntarily submitted from owners with written informed consent. Dogs were considered Border Collies if
the dog was registered with the Australian National Kennel Club (ANKC) or based on owner identification and
confirmation by visual inspection by veterinarians. Genomic DNA was isolated using the DNeasy Blood and
Tissue Kit (Qiagen, Melbourne, Vic) following the manufacturer’s protocol. Genotyping of the DNA samples
were performed by Geneseek, Lincoln, NE, USA using the CanineHD BeadChip (Illumina, San Diego, CA,
USA). A total of 61 samples were genotyped on an array covering over 170,000 evenly spaced, genome-wide
SNPs (170 k array)34. Due to an update in the bead chip, an additional 225 samples were genotyped on a more
comprehensive array covering over 220,000 SNPs (220 k array).
Genealogical analysis. An extensive database providing pedigrees of 83,996 Border Collies, collated from
public data and our laboratory records, was available for analyses. A reference population is broadly defined as
a population of animals representing the breeding population contributing to the next generation. In this study,
a reference population was defined as a population of 13,523 pedigree dogs born between 2005 and 2015 inclu-
sive (RefPop). A total of 12,478 ancestors were available for these dogs. Genealogical analyses of diversity for
227 of the genotyped dogs that passed genotype quality control and had pedigree information (known parents)
was conducted separately (henceforth known as the GenoPed population), as the population included 68 dogs
born outside of 2005 to 2015 and 5 with unknown year of birth. A total of 5470 ancestors of these 227 dogs were
available. The GenoPed population would allow a direct comparison of genetic estimates of diversity to genea-
logical estimates for the same 227 dogs, while RefPop provided a wider range of animals that could be separately
assessed for genetic diversity and would allow a more accurate estimate of diversity in the dogs contributing
to the present generation of Border Collies. The R package ‘optiSel’ was used to calculate equivalent complete
generations (EqG, sum of proportions of known ancestors over all generations traced), index of pedigree com-
pleteness (PCI, mean of the parents’ pedigree completeness, which is the proportion of ancestors known in
each asecending generation), effective population size (Ne, predicted number of animals equally contributing
to breeding, see 35 for formula), generation interval (I, average age of parents when offspring are born), kinship
coefficients (Φ, probability that two randomly selected alleles from two individuals are identical by descent) and
inbreeding coefficients (F, kinship of an individual’s parents)36–38. The overall rate of inbreeding (ΔF) was calcu-
lated according to the formula F = 2N1 e 39. Individual increases in inbreeding (ΔFi) was calculated using√the for-
mula originally from Falconer and Mackay39 and 40
1 modified by González-Recio et al. , Fi = 1 −
EqGi −1
1 − Fi ,
which was rearranged to �Fi = 1 − (1 − Fi ) EqGi −1 , where F and EqG are the inbreeding coefficient and equiva-
lent generations respectively for individual i. Inbreeding for each individual adjusted for pedigree depth ( FEqG),
was also calculated using the mean EqG ( EqG ) for the formula originally from Falconer and M ackay39 and
41
modified by Gutiérrez et al. , FEqG = 1 − (1 − �Fi ) EqG−1
.
The software PEDIG was used to calculate number of founders (f), effective number of founders (fe), effective
number of ancestors (fa), and effective number of founder genomes (Ng) (after 500 iterations)42. For the calcu-
lation of fe, 20 generations were traced (ped_util program) and used to calculate fe (prob_origin program) for
RefPop. The prob_origin program was also used to identify the marginal contributions of each ancestors, which
is the genetic contribution that has not yet been accounted for by other a ncestors43. A placeholder year of birth
of 1950 was used for 6270 RefPop ancestors that had missing year of births.
EqG and PCI are indicators of pedigree depth and completeness, respectively. Effective population size refers
to the number of effective breeders and explains the level of genetic variance in a population and the rate of
inbreeding. Founders refer to animals with no known parents, while ancestors (which may also be founders),
refer to the animals that have the greatest expected genetic contribution to the reference population. The effective
number of founders is the number of equally contributing founders that would give the same genetic diversity
as the studied population, and accounts for selection rate (probability of being a parent) and variation in family
size, while the effective number of ancestors is the minimum number of ancestors (which may also be founders)
that explains the same genetic diversity as the studied population and accounts for bottlenecks in the p edigree43.
The effective number of founder genomes measures the number of founder genes that have been maintained
in the population, and accounts for gene loss and genetic d rift43. The values for fe/f, which indicates if there has
been uneven founder contribution, fa/fe, which indicates genetic bottle necks in the population, and Ng/fe,which
indicates genetic drift, were computed manually.
Molecular analysis. As there were differences in the number of SNPs in the two SNP arrays used, BEAGLE
v5.144 was used to impute SNP genotypes of the 170 k panel up to the higher density 220 k SNP array. First,
both the 170 k dataset and the 220 k dataset were filtered separately using PLINK v1.945 to keep individuals
Scientific Reports | (2021) 11:6243 | https://doi.org/10.1038/s41598-021-85262-x 3
Vol.:(0123456789)www.nature.com/scientificreports/
with no more than 20% missing genotype calls (–mind 0.2), and additionally the 220 k dataset was filtered for a
minor allele frequency (MAF) of 0.02 (–maf 0.02). The datasets were then merged and converted into vcf files,
filtered to remove SNPs with a genotype call rate of < 25% (–geno 0.25), then imputed on BEAGLE v5.144 using
default parameters for model states (imp-states = 1600) and minimum cM length of haplotype segments (imp-
segment = 6.0), while ‘cluster’ was set to 0.05 and effective population (Ne) was set to 100. A Ne value of 100 was
selected since previous studies estimate Ne in Border Collies to be 99 to 1 2923,24, and the default value of 1,000,000
is for large outbred populations, whereas purebred dogs are small inbred populations. After imputation, the
merged dataset was further filtered in PLINK v1.945 for a minor allele frequency of 0.02. Runs of homozygosity
(ROH) for lengths of > 1 Mb, > 2 Mb, > 4 Mb, and > 8 Mb were calculated for autosomes using PLINK v1.945 as
previously described22; in particular, the parameters used for computing ROH were: –dog –allow-no-sex –chr
1–38 –homozyg –homozyg-density 50 (ROH has at least one SNP per 50 kb) –homozyg-gap 100 (two SNPs
in ROH no more than 100 kb apart) –homozyg-kb 1000/2000/4000/8000 (minimum length in kb for defining
ROH) –homozyg-snp 50 (ROH has at least 50 SNPs) –homozyg-window-het 1 (scanning window allows for 1
heterozygous call) –homozyg-window-missing 5 (scanning window allows for up to 5 missing calls) –homozyg-
window-snp 50 (scanning window of 50 SNPs) –homozyg-window-threshold 0.05 (SNP will be considered in
an ROH if the hit rate of all scanning windows is 0.05). Additionally, relationship cutoffs (–rel-cutoff) of 0.3 or
0.45 were also used to define subsets of more distantly related dogs for ROH analyses. The R package ‘ggplot2’
was used to plot the frequency in which each SNP was in a ROH > 1 Mb across all genotyped dogs46. Inbreeding
coefficients were calculated as a frequency of ROH (FROH) by summing the ROH across all individuals and divid-
ing by the autosomal genome length covered by the SNPs (difference in base pairs (bp) between the first and last
SNP for each chromosome, summed across all chromosomes). Inbreeding was also additionally calculated with
the –het flag in PLINK v1.945 (Fgeno), which was also used to calculate multi-locus heterozygosity (MLH) using
the formula MLH = N−O N , where N is the number of non-missing genotypes and O is the number of observed
homozygous genotypes. Observed and expected heterozygosity was calculated using the–hardy flag in PLINK
v1.945. Pearson’s correlation was used to compare FROH with Fped and Fgeno. To calculate effective population size,
a subset of 10,000 SNPs were selected as previously d escribed22. Briefly, the filtered SNP data was cut into 12,001
segments and 10,000 segments were randomly sampled, then one SNP was selected at random in each segment.
Effective population size (Ne) was then calculated using NeEstimator v2.147 based on the subset of SNPs.
CNV analysis. The copy number variation (CNV) analysis was detected using the algorithm implemented
by PennCNV using the 225 dogs genotyped on the 220 k SNP array. The algorithm for CNV analysis from SNP
array data was developed and described previously48.
The script of PennCNV “detect_cnv.pl” was used with the Hidden Markov Model parameter file and the GC
Model to reduce waviness. The quality of the final dataset was assessed with the following thresholds: a logR
ratio standard deviation (LRR_SD) > 0.20, BAF drift > 0.002, and waviness factor (WF value) > 0.04 orwww.nature.com/scientificreports/
Genealogical estimate Genetic estimate
Genotyped dogs with Genotyped dogs with
All pedigree data RefPop + ancestors RefPop pedigrees (GenoPed) pedigrees (GenoPed) Genotype data
No. animals 83,996 26,001 13,523 227 227 255
Mean inbreeding coefficient
0.108 (0.077) 0.095 (0.082) 0.124 (0.073) 0.139 (0.063)a 0.042 (0.076)b 0.052 (0.083)b
(F)(± SD)
Effective population size (Ne)
– 123.5 – 65.4 78.1 (78.1 – 78.2)c 84.7 (84.6 – 84.8)b
(95% CI)
Rate of inbreeding (ΔF) – 0.004 – 0.008 0.006 0.006
Equivalent generations (EqG)
10.75 (4.09) 10.38 (5.58) 13.7 (3.31) 14.02 (3.09) – –
(± SD)
Pedigree Completeness Index
0.908 (0.256) 0.805 (0.346) 0.943 (0.17) 0.974 (0.117) – –
(PCI)(± SD)
d
Generation interval (I) 4.15 4.41 4.45 4.96 – –
Mean kinship coefficient (Φ) – 0.052 0.001 0.104 – –
Multi-locus heterozygosity
– – – – 0.311 (0.025) 0.311 (0.027)
(MLH)(± SD)
Table 3. Comparison of pedigree and genetic estimates of diversity. a Excludes 11 dogs where inbreeding could
not be calculated due to incomplete pedigree information. b Fgeno value. c Based on lowest allele frequency of
0.05, calculated using the same 10,000 random SNPs. d Calculated from 19,731 dogs with non-missing birth
years.
Results
Genealogical analysis. There were 28 dogs that passed genotype quality control and were included in
genetic analyses but were not included in GenoPed due to missing pedigree information. Of the GenoPed popu-
lation (227 dogs remaining that passed genotyped quality control and had pedigree information), 79.7% were
from Australia, 10.6% were of unknown origin, 2.6% were from UK, 2.2% were from Japan, 1.8% were from
USA, while the remaining 3.1% were from Belgium, Romania, New Zealand, Italy, Germany, and Finland. For
each dog used in this study, the details on sex, year of birth, country of origin, parentage, TNS status, NCL status,
and inclusion in RefPop (and ancestors) or GenoPed (and ancestors) are available in Supplementary Data S1.
A summary of average values for index of pedigree completeness, equivalent generations, inbreeding, genera-
tion interval, and kinship coefficient are in Table 3, with equivalent measures in previous studies also listed in
Table 1. Of the 13,523 dogs in RefPop and their ancestors (total = 26,001 dogs), 6,270 had missing birth years.
The PCI for GenoPed was 0.974, indicating very little missing pedigree information for this population. The Ne
estimate for GenoPed was 65.4. There were 11 dogs in GenoPed where inbreeding could not be calculated due
to incomplete pedigree information. Of these 11 dogs, eight dogs only had one fully traceable generation, while
the other three only had two to three fully traceable generations. Average inbreeding from pedigree estimates
(Fped), excluding these 11 dogs, was 0.139 (SD 0.063).
Distribution of inbreeding (Fped) for each group is available in supplementary data (Supplementary Figures S1
to S4). The values of F, ΔFi, FEqG and number of dogs in the entire database (N = 83,996) were plotted over time,
excluding dogs where inbreeding could not be calculated due to incomplete pedigree, dogs that had only one
complete generation, and years where only one dog was available (Fig. 1). FEqG for each individual was calculated
using EqG of 10.75. Across the entire database, inbreeding has had an overall increase since 1970s, although
the individual rate of inbreeding (ΔFi) has remained constant since 1980 at approximately 0.1, while adjusting
for pedigree depth (FEqG) showed inbreeding has declined between 1960 and 1985 and has not deviated much
beyond 1985 ( FEqG = 0.11 in 1985, and F EqG = 0.08 in 2015).
A comparison of diversity estimates from RefPop to previous studies is presented in Table 1. RefPop had a
greater depth of pedigree than previous studies with an EqG of 10.4 and a PCI value of 0.805. Inbreeding (Fped)
and mean kinship was higher than previous studies (F = 0.095, Φ = 0.052). Generation interval was similar at
I = 4.41. Ne was within range of previous studies at 123.5. Number of observed founders (f), effective founders (fe),
effective ancestors (fa),effective founder genomes (Ng), indications of uneven founder contribution (fe/f), indica-
tions of genetic bottle necks (fa/fe), and indications of genetic drift (Ng/fe) were as follows:f = 2276, fe = 205.5, fa = 28,
Ng = 10.65 (SD 2.82), fe/f = 0.09, fa/fe = 0.14, Ng/fe = 0.05. Although fa/fe value indicated a genetic bottleneck in the
population, we were unable to identify a year where there was a substantial drop in number of dogs born per
year (Supplementary Figure S5). A total of 13 ancestors accounted for 50.29% of the gene pool (Supplementary
Table S1). The ancestor with the greatest contribution was dog_621, which had a total contribution of 14.29%.
Genomic analysis. After imputation and filtering, 255 dogs and 158,122 SNPs were used for analysis. Aver-
age inbreeding from molecular estimates (Fgeno) was 0.052 (SD 0.083; Supplementary Figure S6), while average
MLH was 0.311 (SD 0.027) (Table 3). Ne based on a subset of 10,000 SNPs across the genome for allele frequency
of < 0.05 was 84.7 (95% CI 84.6 – 84.8), and for allele frequencies < 0.02 the estimated Ne was 86.0 (95% CI
86.0–86.1). Average observed heterozygosity across all dogs was 0.309 (SD 0.147), while average expected het-
erozygosity was 0.328 (SD 0.146) (Table 2). The frequency in which each SNP occurred in a ROH (> 1 Mb) across
the genotyped population is displayed in Fig. 2. Chromosomes 2 and 26 had the highest frequency of SNPs in a
Scientific Reports | (2021) 11:6243 | https://doi.org/10.1038/s41598-021-85262-x 5
Vol.:(0123456789)www.nature.com/scientificreports/
Figure 1. Inbreeding coefficient (F), individual change in inbreeding (ΔFi), inbreeding adjusted to mean EqG
(10.75) in the population (FEqG), and number of dogs over time. Dogs that had only one complete generation or
where inbreeding coefficients could not be calculated due to incomplete pedigree information were excluded, as
well as years that had only one dog available.
Figure 2. Frequency of each SNP occurring in a run of homozygosity (> 1 Mb) across the genotyped
population (N = 255) for each autosome.
ROH, while chromosomes 28, 29 and 37 had a low frequency of SNPs in a ROH. A summary of ROH for lengths
over 1, 2, 4, and 8 Mb are in Table 4. Almost a fifth of the autosomal genome (20.79%) were in runs of > 1 Mb in
length, while F ROH was 0.037. At a relationship cutoff of 0.45, which would remove all first-degree relatives, 211
dogs remained for analysis, while a more stringent relationship cutoff of 0.3 left 177 dogs for analysis. The ROH
analysis was comparable for both subsets of dogs, for example, average proportion of genome in a > 1 Mb ROH
for 177 dogs was 20.72% compared with 20.79% in all 255 dogs, while F ROH was 0.036 in both datasets (See Sup-
plementary Data S2), indicating that including closely related dogs in the larger dataset (255 dogs) did not affect
Scientific Reports | (2021) 11:6243 | https://doi.org/10.1038/s41598-021-85262-x 6
Vol:.(1234567890)www.nature.com/scientificreports/
Length (Mb) Average proportion of genome in a run (%) Average number of runs per dog Average number of SNPs per run Average FROH Total number of runs
>1 20.79 135.07 241.54 0.037 34,444
>2 17.09 77.37 347.88 0.031 19,729
>4 11.54 34.39 530.12 0.021 8769
>8 5.53 10.46 843.25 0.010 2667
Table 4. Summary of runs of homozygosity analysis based on 255 genotyped dogs. FROH = inbreeding
coefficient calculated from runs of homozygosity.
ROH estimates. For GenoPed, Ne was calculated using the same 10,000 SNPs and was 78.1 (95% CI 78.1–78.2)
for allele frequency of < 0.05, and was 79.3 (95% CI 79.2–79.4) for allele frequency of < 0.02. The Fgeno for this
subset of dogs was 0.042 (SD 0.076). A comparison of inbreeding coefficients calculated through pedigree analy-
sis (Fped) against genotype data (Fgeno), as well as pedigree analysis (Fped) against FROH (> 1 Mb), both revealed
moderate correlations at R = 0.62 (95% CI 0.53–0.7, p < 2.2e16) and R = 0.63 (95% CI 0.54 – 0.7, p < 2.2e−16),
respectively (Supplementary Figures S7 and S8).
CNV analysis. Data from a total of 255 Border Collies were available for genome-wide CNV analysis. After
quality filtering and merging of closely spaced CNV, 214 dogs remained. Within this group, 7,007 CNVs were
identified with an average length of 134,955.7 bp. The average number of CNVs for each individual was 32.9.
There were almost 1.5 × the number of deletions (4,154) compared to duplications (2,853). When CNVs were
assigned to clusters, there were 112 unique regions that met the criteria for a CNV regions. CNV regions ranged
in size from 1.16 kbp to 1.01 Mbp, with an average length of 697,562.9 bp. These CNV regions were distributed
between 29 autosomes. Eight chromosomes had no evidence for CNV regions, including chromosomes 11, 19,
23, 26, 29, 32, 33, and 35 (Supplementary Figure S9, Supplementary Table S2).
Analysis of TNS and NCL. Based on previous estimates of TNS allele frequency in Australia (0.077)3,
under Hardy Weinberg Equilibrium (HWE) we would expect the population to have 0.59% affected, 14.21%
carriers, and 85.19% normal dogs. Across the entire database, we observed higher frequencies of TNS with 58
affected (0.9%), 1448 carriers (22.49%), and 4933 normal (76.61%) at an allele frequency of 0.121. After filter-
ing out individuals with missing year of births and excluding years where there were fewer than ten dogs tested,
there was a maximum of 160 carriers born in 2007 (27.58% of dogs tested that year) for TNS, while the highest
proportion of TNS carriers were born in 2010 (37.3% of dogs tested that year; N = 101) (Supplementary Fig-
ure S10). The highest proportion of TNS-affected dogs were born in 1990 (10% of dogs tested that year, N = 2),
however the maximum number of affected animals (1.27% of dogs tested that year, N = 8) in a single year was in
2006. There was an average of 0.65 affected animals tested per year pre-commencement of testing (1987 to 2006),
compared to an average 2.75 affected animals per year after testing commenced (2007 to 2014). The number of
TNS-affected animals per year did not vary to a great extent after testing was introduced, ranging from a mini-
mum of one affected dog in 2013 (2% of dogs tested that year) to a maximum of five affected dogs in 2010 (2%)
and 2011 (3%) each. Carriers increased in proportion up to 2010 (37.27% of dogs tested that year) and showed
a decrease between 2011 (35.38%) to 2014 (16.28%), albeit with fewer animals tested during this period, rang-
ing from a minimum of seven carriers (16%) in 2014 to a maximum of 147 (31%) in 2008. Overall, there was a
total of 13 TNS-affected dogs (0.37%), 647 carriers (18.16%), and 2902 normal (81.47%) dogs born before com-
mencement of testing (1987 to 2006), which is an allele frequency of 0.095 for the mutation. After testing was
introduced (2007 to 2014) there was a total of 22 affected dogs (1.08%), 614 carriers (30.23%) and 1395 normal
(68.69%), at an allele frequency of 0.162.
NCL allele frequency in Australia was previously estimated to be 0.03511, which would be an expected 0.12%
affected dogs, 6.76% carriers, and 93.12% normal dogs under HWE. Across the entire database, we observed
slightly higher frequencies of NCL-affected dogs (0.74%, N = 44), lower frequencies of carriers (4.31%, N = 257),
and slightly higher frequency of normal dogs (94.95%, N = 5655), at a similar allele frequency of 0.029. After
exclusions stated above, there were considerably fewer carriers for NCL across the years analysed compared to
TNS, with a maximum of 19 carriers (25.33% of dogs tested that year) born in 1995 for NCL (Supplementary
Figure S11). There were few NCL-affected dogs across the entire period recorded, with a maximum of four
animals affected in a single year (2002, 1.53% of dogs tested that year). After commencement of testing in 2007
there was little change in the proportion of carriers to normal dogs, with the highest proportion of carriers in
2012 (8.33% of dogs tested that year), a minimum of one carrier (2.33%) in 2014 and a maximum of 14 carriers
in 2008 (2.93%) and 2009 (3.66%) each. No NCL-affected dogs were identified between 2007 and 2014. Dogs
born pre-commencement of testing (1986 to 2006) consisted of 15 affected (0.47%), 143 carriers (4.51%), and
3012 normal (95.02%), which is an allele frequency of 0.273. After commencement of testing (2007 to 2014),
there were no affected dogs, 64 carriers (3.25%) and 1906 normal (96.75%), which is an allele frequency of 0.162.
Of the 58 TNS-affected dogs, 16 dogs had unknown parentage and were excluded from pedigree analysis.
Four TNS-affected dogs, including two full siblings, only had between one to four complete generations and
had no common ancestry with the remaining 38 TNS-affected dogs, so these were also excluded from the
pedigree. A pedigree was constructed from the 38 TNS-affected dogs, 71 carriers, 37 normal and 243 untested
dogs (Supplementary Figure S12). The pedigree revealed a common ancestor, dog_811, born in 1968, for the
38 TNS-affected dogs. The pedigree also showed possible pathways leading to dog_811 for all except seven
Scientific Reports | (2021) 11:6243 | https://doi.org/10.1038/s41598-021-85262-x 7
Vol.:(0123456789)www.nature.com/scientificreports/
Mean proportion of Mean no. of runs Mean no. of SNPs
No. dogs genome in a run (%) per dog per run FROH Total no. of runs Mean O(het) Mean E(het) Mean MLH
TNS all tested, all
206 21.03 136.3 242.27 0.037 28,078 0.309 0.316 0.31
autosomes
TNS Normal, all
157 21.39 136.93 245.43 0.034 21,498 0.309 0.314 0.309
autosomes
TNS all tested,
206 19.82 3.61 251.99 0.036 745 0.308 0.328 0.316
Chr 13
TNS Normal, Chr 13 157 22.04 3.82 252.19 0.033 600 0.298 0.322 0.31
NCL all tested, all
205 21.04 136.53 241.9 0.037 27,988 0.31 0.317 0.31
autosomes
NCL Normal, all
184 21.04 136.42 242.03 0.037 25,101 0.309 0.314 0.31
autosomes
NCL all tested,
205 21.43 3.93 218.59 0.038 805 0.309 0.313 0.311
Chr 22
CL Normal, Chr 22 184 21.64 4.05 213.85 0.038 746 0.307 0.309 0.312
Table 5. Summary of runs of homozygosity (> 1 Mb), mean observed (O(het)) and expected heterozygosity
(E(het)) and multi-locus heterozygosity (MLH) for all dogs tested for TNS and CL to compare with dogs
normal for TNS and CL across all autosomes and across the chromosomes where the mutations are located.
carriers (dog_74714, dog_12787, dog_2912, dog_43545, dog_50686, dog_7964, dog_1345). The most prominent
descendant in this pedigree is dog_50624, which was not tested but must be a carrier as it sired two affected
dogs (dog_2889, dog_1443) to two separate dams (dog_2886, dog_1439), and was bred with another five dams,
becoming a common ancestor to 47 carriers and 22 other affected dogs. The paternal grandfather of dog_50624,
dog_828, was a carrier and common ancestor for 20 other carriers and 10 affected dogs (including four which
were also related to dog_50624).
Of the 44 NCL-affected dogs, 11 had unknown parentage and were excluded from pedigree analyses. A pedi-
gree was constructed from the remaining 33 NCL-affected dogs, 28 carriers, eight normal dogs and 160 untested
dogs (Supplementary Figure S13). All affected dogs and carriers in this pedigree could be traced to dog_797,
born in 1966. One of the most prominent in the pedigree is dog_1424, a carrier that sired three NCL-affected
dogs (dog_4113, dog_4114, dog_24302) to two carrier dams (dog_44953 – offspring of dog_1424; dog_44952)
and is also a common ancestor for five known carriers (dog_2420, dog_3172, dog_3462, dog_75368, dog_58202)
and six affected dogs (dog_3935, dog_21688, dog_24318, dog_79185, dog_20146, dog_20156) from four litters.
Another notable individual is dog_30328, a carrier which sired two affected dogs (dog_80311, dog_3942) to two
carrier dams (dog_32973, dog_2761), with affected offspring dog_80311 giving rise to a litter of four affected
dogs (dog_80312, dog_80313, dog_80319, dog_80314), and the consanguineous mating of two of these affected
littermates (dog_80319, dog_80314) giving rise to two more affected dogs (dog_80324, dog_80326). Importantly,
dog_811, which was the common ancestor for TNS-affected dogs, is also a common ancestor for all NCL-affected
and carrier dogs, except for dog_2789 (which must be a carrier as it was the dam of affected dogs dog_3944 and
dog_31971). Dog_811 sired a total of 34 dogs in the database, and was also the fourth top contributing ancestor
to RefPop (Supplementary Table S1).
After filtering for genotype quality, the genotyped population of dogs consisted of 157 dogs clear for the TNS
risk, 47 carriers, and two affected (49 dogs were not tested). For NCL, the filtered genotyped population consisted
of 184 dogs clear for the disease risk, and 21 carriers (50 dogs were not tested). In the GWAS for TNS, there
were 840 significant SNPs (chromosome q < 0.05) on chromosome 13 (Supplementary Figure S14). The most
significant SNP was at 13:2,249,690 (p = 4.96E−41, genome-wide q = 6.64E−36), 837,026 bases away from the
TNS mutation (chr13:1,412,660–1,412,664) and was not in VPS13B (1,101,226 to 1,834,933 bp) (Supplementary
Data S3). The second, third and fourth most significant SNPs were within VPS13B, which were between 204,465
to 269,718 bases away from the TNS mutation (at 1,412,660–1,412,664 bp) and were strongly linked to the top
SNP (r2 = 0.96). A total of 36 SNPs were strongly linked (r2 ≥ 0.8) to the top SNP and 12 SNPs were moderately
linked (0.5 ≤ r2 < 0.8) (Supplementary Figure S15). The strongly linked SNPs spanned several genes, including
15 SNPs in RIMS2, four SNPs on STK3, two SNPs on DCAF13, and one SNP each on UBR5 and ATP6V1C1. Of
the 12 moderately linked SNPs, 10 SNNPs were in RIMS2, one SNP was in ATP6V1C1.
In the GWAS for CL, 666 SNPs were significant (chromosome q < 0.05) on chromosome 22 (Supplemen-
tary Figure S16). There were no SNPs from the genotype data that were in the CLN5 gene (30,568,572 to
30,575,890 bp). The most significant SNP was at 22:30,143,975 (p = 1.52E−38, genome-wide q = 2.34E−33), which
was 430,662 bases upstream from the NCL mutation (30,574,637 bp) (Supplementary Data S4). There were no
SNPs in this region that were strongly or moderately linked to the top SNP (Supplementary Figure S17).
Homozygosity analysis of the 157 dogs clear for TNS compared to all dogs tested showed that removing car-
riers and affected dogs had very marginal impact on overall diversity. There was a reduction in FROH (> 1 Mb)
when carriers and affected dogs were removed (0.037 to 0.034), a slight increase in the average proportion
of genome in a ROH from 21.03% to 21.39%, and MLH dropped slightly from 0.31 to 0.309 (Table 5). Upon
examining chromosome 13 where the TNS mutation is located, removing carriers and affected dogs reduced
FROH (> 1 Mb) slightly from 0.036 to 0.033, while average proportion of genome in a run slightly increased
from 19.82% to 22.04%. The number of total runs on chromosome 13 reduced from 745 to 600 and MLH also
Scientific Reports | (2021) 11:6243 | https://doi.org/10.1038/s41598-021-85262-x 8
Vol:.(1234567890)www.nature.com/scientificreports/
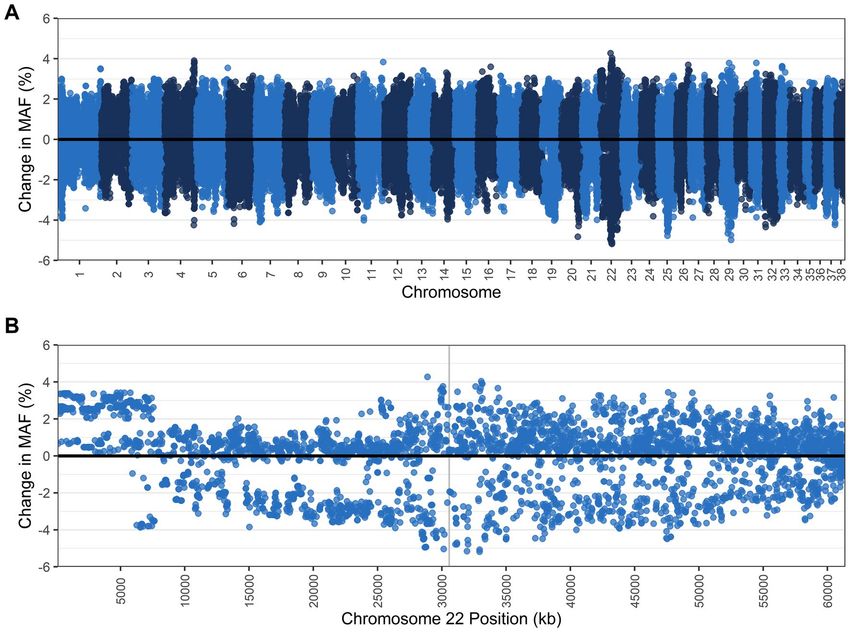
Figure 3. Change in the minor allele frequency (MAF) (A) across all autosomes and (B) within chromosome
13, where the VPS13B gene is located (position shaded in grey), when TNS carriers (N = 47) and affected (N = 2)
dogs are removed from the population, leaving dogs clear of the TNS mutation (N = 157). Each dot represents a
single nucleotide polymorphism (SNP).
had a slight reduction from 0.316 to 0.31. Across the genome, gains and losses of MAF were evenly distributed
except a pronounced loss of MAF was identified on chromosome 13 around the TNS mutation, with 89 SNPs
losing ≥ 10% MAF (maximum loss of 12.7%), while 67 SNPs in this region also gained ≥ 5% MAF (Fig. 3, Sup-
plementary Data 5).
Similarly, removing NCL carriers caused no change in F ROH (0.037), MLH (0.31), or average proportion of
genome in a run (21.04%) (Table 5). Examination of chromosome 22 where the NCL mutation is located also
revealed little change when carriers were removed, with no change in FROH (0.038) and a small increase in aver-
age proportion of genome in a run from 21.43% to 21.64%. The number of total runs decreased from 805 to
746 and MLH increased slightly from 0.311 to 0.312. Gains and losses of MAF were mostly evenly distributed
across the genome, and at chromosome 22 around the NCL mutation, there were just four SNPs losing > 5%
MAF (maximum loss of 5.18%) (Fig. 4).
NetView visualisation of the genotyped population showed that TNS carriers were distributed throughout
the population and were not localised to a single cluster (Supplementary Figure S18), whereas a cluster of 16
NCL carriers was identified within the population (Supplementary Figure S19).
Discussion
Maintaining diversity is conducive to health and well-being in populations of purebred dog breeds derived from
a limited gene pool. To the best of the authors’ knowledge, this is the first study examining genetic diversity using
SNP markers in the Border Collie breed, and compared to previous studies, has the advantage of high-density
SNP data and the added ability to compare genomic analysis of the genotyped animals directly with comparative
analyses from pedigree data.
Based on EqG values of RefPop, the depth of pedigree data was more extensive than previous s tudies18,23,24.
Average EqG in this study was comparable to that of Shariflou et al.24, and considerably higher than EqG esti-
mates by Leroy et al.18 and Wijnrocx et al.18,23, suggesting the Australian population of Border Collies may have
a greater depth of pedigree. Although there was a large proportion of missing birth years for RefPop, the average
generation interval was within the bounds reported by previous studies (4.09 to 4.6)18,24,25.
Inbreeding in dogs not only has an effect on the occurrence of disease variants in the population but may also
reduce longevity and litter size59. Mean molecular estimates for inbreeding in the present study (Fgeno = 0.052,
FROH (> 1 Mb) = 0.037) were comparable to previous estimates in Border Collies (fixation index, FIS = 0.082)18. The
genealogical estimate of inbreeding in the reference population (0.095) was consistent with previous estimates
Scientific Reports | (2021) 11:6243 | https://doi.org/10.1038/s41598-021-85262-x 9
Vol.:(0123456789)www.nature.com/scientificreports/
Figure 4. Change in the minor allele frequency (MAF) (A) across all autosomes and (B) within chromosome
22, where the CLN5 gene is located (position shaded in grey), when NCL carriers (N = 29) are removed from
the population, leaving dogs clear of the NCL mutation (N = 184). Each dot represents a single nucleotide
polymorphism (SNP).
(0.008 to 0.099)18,23–25. The mean genealogical inbreeding estimates for GenoPed was higher (Fped = 0.139, SD
0.063) compared to molecular estimates for these animals (Fgeno = 0.042, SD = 0.076). These values are not directly
comparable due to differences in calculation for the different data types, but pedigree estimates of inbreeding has
been shown in other studies to correlate well with several different inbreeding estimates from SNP chip data and
sequence data60,61. Importantly, the standard deviation for both estimates were large, indicating a high degree
of variation in inbreeding across the population. This trend was the opposite to the study by Wijnrocx et al.23,
which reported a lower inbreeding coefficient of 0.019 using genealogical data from 13,142 dogs compared to an
inbreeding value ( FIS) of 0.031 using microsatellite markers in 11,66 dogs. In a study of diversity in Bullmastiffs,
the estimates for inbreeding using molecular and genealogical data were similar (0.047 and 0.035 respectively).
Although our estimates using molecular markers ( FROH) are similar to Wijnrocx et al.23 (FIS), higher estimates
for inbreeding estimated from genealogical data may be due to the greater depth of pedigree in the present
study, which allowed for a more accurate estimation. A comparison of inbreeding coefficients for GenoPed cal-
culated from genealogical data to the molecular calculations from FROH over 1 Mb and to Fgeno (calculated from
heterozygosity) showed moderate correlations. Higher values in the molecular estimates may be due to popular
sire effects or linebreeding in older generations that were not captured in the pedigree data. Higher values in the
genealogical estimates could reflect more recent inbreeding or be due to the large variation in the estimates. Our
reference population showed higher mean kinship compared to Leroy et al.18 and Wijnrocx et al.18,23, which is
in part explained by higher mean inbreeding values compared to these studies.
The number of observed founders in RefPop was much higher than previous studies, however, the number
of effective ancestors and the number of effective founder genomes were lower compared to previous studies,
indicating the presence of genetic bottlenecks and genetic drift in the population. Effective number of founder
genomes was also a lot lower in RefPop compared to that reported by Wijnrocx et al.23 and Shariflou et al.24. The
differences compared to Shariflou et al.24 may be attributed to a greater depth of pedigree captured in the current
study (EqG = 7.6 compared to 10.38 in RefPop). The effective number of founders for RefPop was close to the
value reported by Wijnrocx et al.23. Wijnrocx et al.23 had a more limited depth of pedigree (EqG = 4.7) compared
to the present study (EqG = 10.38), and has a much larger number of effective ancestors (115) compared to the
present study (28).
The value of fe/f indicates the founder contribution, with smaller values indicating more uneven founder
contribution. The fe/f value calculated for RefPop (0.09) was close to previous reports by others24,25, but was
less than half that of Wijnrocx et al.23, which again may be due to differences in depth of available pedigree.
Scientific Reports | (2021) 11:6243 | https://doi.org/10.1038/s41598-021-85262-x 10
Vol:.(1234567890)www.nature.com/scientificreports/
The Border Collie breed has a large registry and so our findings of uneven founder contribution are consistent
with previous reports that uneven founder contribution is more pronounced in breeds with larger r egistries24.
The value of fa/fe is an indication of genetic bottlenecks in the p opulation43 and differed greatly to estimates by
others18,23,24 (0.14 in RefPop compared to 0.96, 0.47 and 0.6, respectively). It is possible that genetic bottlenecks
occurred further back in the pedigree that were not captured by these studies, however, it remains unclear why
the fa/fe values of RefPop and by Shariflou et al.24 differed extensively despite having similar EqG. The number of
effective founder genomes is the smallest estimate for founder contribution43 and was a great deal smaller in the
current study (Ng = 10.65 (SD 2.82)) compared to previous estimates (Ng = 25.2 to 55.5)23,24.
Effective population size is a measure of the number of equally contributing animals that explain the avail-
able genetic variation in a population, with higher numbers representing a greater genetic diversity22,24. The Ne
of RefPop (123.5) was within the bounds of previous estimates (99.1 to 129)23,24. The genealogical Ne estimates
for GenoPed (65.4) and from SNP data (78.1) were comparable to each other, indicating that between 65 and
78 dogs captured the available genetic variation in a sample of 227 dogs, and the pedigree estimate is suitable
to use when genetic data is not available to evaluate genetic diversity. Genetic estimates for effective population
size has only previously been measured for 13 generations (Ne13 = 50) based on 16 Border Collies32, hence these
estimates are not directly comparable. Two other studies have reported Ne estimates in other breeds using SNP
data, and reported an Ne of 29.1 in B ullmastiffs22, and an Ne of 27 in Braque Français type Pyrénées31. These two
studies are from breeds that have much smaller registries compared to Border Collies and it is not surprising
that they have much lower Ne compared to the present study’s estimates.
Our estimates for FROH was approximately 0.1 lower than previously reported for 16 Border Collies by Mas-
trangelo et al.32, implying there was more genetic diversity in the Australian population in our study, or our
measures of genetic diversity were more precise owing to a larger sample size. Compared to other breeds previ-
ously reported32, the estimates from the present study are much lower, potentially due to the Border Collie’s large
registry. One study, which also imputed data from the 173 k SNP array up to the higher density SNP 220 k array,
examined ROH in 102 Border Collies and showed small clusters with moderate density of ROH on chromosomes
3, 21, 22, 23, and several o thers62. Compared to other breeds examined in that same study, the ROH density
across the genome in the Border Collie was one of the lowest. The study also showed Border Collies had a mean
FROH of approximately 0.2 and ranged from 0.1 to 0.5, however their criteria for detecting a run of homozygosity
was less stringent (500 kb) than the present study and hence cannot be directly compared62. In the present study,
chromosomes 3, 21, 22 and 23 did not show greater density in ROH, and instead chromosomes 2, 5, 14, 24 and
26 displayed the highest frequency of SNPs in a ROH.
The findings for expected and observed heterozygosity were lower than previous estimates derived from
a small number of m icrosatellites15,18,21,23,26. The difference may be explained by the large number of alleles in
microsatellites as well as higher mutation rates in microsatellites, and extrapolation of a small number of loci to
a generalised estimate of heterozygosity in those studies. The estimates from the present study were comparable
to a study that used the 170 k CanineHD Beadchip for the Braque Français type Pyrénées dog breed with a
reported expected and observed heterozygosity of 0.371 (± 0.142) and 0.359 (± 0.124), respectively31. Multi-locus
heterozygosity (MLH) was higher in the present study (0.311) and towards the upper end of the MLH range (0.1
to 0.36) measured in other b reeds22.
Another source of variation that contributes to diversity is CNV. In other studies, CNV have been associated
with phenotypic variation and in some cases, inherited disorders. Here the identified CNV regions were mostly
described in other breeds but some appeared to be novel to Border Collies. On a chromosome-by-chromosome
basis the number of dogs carrying an individual CNV region varied between 1 and 13, indicating that CNV
contribute to diversity within the breed. Many CNV overlap genes, and may contribute to disorders in the breed,
although there was no indication of this in the present cohort.
There was a greater number of TNS carriers identified for each year compared to NCL, with over 100 TNS
carriers identified per year between 2006 and 2010, compared to less than 20 NCL carriers found per year across
1986 to 2014. However, the number and proportion of carriers for both diseases declined between 2011–2014.
We also observed a greater allele frequency for the mutations than previously reported3,11. However, these obser-
vations should be taken with caution as it may not be representative of the population since there may be some
sampling bias. Breeders that identify a carrier among their dogs may choose to test all related animals, so sam-
pling is not completely random. Upon inspection of the pedigrees of affected dogs for both diseases, there were
several prominent ancestors that were bred repeatedly and were likely carriers, which would have contributed
disproportionately to the disease allele frequency in the population. A previous study found a common ancestor
(dog_50624 in the current study) for seven TNS-affected dogs63. In this study, we were able to build a much larger
pedigree including 38 TNS-affected dogs and 71 carriers. The common ancestor identified previously, dog_50624,
could be traced to a total of 47 TNS carriers and 22 affected dogs. The paternal grandfather of dog_50624 was
also identified to be a common ancestor for 20 other TNS carriers and another 10 affected dogs (including four
shared with dog_50624). A total of 106 dogs in the database were sired by dog_50624. Importantly, there was
a common ancestor identified (dog_811) for both TNS- and NCL-affected dogs, which sired a total of 34 dogs
in the database and was the fourth top contributing ancestor to RefPop. This exemplifies how a single dog can
affect the population decades later, and these genetic impacts can be further exacerbated through inbreeding or
breeding of descendants, in a manner that may reduce the effective population size. Although all NCL-affected
dogs and carriers could be traced to a common ancestor, the origin of the disease in Border Collies likely pre-
dates the common ancestor (born in 1966) found in this study, since the study of NCL in Border Collies in Japan
found a common ancestor originating from Australia in 1 9445. It is possible that the mutation originated before
the formation of the breed, as the same mutation has also been identified in Australian Cattle Dogs, and two
mixed breed d ogs9,12,13. As suggested p reviously12, there may have been interbreeding between Border Collies
and Australian Cattle dogs which possibly introduced the mutation from one breed to the other64. The possibility
Scientific Reports | (2021) 11:6243 | https://doi.org/10.1038/s41598-021-85262-x 11
Vol.:(0123456789)www.nature.com/scientificreports/
of the mutation originating in an ancestor of multiple breeds is supported by the study of Villaini et al.13, as the
mixed breed dog in the study had little to no Border Collie or Australian Cattle Dog ancestry, and the other
mixed breed dog in the study by Katz et al.9 that had a German Shepherd Dog sire and Australian Cattle Dog
dam shared the rare, 87 kb haplotype around CLN5 with five Border Collies. The German Shepherd Dog breed is
from a more ancestral clade to the Border Collie and the Australian Cattle Dog breeds, and the breeds suggested
by Villani et al.13 to harbour the same mutation are from various other clades64. Since the mutation has not yet
been characterised in any other breeds it is difficult to determine the breed or ancestor from which it originated,
or when the mutation arose, but does suggest that this mutation should be investigated in all breeds exhibiting
the disease. Similarly, the origin of the TNS mutation is also likely older than dog_811, since it could not account
for 7 carriers in the pedigree. This disease has been exclusively reported in the Border Collie breed so it may be
possible to identify the dog in which the mutant allele originated, however, the uncertainty of identifying animals
that are carriers in older generations makes it difficult to pinpoint the origin of the mutation.
The NetView visualisation of the population showed the distribution and prevalence of TNS carriers in the
genotyped population of dogs. They were distributed throughout the network and were not co-located in clusters,
further emphasising how widespread the mutant allele is in the population. When the network was visualised
for NCL, one cluster of 16 individuals was identified, indicating that in the genotyped population, dogs that have
the NCL mutation may be restricted to a few breeding lines or closely related dogs. Removing all carriers that
are widespread in a population, such as TNS, is likely to reduce overall genetic diversity compared to removing
carriers that are clustered together, such as NCL, where rare variants that exist only in the cluster may be lost,
and there will be less of an impact on overall genetic diversity.
A study on the prevalence of seven genetic disorders (including TNS and NCL) in 500 Border Collies in Japan
found that 56% of the population did not carry any of the disease a lleles4. The authors suggested that, although
possible, it would be impractical to immediately remove all carriers from the population over concerns about
reduction in genetic diversity and increased inbreeding. In the present study, we sought to identify the genetic
impact of removing TNS and NCL carriers from the population. Homozygosity analysis of dogs that did not carry
the TNS and NCL mutation revealed very little change in number of runs and frequency of ROH, suggesting
that removing all TNS and NCL carriers in the population will have little impact on overall genetic diversity. The
small impact on diversity from removing carriers is likely in part due to the breed’s large registry in Australia.
If the disease was seen in a breed with a small registry, the impact of removing carriers may be more profound
and potentially cause a genetic bottleneck in the breed. Although there was little effect of removing carriers and
affected dogs from the population on ROH, there was up to 12.7% loss in MAF around VPS13B and up to 5.18%
loss around CLN5. The loss of MAF in these regions is an indication of the alleles that may become fixed if car-
riers of each mutation are removed from the breeding pool. The smaller impact on MAF for NCL may be in part
due to fewer carrier dogs (21 carriers and no affected dogs) in the genotyped population for NCL compared to
TNS (47 carriers and two affected). Future studies may wish to investigate the loss of MAF or other diversity
parameters for NCL with a larger population of carriers/affected dogs. Breeding away from the TNS disease allele
in the population may also cause a loss of MAF in the region close to VPS13B, as 36 SNPs were strongly linked
to the top SNP and spanned several genes such as RIMS2, and STK3. The gene RIMS2 encodes a presynaptic
protein that is essential for neurotransmitter release and also plays a role in insulin s ecretion65,66, while STK3
(also known as MST2) encodes a serine/threonine kinase that plays an important role in a poptosis67,68. The loss
of MAF in these genes could therefore have implications on apoptosis and neurotransmitter release or insulin
secretion, but the potential consequences will require further investigation.
In conclusion, we report lower levels of heterozygosity in Border Collies from molecular estimates from SNP
data than previous estimates from microsatellites, however, multi-locus heterozygosity in the breed is high. Some
genealogical measures of diversity differed from previous studies, particularly in the number of effective ances-
tors and effective founder genomes. Estimations of effective population size from genetic data and from pedigree
data were similar, while inbreeding coefficients calculated from both datasets showed moderate correlations. The
number of TNS carriers per year was much higher than the number of NCL carriers. The common ancestor for
all TNS-affected dogs, dog_811, also appeared in the pedigrees of all NCL-affected dogs, however the origin of
these mutations likely predates this dog. We show that the removal of TNS and NCL carriers from the popula-
tion has a small impact on overall genetic diversity, but some loss of MAF would result in the regions around the
affected genes and may be expected to have a larger impact within smaller sub-populations.
Received: 15 October 2020; Accepted: 28 February 2021
References
1. Asher, L., Diesel, G., Summers, J. F., McGreevy, P. D. & Collins, L. M. Inherited defects in pedigree dogs. Part 1: disorders related
to breed standards. Vet. J. 182, 402–411 (2009).
2. Allan, F. J., Thompson, K. G., Jones, B. R., Burbidge, H. M. & McKinley, R. L. Neutropenia with a probable hereditary basis in
Border Collies. N. Z. Vet. J. 44, 67–72 (1996).
3. Shearman, J. R. & Wilton, A. N. A canine model of cohen syndrome: Trapped neutrophil syndrome. BMC Genomics 12, 258 (2011).
4. Mizukami, K. et al. Molecular prevalence of multiple genetic disorders in Border collies in Japan and recommendations for genetic
counselling. Vet. J. 214, 21–23 (2016).
5. Mizukami, K. et al. Neuronal ceroid lipofuscinosis in border collie dogs in Japan: clinical and molecular epidemiological study
(2000–2011). Sci. World J. 2012, 1–7 (2012).
6. Jolly, D. et al. Canine ceroid-lipohscinoses: a review and classification. J. Small Anim. Pract. 35, 299–306 (1994).
7. Taylor, R. M. & Farrow, B. R. H. Ceroid lipofuscinosis in the border collie dog: retinal lesions in an animal model of juvenile Batten
disease. Am. J. Med. Genet. 42, 622–627 (1992).
Scientific Reports | (2021) 11:6243 | https://doi.org/10.1038/s41598-021-85262-x 12
Vol:.(1234567890)You can also read