Report 33: Modelling the allocation and impact of a COVID-19 vaccine
←
→
Page content transcription
If your browser does not render page correctly, please read the page content below
25 September 2020                                             Imperial College COVID-19 response team

Report 33: Modelling the allocation and impact of a COVID-19
vaccine
Alexandra B Hogan^1, Peter Winskill^1, Oliver J Watson1, Patrick GT Walker1, Charles Whittaker1, Marc
Baguelin1, David Haw1, Alessandra Løchen1, Katy A M Gaythorpe1, Imperial College COVID-19 Response
Team1, Farzana Muhib2, Peter Smith3, Katharina Hauck1, Neil M Ferguson1, Azra C Ghani1

1. MRC Centre for Global Infectious Disease Analysis & WHO Collaborating Centre for Infectious
Disease Modelling, Abdul Latif Jameel Institute for Disease and Emergency Analytics (J-IDEA), Imperial
College London
2. PATH, Seattle, USA
3. Business School, Imperial College London

^Contributed equally

Correspondence a.hogan@imperial.ac.uk; p.winskill@imperial.ac.uk; a.ghani@imperial.ac.uk

Summary

Several SARS-CoV-2 vaccine candidates are now in late-stage trials, with efficacy and safety results
expected by the end of 2020. Even under optimistic scenarios for manufacture and delivery, the doses
available in 2021 are likely to be limited. Here we identify optimal vaccine allocation strategies within
and between countries to maximise health (avert deaths) under constraints on dose supply. We
extended an existing mathematical model of SARS-CoV-2 transmission across different country
settings to model the public health impact of potential vaccines, using a range of target product
profiles developed by the World Health Organization. We show that as supply increases, vaccines that
reduce or block infection – and thus transmission – in addition to preventing disease have a greater
impact than those that prevent disease alone, due to the indirect protection provided to high-risk
groups. We further demonstrate that the health impact of vaccination will depend on the cumulative
infection incidence in the population when vaccination begins, the duration of any naturally acquired
immunity, the likely trajectory of the epidemic in 2021 and the level of healthcare available to
effectively treat those with disease. Within a country, we find that for a limited supply (doses for
25 September 2020                                             Imperial College COVID-19 response team

1. Introduction

COVID-19 has caused an unprecedented global public health and economic challenge which will likely
continue to be highly disruptive to lives and livelihoods until a preventative intervention, such as a
vaccine, becomes widely available. Demand for a vaccine is unparalleled and, as a result, extraordinary
public and private sector efforts are underway to identify vaccine candidates, conduct clinical trials on
compressed timelines and scale up manufacturing ahead of regulatory approval. There are currently
over 200 candidate vaccines, with ten currently undergoing Phase III efficacy trials and five
recommended for limited use1. Efficacy results from the leading candidates are expected by the end
of 2020.

Even if one or more of the current candidates demonstrates efficacy, the demand for doses is likely to
exceed supply through 2021 due to constraints in manufacturing. Despite the development of
international initiatives such as COVAX to share the risks of the R&D process and to ensure equitable
access2, the political and economic incentives for countries to prioritise national interest remain high
– as has already been demonstrated by countries stockpiling treatment supplies and other
pharmaceuticals3,4 as well as countries signing advanced purchase agreements for individual vaccines.
Four allocation principles, reflected in the current World Health Organization (WHO) global allocation
framework15, have been identified by bioethicists to guide any allocation of scarce resources: (A) that
the benefits of the resource are maximised; (B) that priority is given to those who would be worst-off
in the absence of the resource; (C) that individuals are treated equally; and (D) that the societal benefit
is maximised5,6. A key component in achieving principles A and B will be targeting the vaccine to those
at highest risk of death. Given the strong age-gradient of risk associated with COVID-19 infection7, this
is likely to result in age-targeting. However, to meet principle B, this will need to be balanced against
both life-expectancy (in order to minimise life-years lost) and the additional variation in the risk of
death resulting from, for example, inequitable access to healthcare across the globe. In addition,
aligned with principle D, it is likely that any vaccine allocation would also prioritise essential workers
such as those providing the frontline health response. Deriving optimal and fair allocation strategies
for limited stocks of vaccine in light of these principles is far from straightforward.

Here we extend an epidemiological model of SARS-CoV-2 transmission to explore the potential public
health impact of different vaccine characteristics, epidemic stages, and population-targeting
strategies. We apply the model to countries with different levels of income to understand the impact
that demographics, societal mixing patterns and health system constraints have in the evaluation of
this benefit. We then explore the implications of these characteristics for within-country and global
allocation and quantify the maximum public health benefit of different allocation strategies under a
range of likely supply constraints.

DOI: https://doi.org/10.25561/82822                                                          Page 2 of 21
25 September 2020                                            Imperial College COVID-19 response team

2. Methods

2.1 Mathematical Model
We extended a previously developed age-structured deterministic SEIR-type compartmental model
for SARS-CoV-2 transmission9 to include vaccination. The model explicitly incorporates the clinical
pathway for those who develop disease requiring hospitalisation, allowing estimates of the need for
oxygen support and/or intensive care unit (ICU) based support to be estimated. Transmission between
classes depends on age-based contact matrices and a constant transmission rate per contact (in
sensitivity analysis we explore reduced transmission from children). Other risk groups or settings (such
as healthcare workers or care homes) are not included. The model was extended to capture loss of
naturally-acquired immunity by including an additional flow from the recovered state to the
susceptible state.

Once vaccination is introduced into a population, we assume that all eligible individuals (depending
on the targeting or prioritisation that is applied) are vaccinated at a constant rate over a short time
period (1 month) so that outputs can be compared to counterfactual scenarios. This includes those
that are susceptible, in the latent period or recovered (immune). The model structure assumes that
those who are currently infected do not receive the vaccine; whilst this simplification may miss the
asymptomatic individuals, these represent a small fraction of the total population at any given time.
Vaccinated individuals move into a temporary state to capture the delay between receiving the
vaccine and being protected before moving into a vaccine-protected state. We assume that protection
is partial, with efficacy parameters detailed below. Vaccine-induced immunity can either be lifelong
or shorter, with decay in vaccine-induced immunity captured by moving individuals from the
vaccinated and protected state to an additional state in which they are again susceptible to infection
(unless they acquire immunity through natural infection). Protection against infection is modelled by
reducing the transmission parameter by a constant factor while protection against severe disease only
is captured by reducing the rate of hospitalisation.

Additional details of the model are given in the Supplementary Information (Figures S1–S3 and Table
S1).

2.2 Parameterisation
We stratify the global population into four groups, based on the current World Bank10 classification of
high-income countries (HIC), upper-middle-income countries (UMIC), lower-middle-income countries
(LMIC) and low-income countries (LIC). Countries are assumed to remain in their current group over
the projection horizon. We capture epidemiological differences between these groups by modifying
the age-distribution of the population and age-based contact patterns. We use the current age-
distribution for the country with the median GDP in each of the four groups and age-based contact
patterns representative of these settings based on the availability of contact data studies9. Natural
history parameters for SARS-CoV-2 infection are based on previous work11 with the duration of stays
in hospital taken from analysis of UK data9 and the overall infection fatality ratio (IFR) obtained from
Verity et al.7 based on early analysis of Chinese data (but consistent with IFR estimates from France12).
Levels of transmission are determined by the time-varying reproduction number, Rt. Transmission
scenarios are detailed below.

DOI: https://doi.org/10.25561/82822                                                         Page 3 of 21
25 September 2020                                             Imperial College COVID-19 response team

At present there are no efficacy data to guide the choice of the vaccine candidate profiles. We
therefore use parameters aligned with the WHO Target Product Profiles13. For our baseline
simulations we assume a vaccine efficacy of 70% and in sensitivity analyses additionally explore a
lower efficacy (50%). In simulations exploring the potential for lower vaccine efficacy in older age
groups, we assume that vaccine efficacy in those aged 65 years and older is 50% of that in younger
individuals, based on observations from influenza vaccination14,15. We assume a 14-day period on
average between vaccination and protection, consistent with observations of increasing antibody and
T-cell responses in the Phase II data16–20. Once protected, in our baseline runs we assume that the
vaccine-induced immunity is sufficiently long-lived to cover the period of analysis (referred to from
here onwards as “long immunity”). However, given that both antibody reversion from natural
infections21 and re-infection22 have now been reported, it is plausible that the durability of the vaccine
could be substantially shorter. We therefore explore additional scenarios of 6 month and 1 year mean
durations of protection, consistent with the WHO Target Product Profiles13. The key parameters are
summarised in Table 1 and in the Supplementary Information (Table S1).

2. 3 Scenarios and Counterfactual
Some vaccines could potentially become available as early as the beginning of 2021. While scale-up
and delivery will take many months, here we make the simplifying assumption that the vaccine is
introduced in a population at the beginning of January 2021 and that the target coverage is achieved
by the beginning of February 2021. Whilst in practice vaccination is likely to scale-up gradually over
the year, we make this simplification to avoid comparisons with counterfactual scenarios in which the
vaccine “misses” the epidemic. All individuals in the population except those that are currently
infected are vaccinated, i.e. vaccination occurs regardless of immune status.

To evaluate the public health impact of any vaccine, we need to consider the trajectory of the epidemic
in the absence of a vaccine. Given the diversity of experiences across the world to date, this is
challenging since testing rates differ substantially between countries. We therefore simplify our
analysis to focus on a single “typical” trajectory up to the time of vaccine introduction. Under our
simplified vaccine implementation, the populations are vaccinated during January 2021 and no further
vaccination takes place subsequently (although in practice if vaccine-induced immunity wanes then
repeat vaccination is likely to occur). We then compare scenarios from February 2021 onwards (Figure
1).

For our baseline scenarios we assume an initial peak in transmission occurred in the first half of 2020
and that this is reduced by the introduction of non-pharmaceutical interventions (NPIs), resulting in
low levels of transmission through the remainder of the year (Figure S4). Under our assumption of
”long immunity” and in a HIC setting, this results in 10% of the population being immune by the end
of 2020 (plausible given seroprevalence surveys to date23,24), while under the assumption of a mean
duration of immunity of one year, this figure is reduced to 7% (Figure 1; similar results for other
income settings are given in Figure S5). We explore additional scenarios in which the proportion of
the population immune at vaccine introduction varies from 3% to 27% in the Supplementary
Information (Figure S6).

Within our modelling framework we consider two possibilities for health system capacity. The first is
that all health systems are unconstrained – and hence that regardless of the size of the epidemic, a
constant (age-dependent) proportion of infections are hospitalised and receive appropriate care. This

DOI: https://doi.org/10.25561/82822                                                          Page 4 of 21
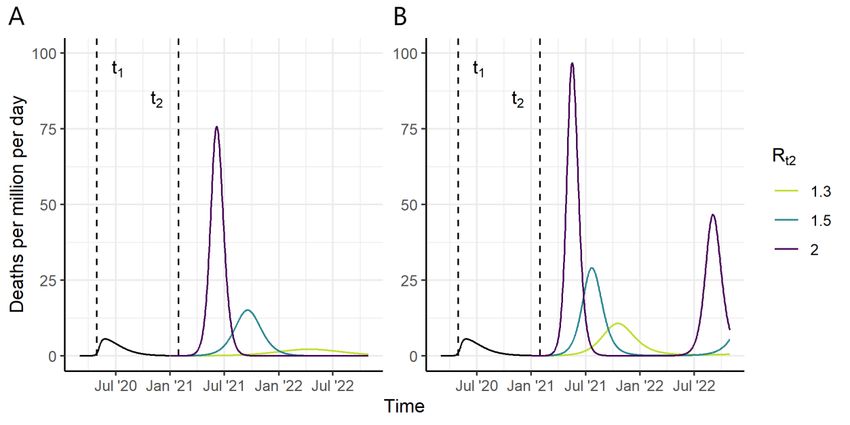
25 September 2020                                                 Imperial College COVID-19 response team

results in population-level IFRs that are highest in the HIC and lowest in the LIC given the different
demography of these populations9. Second, we more realistically assume that health systems will be
constrained to varying degrees. Here we follow the assumptions and parameters in Walker et al.9 in
which LIC and LMIC have limited hospital capacity (estimated using World Bank data) and once
exceeded, those that require hospitalisation but do not receive it have worse outcomes. In contrast,
in MIC and HIC, whilst existing hospital capacity may also be exceeded, we assume that surge capacity
is implemented to fill this gap. In LIC we additionally assume that, due to poorer facilities within
hospitals, outcomes for those that are hospitalised are worse than in other settings. This results in
slightly higher population-level IFRs in LIC and LMIC compared to MIC and HIC9. Our default
assumption is that health system constraints are in place.

Given that it is unlikely that relaxation of NPIs would result in a return to the level of transmission (R0)
seen before controls were introduced due to ongoing interventions (e.g. the use of facemasks,
working from home and test/trace/isolate), we explore three scenarios for Rt2 from February 2021
onwards: Rt2=2, 1.5 or 1.3. These values were chosen to represent a range of epidemic trajectories in
the absence of vaccination with the higher Rt2 resulting in a rapid epidemic and the lower Rt2 values
resulting in less peaked but longer duration epidemics. These values are consistent with the range of
current estimates for countries that are currently not suppressing transmission25–27. We calculate the
deaths averted and life-years gained (LYG by subtracting the projected life-years assuming a maximum
100-year lifespan) in the vaccinated scenario from those projected in the counterfactual scenario. We
consider time horizons of 2021 only and 2021–2022.

Figure 1: Scenarios for the Course of the Epidemic from 2020–2022, for a High-Income Country Setting, in the
Absence of a Vaccine (counterfactual scenarios). (A) Assuming “long immunity” and (B) assuming an average
duration of naturally acquired immunity of 1 year. We assume that R 0=2.5 up to time t1 (May 2020) and that Rt1
drops to 1.0 between time t1 and t2 (February 2021). In panel (A) this results in 10% in the recovered (immune)
state R in February 2021 while in panel (B) the equivalent figure is 7.0%. From time t2 onwards, we consider
three counterfactual scenarios, Rt2=1.3, 1.5 and 2 shown in yellow, green and purple respectively. Vaccine impact
is compared to these counterfactual scenarios.

DOI: https://doi.org/10.25561/82822                                                                Page 5 of 21
25 September 2020 Imperial College COVID-19 response team
2.4 Vaccine Allocation
We first consider the optimal allocation of the vaccine within a country under different supply
constraints (defined as a percentage of the population for which vaccine is available). We divide the
population into 5-year age groups and generate a range of scenarios in which combinations of age
groups are included. Since it is unlikely that distinct 5-year age groups would be selected (for example,
vaccinating only the 20–24 year olds and 40–44 year olds is not programmatically likely) we generate
scenarios in which two contiguous “bands” of age groups could be selected. This would allow, for
example, the elderly and children to be selected. The full set of scenarios are described in the
Supplementary Information (Figure S17). For each scenario we calculate the deaths averted over the
time horizon, assuming 80% coverage of the vaccine in each age group combination and assuming
default vaccine efficacy, duration and coverage parameters and with a 2020 epidemic that results in
10% of the population being immune at the time of introduction of the vaccine (Table 1). We then
select by inspection the most efficient allocation frontier from this set of simulations (see
Supplementary Information, Figure S15). We compare this optimal strategy to two age-targeted
approaches. In the first we sequentially allocate from the oldest age group downwards (i.e. 80+, 75+,
70+ etc.). In the second we target the working-age population first starting with the highest risk group
(i.e. 60–64) and working downwards by age, and then sequentially add in the younger and older age
groups either side of the working age population until the whole population is covered. As a sensitivity
analysis, we repeat these analyses for reduced vaccine efficacy; reduced efficacy in the 65+ population
only; mode of vaccine action as disease-blocking; increased NPIs following introduction of a vaccine;
reduced transmission in children younger than 10 years; and in the absence of health system
constraints.
Secondly, we explore the impact of different global vaccine dose allocation strategies assuming that
the dose supply is constrained over the first year. We use the same simulations as above to calculate
the deaths averted in 2021 assuming default vaccine efficacy, duration and coverage across the four
income settings and for 5-year age group combinations (see Supplementary Information). We
calculate the population-level impact in terms of deaths averted in the year 2021 for that income
setting and age group, and use these results to quantify the total global impact and number of vaccine
doses required for every combination of age-targeting strategy across the four income settings.
We identify six plausible global vaccine allocation strategies, and simulate the health impact for each
strategy, assuming a two-dose schedule, a 2 billion dose constraint, and 15% buffer stock and wastage
(Table 1):
1. Countries are allocated doses relative to population size;
2. Countries are allocated doses relative to population size, with individuals 65 years and older
targeted first;
3. Countries are allocated doses relative to size of population 65 years and older, with that age
group targeted first.
4. High-income countries can access doses first;
5. Low- and lower-middle-income countries can access doses first; and
6. Countries are allocated doses relative to population size, with additional doses available to
high- and middle-income countries (1.15 billion and 1.10 billion respectively);
We assume that doses could be distributed across all countries, even if coverage is low.
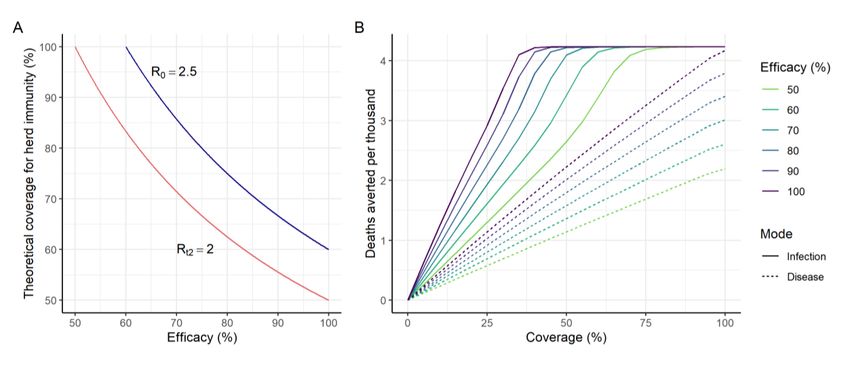
DOI: https://doi.org/10.25561/82822 Page 6 of 2125 September 2020 Imperial College COVID-19 response team We additionally use a simulated annealing algorithm to identify the optimal global vaccine allocation strategy. For this we stratify the global population into the population sizes of the 85 largest countries comprising 95% of the global population, assigning the average age distribution for their income group to each country to reduce the computational requirements. Under this optimisation algorithm, the available doses can be allocated both between countries, and within the age groups within each country as described above, thereby allowing different combinations of 5-year age groups to be selected within each country. We repeat the optimisation 100 times and select the most efficient global dose allocation identified by the algorithm. Whilst the specific country allocations vary between each of the 100 repeats, the overall patterns of allocation and strategies remain consistent. We also identify the optimal allocations under different assumptions for vaccine efficacy; efficacy in the 65+ population; the mode of vaccine action; NPIs following vaccine introduction; the absence of health system constraints; infectiousness in children younger than 10 years reduced by 50%; and life-years gained, rather than deaths averted, used as the global optimisation outcome measure. 3. Results Infection-blocking vaccines can have health impact in two ways: by reducing the burden of disease through direct protection of those vaccinated, and by reducing infection rates in the population and thus providing indirect protection to the entire population, including those not vaccinated (so-called herd immunity). For our assumed R0 of 2.5, the theoretical coverage required to achieve herd immunity for a vaccine that is 100% efficacious is 60% in a population that mixes randomly, and above this if vaccine efficacy is below 100% (Figure 2A). In our simulations, temporary herd immunity can be reached at lower coverage levels since we assume that ongoing NPIs generate an effective reproduction number of 2 (although with wider vaccine availability from 2022 onwards it is likely that all NPIs would be lifted and hence higher coverage would be required to sustain herd immunity). Figure 2B demonstrates the greater impact of an infection-blocking vaccine compared to one of equivalent efficacy but which only prevents severe disease. With an infection-blocking vaccine the projected deaths averted increases sharply with coverage until herd immunity is approached, at which point impact plateaus and eventually flattens. In contrast, for a vaccine that only provides direct protection against disease, there is a linear relationship between coverage and health impact (deaths averted per thousand population) and therefore the full benefit is not achieved until 100% of the population is covered. As expected, the additional value of indirect protection remains important for all potential vaccine efficacies and levels of coverage, as seen in the different slopes of the solid and dashed lines in Figure 2B. Similarly, the durability of the vaccine will affect overall impact (Figure S7) although it is likely that this could be overcome by a repeat vaccination schedule. DOI: https://doi.org/10.25561/82822 Page 7 of 21
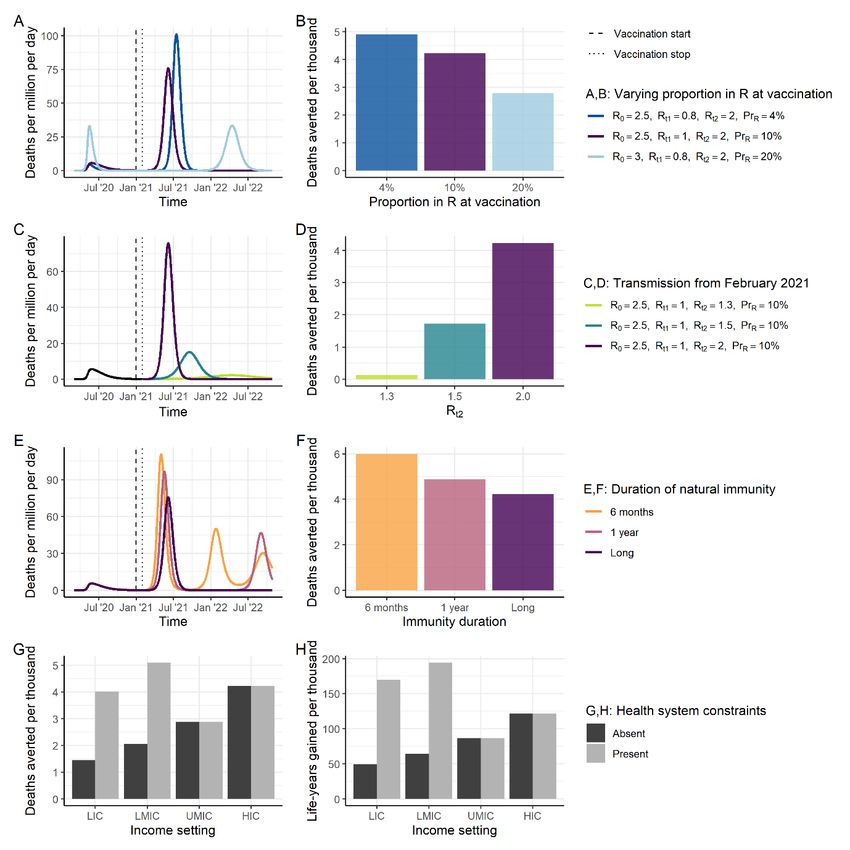
25 September 2020                                                  Imperial College COVID-19 response team

Figure 2: Vaccine Efficacy and Herd Immunity. (A) The relationship between vaccine efficacy and the theoretical
coverage required for herd immunity. The blue line shows the relationship for our baseline R0, the red line for
the expected level required given other behaviour shifts with R t2=2. The theoretical coverage assumes random
mixing of the population. (B) Projected total deaths averted per thousand population in 2021 under the default
assumptions shown in Table 1. The colours show different vaccine efficacy assumptions (from 50% to 100%).
Solid lines represent impact for an infection-blocking vaccine; dashed lines are for a vaccine that prevents severe
disease (and hence death) but does not reduce infection or onwards transmission. Impact is shown for a HIC
setting; additional plots for other income settings and health system constraint assumptions are in Figure S8.

The timing of vaccine introduction relative to the epidemic stage in each country will determine the
additional health benefit that the vaccine generates. The health impact of the vaccine depends on the
proportion of the population that have naturally-acquired immunity at the time of vaccine
introduction – with a clear decrease in public health impact with increasing pre-existing immunity in
the population under the assumption that ongoing NPIs in 2021 do not differ based on this metric
(Figure 3A–B). In addition, impact is greater in those countries in which other NPIs are not feasible i.e.
Rt2 is higher (Figure 3C–D). The future course of the epidemic will also be modified if the level of
protective immunity afforded by natural infection wanes over time (Figure 3E–F).

The public health value of vaccination will also depend on the risk profile of the population and
whether other therapeutic means are available to reduce morbidity and mortality. In the absence of
any health system constraints, the public health value of a vaccine is predicted to be greatest in HIC
since these countries have the largest elderly populations (Figure 3G–H). However, once health system
constraints are incorporated in the model in lower-income settings, the public health value of the
vaccine shifts such that its value is similar in LIC, LMIC and HIC settings. Furthermore, if the metric for
assessing public health value takes into account the age at death (i.e. life-years gained) we predict a
further shift in greater benefit to the lowest income settings (Figure 3H).

DOI: https://doi.org/10.25561/82822                                                                 Page 8 of 21
25 September 2020                                                   Imperial College COVID-19 response team

Figure 3: Epidemic Characteristics at Vaccine Introduction. (A) Three scenarios for the stage of the epidemic at
vaccine introduction. The dark blue line shows a scenario where transmission has previously been suppressed
and therefore the proportion immune at vaccine introduction is low (4%). The purple line shows our default
scenario in which the proportion immune at vaccine introduction is 10%. The light blue line shows a scenario in
which more widespread transmission occurred during 2020 and the proportion immune at vaccine introduction
is high (20%). (B) The projected impact of vaccination in terms of deaths averted per thousand individuals in
2021, for the scenarios in A. All other vaccine characteristics are set to the default assumptions. (C) Three
scenarios for the course of the epidemic from February 2021 onwards assuming the default scenario up until
this time of vaccine introduction. The green line shows a scenario with Rt2=1.3, turquoise Rt2=1.5 and purple
Rt2=2. (D) The impact of vaccination in terms of deaths averted per thousand individuals in 2021, for the
scenarios in C. All other vaccine characteristics are set to the default assumptions. (E) Three scenarios for the
course of the epidemic from 2020–2022, for three durations of natural immunity following infection. The orange
line shows average duration of 6 months, pink an average duration of 1 year and purple lifelong. (F) The
projected impact of vaccination in terms of deaths averted per thousand individuals in 2021, for the scenarios
in E. All other vaccine characteristics are set to the default assumptions. (G, H) Deaths averted (G) and life-years
gained (H) per thousand population in 2021 for each income setting, where health systems are either
unconstrained (dark grey) or constrained (light grey). Default vaccine parameters are in Table 1.

DOI: https://doi.org/10.25561/82822                                                                  Page 9 of 21
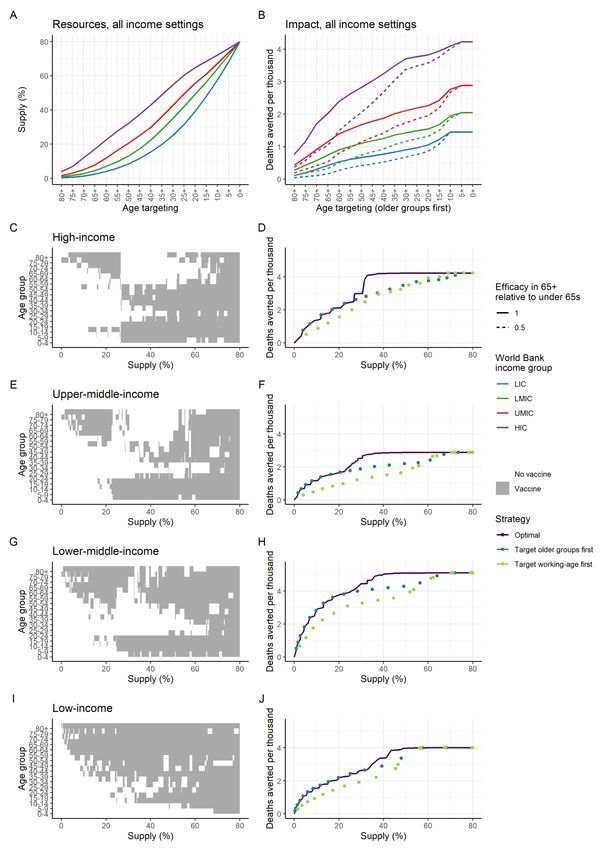
25 September 2020                                             Imperial College COVID-19 response team

These differences between settings suggest a benefit of within-country vaccination targeting those at
highest risk of death. Given the strong age-gradient in the estimated IFR for SARS-CoV-2 infection,
here we illustrate the value of targeting by age (noting that similar principles will apply to other
identified risk factors or vulnerable groups). Under a strategy in which the most vulnerable age groups
are targeted first, the resources (i.e. vaccine doses) required differs between income settings. This
reflects the different population age distributions, with relatively fewer doses required to fully cover
the highest risk elderly populations in lower-income settings compared with high-income countries
(Figure 4A). The predicted public health impact of such a strategy is also higher in high-income settings,
reflecting the overall higher IFR experienced in these countries in the absence of health system
constraints (Figure 4B). However, the impact of age-prioritisation is substantially lower if the vaccine
is less efficacious in the elderly population (Figure 4B, Figure S10, Table S4).

Figure 4C–J shows the most efficient allocation of the vaccine for each of the four country income
settings. In all settings, if doses are limited, the most efficient approach is to vaccinate the most
vulnerable elderly population, starting at the oldest age group and working downwards. In LIC, this
approach remains optimal throughout. However, in HIC, UMIC and LMIC we find that at a given
threshold for dose availability, the optimal allocation strategy jumps from this “direct protection of
the vulnerable” strategy to one of “herd impact” whereby the vaccine is allocated to younger
populations (including children and adults). Under such a scenario, transmission is reduced in the
wider community and this indirectly reduces the risk to the vulnerable elderly population to a greater
extent than is afforded by direct protection. Assuming that the targeted age groups are vaccinated at
80% coverage, this switch occurs when there are sufficient doses to cover between 20% and 40% of
the total population, although the precise value depends on both the demography of the population
(i.e. the relative size of the elderly population) and on the mixing patterns between the older
population and the general population. Furthermore, in the UMIC and LMIC settings we obtain a
“mixed” approach at these intermediate dose availability levels, with both the highest risk elderly and
younger populations included. This is due to greater mixing between the older and general
populations in these settings, as well as the size of the high-risk older populations, which are generally
smaller than in HIC and MIC. In all settings our optimisation includes the vaccination of children when
this switch occurs; however, our model does not explicitly capture a lower transmission risk of children
– if this is included, we find that they are de-prioritised (Supplementary Information, Figure S14).
Similarly, the most efficient strategy is sensitive to the assumed vaccine efficacy and vaccine
senescence in the elderly (Figures S9 and S10).

DOI: https://doi.org/10.25561/82822                                                        Page 10 of 21
25 September 2020                                                  Imperial College COVID-19 response team

Figure 4: Age-targeting of Vaccine Introduction. Panels A and B illustrate the impact of a scenario in which the
highest risk age groups are prioritised. (A) Resources required (as % of total population), and (B) impact in terms
of deaths averted per thousand population with and without senescence in the older population. Panels C–J

DOI: https://doi.org/10.25561/82822                                                                Page 11 of 21
25 September 2020                                                  Imperial College COVID-19 response team

illustrate the most efficient allocation under different supply constraints, where the supply is defined as the
proportion of the total population able to access two doses. Panels C, E, G and I show the age groups allocated
the vaccine under the optimal strategy for different levels of vaccine supply, where the grey shaded regions
indicate the age groups prioritised. Panels D, F, H and J show the total health impact expressed as deaths averted
per thousand population as a function vaccine supply. The optimal strategies from the left-hand panels are
shown in purple on the right-hand panels. The turquoise points show the strategy that prioritises the older at-
risk age: 80+ for the lowest coverage level, and sequentially including additional age groups (75–79, 70–74 and
so on) as additional doses are available. The green points show the strategy that prioritises the working age
population first (beginning with the 60–64 age group and sequentially adding younger groups), then vaccinates
the elderly and children as doses become available. Health system constraints in LIC and LMIC are assumed to
be present These allocations are generated using the default vaccine characteristics in Table 1, with 80%
coverage in the target age group vaccinated; additional scenarios are shown in Figures S9–S14.

At a global level, assuming an initial vaccine dose supply of 2 billion, allocating doses equitably across
all income settings relative to population size is the most efficient of the fixed approaches considered
(assuming that within a country the vaccine is targeted to the at-risk population) and is marginally
more efficient than allocating to countries based on their respective elderly (65+) population sizes. If
high-income countries are able to preferentially obtain a large proportion of the available vaccine
doses at the expense of lower income countries (and assuming health systems are constrained in low-
and lower-middle-income settings), then we would expect 1,100 additional deaths per million
population from this less efficient global allocation assuming that all countries have similar levels of
pre-existing natural immunity (Table 2). Consistent with our earlier results, the projected impact is
greater if, within each country, the highest risk older age groups are vaccinated at a high level of
coverage, allowing for 1,800 deaths averted per million, compared to 1,000 deaths averted per million
if all ages are vaccinated at a lower coverage level. Under a fully-optimised global allocation – in which
allocation both within- and between- countries is optimised – we estimate the most efficient strategy
can avert 1.9 deaths per 100 fully vaccinated persons, marginally higher than the equitable allocation
with prioritisation to older age groups scenario (1.6 deaths averted per 100 fully vaccinated persons),
and is projected to prevent 2,200 deaths per million people in 2021. Under this strategy, a higher
proportion of doses are allocated to HIC with sufficient coverage in most HICs to pursue a herd impact
strategy (Table 3). This is due primarily to the older populations in HIC compared to other settings but
is also dependent on the overall population sizes in each income band. In contrast, in the LIC, LMIC
and UMIC the proportional coverage under the optimal allocation scenario is lower and hence within
these countries the doses are targeted to the more vulnerable elderly population. This strategy is
however sensitive to assumptions about the vaccine mode of action, and assumptions about health
system constraints and the level of ongoing NPIs after the introduction of a vaccine (Figures S11–S13,
Figure S16). In particular, we find that the optimisation algorithm favours a more equitable
distribution for a vaccine that is disease-blocking only (Table 3), illustrating that the allocation for this
level of dose supply is balancing herd impact strategies in some countries with direct protection of the
vulnerable in others.

DOI: https://doi.org/10.25561/82822                                                               Page 12 of 21
25 September 2020                                             Imperial College COVID-19 response team

4. Discussion

An effective vaccine against SARS-CoV-2 will be of huge public health and economic value globally. As
the leading candidate vaccines progress through late-stage clinical trials, background preparation is
taking place to scale-up manufacturing capacity, supply chains and delivery systems. This preparation
should enable the first vaccines to be rapidly distributed in the coming year if demonstrated to be
both efficacious and safe. However, realistically it is unlikely that any candidate vaccine could be
manufactured and distributed in sufficient quantity in 2021 to enable all countries to vaccinate their
populations to achieve herd immunity. Furthermore, early vaccine candidates may show more limited
efficacy against infection, instead protecting only against more severe disease, and hence have limited
potential to generate herd immunity. Current COVAX plans favour a global allocation strategy that
prioritises the highest risk groups – including the elderly – and suggest an “equitable” vaccine
allocation strategy in which each country receives doses in proportion to their population size and
their epidemic status2,28. Our results support such a strategy being close to optimal in terms of
reducing the potential global mortality from SARS-CoV-2. However, within a country, if sufficient doses
are available, then we find that targeting the working age population could be more efficient in
reducing mortality. This would also have additional benefits – not captured here – in reducing
morbidity due to the longer-term consequences of infection that remain poorly understood, as well
as enabling faster economic recovery.

The majority of vaccine candidates under development focus on inducing antibody and T-cell
responses to the SARS-CoV-2 spike protein through approaches that include nucleic acid vaccines
(either DNA or RNA), recombinant protein vaccines, viral vector-based vaccines, live attenuated
vaccines and inactivated vaccines29. Encouraging results have been reported from Phase II human
trials, demonstrating that both viral vector-based vaccines and mRNA vaccines can produce SARS-CoV-
2 antibody and T-cell responses16–20. However, how these vaccine-induced immune responses
translate into protection remain uncertain. Until results from Phase III trials become available, it is not
possible to predict whether the vaccine candidates could protect against infection and/or reduce
disease severity, nor is it possible to predict the durability of this response. Furthermore, while
preferred product characteristics have been developed by the WHO as part of a wider research
prioritisation exercise13, quantitative estimates of how these preferred product characteristics
translate into public health impact are lacking.

For most vaccines against infectious diseases, one of the underlying goals is to vaccinate a sufficiently
high proportion of the population to achieve herd immunity. Our results demonstrate that such
indirect protection is important for SARS-CoV-2 despite the strong risk-profile with increasing age.
Indirect protection has a particularly important benefit for vulnerable groups – such as the
immunocompromised – who cannot be directly protected through vaccination. However, at a
population level the reduction in transmission that occurs also benefits those that receive the vaccine
but who for whatever reason do not achieve sterile protection. The coverage required to achieve herd
immunity will depend on both the underlying transmissibility of the virus (R0) and the efficacy of the
vaccine (the effective coverage). For our assumed R0 of 2.5, the theoretical coverage required is 60%
for a 100% efficacious vaccine. Thus, for a more realistic vaccine efficacy of 70%, population coverage
of 85% would be required. It is possible that heterogeneity in contact rates could reduce this
theoretical coverage30,31. Furthermore, in the presence of ongoing NPIs, the effective coverage

DOI: https://doi.org/10.25561/82822                                                         Page 13 of 21
25 September 2020                                              Imperial College COVID-19 response team

required to interrupt transmission (i.e. reduce Rt to less than 1) will be lower. Nevertheless, aiming for
high coverage will clearly be important given the uncertainty in the precise value of this threshold.

One of the challenges with quantifying the public health value of a SARS-CoV-2 vaccine is determining
the appropriate “counterfactual” scenario against which its value can be assessed. Here we chose to
generate some simplified scenarios that illustrate three factors determined by the epidemic to date
that influence this quantification: the proportion of the population with naturally-acquired immunity,
the likely forward trajectory of the epidemic in the absence of a vaccine, and the durability of both
naturally-acquired and vaccine-induced immunity. The interaction between these is predicted to
generate complex immune landscapes32. The durability of vaccine-induced immunity is perhaps best
addressed through repeat vaccination; however, it is important to note that such data will only
become available after several months, and possibly years, of follow-up of trial participants. Similarly,
pre-existing naturally acquired immunity is unlikely to be a barrier to immunisation provided there are
no vaccine-associated risks from antibody-dependent enhancement33. Thus, the value of vaccination
is probably best quantified by understanding the degree to which it enables NPIs to be lifted. Given
broader economic and societal costs of NPIs, combined epidemiological-economic models are
required to address this.

While several risk groups for more severe outcomes have been identified – including Black and Asian
ethnic groups, obesity, and other chronic and infectious diseases – age remains one of the strongest
determinants of increased risk of mortality34. Our results demonstrate that targeting limited vaccine
supply to older age groups is likely to be the most efficient way from a public health perspective to
reduce mortality if the doses available are insufficient to adopt a herd impact approach. Such an
approach also has the advantage that delivery systems are in place in many (though not all) settings
to access such groups. However, it is likely that immune responses will be weaker in older individuals
and this effect is unlikely to be fully characterised in the early Phase III studies which are not
statistically powered to estimate any decline in efficacy with age. Thus, it is not likely to be possible to
estimate the efficiency of such a strategy prior to early delivery in 2021.

One of the most difficult challenges facing decision-makers in 2021 will be the allocation of a limited
dose supply. At the global level, under our baseline assumptions, the strategy that maximises the total
deaths averted is one in which the available vaccine doses are allocated preferentially to higher-
income countries who have the highest at-risk elderly populations. However, the optimality of this
allocation is sensitive to many assumptions and will vary depending both on the vaccine characteristics
and the stage of the epidemic in each country at vaccine introduction. Given this uncertainty,
allocating vaccine doses according to population size appears to be the next most efficient approach.
The most efficient strategy for individual countries will be to prioritise vaccination of the elderly and
other high-risk groups if doses are only available for less than approximately 20% of the population.
However, from the individual country perspective, the optimal strategy is to obtain sufficient doses to
achieve herd immunity and in doing so, to prioritise vaccination of the working age population. This
finding is consistent with other modelling studies of vaccine allocation within a single country35–38.
Such a strategy would also favour economic and social recovery. This creates a tension between the
global and national public good which will be particularly acute for those countries that are able to
secure early supply, either through having national vaccine research and manufacturing capability, or
through having the economic capability and political capital to secure access to vaccines being
manufactured elsewhere.

DOI: https://doi.org/10.25561/82822                                                          Page 14 of 21
25 September 2020                                             Imperial College COVID-19 response team

As with any modelling study, there are several limitations to our approach. Perhaps most importantly,
none of the current vaccine candidates have yet demonstrated efficacy against SARS-CoV-2 infection
or disease and so our assumptions regarding efficacy and durability are informed by target product
profiles rather than data. The number of doses and the timing of their availability are also uncertain;
for this reason, we have illustrated simplified scenarios in which vaccination occurs over a short time
period for a range of epidemic stages. In practice, each country will have experienced a different
epidemic when the first vaccine is introduced and will scale-up coverage over a period of months. The
value of vaccination to individual countries, as well as the optimal allocation strategies, will therefore
need to be considered in more detail at that time. While models can be helpful in supporting country-
level introductions, there are also many other factors that will be important to take into consideration
– including supply chains, logistics, access to populations, costs and budgets and other competing
health priorities. Thirdly, the model used here is relatively simple in structure and focuses only on the
health benefits of vaccination. It will also be important to consider other therapeutic interventions, as
well as the capacity of countries to suppress transmission using NPIs, and to better capture specific
risk groups as appropriate to individual countries. Furthermore, as alluded to above, the direct health
outcome is only one dimension; it will be important in the near-term to capture the impact of
vaccination on non-COVID-19 health as well as to integrate epidemiological and economic models to
evaluate the impact of different vaccine allocation strategies on the economic outputs of countries
and the livelihoods of their citizens.

Research and development of a SARS-CoV-2 vaccine has taken place at unprecedented speed such
that it is likely that efficacy and safety data will be available for one or more of the leading vaccine
candidates within one year of the pandemic being declared. Our results demonstrate that the global
public health value of the vaccine can be maximised by ensuring equitable access. Acting collectively
in this way during the early stages of vaccine deployment remains the ethical approach to take, even
if this is not the most beneficial short-term strategy from a national perspective.

5. Acknowledgements

We acknowledge support from the MRC Centre for Global Infectious Disease Analysis
(MR/R015600/1), jointly funded by the UK Medical Research Council (MRC) and the UK Foreign,
Commonwealth and Development Office under the MRC/FCDO Concordat agreement, from Abdul
Latif Jameel Foundation via the J-IDEA institute, and from the National Institute of Health Research via
Health Protection Research Unit funding. PW and AH acknowledge fellowship funding from Imperial
College London. PGTW, ACG and NMF acknowledge grant funding from The Wellcome Trust.

Imperial College COVID-19 Response Team
Kylie Ainslie, Samir Bhatt, Adhiratha Boonyasiri, Olivia Boyd, Nicholas Brazeau, Lorenzo Cattarino,
Giovanni Charles, Laura V Cooper, Helen Coupland, Zulma Cucunuba, Gina Cuomo-Dannenburg, Christl
A Donnelly, Ilaria Dorigatti, Oliver D Eales, Sabine van Elsland, Fabricia Ferreira Do Nascimento, Richard
FitzJohn, Seth Flaxman, Will Green, Timothy Hallett, Arran Hamlet, Wes Hinsley, Natsuko Imai, Elita
Jauneikaite, Ben Jeffrey, Edward Knock, Daniel Laydon, John Lees, Thomas Mellan, Swapnil Mishra,
Gemma Nedjati-Gilani, Pierre Nouvellet, Alison Ower, Kris V Parag, Manon Ragonnet-Cronin, Igor
Siveroni, Janetta Skarp, Hayley A Thompson, H. Juliette T. Unwin, Robert Verity, Michaela Vollmer,
Erik Volz, Caroline Walters, Haowei Wang, Yuanrong Wang, Lilith K Whittles, Xiaoyue Xi

DOI: https://doi.org/10.25561/82822                                                        Page 15 of 21
25 September 2020                                             Imperial College COVID-19 response team

6. References
1      New York Times. Coronavirus Vaccine Tracker. 2020.
       https://www.nytimes.com/interactive/2020/science/coronavirus-vaccine-tracker.html
       (accessed Aug 4, 2020).

2      GAVI. COVAX: Ensuring global equitable access to COVID-19 vaccines.
       https://www.gavi.org/covid19/covax-facility (accessed Aug 4, 2020).

3      BBC. Coronavirus: US buys nearly all of Gilead’s Covid-19 drug remedesivir. 2020.
       https://www.bbc.co.uk/news/world-us-canada-53254487 (accessed Aug 5, 2020).

4      Stone J. Government says medicines must be stock-piled for no-deal Brexit on top of Covid-19
       pressures. Indep. 2020. https://www.independent.co.uk/news/uk/politics/coronavirus-no-
       deal-brexit-government-medicine-stockpiling-a9651991.html (accessed Sept 17, 2020).

5      Persad G, Wertheimer A, Emanuel E. Principles for allocation of scarce medical interventions.
       Lancet 2009; 737: 423–31.

6      Emanuel EJ, Persad G, Upshur R, et al. Fair allocation of scarce medical resources in the time
       of covid-19. N Engl J Med 2020; 382: 2049–55.

7      Verity R, Okell LC, Dorigatti I, et al. Estimates of the severity of coronavirus disease 2019: a
       model-based analysis. Lancet Infect Dis 2020; 20: 669–77.

8      World Health Organization. A global framework to ensure equitable and fair allocation of
       COVID-19 products. WHO Member States briefing - 18 June 2020. 2020.

9      Walker PGT, Whittaker C, Watson OJ, et al. The impact of COVID-19 and strategies for
       mitigation and suppression in low- and middle-income countries. Science (80- ) 2020; 422:
       eabc0035.

10     The World Bank. DataBank World Development Indicators. 2020.
       https://databank.worldbank.org/ (accessed Sept 1, 2020).

11     Smith TRF, Patel A, Ramos S, et al. Immunogenicity of a DNA vaccine candidate for COVID-19.
       Nat Commun 2020; 11: 1–13.

12     Salje H, Kiem CT, Lefrancq N, et al. Estimating the burden of SARS-CoV-2 in France. Science
       (80- ) 2020; 369: 208–11.

13     World Health Organization. WHO Target Product Profiles for COVID-19 Vaccines. Version 3.
       Geneva, 2020 https://www.who.int/publications/m/item/who-target-product-profiles-for-
       covid-19-vaccines.

14     Haq K, McElhaney JE. Immunosenescence: Influenza vaccination and the elderly. Curr Opin
       Immunol 2014; 29: 38–42.

15     Arinaminpathy N, Kim IK, Gargiullo P, et al. Estimating Direct and Indirect Protective Effect of
       Influenza Vaccination in the United States. Am J Epidemiol 2017; 186: 92–100.

16     L.A. Jackson, E.J. Anderson, N.G. Rouphael, P.C. Roberts, M. Makhene, R.N. Coler, M.P.

DOI: https://doi.org/10.25561/82822                                                         Page 16 of 21
25 September 2020 Imperial College COVID-19 response team
McCullough, J.D. Chappell, M.R. Denison, L.J. Stevens, A.J. Pruijssers, A. McDermott, B. Flach,
N.A. Doria-Rose KSC, K.M. Morabito, S. O’Dell, S.D. Schmidt, P.A. Swanson II, M. Padilla, J.R.
Mascola, K.M. Neuzil, H. Bennett, W. Sun, E. Peters, M. Makowski, J. Albert KC, W. Buchanan,
R. Pikaart-Tautges, J.E. Ledgerwood, B.S. Graham, and J.H. Beigel for the mRNA-1273 SG. An
mRNA Vaccine against SARS-CoV-2 — Preliminary Report. N Engl J Med 2020.
DOI:10.1056/NEJMoa2022483.
17 Folegatti PM, Ewer KJ, Aley PK, et al. Articles Safety and immunogenicity of the ChAdOx1
nCoV-19 vaccine against SARS-CoV-2 : a preliminary report of a phase 1 / 2 , single-blind ,
randomised controlled trial. Lancet 2020; : 1–13.
18 Zhu FC, Li YH, Guan XH, et al. Safety, tolerability, and immunogenicity of a recombinant
adenovirus type-5 vectored COVID-19 vaccine: a dose-escalation, open-label, non-
randomised, first-in-human trial. Lancet 2020; 395: 1845–54.
19 Mulligan MJ, Lyke KE, Kitchin N, et al. Phase 1/2 study to describe the safety and
immunogenicity of a COVID-19 RNA vaccine candidate (BNT162b1) in adults 18 to 55 years of
age: interim report. medRxiv 2020; : 1–16.
20 Sahin U, Muik A, Derhovanessian E, et al. Concurrent human antibody and TH1 type T-cell
responses elicited by a COVID-19 RNA vaccine. medRxiv 2020; : 2020.07.17.20140533.
21 Ministerio de Ciencia e Innovaciaon Gobierno de Espana, Ministerio de Sanidad Gobierno de
Espana, Consejo Interterritorial, Instituto de Salud Carlos III. Estudio Nacional de Sero-
Epidemiolgia de la Infeccion por SARS-CoV-2 en Espana: Informe Final. 2020
https://www.mscbs.gob.es/ciudadanos/ene-covid/.
22 To KKW, Hung IF, Ip JD, et al. COVID-19 re-infection by a phylogenetically distinct SARS-
coronavirus-2 strain confirmed by whole genome sequencing. Clin Infect Dis 2020; : ciaa1275.
23 Arora R, Yan T, Bobrovitz N, et al. SeroTracker. 2020. https://serotracker.com/ (accessed Sept
16, 2020).
24 Okell LC, Verity R, Watson OJ, et al. Have deaths from COVID-19 in Europe plateaued due to
herd immunity? Lancet 2020; 395: e110–1.
25 Gavi. 92 low- and middle-income economies eligible to get access to COVID-19 vaccines
through Gavi COVAX AMC. 2020. https://www.gavi.org/news/media-room/92-low-middle-
income-economies-eligible-access-covid-19-vaccines-gavi-covax-amc (accessed Sept 17,
2020).
26 Amanat F, Krammer F. SARS-CoV-2 Vaccines: Status Report. Immunity 2020; 52: 583–9.
27 Britton T, Ball F, Trapman P. A mathematical model reveals the influence of population
heterogeneity on herd immunity to SARS-CoV-2. Science (80- ) 2020; 369: 846–9.
28 Fontanet A, Cauchemez S. COVID-19 herd immunity: where are we? Nat Rev Immunol 2020.
DOI:10.1038/s41577-020-00451-5.
29 Saad-Roy CM, Wagner CE, Baker RE, et al. Immune life history, vaccination, and the dynamics
of SARS-CoV-2 over the next 5 years. Science (80- ) 2020. DOI:10.1126/science.abd7343.
DOI: https://doi.org/10.25561/82822 Page 17 of 2125 September 2020 Imperial College COVID-19 response team
30 Jeyanathan M, Afkhami S, Smaill F, Miller MS, Lichty BD, Xing Z. Immunological considerations
for COVID-19 vaccine strategies. Nat Rev Immunol 2020. DOI:10.1038/s41577-020-00434-6.
31 Docherty AB, Harrison EM, Green CA, et al. Features of 20 133 UK patients in hospital with
covid-19 using the ISARIC WHO Clinical Characterisation Protocol: Prospective observational
cohort study. BMJ 2020; 369: 1–12.
32 Matrajt L, Eaton J, Leung T, Brown ER. Vaccine optimization for COVID-19, who to vaccinate
first? medRxiv Prepr Serv Heal Sci 2020. DOI:10.1101/2020.08.14.20175257.
33 Babus A, Das S, Lee S. The Optimal Allocation of Covid-19 Vaccines. 2020; : 1–27.
34 Bubar KM, Kissler SM, Lipsitch M, Cobey S, Grad YH, Larremore DB. Model-informed COVID-
19 vaccine prioritization strategies by age and serostatus. medRxiv 2020; :
2020.09.08.20190629.
35 Chen X, Li M, Simchi-Levi D, Zhao T. Allocation of COVID-19 Vaccines Under Limited Supply.
medRxiv 2020; : 2020.08.23.20179820.
DOI: https://doi.org/10.25561/82822 Page 18 of 2125 September 2020 Imperial College COVID-19 response team
7. Tables
Table 1: Summary of Scenarios Explored. The values in bold represent the default parameters, unless otherwise
stated.
Parameter Values
Income setting High-income (HIC); Upper-middle income (UMIC); Lower-
middle income (LMIC); Low-income (LIC)
Transmission from March 2020 - April 2020 (R0) 2.5; 2.0; 3.0
Transmission from May 2020 - January 2021 (Rt1) 1; 0.6; 0.8
Transmission from February 2021 onwards (Rt2) 2.0; 1.5; 1.3
Vaccine mode of action Infection-blocking; Disease-blocking
Vaccine efficacy 70%; 50%
Reduction in efficacy in individuals 65 years and older due to 0%; 50%
immunosenescence
Vaccine coverage 80%; 0%–100%
Vaccine duration of protection (half-life) Lifelong; 1 year; 6 months
Duration of naturally acquired immunity Lifelong; 1 year; 6 months
Age targeting All ages targeted; Older; Younger; combinations of 5-year
groups
Duration between vaccination and vaccine protection 14 days
Health system constraints Present; Absent
Health system constraint assumptions Health system constraints present
(LIC: Capacity limited + negative health outcomes due to
poorer standard of care
LMIC: Capacity limited
UMIC & HIC: Capacity unlimited as surge capacity is put in
place);
Health system constraints absent (Capacity unlimited in all
settings)
Vaccine dose supply constraint 2 billion doses in 2021 (COVAX); 2 billion doses in 2021 + direct
country procurement (1.15 billion doses by HICs, 1.10 billion
doses by MICs)
Dose schedule 2 doses; 1 dose
Vaccine buffer stock and wastage allowance 15%
DOI: https://doi.org/10.25561/82822 Page 19 of 2125 September 2020 Imperial College COVID-19 response team
Table 2: Global Allocation of Vaccine Doses for both Non-Optimised and Optimised Scenarios. The global
vaccine supply was assumed to be constrained to 2 billion doses, with a two-dose schedule and 15% buffer and
wastage (resulting in 0.85 billion vaccine courses available). FVP: fully vaccinated persons.
Deaths Deaths Total deaths
Target Total deaths
Income averted averted averted per
Allocation strategy age averted per 100
setting per per 100 million global
group FVP
million FVP population
Income groups HIC all 870 0.783
receive doses in UMIC all 545 0.490
981 0.883
proportion to LMIC all 1556 1.400
population
LIC all 537 0.483
HIC 65+ 1398 1.256
UMIC 65+ 1155 1.475
Income groups
LMIC 65+ 1813 3.991
receive doses in
proportion to LIC 65+ 810 3.266
1814 1.632
population, targeted HIC 15-64 0 0
first to 65+, then 15- 125 0.382
UMIC 15-64
64 age groups
LMIC 15-64 823 1.255
LIC 15-64 449 0.520
HIC 65+ 2024 1.186
Income groups UMIC 65+ 1155 1.475
receive doses in LMIC 65+ 1813 3.991
Allocated to
proportion to 810 3.266
all countries LIC 65+
population in 65+ age 1761 1.585
at varying HIC 15-64 555 0.699
group, targeted first
coverage UMIC 15-64 140 0.382
to 65+, then 15-64
age groups LMIC 15-64 269 1.268
LIC 15-64 58 0.502
HIC all 4231 0.603
Allocated first to high- UMIC all 0 0
671 0.603
income countries LMIC all 0 0
LIC all 0 0
Allocated first to low- HIC all 0 0
income and lower- UMIC all 0 0
1269 1.141
middle-income LMIC all 3049 1.284
countries LIC all 1229 0.517
Receive doses in HIC all 4146 0.806
proportion to UMIC all 946 0.492
population, plus 1.15 2053 0.869
LMIC all 2613 1.360
b doses to HIC and
LIC all 537 0.483
1.1 b doses to MIC
HIC optimised 2665 1.306
Optimised Allocation algorithm
allocation selects countries and UMIC optimised 904 1.772
using age groups within LMIC optimised 3444 2.214 2204 1.882
heuristic targets to optimise
method deaths averted LIC optimised 1520 1.720
DOI: https://doi.org/10.25561/82822 Page 20 of 21You can also read


