It is not just about the Melody: How Europe Votes for its Favorite Songs
←
→
Page content transcription
If your browser does not render page correctly, please read the page content below
It is not just about the Melody: How Europe Votes for its Favorite Songs

                                                                                        Anej Svete, anej.svete@protonmail.com
                                                                                        Jakob Hostnik, jh9934@student.uni-lj.si
                                                                        University of Ljubljana, Faculty of Computer and Information Science,
                                                                                        Večna pot 113, 1000 Ljubljana, Slovenia

                                                                                                         February 18, 2020

                                         Abstract                                                                         ilarity (Dekker [3]), ethnic structure (Spierdijk and Vellekoop [20]),
                                                                                                                          common history, political preference and cultural similarity (Ginsburgh
arXiv:2002.06609v1 [cs.SI] 16 Feb 2020

                                         The Eurovision Song Contest is a popular annual international song               and Noury [10]). We try to extract as much information on the de-
                                         competition organized by the European Broadcasting Union. The win-               ciding factors as possible from the network structure and the nation’s
                                         ner is decided by the audience and expert juries from each participating         attributes to pinpoint the most important influences and to leverage
                                         nation, which is why the analysis of its voting network offers a great           that information to infer future voting choices. As discussed in Sec-
                                         insight into what factors, besides the quality of the performances, in-          tion 2, we have not found any previous work that tried to use the
                                         fluence the voting decisions.                                                    network information for future predictions. It it a challenging task,
                                            In this paper, we present the findings of the analysis of the voting          partly because of the challenge of obtaining enough quality data and
                                         network, together with the results of a predictive model based on the            partly because of the changing format of the competition. We take
                                         collected data. We touch upon the methodology used and describe the              these historical differences into account during the analysis. However,
                                         dataset we carry the analysis on. The results include some general               since one of our main goals is making future predictions, the most re-
                                         features of the voting networks, the exposed communities of countries            cent results are the most important, and these are enough to expose
                                         that award significantly more points among themselves than would be              some main trends.
                                         expected and some predictions on what the biggest factors that lead to              Besides making predictions, we are also interested in how different
                                         this phenomenon are. We also include the model to predict the votes              similarities between nations correlate to their voting patterns. Just
                                         based on network structure of both previous votes and song preferences           by paying some attention to points distribution, it can be seen that
                                         of nations, which we found not to offer much improved predictions than           there is some correlation between the points awarded and geographic
                                         relying on the betting tables alone.                                             proximity. We try to leverage the network features (e.g. the strength
                                                                                                                          of bias shown throughout the years and the community structure this
                                                                                                                          implies) to extract useful information more precisely and then reason
                                         1    Introduction
                                                                                                                          about the biggest deciding factors on the voting. To achieve that, we
                                         The Eurovision Song Contest (ESC) has been held every year since                 perform community detection on the network of shown bias to infer
                                         1956. Its initial purpose was to unite the European nations after the            the influences.
                                         Second World War and has since evolved into an annual entertainment                 There have also been some suggestions that building these friend-
                                         spectacle followed by millions of people. Every rendition of the con-            ships allows the participants to achieve better scores and rank higher in
                                         test except for the first featured one song entry by each participating          the competition. One part of the paper thus also focuses on finding out
                                         country. The countries involved are mostly European, with the recent             if this is really the case by finding a correlation between the community
                                         addition of some nations from outside the continent, e.g. Israel and             structure of specific nations and their success in the competition.
                                         Australia.                                                                          To prevent too much biased voting, some measures have already
                                            Although some rules have changed throughout the years, the main               been taken by the ESC committee. For example, they try to minimize
                                         principles of the competition remain the same. Each participating na-            the number of neighboring countries competing in the same semi-final
                                         tion awards some number of points to the performances chosen by the              and since only the countries performing that night can vote, neigh-
                                         public and jury of that country. Countries can not give points to them-          boring countries have less of a chance to help each other get into the
                                         selves. The song with the highest number of points wins. The current             final (European Broadcasting Union, Eurovision Song Contest). This
                                         system is in place since 2004 and consists of two semi-finals and a final.       measure can of course not be taken in the final.
                                         Each country gets the same number of points to distribute, and they                One thing that we also take a look into is the notion of neglect be-
                                         are equally split between the jury and televoting votes. Both are con-           tween countries. By this we mean the behavior when countries which
                                         verted on a scale of points ranging from 1 to 12, with the exception of          are somehow linked to one another seldom award each other a signifi-
                                         9 and 11 points, which are not awarded. This means that every coun-              cant number of points. In other words, neighbors that do not exchange
                                         try awards points to 10 performances (European Broadcasting Union,               points could be regarded as neglecting each other.
                                         Eurovision Song Contest).                                                          When the major influences on the voting behavior are exposed, we
                                           The nature of voting offers a intriguing opportunity to explore what           turn our attention to the actual predictor of future voting behavior and
                                         European countries base their voting decisions on. Some of the com-              use the information about the communities in the second part of the
                                         monly attributed factors include geographical proximity, language sim-           project together with some additional data that we learn through song

                                                                                                                      1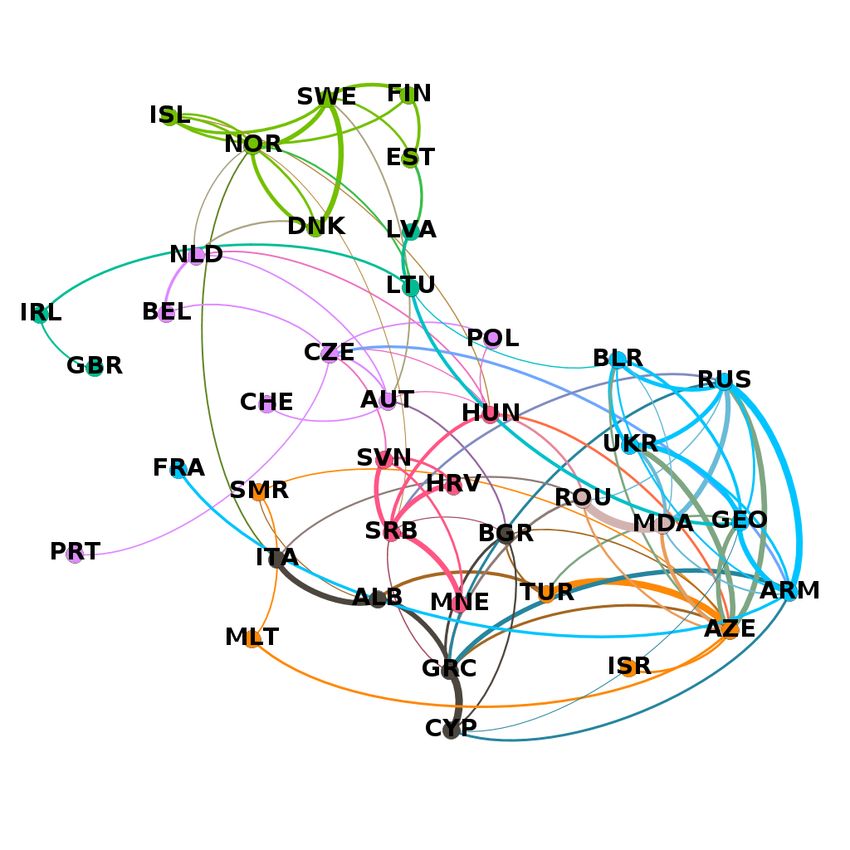
and artist features to try to infer the number of points countries will             They find significant patterns of both preference and neglect span-
award in future competitions. The model is used together with betting            ning throughout the participating nations, showing that voting is geo-
predictions since they are considered to be the best existing way to             graphically influenced, linking it to mutual history, similar ethnic fea-
predict the outcome of the competition. As described in Section 4, we            tures and the feeling of “brotherhood” of neighboring countries. They
gathered data from various sources in hope of making some confident              also conclude that the participants with higher number of colluding
predictions.                                                                     edges achieve better success in the competition, showing it does pay
  The rest of the paper is structured as follows. We review some of the          off to build partnerships. This, together with the changing nature of
previous work on the topic, ranging from specific analysis of the ESC            the network that is more and more concentrated around the colluding
voting network to the more general methods of examining the data.                edges, implies that nations are actively trying to build these relation-
Then we present the dataset we worked with and how it was obtained.              ships.
We also present some of its main characteristics. Then we describe                  Dekker [3] provides a different take on the analysis of the voting
in more detail the methodology used. Since some of the needed data               network. The techniques the authors demonstrate have a more gen-
turned out to be very difficult to get hold of, some compromises had             eral applicability, spanning away from the ESC, and can also be used
to be made and these are discussed as well. In the last part we present          for analyzing other types of friendship networks. They focus on the
the results of the project and we end by brainstorming some future               votes from the 2005 rendition of the contest and come up with ways
work ideas and concluding the paper in a summary.                                to adjust votes for song quality. With that, they produce a friendship
                                                                                 network with valued links (the value of the link being the strength
2    Related work                                                                of the friendship). They find that friendships are often not returned,
                                                                                 which reveals their asymmetric nature, especially visible in countries
Since we mainly deal with analysis of the ESC voting network, we                 with a large number of immigrants.
discuss some previous papers covering the topic in terms of apply-
                                                                                    They run a more statistical analysis by removing the influence of
ing network techniques on the problem, introducing some ideas and
                                                                                 song quality or popularity and it shows that friendship between coun-
techniques that will prove useful for our project. Although they all
                                                                                 tries is determined in a big part by geographical proximity. Another
deal with the competition as a network problem to some extent, none
                                                                                 factor they find are large immigrant groups voting for their home coun-
of them use more advanced network analysis tools such as community
                                                                                 try. Other factors, such as population size, language similarity and
detection and link prediction on the graphs, which we implement. Both
                                                                                 economy were found to be insignificant. They expose a visible five-
these methods can then be used for future projections, which is also
                                                                                 bloc structure, the blocs being the Eastern (former USSR countries,
not dealt with in any of the papers.
                                                                                 together with Romania, Hungary and Poland), Nordic (Norway, Swe-
   Mantzaris, Rein, and Hopkins [14] investigate different possible ex-          den, Denmark, Finland and Iceland), Balkan (former Yugoslavia and
planations for the voting patterns which deviate significantly from a            Albania), Eastern Mediterranean (Greece, Cyprus, Malta, Bulgaria
uniform distribution, specifically focusing on the notion that nations           and Turkey) and Western (Portugal, Spain, Ireland, Andorra, Israel,
try to build reciprocal voting connections that lead to them receiving           the UK, France, Monaco, Germany, Belgium and the Netherlands).
more points from their “partners”, and thus ranking higher. There-               Preferences among the different blocs are also analyzed, finding that
fore, they try to find correlation between the number of collusive edges         some blocs are more connected than others. Grouping countries com-
a nation has and their success in the competition. They build on                 putationally by exposing the strongly connected components, they find
previous work in (Mantzaris, Rein, and Hopkins [13] and Gatherer                 three different blocs. Using taxonomic trees proved to be ineffective
[9]), analyzing the voting behavior by simulation voting, since analyt-          and only finding one bloc.
ical identification of statistically significant trends in the competition
would be mathematically too complex because of its changing nature.                 Ginsburgh and Noury [10] analyze 29 years of the Eurovison Song
Capturing the different voting systems in place throughout the years             Contest, specifically the competitions held between 1975 and 2003.
mathematically is untraceable, therefore simulation provides a good              Its main goal is to find any correlations between the points awarded
compromise.                                                                      and country similarity, performance type, etc. The authors find some
                                                                                 meaningful properties impacting the scores and extract some clusters
   The authors extend the algorithm presented in (Gatherer [9]) for
                                                                                 that exchange votes regularly. They propose what could lead to this
finding significant exchange of points awarded between participants.
                                                                                 behavior, stating that there exist cliques of countries that award points
The original paper focused on a limited interval of competitions when
                                                                                 among themselves and even trading with votes. But these blocs are
the voting rules were mostly homogeneous, therefore Mantzaris et al.
                                                                                 found not to base on politics, but rather on language and cultural
provide a more general sampling technique. To be able to do that, they
                                                                                 similarities. To measure the language impact, they rely on the Morris-
identify the three principles of voting used by ECS since its start in
                                                                                 Swadesh method for analyzing linguistic differences.
1956. These can be grouped as allocated, sequential and rated. The al-
gorithm samples the uniform distribution of points throughout a time               To infer the influence of each factor, Ginsburgh et al. formulate a
period, based on the rules in place at the time and then extracts the            weighted expression, for which weights are assigned based on the voting
highest-weighted edges. Network is formed based on those colluding               behavior. The major takeaway of it is that the biggest factor influenc-
edges between countries, showing patterns of biased voting. They then            ing the voting decision is still the music quality. As with the previously
perform community detection on obtained structures and base their re-            discussed work, they also notice an important role of immigrants that
sults on those. They consider both one-way and two-way relationships             vote for their country of origin. These observations are, however, not
and thus lay groundwork for thorough network inspection in terms of              algorithmic but rather the results of looking at the formed communities
both motif and community detection.                                              and discussing the prevailing similarities in them.

                                                                             2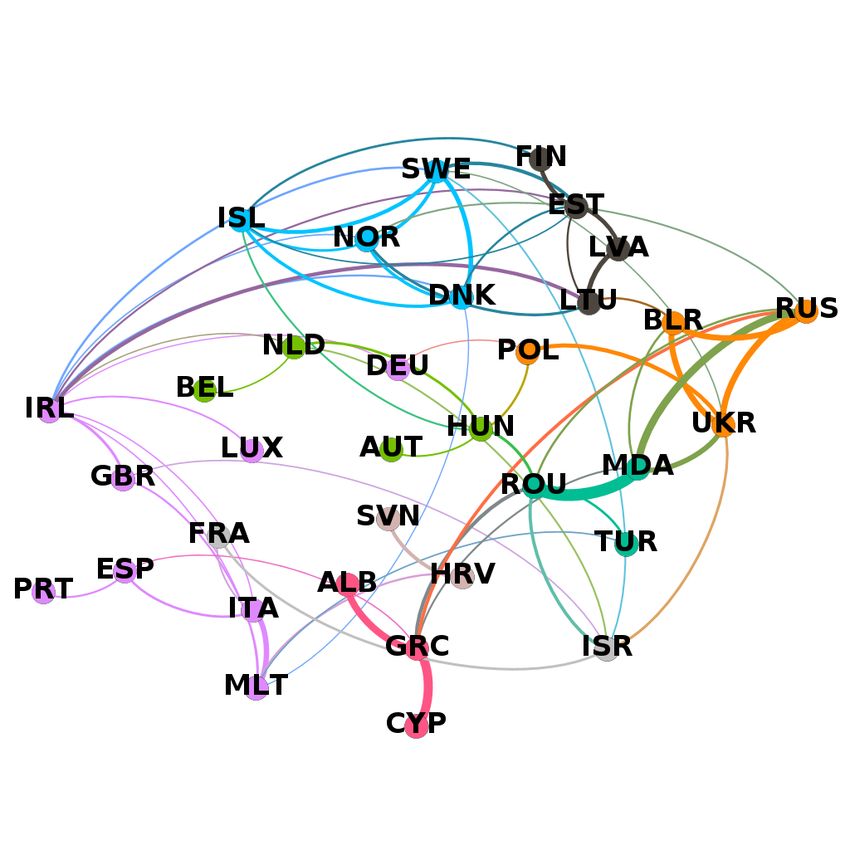
3     Methods                                                                    it also struggles on the directed networks, adding insignificant edges.
                                                                                 This is why we also post-process the directed graphs and remove the
3.1    Bias detection                                                            edges whose weights were below the average in the network, giving us
                                                                                 much more readable results.
In the first major goal of the paper is determining the community
structure of the voting networks. The most important step is the
formation of edges that reflect a consistent bias between nations (both          3.2    Basic graph features
in terms of positive and negative relationships) and we approach that            In order to get the general oversight over the voting networks, we
in two ways, described in this section. Both methods are used to                 calculate some basic statistics about the voting and bias networks, such
detect bias over all the selected time periods. Altogether, this gives           as the average number of nodes in a certain time period, the average
us more than 4400 different networks which are later used to present             number of edges and the average degree. All the methods are already
some statistical facts about the distribution of points.                         implemented in the networkx library (Hagberg, Swart, and Chult [11]).
   Firstly, we follow the methodology described in (Mantzaris, Rein,
and Hopkins [13, 14] and Gatherer [9]) and used the Gatherer algo-               3.3    Community detection
rithm. This turned out to be the most effective method and very
important for our analysis, thus, we describe the pseudo code in Al-             After extracting the biased voting trends, we extract the communities
gorithm 1 and Algorithm 2. Its main idea is to estimate the number               using the Louvain (Blondel et al. [2]) community detection algorithm
of points that a participant is expected to receive in a certain time            in the undirected and the Newman’s leading eigenvector method (New-
period, based on the rules in place at that time. It then uses these             man [17]) in the directed ones. Both are implemented in the CDLib
estimates to find bias, i.e. behavior where nations exchange more than           library (Rossetti, Milli, and Cazabet [19]). The extracted communities
the expected number of points in a time period.                                  in the undirected network depict blocs of countries “collaborating” in
   The other method of obtaining the structure was developed by us               the competition. The directed networks are analyzed somewhat dif-
and it accounts for the number of points a country has received each             ferently, since the actual communities do not play such a vital role
year in the selected period. We create a directed edge from country              here, as there is no mutual point exchange. However, they still expose
1 to country 2 if the first one awarded the second one more than the             some interesting behavior that would be missed if we only focused on
average number of points received by the second one in more than 75 %            the undirected networks. The results of both types are presented in
of the competitions in that period. If the bias is shown both ways, we           Section 5.
add the edge to the undirected network. The pseudo code is described               The number of extracted graphs also allows us to find the most
in Algorithm 3.                                                                  commonly co-occurring nations in communities. Those were extracted
  We have generally found that the simulated voting implemented                  with the apriori algorithm, implemented in MLxtend library (Raschka
by the Gatherer algorithm gives clearer and less noisy results. It               [18]).
proves much more useful for detecting neglect, since the average points            The plots seen in the Appendix B were generated with the Gephi
method generates too much noise. Even the graphs generated by the                visualization tool (Bastian, Heymann, and Jacomy [1]).
Gatherer algorithm were tricky to work with, which is why we added
an additional criteria to detect a neglect between 2 countries. Since            3.4    Correlation between the community structure
geographic proximity proved to be very important, we also demand                        and success in the competition
that two neglecting countries lie no more than 3 hops (borders) away
                                                                                 One of the main goals of bias edge construction and community de-
on the map thus reducing the amount of random edges.
                                                                                 tection was determining the affect the bias behavior has on the final
   Since the Gatherer algorithm is also used in (Mantzaris, Rein, and
                                                                                 score of participants. In other words, we wanted to find out whether
Hopkins [13, 14] and Gatherer [9]), it is well tested and reliable. There-
                                                                                 being in a large community or having many friends in the network pays
fore, we focus mainly on its results for graph formation from here on.
                                                                                 off. Thus, based on the communities a node (country) belongs to, we
Although we were able to extract some valuable information with the
                                                                                 gather some voting data (points, points from community, percentage
second method and it performed very similarly to the Gatherer algo-
                                                                                 of points from community and final place) and aggregate it for each
rithm for the longer periods, it behaves inconsistently on the shorter
                                                                                 community type and period length.
time spans, picking up too much randomness, while the Gatherer al-
                                                                                   We find the most interesting aggregations to be points per degree
gorithm performs consistently no matter the period length, which led
                                                                                 in community, portion of points received from communities and total
us to this decision.
                                                                                 number of points received from communities. Therefore we decided to
   We form two types of graphs: undirected, showing mutual affinity
                                                                                 interpret those more carefully in Section 5.
between contestants (i.e. an undirected edge between two nodes is
added if both show bias towards each other), and directed, showing
only one-way bias. Here, we are more interested in actual one-way
                                                                                 3.5    Preference detection and future projections
relationships - an edge was therefore added only if one country shows            One of the hypothesis we set was that users and jury vote based on
bias towards the other but the other does not show any bias for the              three main factors: the song popularity and features, the country of
first. Both graphs use weighted edges, the weight denoting the differ-           the performance and the artist features. We split those categories
ence between the actual and expected (simulated / average) number                to subcategories and obtain as much data as possible about them.
of votes.                                                                        We build a knowledge graph which connects all possible properties
  Despite the consistent performance by the Gatherer algorithm, it still         that can be considered together into relations of different types. With
needs some tuning. Besides the noise picked up in neglect detection,             this graph we perform similarity scoring and link prediction where

                                                                             3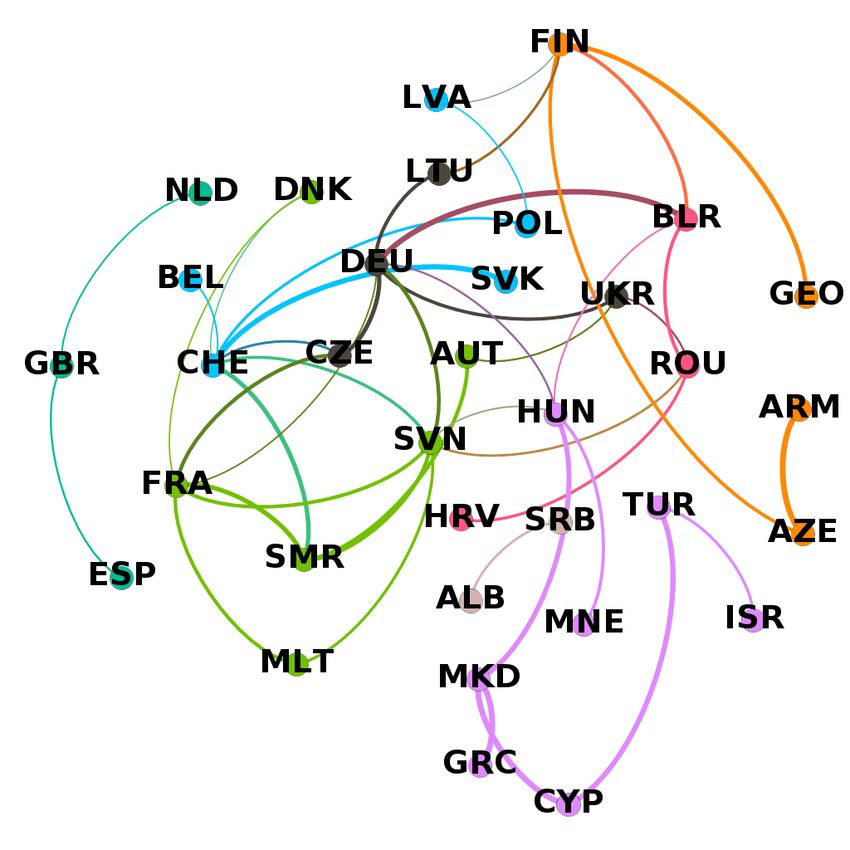
we try to predict the “voting relations” based on other connections.               The data is stored in structured JSOG format (extended JSON for-
We use different link prediction algorithms which have to consider the           mat which can work with references and is therefore better for graphs).
rich structure of the formed graph. In addition to network analysis              The scraping was done in Java but data analysis is done in Python be-
techniques, the dataset was also examined with the Orange package                cause of its numerous robust libraries for data management.
[4].

3.6    Prediction performance evaluation                                         4.2    The inferred networks

It the second part of the analysis, we focus on the predictor of the             Based on the collected voting information, we are able to form a large
success in the competition. The performance is measured against the              number of graphs, showing the voting behavior throughout the history
performance of the betting tables. We use two different scores to cal-           of the competition.
culate the success of the model. The first score is the mean absolute              Firstly, we just create the voting network for each contest separately
error (MAE) of the ranks inferred by the predictor based on the actual           and for all of them together (the all-time voting network). The net-
results and the second score the recall at n (Recall@n) score for n = 3,         works for each competition are directed and any edge between two
5 and 10. MAE, too, is measured at distinct intervals: for the whole             countries depict the number of points awarded by one to another in
set of performing nations and just for the top 10 performances each              that year. The in-strength of any node therefore shows its total score
year.                                                                            that year. Similarly, the all-time directed network depicts the total
                                                                                 number of points awarded in the competition history.
                                                                                    These networks are then used to form the bias networks as described
4     Data collection and presentation
                                                                                 in section 3. To observe the changes throughout the competition his-
4.1    Collection                                                                tory, we opt to form networks that represent biases and neglect in
                                                                                 certain periods - those were chosen to be 1, 5, 10, 15, 20, 25, 30, 35,
The data set used was obtained by scraping various web pages. The                40, 45, 50, 60, 63 years. For each period, both directed and undirected
voting data was collected from (European Broadcasting Union) and                 networks are created. This gives us more than 4400 networks alto-
the information about specific countries, songs and performers was               gether, but we do not need to analyze all thoroughly. The main focus
downloaded from (ESCHome, Wikipedia). The available voting data                  are the networks that show the all-time preferences (period length 63
includes all points awarded by every country to every other participant          years), the ones that depict different 10 year periods, since this can
throughout the years, both for the final and the semi-finals (when both          show any changing nature of the voting, and the ones that depict the
were held), with the exception of the first ever competition in 1956,            last 20, 25 and 30 year periods, showing long-term but still recent
since the data is not available. For the period between the years 2016           trends.
and 2019 we even got separated votes from jury and audience, since                  The all-time voting network has 52 nodes, one for each country
this is when the EBU started sharing these figures.                              that has ever competed. The 10 most successful (the nations with
   For most countries we obtained their names, Wikipedia category en-            the highest number of points collected throughout the history) were
tries, languages, the currency, calling code, ethnic groups, religions,          Sweden, Norway, the UK, Germany, France, Spain, Denmark, Greece,
neighborhood and some other features that we hope to be useful. For              the Netherlands and Ireland. The least successful so far have been
the participants we have their country of origin, how old they were              Monaco, Bulgaria, Australia, San Marino, Montenegro, Czech Repub-
when the represented their nation, name, Wikipedia categories, mu-               lic, Slovakia, Andorra and Morocco. However, these scores should not
sic genres, instruments and occupations. Data for songs was scrapped             be too surprising and taken too seriously, since the most successful
from Wikipedia. We have among other things the genres, categories,               nations are also the ones that have participated in the competition
languages and released date. To analyze songs even better we scrapped            the longest and many of the least successful ones have only taken part
lyrics, chords and scores from (Lyrics Fandom, Musixmatch, Mus-                  a few times. On the other hand, Australia has only participated 5
escore, Ultimate Guitar ). The biggest challenge presented the data              times so far and has achieved great success each time, which can not
about songs, performers and performances themselves. We have tried               be captured with this kind of analysis.
to obtain as much as we could from Wikipedia, at least for the lat-
est entries, which were better represented. We therefore focus mainly
on those. We also plan to extract some other important properties
                                                                                 4.3    Betting tables accuracy
(the tones, harmony, metrum, melody...) about song quality from the
chords and scores and the prevailing themes and motifs with text min-            The baseline for measuring the performance of our prediction model
ing. Those features will be useful to pinpoint the preferences of specific       was using the betting tables as the only means for predicting the out-
countries and the factors that contribute most to success.                       come of the competition. Thus, this baseline needed to be determined.
  We have also obtained the betting tables for each competition be-              The results were obtained using the performance metrics described in
tween the years 2004 and 2019 (Eurovision World Betting Odds).                   3.6, averaged over the whole period for which we have obtained the
These allow us to combine our models with the expected outcomes                  betting tables. They are presented in Table 1 on page 5. We can see
based on the betting odds.                                                       the MAE of the tables improves for the higher part of the table, while
  Wikipedia was therefore the main source of the data about the per-             the recall does not seem to be affected much by the range. These fig-
formers, countries and music. This data is however not complete and              ures are the baseline for our model, which provided results described
we had to make some compromises here, as discussed in Section 6.                 in 5.6.

                                                                             4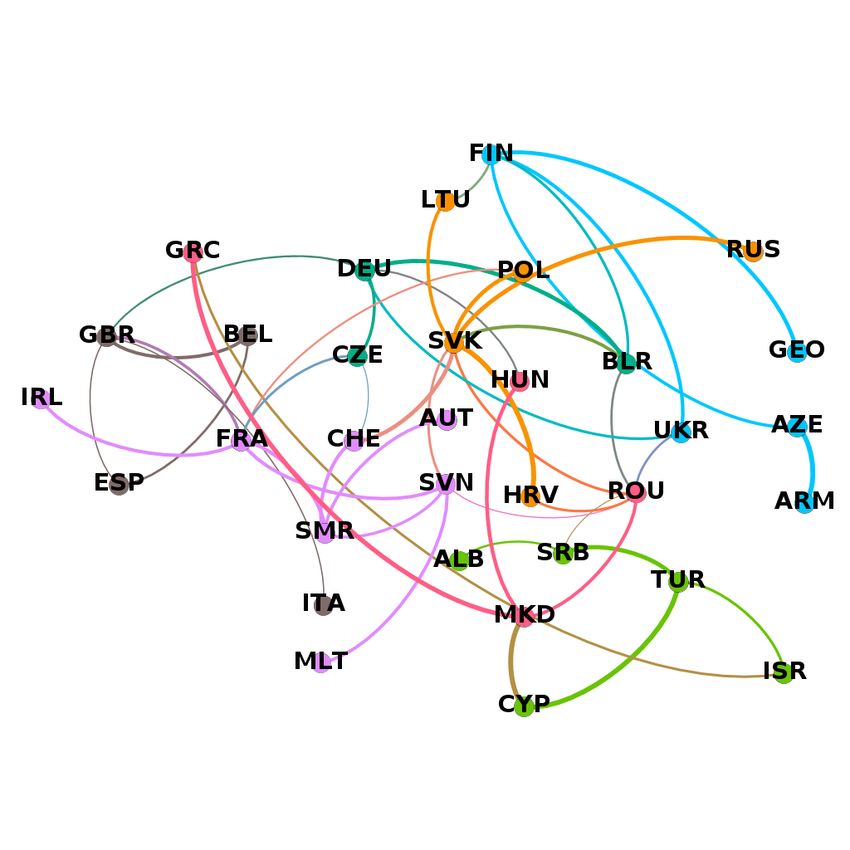
Performance measure used Results Rank Countries Relative support
Mean averaged error over the whole set 4.3391 1 Cyprus, Greece 0.108919
Mean averaged error over the top 10 4.0421 2 Denmark, Sweden 0.080505
Recall@3 0.4386 3 Sweden, Norway 0.069455
Recall@5 0.54737 4 Switzerland, United Kingdom 0.065904
Recall@10 0.56842 5 Denmark, Norway 0.062352
6 United Kingdom, Ireland 0.061957
Table 1: Performance evaluation of betting tables as predictors 7 Denmark, Sweden, Norway 0.055249
8 Spain, Portugal 0.053275
9 Sweden, Iceland 0.042620
5 Results 10 Germany, United Kingdom 0.041831
11 Denmark, Iceland 0.041436
The results are grouped into multiple subsections, dealing with the 12 Romania, Moldova 0.036701
communities of positive bias, countries showing neglect, the correlation 13 Belgium, Netherlands 0.036306
between the community structure of a country and its success, what we 14 Slovenia, Croatia 0.034728
think causes this behavior, the inferred preferences of specific countries 15 Israel, France 0.034333
16 Denmark, Sweden, Iceland 0.033149
and the prediction results.
17 Norway, Iceland 0.033149
18 Germany, Ireland 0.032755
5.1 Communities 19 Finland, Sweden 0.028808
20 Estonia, Latvia 0.027624
The number of generated networks makes it possible to reason about
the different trends and influences on the voting. Although we could Table 2: Countries that ended up in the same community most often
have focused on any period in the competition history, we chose to and the relative number of times
further inspect the most recent results and mostly summarize the older.
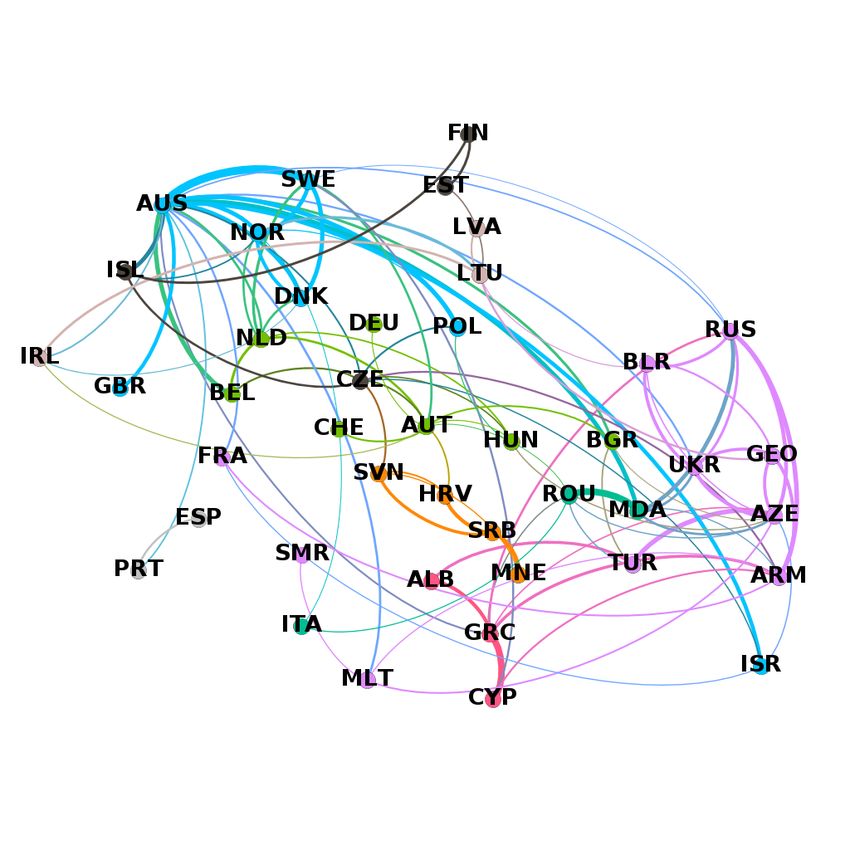
Figure B.1 on page 11 shows the communities formed if we consider number of points and the other does not. Communities are not that
the results from the start of the competition in 1956. There are 10 prominent in this network, but still visible. One reason why the com-
communities in total and they are strongly geographically influenced, munity structure is limited in the fact that historically very successful
forming the following blocs: Northern (Sweden, Denmark, Norway, countries such as Sweden receive a high number of points from others
Iceland), Western (Ireland, United Kingdom, Germany, Luxembourg), very often and they can not “return” the votes to all of them. Therefore,
Southern (Italy, Malta, Spain, Portugal), Central (Netherlands, Hun- they have a very high in-degree and this does not infer any preference,
gary, Belgium, Austria), Baltic (Lithuania, Estonia, Latvia, Fin- just the fact that they were successful. However, some relationships
land), Eastern (Poland, Ukraine, Russia, Belarus), the Balkan (Greece, in the all-time network are still quite interesting, like the strong edge
Cyprus, Albania), South-Western (Moldova, Romania, Turkey), Yu- from Croatia to Bosnia and Herzegovina and the edges from the former
goslavian (Croatia, Slovenia) and Cross-Continental (Israel, France). USSR nations to Russia.
Especially prominent are the connections between Cyprus and Greece, The data also allows us to find sets of countries that end up in the
Greece and Albania, Romania and Moldova, Italy and Malta and the same communities most often. The results are presented in Table 2 on
former USSR countries. page 5. As the table shows, the countries that co-occur in a community
Although this is the network that includes the most data and is thus most often are Cyprus and Greece, which are a part of more than 10 %
seemingly the most important, we only mention it here for the sake of the formed communities. They are followed by some Scandinavian
of completeness. We are more interested in the networks depicted in countries and the most regular participants in the competitions, such
Figure B.2 on page 12, Figure B.3 on page 13 and Figure B.4 on page as the UK, Ireland and Switzerland. The most common set of size three
13 for the later parts of the analysis as they speak of the more recent contains Denmark, Sweden and Norway. We also notice a strong rela-
trends. tionship between Portugal and Spain, Romania and Moldova, Slovenia
Figure B.3 on page 13 and Figure B.4 on page 13 show how the and Croatia and, interestingly, France and Israel. All the relationships
bias networks have evolved and grown, although the main communities are also visible in the figures in Section B.
remain the same. Clearly, there is more and more biased voting, but it The graphs in Figure B.3 on page 13 and Figure B.4 on page 13
remains concentrated in the same blocs in all periods. It is interesting provide a different view as to how the bias has evolved throughout the
to see how Australia got mixed into the Northern bloc in the last 10 history and it is clear that there are more and more biased connections.
years. This may be one of the reasons for their reasonable success so This can also be seen if we look at the average degree of the bias
far. During the first five time they have taken part in the competition, undirected network throughout the history, depicted in Figure 5.1 on
they showed a very focused voting behavior and at the same time page 6. The degree has been rising consistently, which means that the
managed to collect many points from until then a very closed bloc. countries are actively forming more and more friendship communities
We think the most interesting and current network is the one in and concentrating their votes among specific “partners”.
Figure B.2 on page 12, since it shows the recent trends, while still
taking into account a longer time period. The communities are very 5.2 Correlation between the community structure
similar to the ones implied by the all-time bias network, showing the
and success
persistence of these relationships.
Also interesting is the network shown in Figure B.5 on page 14, Table 4 on page 17 shows what percentage of points countries got from
showing the all-time network of one-way relationships. The edges de- their communities. For example, averaged over 25 years, members
pict relationships where only one country awards more than average of neglect communities only received 6.1 % of their points from that
5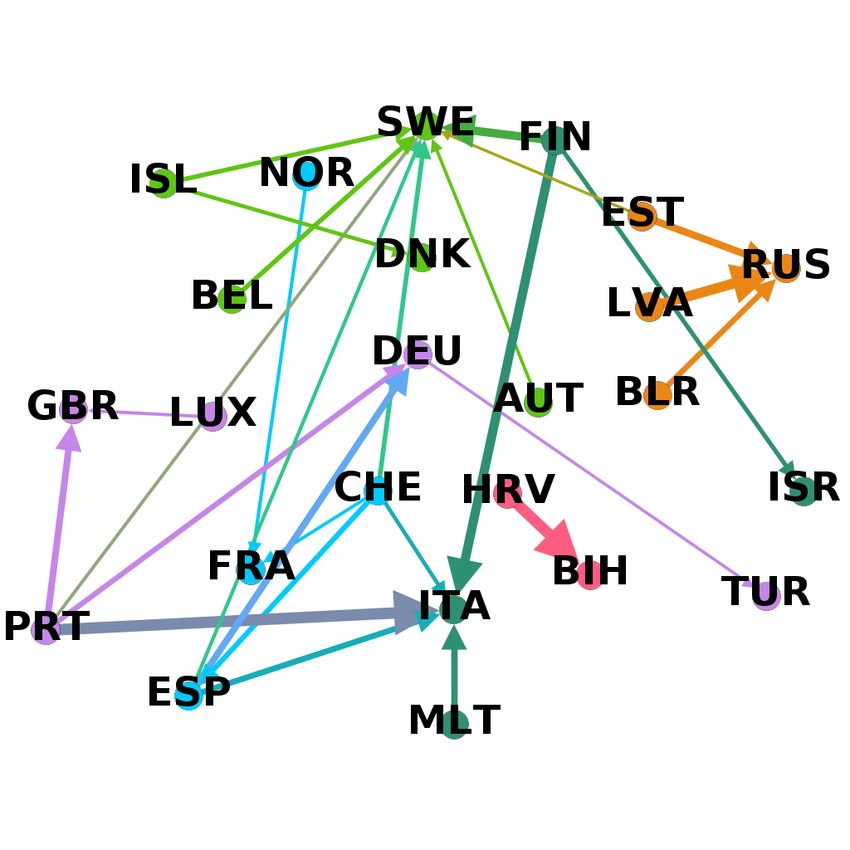
Figure 5.1: Average number of nodes and edges, average degree and clustering coefficient in the bias networks throughout the years.

community, while members of communities in directed graphs get on                It is worth noticing that the positive bias behavior is most strongly
average 17.6 % of their points from that cluster.                             represented by pairs of nations that are more isolated, either geograph-
   Table 5 on page 17, Table 6 on page 17 and Figure C.1 on page              ically (e.g. Spain and Portugal, the UK and Ireland, Romania and
18 show a recurring relationship between the success of a nation and          Moldova, the Scandinavian countries), or culturally (e.g. Cyprus and
its community structure. Being in a positive bias community pays              Greece, Greece and Albania, the Baltic countries and, again Romania
off because countries get on average higher scores and achieve higher         and Moldova).
places, a trend clearly visible in the plots. We can also see that it           The countries showing most neglect have notable reasons as well.
is better to avoid neglect clusters, since membership in those usually        Especially the historical relationship between Macedonia and Greece
means lower ranking.                                                          and more recently between Albania and Serbia can be explained by
                                                                              their non-friendly neighborhood relations.
5.3     Neglect
We form the neglect networks in a similar manner to the positive bias         5.5    Nation’s music preferences
ones and the results are shown in Figure B.6 on page 15, Figure B.7 on
                                                                              The constructed knowledge graph and Orange visualization tools offer
page 16 and Figure B.8 on page 16. As expected, some distinct neglect
                                                                              a glimpse into what genres, music styles and other performance features
relationships are visible between nations, most notable between Mace-
                                                                              caught the voters attention. Unfortunately, due to the lack of data, we
donia and both Greece and Cyprus. Similar holds for the pair Cyprus
                                                                              are only able to extract the crudest of relationships, thus, we do not
and Turkey and more recently, for Azerbaijan and Armenia. Interest-
                                                                              discuss them here thoroughly. Some trends we observe, though, are
ingly, there is also a strong evidence of neglect between Germany and
                                                                              the fondness of Slovenia towards Croatian songs (both in the form of
the pair Belarus and Ukraine. As seen in the more recent networks,
                                                                              the language and the origin), Australia towards songs in English and
the trends persist.
                                                                              we again confirm the strong relationship between Greece and Cyprus.

5.4     Possible influences and motivations
                                                                              5.6    Prediction performance evaluation
As found in the discussed literature, geographical proximity seems to
influence the voting behavior most, as can be seen through the geo-           The performance measures indicate that the built model did not in-
graphically local communities that form. Moreover, affinity between           crease the accuracy of the betting tables. Much of this can be at-
nations such as the UK and Malta stress that language similarity also         tributed to the fact that the data was often very sparse and not
plays a role. Common historical background could be attributed to the         structured very well. Even after preprocessing and filtering the whole
affinity between the former Yugoslavian and USSR nations, since the           dataset, we were still left with too many unreliable and altogether not
communities rarely extend beyond the bounds of the former unions.             very useful entries.
   The one way relationships are trickier and less obvious. However,             In Table 3 on page 7 we report the performance measures when we
they can be explained to some extend by the number of immigrants              also consider the predictor data together with the data from the betting
(e.g. votes from Croatia to Bosnia and Herzegovina, Germany and               tables in variable amounts. The hyperparameter β indicates how much
France to Turkey and Switzerland to Serbia) and historical significance       the predictions made by the our model are taken into account (β = 0
of one country to the other (e.g. the votes from the former USSR coun-        means only the betting tables are used and β = 1 means we rely only
tries to Russia). Other reasoning is hard to ground since the highest         on our predictor). We can see, the predictor does not improve the
in-degrees can be explained purely on the success in the competition.         betting tables performance.

                                                                          6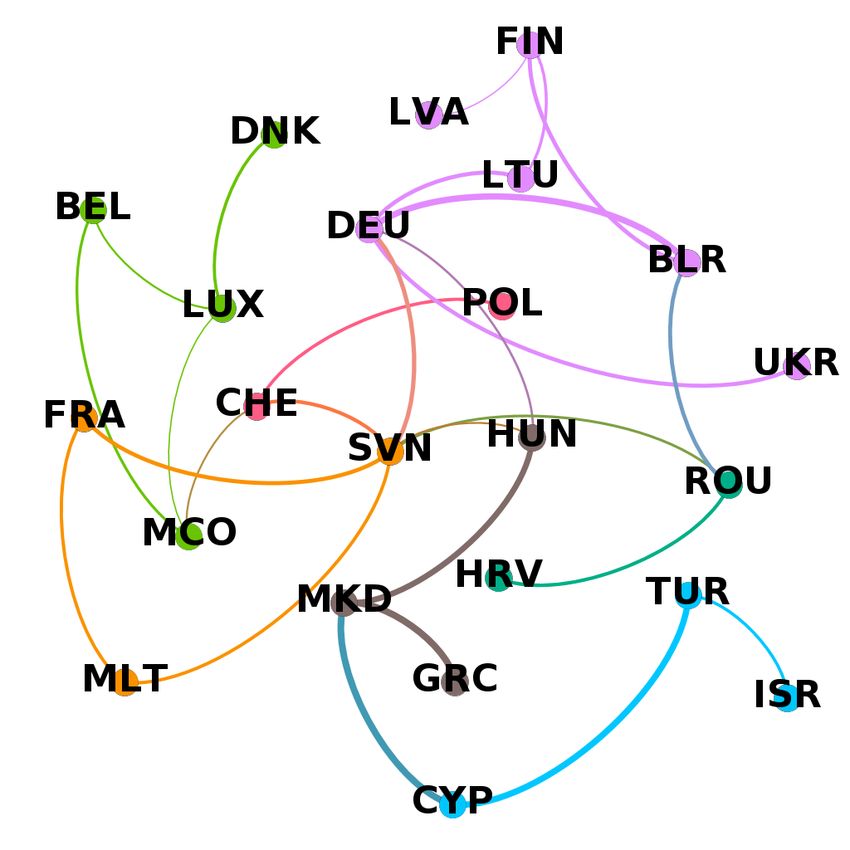
Performance measure used                 Results (β = 0.2)     Results (β = 0.5)         Results (β = 1.0)
 Mean averaged error over the whole set            5.99516               6.52149                   6.75597
  Mean averaged error over the top 10              6.48421               7.46316                      7.8
              Recall@3                             0.14035               0.08772                   0.07018
              Recall@5                             0.23158                  0.2                    0.11579
              Recall@10                            0.42105               0.35263                   0.31053

                                             Table 3: Performance evaluation of our prediction model

6    Problems and compromises                                                     from the whole EU vote for propositions which come from different
                                                                                  backgrounds, one might find some trends in the way the representa-
The incompleteness of the data has turned out to be a problem very                tives from specific countries vote.
early on, as we were initially unable to construct graphs based on                   Lastly, we consider our own implementations and dataset. Some
some similarities, namely the ethnic groups, immigrant numbers and                methods we implemented did not take into account all the specifics in
economic exchange. We thus resorted to manual inspection of the                   the ESC dataset (e.g. the change of Macedonia to North Macedonia
probable causes of some trends. The inferred relationships are thus               was handled manually) and could be extended to further increase the
based only on our domain knowledge and presumptions.                              result reliability. One of the main objectives for future work would
   As expected, the availability of the data about the performances,              also be the aforementioned expansion of the dataset that could allow
songs and authors is also limited, but we have managed to obtain a                a better model of the behavior.
reasonable amount of it and we hope it will prove useful for the second
part of the project.
   Another problem we encountered was the noise in the less robust net-
                                                                                  8    Summary and conclusions
works such as the directed ones and the ones dealing with neglect. They           In this paper, we analyzed the trends in the ESC voting network. The
needed a lot of tuning and some post-processing to present any usable             results show strong and recurring patterns of mutual point exchange
information, but the final outcome is still quite non-deterministic and           between neighboring countries. We observed the most commonly re-
open to numerous interpretations.                                                 curring friendships and one-way relationships together with some per-
   Motif counting and detection was also found to be not as effective             sistent behavior of neglect. As discussed in the previous work, they
as we had hoped. The process of extracting the motif structure itself             can be explained by geographical proximity and language similarity,
was not very straight-forward since the functionality is not as widely            as well as ethnic structure and historical bonds. Having a large num-
implemented as some other tools and at the same time the results were             ber of biased relationships positively correlates to the success in the
not as informative and interpretable as the community structure itself.           competition and we observed more and more relationships the the more
For example, the notion of the reciprocal point exchange is summed                recent years. Isolation of sets of countries seems to make bonds among
up in the undirected positive bias networks. Thus, we think that a                the members of the set stronger.
thorough inspection of the motif structure would not provide better                  We also described the methodology used in more detail and explained
enough understanding of the network. We therefore abandoned this                  how the data was structured to obtain the information. The obtained
idea and focused on other analysis tools.                                         data was then used to build predictor for future contests. To the ex-
   If we were able to manage the dataset deficits in the first part of the        tent possible, we leveraged the distinct music preferences of individual
paper, they really came forward in the second part, since the short-              nations to extract which genres and music styles achieve the greatest
comings disabled us to build a valid and useful model for prediction.             success in different countries. This involves both the points given by
We leave this feat for future work.                                               the nation to other countries for their performances and also their rep-
                                                                                  resentative artists. This data was combined with betting tables, since
7    Future work                                                                  they are widely considered to be the best predictors about the success
                                                                                  of participants. The resulting model did not outperform the betting
During the analysis, we came across a few possible applications to other          tables alone with its main weakness being the lack of reliable data.
fields. Firstly, the ideas and method discussed here do not necessarily              We look forward to future extensions of our work on similar fields or
apply only on the Eurovision voting network. Such analysis can be                 the same project with a more promising prediction model.
applied to any voting system, especially ones with a smaller number
of voting entities, such as the participating countries discussed in this
paper. We would find analysis of the voting behavior in sports where
                                                                                  References
points are awarded by judges from different countries very interesting.           Bastian, Mathieu, Sebastien Heymann, and Mathieu Jacomy (Mar.
These sports include ski jumping, figure skating, gymnastic etc. Sim-               2009). “Gephi: An Open Source Software for Exploring and Manip-
ilarly, taking a closer look at the voting for awards would presumably              ulating Networks”. In: doi: 10.13140/2.1.1341.1520.
reveal interesting trends. One of such awards is the Ballon d’Or prize            Blondel, Vincent et al. (Apr. 2008). “Fast Unfolding of Communities
in soccer, where journalists and players from around the world vote                 in Large Networks”. In: Journal of Statistical Mechanics Theory and
for the best footballer each year. Each nation is represented by its                Experiment 2008. doi: 10.1088/1742-5468/2008/10/P10008.
journalists and players, which is similar to the voting structure of the          Dekker, Anthony (Jan. 2007). “The Eurovision Song Contest as a
ESC.                                                                                ’Friendship’ Network 1”. In: Connections 27.
   A different field we would also be interested in is the voting a politi-
cal environment such as the European Parliament. As representatives

                                                                              7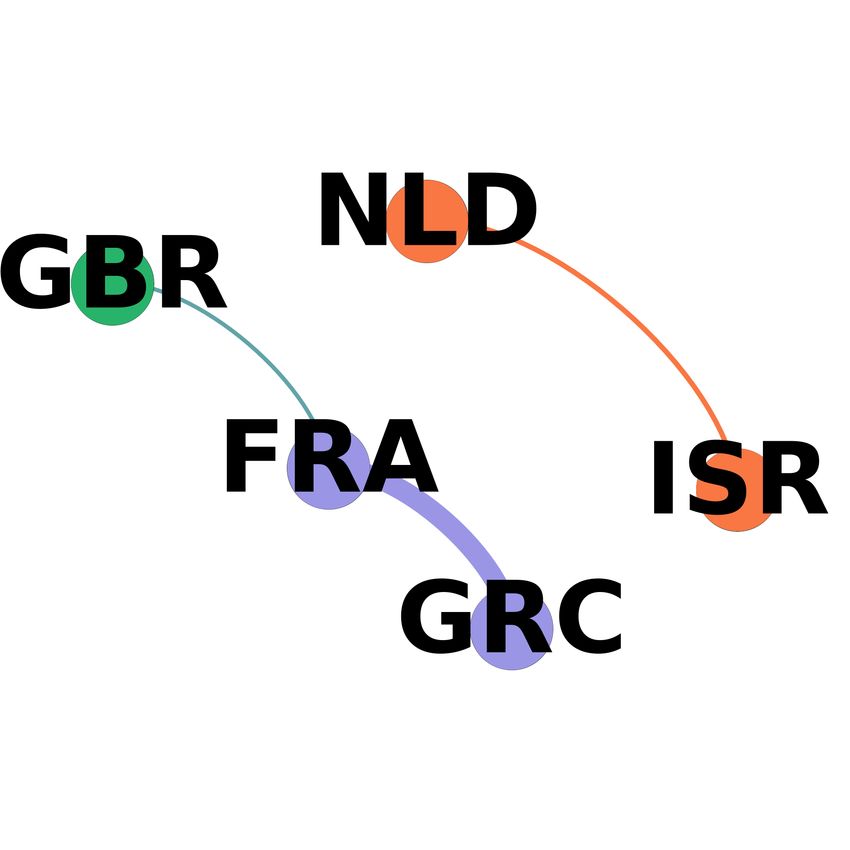
Demšar, Janez et al. (2013). “Orange: Data Mining Toolbox in Python”.
  In: Journal of Machine Learning Research 14, pp. 2349–2353. url:
  http://jmlr.org/papers/v14/demsar13a.html.
ESCHome (2019). Accessible: www.eschome.net. [Accessed: 15th Oc-
  tober 2019].
European Broadcasting Union (2019). Accessible: www.eurovision.tv.
  [Accessed: 15th October 2019].
Eurovision Song Contest (2019). Accessible: en.wikipedia.org/wiki/
  Eurovision_Song_Contest. [Accessed: 17th October 2019].
Eurovision World Betting Odds (2019). Accessible: eurovisionworld.
  com/odds/. [Accessed: 17th October 2019].
Gatherer, Derek (Mar. 2006). “Comparison of Eurovision Song Contest
  Simulation with Actual Results Reveals Shifting Patterns of Collu-
  sive Voting Alliances.” In: Journal of Artificial Societies and Social
  Simulation 9.
Ginsburgh, Victor and Abdul G. Noury (2008). “The Eurovision Song
  Contest. Is voting political or cultural?” In: European Journal of
  Political Economy 24.1, pp. 41 –52. issn: 0176-2680. doi: https :
  //doi.org/10.1016/j.ejpoleco.2007.05.004. url: http://www.
  sciencedirect.com/science/article/pii/S0176268007000547.
Hagberg, Aric, Pieter Swart, and Daniel Chult (Jan. 2008). “Exploring
  Network Structure, Dynamics, and Function Using NetworkX”. In:
Lyrics Fandom (2019). Accessible: lyrics . fandom . com. [Accessed:
  15th October 2019].
Mantzaris, Alexander V., Samuel R. Rein, and Alexander D. Hop-
  kins (2017). Examining collusion and voting biases between countries
  during the Eurovision song contest since 1957. arXiv: 1705.06721
  [stat.AP].
– (2018). “Preference and neglect amongst countries in the Eurovision
  Song Contest”. In: Journal of Computational Social Science 1.2,
  pp. 377–390. issn: 2432-2725. doi: 10.1007/s42001- 018- 0020- 2.
  url: https://doi.org/10.1007/s42001-018-0020-2.
Musescore (2019). Accessible: www . musescore . com. [Accessed: 15th
  October 2019].
Musixmatch (2019). Accessible: www.musixmatch.com. [Accessed: 15th
  October 2019].
Newman, M (Oct. 2006). “Finding Community Structure in Networks
  Using the Eigenvectors of Matrices”. In: Physical review. E, Statisti-
  cal, nonlinear, and soft matter physics 74, p. 036104. doi: 10.1103/
  PhysRevE.74.036104.
Raschka, Sebastian (2018). “MLxtend: Providing machine learning and
  data science utilities and extensions to Python’s scientific computing
  stack”. In: The Journal of Open Source Software 3.24, p. 638. doi:
  10.21105/joss.00638.
Rossetti, Giulio, Letizia Milli, and Remy Cazabet (Dec. 2019).
  “CDLIB: a python library to extract, compare and evaluate com-
  munities from complex networks”. In: Applied Network Science 4.
  doi: 10.1007/s41109-019-0165-9.
Spierdijk, L. and M.H. Vellekoop (Feb. 2006). Geography, culture,
  and religion: Explaining the bias in Eurovision song contest vot-
  ing. Undefined. Applied Mathematics Memoranda 1794. University
  of Twente, Department of Applied Mathematics.
Ultimate Guitar (2019). Accessible: www.ultimate- guitar.com. [Ac-
  cessed: 15th October 2019].
Wikipedia (2019). Accessible: en.wikipedia.org. [Accessed: 15th Oc-
  tober 2019].

                                                                           8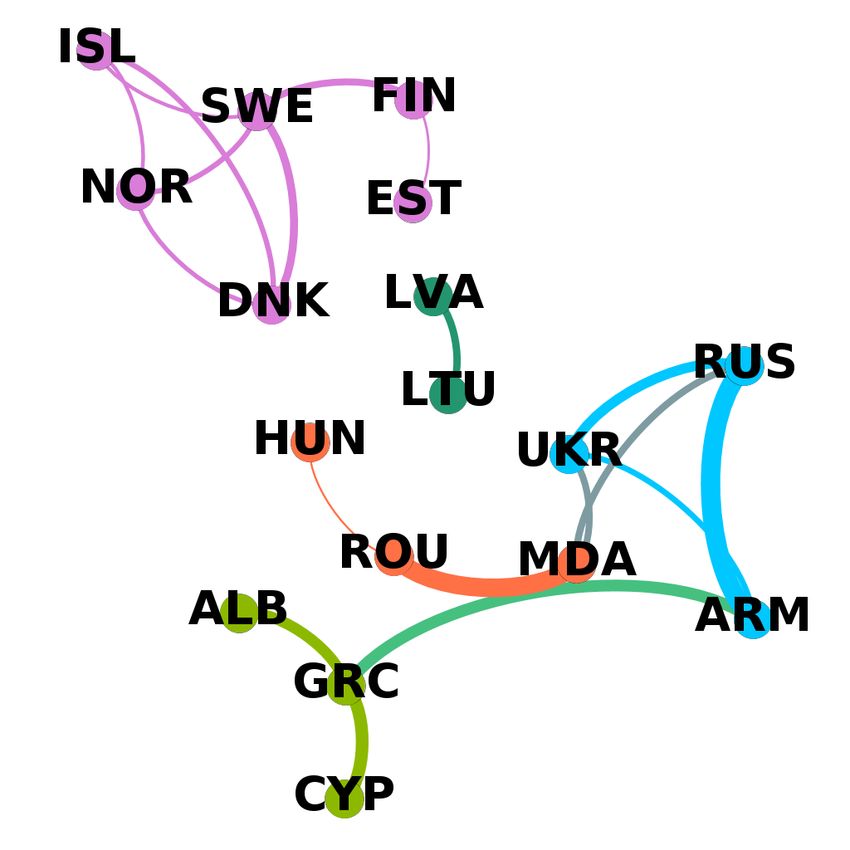
A    Pseudo-code

Algorithm 1 The Gatherer algorithm
   function Gatherer (start_year, end_year)
   conf_up = bias threshold // 1 % in our case
   conf_low = neglect threshold // 90 % in our case
   avg_simulation = []
   // simulate voting enough times
   // to obtain a reliable expectation
   // (100000 times in our case)
   for selected number of iterations:
   simulation = []
   for year in start_year..end_year:
        score = expected (uniformly random)
            number of votes received by a contestant
        // depends on the voting scheme
        append(simulation, score)
   avg_sim = mean(simulation)
   append(avg_simulation, avg_sim)
   sort(avg_simulation, reverse=True)
   positive_bias = percentile(avg_simulation, conf_up)
   // more than bias number of points reflect biased voting
   negative_bias = percentile(avg_simulation, conf_low)
   // more than bias number of points reflect neglect

Algorithm 2 Method of forming a bias voting network based on statistics calculated by the Gatherer algorithm
    function Determine_Bias_Gatherer (start_year, end_year)
    period_length = start_year - end_year + 1
    participants = nations that took part in the ESC in the period
    for c1 in participants:
    for c2 in participants:
     if times_participating_together > period_length / 5:
     // only take into account the participants
     // that took part in 20 % of all competitions in that period
         points_awarded_1, points_awarded_2 =
             number of points awarded by c1 to c2 (and by c2 to c1) in the period
         threshold_high = the threshold number of points for that period
             showing bias calculated by the Gatherer algorithm
         threshold_low = the threshold number of points for that period
             showing neglect calculated by the Gatherer algorithm
      if points_awarded_1 > threshold_high > points_awarded_2:
         // one-way bias
         add edge (c1, c2) with weight
             (points_awarded_1 - points_awarded_2)
         to the directed bias network
      if points_awarded_1 > threshold_high and
         points_awarded_2 > threshold_high:
         // two-way bias
         add edge {c1, c2} with weight
            ((points_awarded_1 + points_awarded_2) / 2 - threshold_high)
         to the undirected bias network
      if c1 less than 3 hops away from c2:
         // only consider countries that are close
         // geographically to avoid noise
         if points_awarded_1 < threshold_low
            and points_awarded_2 < threshold_low: // two-way neglect
            add edge {c1, c2} with weight
               (threshold_low - (points_awarded_1 + points_awarded_2) / 2)
            to the undirected neglect network

                                                                   9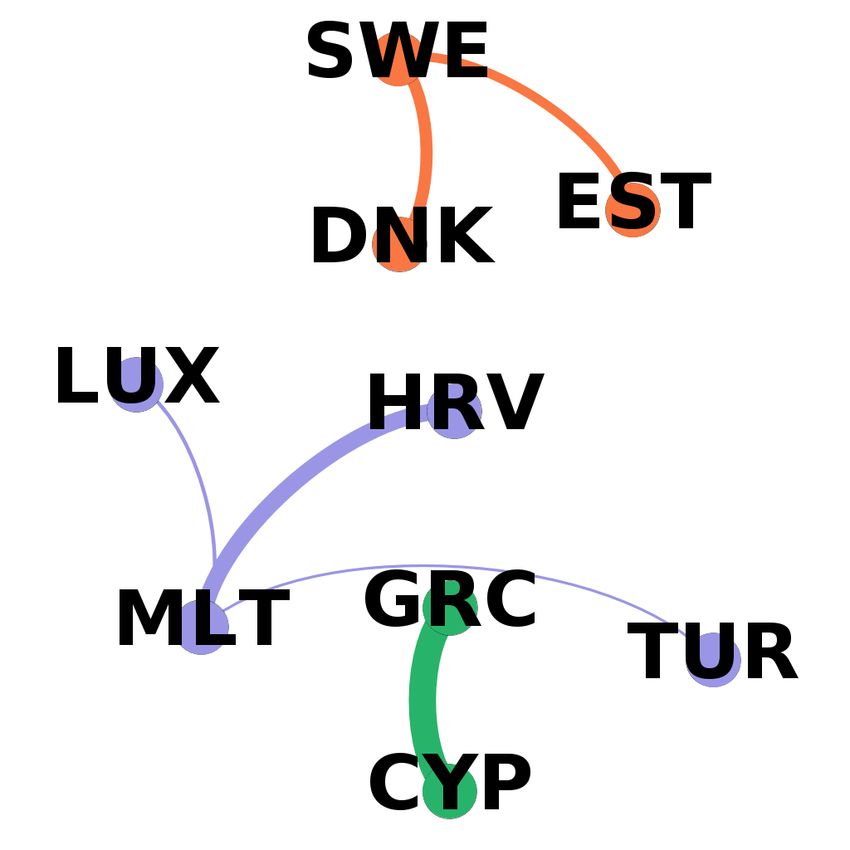
Algorithm 3 Method of forming a bias voting network based on the average number of points received by the countries in the time period
    function Determine_Bias_Average (start_year, end_year)
    overshot = defaultdict(int)
    period_length = start_year - end_year + 1
    threshold = 0.75
    // threshold of how many times more than the average
    // number of points need to be awarded for bias to occur
    participants = nations that took part in the ESC in the period
    for year in start_year..end_year:
    determine the average number of points
        for each participant in the time period
    for c1 in participants:
    for c2 in participants:
        points_awarded_1, points_awarded_2 =
            number of points awarded by c1 to c2 (and by c2 to c1) in the period
        determine how many times each country has awarded any other more than
            the average number of points received by the second in the time period
        appearances_1, appearances_2 =
            number of times c1 (and c2) participated in the ESC in the period
        overshot_1, overshot_2 =
            number of times c1 gave more than the average number of points
                received by c2 to c2 in the period
      if overshot_1 > threshold * appearances_2 and
         overshot_2 < threshold * appearances_1:
         // one-way bias
         add edge (c1, c2) with weight
             (overshot_1 - overshot_2)
         to the directed bias network
      if points_awarded_1 > threshold * appearances_2 and
         points_awarded_2 > threshold * appearances_1:
         // two-way bias
         add edge {c1, c2} with weight
             ((overshot_1 + overshot_2 -
                 threshold * appearances_1 - threshold * appearances_2) / 2)
         to the undirected bias network

                                                                   10
B Voting networks
Figure B.1: Bidirectional bias from the start of the competition.
11Figure B.2: Bidirectional bias from the last 20 years (1999-2019).
12Figure B.3: Bidirectional bias in 10 year periods (1959-1969, 1969-1979, 1979-1989, 1989-1999).
Figure B.4: Bidirectional bias in 10 year periods (1999-2009, 2009-2019).
13Figure B.5: Unidirectional bias from the start of the competition.
14Figure B.6: Bidirectional neglect from the start of the competition.
15Figure B.7: Bidirectional neglect from the last 30 years (1989-2019).
Figure B.8: Bidirectional neglect from the last 10 years (2009-2019).
16C Correlation between the community structure and success
bidirectional bias unidirectional bias bidirectional neglect
Period Average Std. deviation Average Std. deviation Average Std. deviation
1 0.221899 0.100893 0.272000 0.183325 0.028571 0.045175
5 0.182377 0.088343 0.213500 0.146715 0.008819 0.025185
10 0.178759 0.091834 0.203822 0.149438 0.025190 0.040698
15 0.146309 0.085600 0.183874 0.128531 0.030836 0.046235
20 0.167683 0.092946 0.168643 0.126064 0.045053 0.063087
25 0.160396 0.082057 0.176515 0.122498 0.061314 0.073130
30 0.172900 0.087606 0.169401 0.114682 0.068828 0.077786
35 0.154342 0.073746 0.152520 0.109934 0.079588 0.083365
40 0.145658 0.068036 0.140207 0.097547 0.098842 0.100601
45 0.144391 0.058237 0.139352 0.101466 0.119286 0.110119
50 0.151423 0.062818 0.137625 0.094858 0.128911 0.112514
60 0.137798 0.060983 0.172797 0.113359 0.100064 0.074564
63 0.148520 0.063798 0.118017 0.062083 0.089192 0.060707
Table 4: Average percentage of points from cluster
bidirectional bias unidirectional bias bidirectional neglect
Period Average Std. deviation Average Std. deviation Average Std. deviation
1 4.016861 8.845025 5.651971 10.576302 1.000000 0.000000
5 11.277358 12.190952 11.026810 12.826616 11.243243 7.414031
10 14.761141 11.743697 13.290155 12.419042 19.939394 10.590783
15 15.379965 11.214536 13.944306 11.625325 22.351812 10.998832
20 15.294872 10.934079 14.337316 11.244574 23.031690 11.220221
25 15.568889 10.940346 14.130389 10.757622 23.863777 11.516176
30 16.186901 10.755275 13.700739 10.276011 24.791541 11.303505
35 16.421986 10.351069 13.672965 10.068184 25.268405 11.174442
40 16.538934 10.029798 13.572711 9.798170 25.789303 11.201456
45 16.911271 10.138811 13.414918 9.767238 26.289908 11.634037
50 16.835694 9.870618 13.766871 9.888998 27.171171 12.027089
60 17.774194 9.883873 16.621622 11.320120 28.240000 11.567126
63 18.470588 10.452231 16.538462 11.767722 28.419355 11.555683
Table 5: Average place
bidirectional bias unidirectional bias bidirectional neglect
Period Average Std. deviation Average Std. deviation Average Std. deviation
1 192.798962 121.296850 145.539746 112.241151 10.000000 0.000000
5 532.971698 272.120966 377.071046 243.509404 179.527027 122.623156
10 812.572193 402.081197 639.287195 350.747929 334.397306 216.890460
15 1016.191710 438.225082 876.906899 386.957619 508.735608 353.116841
20 1160.397436 466.326237 1087.883272 421.469262 656.589789 458.733927
25 1312.755556 493.326058 1320.077813 440.165090 800.803406 566.225431
30 1479.075080 537.684058 1546.444581 473.229353 906.910876 632.688740
35 1642.329787 586.564189 1754.513081 523.745983 997.437117 693.322978
40 1816.186475 652.284413 1959.542190 586.185619 1087.307942 752.997564
45 1964.357314 704.277567 2164.620047 651.111263 1228.269725 812.415801
50 2120.864023 728.283705 2333.263804 711.741826 1358.369369 853.760668
60 2631.717742 721.080927 2699.945946 875.262605 1884.672000 829.750447
63 2877.676471 732.652824 2995.423077 925.767630 2151.290323 871.485243
Table 6: Average points
17Figure C.1: Relationship between the degree in the bidirectional bias (left and center) and neglect (right) and the number of points received in
the last 50 years.
18You can also read