Racial Bias in Newspaper Ratings of Professional Football Players - Francesco Principe1 Jan C. van Ours1 1 Erasmus University Rotterdam
←
→
Page content transcription
If your browser does not render page correctly, please read the page content below
TI 2021-072/V
Tinbergen Institute Discussion Paper

Racial Bias in Newspaper Ratings of
Professional Football Players

Francesco Principe1
Jan C. van Ours1

1
    Erasmus University Rotterdam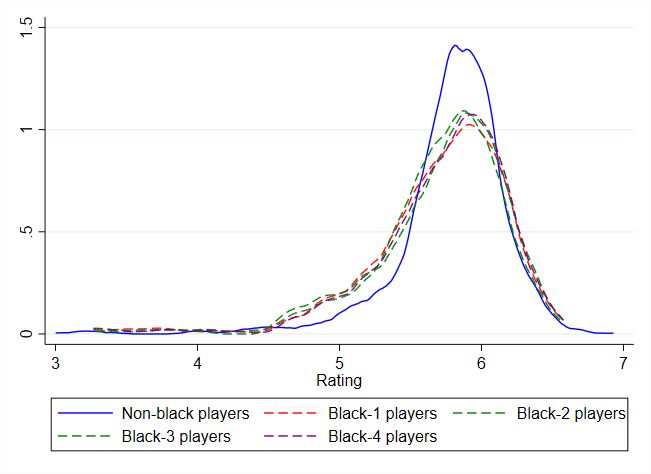
Tinbergen Institute is the graduate school and research institute in economics of
Erasmus University Rotterdam, the University of Amsterdam and Vrije Universiteit
Amsterdam.

Contact: discussionpapers@tinbergen.nl

More TI discussion papers can be downloaded at https://www.tinbergen.nl

Tinbergen Institute has two locations:

Tinbergen Institute Amsterdam
Gustav Mahlerplein 117
1082 MS Amsterdam
The Netherlands
Tel.: +31(0)20 598 4580

Tinbergen Institute Rotterdam
Burg. Oudlaan 50
3062 PA Rotterdam
The Netherlands
Tel.: +31(0)10 408 8900
Racial Bias in Newspaper Ratings
of Professional Football Players
Francesco Principe* Jan C. van Ours
July 30, 2021
Abstract
We study whether there is a racial bias in ratings of professional football
players in Italian newspapers. We find that there is such a bias. Conditional
on objective performance indicators black players receive a lower rating than
non-black players. This is not a difference across the board but predomi-
nantly present at the lower end of the newspaper rating distribution. The
best black players are not subject to a racial bias in ratings. We also find
that clubs do not have a racial bias in the wages they pay to players. We
speculate that for clubs there is sufficient competition to remove racial wage
discrimination. Clubs simply want value for money. Newspaper football
experts do seem to have a racial bias in their rating of players. We hypoth-
esize that this might be unconscious discrimination related to stereotyping
of black players.
Keywords: racial bias; newspaper ratings; professional football
JEL-codes: J15, J71, L82, L83
* Erasmus School of Economics, Tinbergen Institute and ECASE (Erasmus Center for Applied
Sports Economics), the Netherlands; principe@ese.eur.nl
Erasmus School of Economics, Tinbergen Institute and ECASE (Erasmus Center for Ap-
plied Sports Economics), Rotterdam, the Netherlands; Department of Economics, University of
Melbourne, Parkville, Australia and CEPR (London); vanours@ese.eur.nl.1 Introduction
In recent years, episodes of racism have proliferated in the football stadiums of
several major leagues, such as England and Italy. While national and international
federations are taking serious actions against those responsible of racist acts, the
issue still remains unsolved. On top of that, a recent case also involved mass
media. On 5th December 2019, the front-page of Italian newspaper Corriere dello
Sport reported the headline “Black Friday”, alongside photos of striker Romelu
Lukaku of Inter Milan and defender Chris Smalling of AS Roma, to preview the
Friday night’s match between their respective clubs. Even more recent, the UEFA’s
Champions League match of 8th December 2020 between Paris Saint-Germain and
Basaksehir was postponed due to a racial discrimination incident. After one of
the UEFA-officials used a racial term addressing an assistant coach of Basaksehir
walked off the field.
Mass media are the main source of information for football fans. The economic
implications of the presence of a racial bias in mass media are not direct in the
sense that individuals are harmed in their productivity or career trajectory. Nev-
ertheless, to establish whether there is a racial bias in these ratings even if is it
unconscious bias, is important in its own right.
Our paper uses data on the ratings of professional football players by Ital-
ian newspapers to establish whether there is a racial bias in these ratings. We
contribute to two types of studies. First, we add to the literature on biases in
subjective evaluations. Ginsburgh and van Ours (2003) for example show that
even an expert jury can make biased decisions. When judging participants in a
piano competition the order of appearance which was randomized turned to affect
the ratings. This is attributed to the jury having to get used to the new play that
was composed especially for the competition. Because of this, the first player got
significant lower ratings than later performers. Coupe et al. (2018) analyze voting
behavior of the jury for the prestigious football prize FIFA Ballon d’Or finding that
there is a similarity bias. Jury members are more favorable to candidates from
their own country, national team, continent and league team. Zitzewitz (2006)
1finds a similar bias in Olympic winter sports in which judges give higher scores
to athletes from their own country than other judges do. Sometimes subjective
evaluations have a racial component. For example, Giuliano et al. (2011) studying
quits, dismissals and promotions in a large U.S. retail firm find that outcomes are
usually better for workers when their manager is of the same race.
Our second and main contribution is to the literature on racial discrimination.
Generally, two theories are considered to be at the heart of economic thinking
on discrimination, i.e. taste-based discrimination and statistical discrimination.
Taste-based discrimination assumes that some people – employers, workers, con-
sumers – want to avoid interaction with members of minority groups. This type of
discrimination results from animus. Employers who do not like minority workers
will hire fewer of them, workers who do not like minority co-workers will want to
be compensated for working with them, customers who do not like minority groups
will want to pay a lower price if they are served by them. Statistical discrimination
is based on rational behavior with decision making based on limited information.
If for example an employer has limited information about the productivity of a
job applicant a hiring decision will be partly based on observed characteristics of
the applicant and partly on the characteristics of the group the job applicant is
related to.
Bertrand et al. (2005) argue that in addition to conscious tasted-based and ra-
tional statistical discrimination there may be unconscious discrimination to which
they refer as “implicit discrimination”. In taste-based discrimination, some people
are supposed to have an explicit dislike for certain groups of individuals. In statis-
tical discrimination some individuals explicitly prefer some groups of individuals to
others because in expectation this provides them with more utility or higher prof-
its. Implicit discrimination is unintentional and people who discriminate implicitly
are not aware of their behavior. Carlana (2019) argues that stereotyping may lead
to implicit discrimination. Stereotypes are mental constructs based on overgener-
alized representations of differences between groups (Bordalo et al. (2016)).
In their overview of the main differences between statistical discrimination and
taste-based discrimination Guryan and Charles (2013) emphasize that a lot of
2the empirical work has been focused on establishing that there is discrimination
rather than on the cause of this discrimination.1 Often the existence of an unex-
plained wage gap between majority and minority workers is used as evidence of
wage discrimination against the minority group. Using regression analysis, differ-
ences between for example minority and majority workers can partly be explained
through differences in observed characteristics and partly through differences in
returns to observed characteristics. The second type of differences is considered to
be evidence of discrimination. This approach is frequently criticized as it may un-
derstate as well as overstate the extent of wage discrimination (Altonji and Blank
(1999)). Some of the observed characteristics may be influenced by the existence
of discrimination. When it comes to the racial wage gap, it may be that minority
workers invest less in education in anticipation of wage discrimination that reduces
their return to education. Then, the true effect of discrimination is understated.
However, it may also be that the regression analysis suffers from omitted variables
which are related to human capital variables and personal tastes. Then, the extent
of discrimination may be overstated.
Some empirical studies do address the question on the origin of the discrim-
ination. Glover et al. (2017) for example study the performance of cashiers in a
French grocery store chain in relation to their managers. Managers are character-
ized based on an implicit association test that measures the extent to which they
associate minorities – in this case North African immigrants – names with poor
worker performance. From the analysis, it appears that when minority cashiers,
work with managers who are biased their productivity is lower. This is not be-
cause the minority cashiers are treated poorly but because they interact less with
their managers and therefore exert less effort. The lower productivity of minority
cashiers generates statistical discrimination in hiring.
Sports data are suitable to analyze the existence and sometimes the nature of
discrimination whereby the focus is on racial bias. In these studies often there
1
Bertrand and Duflo (2017) provide a general overview of field experiments on discrimi-
nation while Neumark (2018) presents an overview of experimental research on labor market
discrimination. Lang and Kahn-Lang Spitzer (2020) discuss recent economic research on racial
discrimination
3is a distinction between black and non-black players based on photographs from
websites or book publications. Szymanski (2000) for example uses wage data
from English professional football to study racial discrimination. He finds that
conditional on their wage bill clubs with a higher share of black players perform
better which suggests that the black players were underpaid. For discriminating
club owners, their taste for discrimination “acts like a tax on the success of the
team”. Szymanski also notes that the discrimination is by the club owner and not
by the fans as stadium attendance does not depend on the share of black players
(see also Preston and Szymanski (2000)). Reilly and Witt (2011) analyze English
Premier League data on the presence of racial bias in referee decisions during five
seasons when all but one referee was white. They find no evidence of black, mixed
race or Asian football players receiving more disciplinary cards or fouls committed
than white players and thus no evidence on racially motivated animus against non-
white players. However, Gallo et al. (2013) investigating English Premier League
data find evidence of referees awarding more disciplinary warnings (yellow cards)
to non-white, foreign players from low-income countries.
We contribute to the discrimination literature by investigating the relationship
between race and performance evaluations of professional football players provided
by mass media. We study this issue in the context of Serie A in Italy, a country
where episodes of racism are often reported both on and off the sports contexts. We
find evidence of racial bias. In our analysis we use a wide variety of performance
indicators such that there is no issue of characteristics that are unobserved by the
newspaper football experts. This rules out the possibility that the racial bias we
find is related to statistical discrimination. We also find that the racial bias is not
present across the board but present only at the low end of the ratings distribution.
For low-ranked players race seems to be an issue. For players in the middle or at
the high end of the distribution there does not seem to be a racial bias. From this,
we conclude that it is not animus that drives the racial bias. If that would be the
case also highly talented players would receive lower ratings conditional on their
performance. Instead, we hypothesize that the racial bias at the lower end may
be related to unconscious discrimination related to stereotyping.
4We also investigate whether there is a racial bias in wages of the football
players. We find no evidence of this. Wages at determined by the skills of the
players as performance indicators are clearly correlated with wages. At no point
in the skills distribution there is evidence of a racial bias. Apparently, clubs do
not discriminate between black and non-black players but pay them according to
their performance. We speculate that the lack of a racial bias could be because
clubs are color-blind but could equally well be the outcome of competition for the
best players. Clubs simply want value for money and are willing to pay market
wages to all players.
The remainder of the paper is structured as follows. In section 2, we provide
background information about football players ratings in Italy and we present the
data we use in our analysis. Section 3 provides a descriptive analysis showing that
there are unconditional differences in newspaper ratings between black players
and non-black players. In section 4 we discuss our empirical strategy. Section 5
presents our main parameter estimates and a decomposition of the racial wage gap
in newspaper ratings and wages of the players. Section 6 concludes.
2 Rating football players
2.1 Background
The newspaper ratings, in Italian “pagelle” (i.e., report cards) were introduced in
the late 50’s by the sports editorial staff of the newspaper Il Giorno. However,
they started to reach the wider audience and being part of the popular culture
when La Gazzetta dello Sport, the most sold Italian newspaper, also started to
publish them, in October 1972. Nowadays they are published by all the sports
newspapers the day after every Serie A’s fixture, generally on Monday.
In the spirit of the school’s report cards, the pagelle are aimed at evaluating
the performance of the football players, ranging in a scale from 1 (very poor per-
formance) to 10 (excellent performance). These are assigned by professional sports
journalists employed by the newspaper, however they are reported anonymously
5on the newspaper. They are presented on the newspapers page by reporting the
numerical rating alongside few lines of text that reflect the qualitative assessment
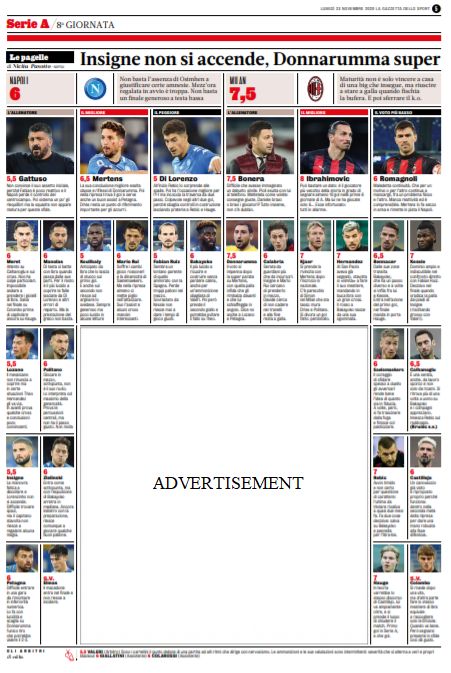
of the performance (see Appendix Figure A1 for an example). They represent the
main source of individual performance information and the only one in which all
the players of the team are evaluated. In the years covered in our data, all sports
journalists involved in the three newspapers analyzed are Italians and white.2
Apart from being used by the newspapers readership, the ratings are an es-
sential part of football-related games, such as the fantasy football (fantacalcio,
in Italian). In this game, the participants to a league have a virtual-budget to
assemble an imaginary team of Serie A players and to score points based on the
newspapers ratings to which bonuses are added or deducted according to each
player on-field performance (e.g., plus 3 point for scoring a goal, minus one point
for receiving a red card, etc.).
In Italy there are three printed sports newspapers: La Gazzetta dello Sport, Il
Corriere dello Sport and TuttoSports with an average circulation of about 250,000,
170,000 and 120,000, respectively. However, most of the readers access the sports
newspapers through the online websites. For example, La Gazzetta’s website has
a daily traffic of about 1.5 million unique users (Audiweb 2021). Albeit similar,
the socio-demographic characteristics of the readership show some heterogeneity
across newspapers. In particular, La Gazzetta attracts younger and more educated
readers compared to the other two newspapers although the differences are small
(see for details Appendix Table C1).
2
The ex post rating of the performance of football players is one of the services newspapers
provide to their readers. Sometimes, newspapers also provide predictions of match outcomes
by football experts. There are studies on the quality of these predictions of match outcomes in
particular in English football. Forrest and Simmons (2000) for example show that newspaper
tipsters are superior to random predictions but their expertise is limited. Forrest et al. (2005)
show that both pundits and laypeople outperform random prediction based on seasonal averages.
Butler et al. (2021) find that former professional football players have superior forecasting abilities
compared to laypeople. However, predicting match outcomes is different from assessing ex post
performance of individual players if only because the former is based on expectations of uncertain
outcomes while the latter is based on combining observations of actual performance into a rating.
62.2 Our data
We assembled a unique data set recording information about professional football
players in Italian Serie A. We have data relating to 409 outfield players, covering a
9-season period, from 2009-2010 to 2017-2018. We exclude goalkeepers, following
the standard approach of this kind of literature (Lucifora and Simmons (2003),
Carrieri et al. (2020)), since their performance is measured differently compared
to the outfield players. This povides a longitudinal dataset of 1,835 player-season
observations. The panel is unbalanced. In fact, the relegation/promotion system
between Serie A and Serie B and the transfer market across national and interna-
tional clubs generates a turnover of players in the league. However, this turnover
usually involves heterogeneous types of players, both less talented players traded
with teams playing in minor leagues and more talented players traded with top
European clubs. This helps to mitigate concerns about selective attrition (Carrieri
et al., 2020).
We use several sources of data. First, information about individual player’s
characteristics (i.e., birth year, position on the pitch and international appear-
ances) and performance are extracted from the website whoscored.com.
Second, we collected information about the ratings given by the three most
sold Italian sports newspapers, La Gazzetta dello Sport, Il Corriere dello Sport
and Tuttosport. These rate player’s performance after every match within a scale
that ranges from 0 (poor performance) to 10 (excellent performance). We use the
end-of-season overall average performance provided by the newspapers.
Third, data on players yearly wages - recorded net of taxes and excluding any
performance-related bonus – are taken from an annual report, published at the
beginning of each football season by La Gazzetta dello Sport. For this reason our
dataset has 1627 player-season observations for wages, as players who join the
league in the following transfer windows (i.e, in January) are not recorded.
One of the recurrent issues is how to establish whether an individual is part of a
minority group. We follow Grogger (2011) who studies the contribution of language
differences to racial wage differences among U.S. black and white workers. For this
7he uses speech samples that are classified in degree of “black-sounding” by a panel
of five anonymous listeners. Race was considered to be indistinctly identified if
three or less listeners correctly assessed the race of the speaker. Interestingly the
racial wage gap is not present for individuals who where indistinctly identified
as black, i.e. speech patterns predict racial wage gaps. Grogger (2019) performs
a similar speech pattern analysis now also including Southern whites into the
analysis. This analysis confirms the earlier findings with respect to racial wage
differences and adds to it that Southern whites the wage gap is largely explained by
residential location. The absence of a wage gap for black workers with mainstream
speech is attributed to occupational sorting, i.e. into occupations that involve
intensive interpersonal interactions and therefore earn a sizable wage premium.
Our variable of interest referring to the race of the player is coded through a
visual inspection of players photography on the website transfermarkt.com. This
is an established method in the economic research on discrimination in sports la-
bor market, since the discriminators prejudge an individual based on appearances
(Palacios-Huerta (2014)). In order to build this variable, we follow Grogger (2011,
2019) and Price and Wolfers (2010). We recruited four students to look at each
players photography and asked them to label the player as either black or non-
black.3 Then we aggregated all the scores at the player level in a unique numerical
variable ranging from 0 (no one labeled the player as black) to 4 (four individuals
labeled the player as black). In the regression analysis and Oaxaca-Blinder de-
composition, the indicator used to identify black players takes value one if at least
one of the viewers labeled the player as “black”.4 Our study using photographs
to assess the color of an individual is also in line with several earlier studies dis-
cussed in the introduction, i.e. Szymanski (2000), Goddard and Wilson (2009) and
Reilly and Witt (2011).5 All the variables, along with some summary statistics,
3
The students were working on a thesis in discrimination in sports economics but were not
aware of the purpose of the labeling.
4
In Appendix C we show that it does not seem to be important how many of the four assessors
labeled the player to be black as long as there is at least one. For this reason, we focus our analysis
on the dichotomous situation in which the player is labeled black or non-black.
5
Goldsmith et al. (2006) uses interviewers to grade survey-respondents according to their
skin shade in three categories: dark, medium and light (with white as the reference category).
8are presented in Appendix A, Table A1.
3 Descriptive Analysis
By way of descriptive analysis, Figure 1 presents kernel densities of ratings and log
wages for various groups of players. Figure 1a shows the average ratings of players
in which a distinction is made between non-black players and black players where
black players are defined as those who received at least one of four indicators for
being considered as black. There is a clear difference between the two densities
whereby black players receive more low ratings than non-black players, especially
between 4.5 and 5. Only a few non-black players receive such a low rating.
Figure 1: Kernel densities black players and non-black players
a. Ratings: Black – Non-black b. Ratings: Non-black by newspaper
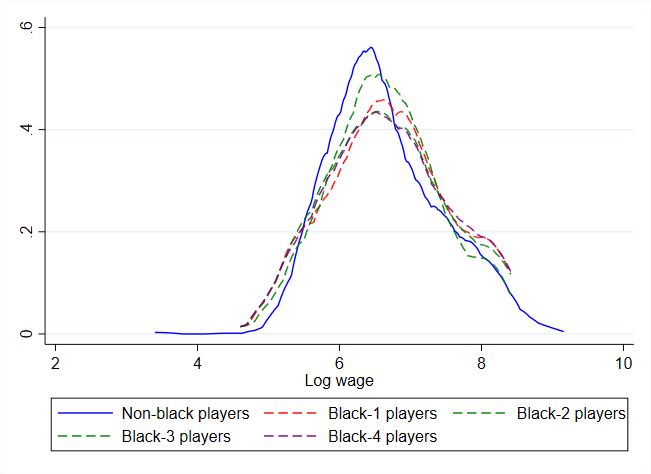
c. Ratings: Black by newspaper d. Log wages: Black - Non-black
They find that light shaded earn wages similar to whites while dark and medium light earn
substantially less.
9Figure 1b shows the average ratings of non-black players by newspaper, Figure
1c does the same for the black players. There are obvious differences between the
newspapers in the ratings. Gazzetta dello Sport has fewer low ratings for non-
black players and in particular for black players. Tuttosport in particular has a
peak of low ratings for black players. Figures 1d shows kernel densities of log
wages. The density is broader for black players in particular because there a more
high wages for black players although in the very high wages non-black players
are over-represented. All in all, we conclude from Figure C.1 that black players
receive lower ratings and higher wages whereas there is not much of a difference
according to the category of black players.
Figure 2: Cumulative distribution of newspaper ratings: black
and non-black players
a. All b. Gazzetta dello Sport
c. Corriere dello Sport d. TuttoSport
Figure 2 shows the cumulative distribution of the newspaper ratings distin-
guished between black and non-black players. Clearly, at the low end of the distri-
10bution the distributions are different with the distribution of the non-black players
shifted somewhat to the right. This difference is present for each of the newspa-
per although somewhat smaller for Gazzetta dello Sport. At the top end of the
distribution the cumulative distributions for black and non-black players are over-
lapping.
Table 1 shows the means of the newspaper ratings and log wages for the two
groups of players as well as the difference between the two. The first row shows
that non-black players on average receive a higher newspaper rating. Whereas
black players on average receive 5.67, non-black players receive 5.78, an absolute
difference of 0.09, a relative difference of 1.6%. As shown, the largest difference in
average rating is for Corriere and TuttoSport with 2.0%. The smallest difference
is for Gazzetta with 1%. Also for wages there is a difference between black and
non-black players, this is 1.1%.
Table 1: Mean newspaper ratings and mean log wages;
black and non-black players
Black Non-black ∆ ∆(%)
a. Ratings All 5.687 5.780 -0.093 -1.6
b. Ratings Gazzetta 5.828 5.884 -0.056 -1.0
Corriere 5.630 5.741 -0.111 -2.0
TuttoSport 5.603 5.714 -0.111 -2.0
c. Log wages 6.634 6.644 -0.010 -1.0
Note: Based on 1835 observations (wage sample 1627 observations)
Figure 2 suggests that the difference in newspaper rating between black and
non-black players is bigger at the low end of the distribution than at the top end.
Therefore, Table 2 shows the differences by quintile. At the lowest quintile indeed
the difference between black players and non-black players is substantially larger.
Whereas the mean difference for the average newspaper rating is 0.093, this is 0.288
at the lowest quintile, equivalent to 5.4%. At the lowest quintile, the difference
between the ratings for non-black and black players is 0.092 for Gazzetta (1.7%),
0.70 for Corriere (7.1%) and 0.43 for TuttoSport (6.6%). The wage difference at
11the bottom quintile is 7.0%. For quite a few ratings the differences become almost
monotonically smaller for higher quintiles even to the extent that for the highest
quintile sometimes the sign of the difference flips. This is the case for the average
ratings and the ratings of Corriere and TuttoSport where at the top quintile black
players receive higher ratings than non-black players. For wages black players
receive less than non-black players at both ends of the distributions and get paid
better in the middle of the wage distribution. That is, unconditional on the quality
of the player as measured by various performance indicators.
Table 2: Differences non-black - black; by quintile
q10 q30 q50 q70 q90
a. Ratings All Black 5.062 5.569 5.780 5.979 6.207
Non-black 5.350 5.690 5.833 5.990 6.177
Difference -0.288 -0.121 -0.053 -0.011 0.030
b. Ratings Gazzetta Black 5.478 5.724 5.880 6.000 6.180
Non-black 5.570 5.780 5.900 6.000 6.200
Difference -0.092 -0.056 -0.020 0.000 -0.020
Corriere Black 4.830 5.550 5.780 6.000 6.282
Non-black 5.200 5.650 5.840 6.000 6.220
Difference -0.370 -0.100 -0.060 0.000 0.062
TuttoSport Black 4.808 5.534 5.790 5.950 6.210
Non-black 5.150 5.647 5.830 5.990 6.190
Difference -0.342 -0.113 -0.040 -0.040 0.020
c. Log wages Black 5.631 6.215 6.551 7.003 7.867
Non-black 5.704 6.215 6.551 7.003 7.824
Difference -0.073 0.000 0.000 0.000 0.043
Based on 1835 observations (wage sample 1627 observations)
4 Empirical Strategy
If media are unbiased, the evaluation of a player performance reflected in the
newspapers ratings should depend only on his on-field skills, regardless of the
color of his skin. We empirically test this hypothesis by using a pooled cross-
section approach that relates an extensive set of performance variables, alongside
12our variable of interest indicating whether the player is black or not, to newspapers
ratings.6 We estimate the following equation:
Rit = βBi + δPit−1 + γXit−1 + ηSt + θTjt + εit (1)
where Rit represents newspaper ratings received by player i in season t, B is a
dummy variable indicating if on the basis of a photograph at least one of the four
individuals labeled the player as black, P is a set of performance related variables
and X is a set of player characteristics, S represents season fixed effects, T is a
set of team fixed effects, δ, γ, η and θ are vectors of parameters and ε is the error
terms. The parameter of main interest is β which measures the effect of being a
black player as compared to a non-black player.
We start our analysis with OLS-estimates of equation (1). In order to inves-
tigate how the effect of being black changes alongside the ratings distribution we
also estimate equation (1) on the pooled sample of players using the Uncondi-
tional Quantile Regression (UQR) approach, also called the Recentered Influence
Function (RIF) method, proposed by Firpo et al. (2009).
The main advantage of the UQR approach over other distributional meth-
ods (i.e., the conditional quantile regression proposed by Koenker and Bassett Jr
(1978)) is that it allows us to analyze the relationship between our variable of
interest and the unconditional distribution of newspaper ratings. This possibility
occurs because the UQR method provides a linear approximation of the uncondi-
tional quantiles of the dependent variable. The law of iterated expectations can
be applied to the quantile being approximated and used to estimate the marginal
effect of a covariate through a simple regression of a function of the outcome vari-
able, the Recentered Influence Function (RIF), on the covariates.
In our setting, the RIF of newspaper ratings is estimated directly from the data
6
Although we have panel data from 2009 to 2018, our main variable of interest, i.e. the racial
status, does not change over time. Thus, it is not possible to use an individual fixed-effects
approach to account for unobserved differences across individuals. The pooled cross-section
nature of the data is taken into account by clustering the standard errors at the level of the
player.
13by first computing the sample quantile q and then estimating the density of the
distribution of ratings at that quantile using kernel density methods. Then, for a
given observed quantile qτ , a RIF is generated, which can take one of two values
depending on whether the observation’s value of the outcome variable is less than
or equal to the observed quantile:
(τ − 1[W ≤ qτ ])
RIF (W ; qτ ) = qτ + (2)
fw (qτ )
where qτ is the observed sample quantile of earnings, τ − 1[W ≤ qτ ] is an indicator
variable equal to one if the observation’s value of ratings is less than or equal to the
observed quantile and zero otherwise, while fw (qτ ) is the estimated kernel density
of ratings at the τth quantile.
The RIF defined in equation (2) is then used as a dependent variable in an OLS
regression on the covariates defined in equations (1). Indeed, the unconditional
quantile of ratings qτ , may be obtained as follows:
qτ = Ex [E(RIF
[ (W ; qτ )|X)] (3)
where RIF
[ (W ; qτ )|X is the estimate of RIF as defined in equation (2), conditional
on covariates X. Thanks to this linear approximation, it is now possible to apply
the law of iterated expectations. Thus, qτ can be written as
qτ = E[X](δbτ ) (4)
where δbτ is the coefficient of the unconditional quantile regression. This lineariza-
tion allows the estimation of the marginal effect of a change in distribution of
covariates X on the unconditional quantile of ratings, measured by the parameter
δbτ .
Next, we implement the Oaxaca–Blinder decomposition (Oaxaca (1973); Blin-
der (1973)) in order to decompose the gap in newspaper ratings between the black
and non-black players into an endowment effect (i.e., explained by differences in
14productivity) and an unexplained effect due to different returns to covariates,
which is typically attributed to discrimination. More formally, OB decomposes the
estimated gap in newspaper evaluations between black (B) and non-black (NB)
players as follows:
RN B − RB = (xN B − xB )βB + xB (βN B − βB ) (5)
where R represents rating (and in some of the estimates R represents log wages).
Then, in order to investigate the distributional gap in ratings evaluations between
back and non-black players we combine the OB decomposition with the RIF as
proposed by Firpo et al. (2018). The differences in estimated newspapers ratings
between black and non-black players each quintile can be decomposed as follows:
[ (RN B , qN Bτ ) − RIF
RIF [ (RB , qBτ ) = (xN B − xB )δB + xB (δN B − δB ) (6)
5 Estimation results
5.1 Parameter estimates
We start our empirical analysis by estimating equation (1) by OLS. Table 3
presents parameter estimates of β for various dependent variables, i.e. average
ratings across the three newspapers, ratings for every newspaper separately and
log wages. Taking all observable characteristics into account, the mean ratings are
0.085 points lower for black players and this is significantly different from zero.
Also for the separate ratings by newspaper there are big and significant differences
in the ratings. Panel c of Table 3 shows that for log wages there is no difference
between black players and non-black players.
The full parameter estimates are presented in Appendix B. There it is shown
that the performance-related variables have effects as might be expected. News-
paper ratings go down with age and wages go up with age although both in a
non-linear way. Being an international does not affect the newspaper ratings but
15Table 3: Mean ratings, mean log wages; Oaxaca Blinder-decomposition
Parameter Oaxaca-Blinder decomposition
estimates Explained Unexplained
a. Ratings All -0.085*** (0.030) 0.046 (0.045) -0.139*** (0.041)
b. Ratings Gazzetta -0.059** (0.030) 0.047 (0.039) -0.104** (0.042)
Corriere -0.095** (0.040) 0.050 (0.053) -0.161*** (0.047)
TuttoSport -0.102*** (0.038) 0.042 (0.057) -0.153*** (0.049)
c. Log wages -0.005 (0.050) -0.012 (0.079) 0.002 (0.045)
Note: Based on 1835 observations (wage sample 1627 observations); all estimates include the complete
set of explanatory variables; the full parameter estimates are presented in Appendix B; standard errors
clustered at the level of the player are in parentheses; *(**): significant at 10(5)%.
has a positive and significant effect on the wage of the player. Skills which have
a direct impact on the final result of the game, such as goals and assists, receive
a higher weight from newspaper evaluators but do not materialize in wages. Red
cards have a negative effect on newspaper ratings but a positive effect on wages.
Pass success rates have a negative effect on newspaper ratings. Clearly, more risky
passes can determine the outcome of a match but also have a higher probability
to fail. Therefore, there are appreciated more than riskless passes over a short
distance that are more likely to be successful as pas but have no influence on the
match outcome. Positive effects on newspaper ratings are also caused by blocks,
fouled, passes. Forwards often receive lower ratings but higher wages while mid-
fielders also receive higher wages relative to defensive players. In general, from
the results in Table 3 we can conclude that all sports newspapers show a degree
of skin-tone bias in their ratings. However, the effect for La Gazzetta is smaller
in magnitude than that for the other two newspapers. This might depend on two
main factors. On one hand, the goodness-of-fit value for this newspaper’s ratings
model suggests better use of the observable data by the journalists employed. On
the other hand, we speculate that the socioeconomic profile of the readership plays
a role here, as the younger and relatively more educated readers of La Gazzetta
(see Section 2) might be less prone to receive racially biased evaluations of players’
performance.
16The parameter estimates presented in Appendix B are used to do an Oaxaca-
Blinder decomposition to investigate to what extend the observed characteristics
between black and non-black players can explain the differences in newspaper
ratings and log wages. The results are shown in Table 3. As shown, for the
newspaper ratings none of the explained part of the black – non-black gap is
significantly different from zero while all the unexplained differences are significant.
Table 4: Unconditional Quintile Regression parameter estimates effects
of being a black player on ratings and log wages
q10 q30 q50 q70 q90
a. Ratings All -0.059*** -0.074*** -0.025 0.012 0.020
(0.017) (0.028) (0.028) (0.029) (0.021)
b. Ratings Gazzetta -0.060*** -0.077*** -0.025 -0.007 -0.014
(0.020) (0.027) (0.033) (0.033) (0.018)
Corriere -0.057*** -0.048* -0.036 0.004 0.040*
(0.019) (0.028) (0.029) (0.030) (0.021)
TuttoSport -0.059*** -0.085*** -0.025 -0.019 0.026
(0.018) (0.028) (0.033) (0.029) (0.020)
c. Log wage -0.015 -0.013 0.039 -0.010 0.030
(0.022) (0.032) (0.033) (0.035) (0.028)
Note: Based on 1835 observations (wage sample 1627 observations); all regressions include
the complete set of explanatory variables. Standard errors clustered at the level of the
player are in parentheses; *(**,***): significant at 10(5,1)%
Table 4 shows the relevant parameter estimates for the unconditional quintile
regressions. The conditional difference in average newspaper ratings between black
and non-black players at the lowest quintile is significant and has a value of 0.23
whereas the unconditional difference is 0.30 (see Table 2). Taking differences in
observed characteristics into account enlarges the black - non-black difference in
average newspaper ratings. Also for the separate newspapers the relevant param-
eter estimates are significant and larger than the differences presented in Table 2.
For wages the difference is insignificant and smaller than the unconditional differ-
ence presented in Table 2. For the average ratings and the ratings of Gazzetta and
Tuttosport also the second quintile from the bottom shows a significant difference
between black and non-black players but for higher quintiles there is no significant
difference. For Corriere also the upper quintile is significant but only at a 10%
17level. For log wages none of the quintile estimates is significant except for the
highest where there is a negative effect that is significant at a 10% level.
All in all, the conclusion from the estimates presented in Table 4 is that the
differences in newspaper ratings between black and non-black players are located
at the bottom of the distribution. However, these differences display a degree of
heterogeneity across newspapers. In particular, it emerges that TuttoSport and
Corriere show a higher level of bias in their rating in particular at the bottom
end of the distribution. On the other side, such bias seems less prominent in
Gazzetta’s ratings, suggesting a better use of the productivity-related information
by its journalists. By and large, for the wages it holds that there are no differences
between black and non-black players.
5.2 Sensitivity analysis
To investigate the robustness of our main findings, we performed some sensitivity
analysis. First, to establish that the bias in newspaper ratings indeed is related to
the subjective judgment of the professional sports journalist we redid the baseline
analysis with a new dependent variable, i.e. the rating based on player performance
characteristics which is published on “whoscored.com” prior to every match. As
in the baseline analysis we use end-of-season ratings as our dependent variable.
Table 5 shows that with this dependent variable there is no significant racial bias.
For reasons of comparison we also include the baseline estimate for the newspaper
ratings in which there is a significant racial bias. This confirms that indeed it is
the subjective judgment of the journalists that is driving our main findings.
Table 5: Effect of “Black”; Comparing newspaper ratings with a rating based on
player performance characteristics
Newspaper rating Performance statistic
Black -0.085*** (0.030) -0.018 (0.013)
N 1835 1771
Note: The full parameter estimates are presented in Appendix B.
Furthermore, we wanted to know whether the racial bias in newspaper ratings
18is at least partly driven by favoritism towards Italian players. After all, in our
sample of Italian players only 3% of the observations is on a black player while
among the non-Italians 37% of the observations is on a black player. It could
be that the bias in newspaper ratings is related to favoritism rather than skin
color. To find out whether favoritism matters we limited the sample to non-black
players. As shown in the first row of Table C.3 there is evidence of favoritism
towards Italian players. On average, conditional on their performance they receive
a higher rating (10% significance). This is also the case for each of the newspapers
although the estimated effect is not significantly different from zero for Corriere.
Table 6: Parameter estimates newspaper ratings – sensitivity analysis subsamples
Sample Parameter All Gazzetta Corriere TuttoSport N
Non-black Italian 0.038* (0.022) 0.045** (0.022) 0.010 (0 .026) 0.059* (0.032) 1488
Non-Italian Black -0.074** (0.035) -0.047 (0.034) -0.091** (0.040) -0.085* (0.046) 866
Baseline Black -0.085*** (0.030) -0.059** (0.030) -0.096** (0.040) -0.102*** (0.038) 1835
Based on 1835 observations; all regressions include the complete set of explanatory variables. Standard
errors clustered at the level of the player are in parentheses; robust standard errors clustered at
the level of the player in parentheses; *** ptest confirms the conclusions of our main analysis. All newspapers show a degree
of rating bias, which is more prominent in Corriere and TuttoSport’s ratings.
Finally, we estimated the Oaxaca-Blinder decomposition based on the parame-
ter estimates related to Table 4. As shown in Appendix C Table C.3 for none of the
newspaper ratings is the contribution of the explained gap significantly different
from zero. The contribution of the unexplained contribution to the ratings differ-
ence is significantly only at the low end of the distribution (with the exception of
the Corriere at the top end of the distribution). For log wages almost all of the
estimates are not significantly different from zero.
6 Conclusions
Using data from the Serie A, the highest professional football league in Italy, we
study the determinants of newspaper ratings of the players in this league. We focus
on whether there is a racial bias, i.e. whether conditional on their performance
black players receive lower ratings than non-black players. We find that there is
such a bias. In an additional analysis on players’ wages, we find no evidence of
wage discrimination from the clubs. Our findings that the difference in results
between finding evidence of discrimination in behavior but not in wages is similar
to the difference in findings for the US NBA basketball league. Price and Wolfers
(2010) conclude that white referees call more fouls against black players and vice
versa while Hill (2004) does not find a racial bias in NBA wages.
We find that the lower ratings for black players are located at the low end of
the distribution of newspaper ratings. This is present for all three newspapers, so
the racial bias is not limited to one newspaper but widely present. However, our
results suggest a degree of heterogeneity in the presence of such bias. Specifically,
TuttoSport and Corriere show a higher degree of racial bias in their published
ratings, while this bias, albeit presents, seems to be much more mitigated in La
Gazzetta’s ratings. These results suggest that the evaluation provided by sports
newspapers do not only reflect on-field performance and are biased against ethnic
groups. This raises concerns for several reasons in particular concerning spillover
20effects from newspaper to football supporters. On the one hand, football fans might
develop adverse preferences towards some players because of their race. This might
be an additional trigger of violence and racism inside and out of the stadiums. On
the other hand, it might generate distortions in markets with monetary prizes (i.e.,
betting, fantasy football).
With our data we are not able to identify the mechanisms at work. We specu-
late that either clubs are not racial biased in the wages they pay. Or, alternatively
for clubs there is sufficient competition to remove racial wage discrimination, i.e.
clubs simply want value for money and are willing to pay market wages for the
players they want. Newspaper football experts do seem to have a racial bias in
their rating of players. In a sensitivity analysis, we find evidence of favoritism
towards Italian players but when taken into account there is still a racial bias. We
hypothesize that this is unconscious discrimination related to stereotyping. Fur-
ther research should be devoted to investigating these by disentangling whether
newspapers implicitly respond to a “demand for discrimination” from their read-
ers or if this is the result of biased evaluators. It is not clear that racial bias
in newspaper ratings is driven by conscious discrimination driven by animus. If
so, one would expect a racial bias in newspaper ratings across the board. This
is not the case. Racial bias seems to be present only at the low end of the skill
distribution. Therefore, it may be that the discrimination is unintentional without
the discriminator being aware. This suggests that exposure to research outcomes
establishing a racial bias may reduce discrimination. There is some evidence on
this. When an academic study on racial bias among professional basketball referees
was published nothing happened to the bias. However, when the study received
media coverage and the awareness of the racial bias was raised, the bias disap-
peared (Pope et al. (2018)). In other words, though unintentional discrimination
is as harmful to the discriminated as intentional discrimination is, there is an easy
cure. Creating awareness by exposure might be able to wipe out racial bias in
newspaper ratings and perhaps also in the behavior of others involved in football
or sports in general. To the extent that there are spillover effects from newspaper
reports to opinions in society, making clear that there is a racial bias will be helpful
21in reducing discrimination across the board.
References
Altonji, J. and R. Blank (1999). Race and Gender in the labor market, pp. 3143–3259.
Handbook of Labor Economics. Amsterdam: Elsevier.
Bertrand, M., D. Chugh, and S. Mullainathan (2005). Implicit discrimination. American
Economic Review 95 (2), 94–98.
Bertrand, M. and E. Duflo (2017). Field experiments on discrimination. In A. V.
Banerjee and E. Duflo (Eds.), Handbook of Field Experiments, Volume 1 of Handbook
of Economic Field Experiments, pp. 309 – 393. North-Holland.
Blinder, A. S. (1973). Wage discrimination: Reduced form and structural estimates.
Journal of Human Resources 8 (4), 436–455.
Bordalo, P., K. Coffman, N. Gennaioli, and A. Shleifer (2016). Stereotypes. Quarterly
Journal of Economics 131 (4), 1753–1794.
Butler, D., R. Butler, and J. Eakins (2021). Expert performance and crowd wisdom:
Evidence from English Premier League predictions. European Journal of Operational
Research 16, 317–331.
Carlana, M. (2019). Implicit stereotypes: Evidence from teachers’ gender bias. Quarterly
Journal of Economics 134 (3), 1163–1224.
Carrieri, V., A. M. Jones, and F. Principe (2020). Productivity shocks and labour market
outcomes for top earners: evidence from italian serie a. Oxford Bulletin of Economics
and Statistics 82 (3), 549–576.
Coupe, T., O. Gergaud, and A. Noury (2018). Biases and strategic behaviour in perfor-
mance evaluation: The case of the FIFA’s best soccer player award. Oxford Bulletin
of Economics and Statistics 80 (2), 358–379.
Firpo, S., N. M. Fortin, and T. Lemieux (2009). Unconditional quantile regressions.
Econometrica 77 (3), 953–973.
Firpo, S. P., N. M. Fortin, and T. Lemieux (2018). Decomposing wage distributions
using recentered influence function regressions. Econometrics 6 (2), 1–40.
Forrest, D., J. Goddard, and R. Simmons (2005). Odds-setters as forecaster: The case
of English football. International Journal of Forecasting 21, 551–564.
22Forrest, D. and R. Simmons (2000). Forecasting sport: the behaviour and performance
of football tipsters. International Journal of Forecasting 16, 317–331.
Gallo, E., T. Grund, and J. J. Reade (2013). Punishing the foreigner: Implicit dis-
crimination in the Premier League based on oppositional identity. Oxford Bulletin of
Economics and Statistics 75 (1), 136–156.
Ginsburgh, V. A. and J. C. van Ours (2003). Expert opinion and compensation: Evidence
from a musical competition. American Economic Review 93 (1), 289–296.
Giuliano, L., D. I. Levine, and J. Leonard (2011). Racial bias in the manager-employee
relationship an analysis of quits, dismissals, and promotions at a large retail firm.
Journal of Human Resources 46 (1), 26–52.
Glover, D., A. Pallais, and W. Pariente (2017). Discrimination as a self-fulfilling
prophecy: Evidence from French grocery stores. The Quarterly Journal of Eco-
nomics 131 (3), 1219–1260.
Goddard, J. and J. O. S. Wilson (2009). Racial discrimination in English professional
football: Evidence from an empirical analysis of players’ career progression. Cambridge
Journal of Economics 33 (2), 295–316.
Goldsmith, A., D. Hamilton, and W. Darity (2006). Shades of discrimination: Skin tone
and wages. American Economic Review, Papers & Proceedings 96 (2), 242–245.
Grogger, J. (2011). Speech patterns and racial wage inequality. Journal of Human
Resources 46 (1), 1–25.
Grogger, J. (2019). Speech and wages. Journal of Human Resources 54 (4), 926–952.
Guryan, J. and K. K. Charles (2013). Taste-based or statistical discrimination: The
economics of discrimination returns to its roots. Economics Journal 123 (572), F417–
F432.
Hill, J. R. (2004). Pay discrimination in the NBA revisited. Quarterly Journal of
Business and Economics 43 (1-2), 81–92.
Koenker, R. and G. Bassett Jr (1978). Regression quantiles. Econometrica 46 (1), 33–50.
Lang, K. and A. Kahn-Lang Spitzer (2020). Race discrimination: An economic perspec-
tive. Journal of Economic Perspectives 34 (2), 68–89.
Lucifora, C. and R. Simmons (2003). Superstar effects in sport: Evidence from italian
soccer. Journal of Sports Economics 4 (1), 35–55.
Neumark, D. (2018). Experimental research on labor market discrimination. Journal of
Economic Literature 56 (3), 799–866.
23Oaxaca, R. (1973). Male-female wage differentials in urban labor markets. International
Economic Review 14 (3), 693–709.
Palacios-Huerta, I. (2014). Beautiful game theory: How soccer can help economics.
Princeton University Press.
Pope, D. G., J. Price, and J. Wolfers (2018). Awareness reduces racial bias. Management
Science 64 (11), 4988–4995.
Preston, I. and S. Szymanski (2000). Racial discrimination in English football. Scottish
Journal of Political Economy 47 (4), 342–363.
Price, J. and J. Wolfers (2010). Racial discrimination among NBA referees. Quarterly
Journal of Economics 125 (4), 1859–1887.
Reilly, B. and R. Witt (2011). Disciplinary sanctions in English Premiership football: Is
there a racial dimension? Labour Economics 18 (3), 360–370.
Szymanski, S. (2000). A market test for discrimination in the English professional soccer
leagues. Journal of Political Economy 108 (3), 590–603.
Zitzewitz, E. (2006). Nationalism in winter sports judging and its lessons for organiza-
tional decision making. Journal of Economics & Management Strategy 15 (1), 67–99.
24Appendices
Appendix A: Details on the data
Figure A.1: The pagelle
Notes: Source: Gazzetta dello Sport, 23 November 2020.
25Table A.1: Variable definitions and summary statistics
Full sample Black Non-black
Variable Definition Mean St. Dev Mean Std. Dev. Mean Std. Dev
Rating Gazzetta Player rating Gazzetta dello Sport 5.87 0.36 5.83 0.46 5.88 0.33
Rating Corriere Player rating Corriere dello Sport 5.72 0.61 5.63 0.76 5.74 0.57
Rating TuttoSport Player rating TuttoSport 5.69 0.63 5.60 0.74 5.71 0.60
Log Wage Player’s wage 6.64 0.80 6.63 0.79 6.64 0.80
Black Indicator for being black 0.19 0.39
Age Player’s age 28.40 4.14 27.17 3.94 28.68 4.14
Goals Total goals 1.97 3.56 1.40 2.40 2.11 3.77
Assists Total assists 1.40 2.11 1.31 2.12 1.42 2.11
Yellow cards Yellow cards received 3.39 3.27 3.13 3.16 3.45 3.30
Red cards Red cards received 0.19 0.44 0.18 0.42 0.20 0.45
SpG Shots per game 0.80 0.83 0.79 0.80 0.80 0.84
PS Pass success percentage 66.48 30.74 67.38 31.53 66.26 30.56
Aerials won Aerial duels won 0.87 0.84 0.79 0.77 0.88 0.85
Tackles Tackles per game 1.34 1.04 1.47 1.09 1.31 1.03
Interceptions Interceptions per game 1.11 0.96 1.11 0.97 1.11 0.96
Fouls Fouls per game 0.97 0.66 1.02 0.69 0.96 0.65
Offsides defensive Offside won per game 0.18 0.33 0.16 0.30 0.18 0.33
Clear Clearances per game 1.95 2.36 1.79 2.31 1.99 2.37
Drb defensive Dribbled past per game 0.53 0.46 0.52 0.46 0.54 0.46
Blocks Outfielder block per game 0.20 0.25 0.19 0.24 0.21 0.25
KeyP Key passes per game 0.61 0.59 0.63 0.61 0.61 0.59
Drb Dribbles per game 0.50 0.57 0.75 0.79 0.44 0.49
Fouled Fouled per game 0.90 0.73 0.91 0.79 0.89 0.71
Offsides offensive Offsides per game 0.15 0.30 0.10 0.19 0.16 0.31
UnsTch Bad control per game 0.58 0.58 0.64 0.60 0.57 0.58
AvgP Passes per game 26.13 17.29 25.94 17.09 26.17 17.35
Crosses Crosses per game 0.31 0.43 0.31 0.43 0.31 0.43
Long B Long balls per game 1.80 1.94 1.76 1.92 1.81 1.95
Thr B Through balls per game 0.08 0.15 0.07 0.12 0.08 0.15
Off Target Shots off target 0.35 0.35 0.36 0.36 0.35 0.35
On Post Shots on post 0.01 0.04 0.01 0.03 0.01 0.04
On Target Shots on target 0.26 0.33 0.24 0.31 0.26 0.34
Blocked Shots blocked 0.19 0.22 0.20 0.22 0.19 0.23
Dispossessed Dispossessed per game 0.70 0.69 0.80 0.73 0.68 0.68
In Acc Cr Inaccurate cross passes 1.10 1.33 1.12 1.38 1.10 1.31
In Acc Crn Inaccurate corner passes 0.16 0.41 0.14 0.33 0.16 0.42
On-field position Defender 0.41 0.49 0.39 0.49 0.42 0.49
Midfielder 0.40 0.49 0.46 0.50 0.38 0.49
Forward 0.19 0.39 0.15 0.36 0.20 0.40
Note: Based on 1835 observations (wage sample 1627 observations);
26Appendix B: Full overview parameter estimates
Ratings Ratings Ratings Ratings Player
Variables All Gazzetta Corriere TuttoSport Log wage performance
Black -0.085*** -0.059** -0.095** -0.102*** -0.005 -0.018
(0.030) (0.030) (0.040) (0.038) (0.050) (0.013)
Age -0.000 -0.020 -0.024 0.042 0.484*** 0.050***
(0.027) (0.023) (0.035) (0.043) (0.054) (0.013)
Age-squared 0.000 0.000 0.001 -0.001 -0.008*** -0.001***
(0.000) (0.000) (0.001) (0.001) (0.001) (0.000)
Goals 0.029*** 0.020*** 0.037*** 0.032*** 0.017** 0.020***
(0.004) (0.004) (0.006) (0.006) (0.007) (0.002)
Assists 0.026*** 0.021*** 0.034*** 0.023*** 0.017* 0.017***
(0.006) (0.004) (0.008) (0.008) (0.009) (0.002)
Yellow cards 0.001 0.000 0.002 -0.000 0.002 -0.004**
(0.003) (0.003) (0.004) (0.004) (0.005) (0.002)
Red cards -0.043*** -0.047*** -0.045** -0.037* -0.003 -0.040***
(0.015) (0.012) (0.020) (0.020) (0.022) (0.006)
SpG -0.015 0.159 -0.015 -0.189 0.069 0.081
(0.150) (0.105) (0.204) (0.222) (0.231) (0.050)
PS -0.009*** -0.004*** -0.011*** -0.012*** -0.002 0.001
(0.001) (0.001) (0.001) (0.002) (0.001) (0.001)
Aerials won -0.053*** -0.033 -0.065*** -0.062** -0.025 0.071***
(0.019) (0.021) (0.022) (0.027) (0.029) (0.006)
Tackles 0.035** 0.038** 0.037 0.031 -0.007 0.118***
(0.017) (0.016) (0.023) (0.023) (0.027) (0.007)
Interceptions 0.046** 0.027* 0.057** 0.053** -0.028 0.099***
(0.018) (0.015) (0.027) (0.025) (0.026) (0.008)
Fouls -0.021 -0.011 -0.040 -0.011 -0.033 -0.025**
(0.029) (0.027) (0.038) (0.038) (0.040) (0.010)
Offsides defensive -0.060 -0.037 -0.103 -0.041 0.136** -0.043**
(0.042) (0.034) (0.069) (0.061) (0.058) (0.019)
Clear 0.033*** 0.012 0.048*** 0.039*** 0.013 0.032***
(0.010) (0.008) (0.013) (0.013) (0.013) (0.005)
Drb defensive -0.033 -0.045 -0.026 -0.027 -0.083* -0.052***
(0.037) (0.032) (0.051) (0.050) (0.048) (0.011)
Blocks 0.276*** 0.132*** 0.313*** 0.384*** -0.062 0.075**
(0.057) (0.045) (0.076) (0.076) (0.083) (0.036)
KeyP -0.067 -0.003 -0.116 -0.083 0.055 0.094***
(0.052) (0.035) (0.073) (0.072) (0.054) (0.014)
27Ratings Ratings Ratings Ratings Player
Variables All Gazzetta Corriere TuttoSport Log wage performance
Drb offensive 0.091*** 0.066*** 0.078*** 0.128*** 0.025 0.171***
(0.022) (0.019) (0.029) (0.032) (0.039) (0.009)
Fouled 0.029 0.019 0.035 0.033 -0.001 0.039***
(0.023) (0.020) (0.032) (0.029) (0.029) (0.010)
Off 0.017 -0.095 0.018 0.127 0.039 -0.009
(0.070) (0.078) (0.090) (0.085) (0.073) (0.020)
Uns Tch 0.054 -0.024 0.124*** 0.062 0.005 -0.052***
(0.034) (0.035) (0.046) (0.051) (0.040) (0.011)
Avg P 0.013*** 0.005*** 0.016*** 0.017*** 0.012*** 0.002***
(0.002) (0.001) (0.003) (0.003) (0.002) (0.001)
Crosses 0.175*** 0.183*** 0.162* 0.182** -0.032 0.125***
(0.065) (0.049) (0.093) (0.089) (0.065) (0.023)
Long B -0.012 0.001 -0.020 -0.018 0.022 0.016***
(0.009) (0.007) (0.014) (0.012) (0.016) (0.006)
Thr B -0.032 -0.122* 0.047 -0.020 0.052 0.071*
(0.079) (0.068) (0.107) (0.115) (0.144) (0.036)
Off Target -0.085 -0.247** -0.022 0.014 -0.007 -0.115**
(0.158) (0.114) (0.214) (0.236) (0.238) (0.053)
On Post 0.076 0.299* -0.143 0.071 0.117 0.350***
(0.273) (0.169) (0.367) (0.385) (0.363) (0.082)
On Target 0.267* 0.084 0.265 0.452** 0.188 0.189***
(0.147) (0.107) (0.204) (0.215) (0.228) (0.054)
Blocked 0.005 -0.096 -0.099 0.210 -0.033 -0.112**
(0.165) (0.117) (0.237) (0.237) (0.245) (0.053)
Dispossessed 0.046 0.010 0.034 0.093** -0.054 -0.033***
(0.033) (0.028) (0.055) (0.044) (0.036) (0.009)
In Acc Cr -0.043** -0.050*** -0.036 -0.042* -0.040** -0.032***
(0.018) (0.017) (0.025) (0.022) (0.019) (0.007)
In Acc Crn -0.052 -0.060** -0.049 -0.046 -0.062 -0.023*
(0.037) (0.027) (0.051) (0.051) (0.057) (0.012)
Forward -0.122** 0.020 -0.176** -0.210** 0.340*** -0.006
(0.057) (0.045) (0.074) (0.083) (0.082) (0.034)
Midfield 0.023 0.054** 0.034 -0.021 0.153*** -0.019
(0.032) (0.026) (0.043) (0.045) (0.057) (0.020)
N 1835 1835 1835 1835 1627 1771
R-squared 0.371 0.266 0.329 0.307 0.672 0.789
Robust standard errors clustered at the level of the player in parentheses; *** pYou can also read