Functional and Social Team Dynamics in Industrial Settings - Hindawi
←
→
Page content transcription
If your browser does not render page correctly, please read the page content below
Hindawi
Complexity
Volume 2020, Article ID 8301575, 18 pages
https://doi.org/10.1155/2020/8301575

Research Article
Functional and Social Team Dynamics in Industrial Settings

          Dominic E. Saadi,1 Mark Sutcliffe,2 Yaneer Bar-Yam,1 and Alfredo J. Morales                                       1,2,3

          1
            New England Complex Systems Institute, Cambridge, MA, USA
          2
            Redzone Production Systems, Miami, FL, USA
          3
            MIT Media Lab, Cambridge, MA, USA

          Correspondence should be addressed to Alfredo J. Morales; alfredom@mit.edu

          Received 27 June 2019; Revised 3 February 2020; Accepted 10 February 2020; Published 23 March 2020

          Academic Editor: Zhile Yang

          Copyright © 2020 Dominic E. Saadi et al. This is an open access article distributed under the Creative Commons Attribution
          License, which permits unrestricted use, distribution, and reproduction in any medium, provided the original work is
          properly cited.
          Like other social systems, corporations comprise networks of individuals that share information and create interdependencies
          among their actions. The properties of these networks are crucial to a corporation’s success. Understanding how individuals self-
          organize into teams and how this relates to performance is a challenge for managers and management software developers looking
          for ways to enhance corporate tasks. In this paper, we analyze functional and social communication networks from industrial
          production plants and relate their properties to performance. We use internal management software data that reveal aspects of
          functional and social communications among workers. We found that distinct features of functional and social communication
          networks emerge. The former are asymmetrical, and the latter are segregated by job title, i.e., executives, managers, supervisors,
          and operators. We show that performance is negatively correlated with the volume of functional communications but positively
          correlated with the density of the emerging communication networks. Exposing social dynamics in the workplace matters given
          the increasing digitization and automation of corporate tasks and managerial processes.

1. Introduction                                                         orders, schedule meetings, and exchange messages, users
                                                                        leave traces in data that reveal the corporation’s patterns of
Corporations are complex systems comprising dynamic                     self-organization [9–11]. Corporations comprise teams, and
social networks where information flows across organiza-                 teams comprise individuals. Understanding how individuals
tional structures [1–5]. People organize their activities in            aggregate into teams, and how teams form corporations, is
corporations such that collective goals can be achieved.                essential to maintaining cohesion and improving perfor-
Communication is key for establishing interdependencies                 mance at scale [12–14].
among individual actions, which include the assignment of                   Corporations can become more complex either because
tasks from managers to workers, reports from workers to                 they grow in size or in the variety of services they supply
managers, and cross communication in informal settings                  [15, 16]. In this process, their substructure becomes more
[2]. The way people choose to communicate and the in-                   important to their performance [5, 13, 17]. According to
formation they share influence the structure of the emerging             Ashby’s law of requisite variety, systems must match the
social networks [6]. Visualizing and analyzing the structure            complexity of their environment in order to be successful
of these networks is crucial for understanding the func-                [18, 19]. By coalescing into teams, assuming specialized
tioning of the social system and intervening to foster efficient          roles, and creating interdependencies among each other,
behaviors [7, 8].                                                       individuals gain collective capabilities that exceed their own
    The introduction of automation and software to organize             and can respond to the increasing demands [20]. The
and conduct corporate work creates the opportunity to                   complementary array of behaviors that emerge from indi-
observe and characterize the structure of corporations’ social          viduals associating into teams is key for building effective
networks through data [6]. By using software to assign work             corporations [21].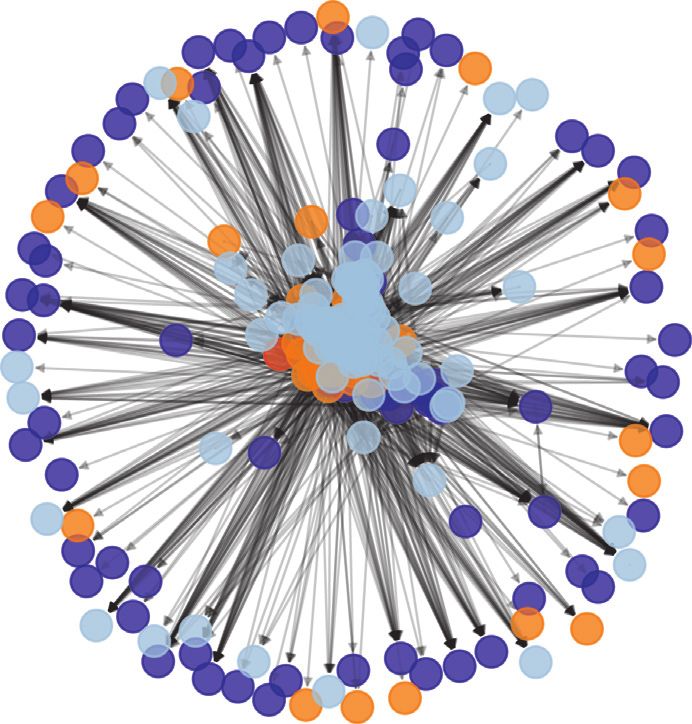
2                                                                                                                                                    Complexity

    Fundamentally, teams are groups of people that work                                            1.0
together and communicate with each other. Communica-
tion is the basis for creating and maintaining trust and                                           0.8
satisfaction among team members [22]. Team communi-
cation falls into two overarching categories: functional and
                                                                                                   0.6
social communications [2, 4, 8, 23]. Functional communi-

                                                                        Job-title assortativity
cations, such as task lists and scheduled meetings, are how
                                                                                                   0.4
work is officially organized and done [2]. Social commu-
nications, such as chatting online, act as a kind of scaffold for
                                                                                                   0.2
functional communication by igniting and fortifying social
relations and the benefits associated with them for the in-
                                                                                                   0.0
dividual and the group [24]. While they are not intentionally
planned, they are essential to a well-functioning corporation.
                                                                                                  –0.2
Understanding the function and interplay of these two
channels of communication is essential to understanding
                                                                                                  –0.4
what makes a team cohesive and more productive
[2, 4, 5, 12].                                                                                           –0.6    –0.4     –0.2       0.0       0.2      0.4
    In this paper, we analyze data from a management                                                                    Degree assortativity
software company in industrial settings and construct and
                                                                                                          Social
characterize their functional and social communication
                                                                                                          Functional
networks. We characterize users and teams by their indi-
vidual and collective behaviors, namely, how they organize         Figure 1: Degree and job-title assortativity coefficients of func-
work (functional communications) and chat with each other          tional and social communication networks for all enterprises. Each
on the software platform (social communications). We               company is shown by two dots representing functional (blue) and
                                                                   social (orange) communication networks. Negative degree assor-
identify patterns of the network structure, such as asym-
                                                                   tativity indicates asymmetry of interactions, and positive job-title
metries and lateral communications, and analyze patterns           assortativity indicates segregation by role.
that improve or degrade team efficacy.
    We show that functional networks are asymmetrical
and social communication networks are segregated by                analyzed in work settings. They may replace formal com-
role or job title. We can observe the difference in behavior        munication in the context of uncertainty [26]. The cohesion
in Figure 1. Companies are shown by two dots repre-                of face-to-face social networks has been positively associated
senting functional (blue) and social (orange) communi-             with higher worker productivity, while the opposite is true in
cation networks. The x-axis represents degree                      email communication [27]. In other settings, social ties have
assortativity, and the y-axis represents job-title assorta-        been observed vertically [4]. The information provided by
tivity (see Sections 4 and 5 for more details). Negative           formal communications might ease managers’ activities,
degree assortativity indicates asymmetry of interactions,          while employees might prefer to communicate informally
and positive job-title assortativity indicates segregation by      [25].
role. In the majority of cases, the two types of networks are          The analysis of team dynamics and performance has
clearly in separate regions of the space.                          been relevant in multiple contexts, including work set-
    This paper is organized as follows: In Section 2, we           tings [28], international organizations [29], military [30],
discuss the related work. In Section 3, we discuss the dataset     sports [31], and gaming [32]. These studies show that team
we analyzed. In Section 4, we explain how we construct             performance depends on communication among mem-
functional and social networks and show their properties. In       bers and other teams [33–37]. Either within or across
Section 5, we compare the structure of both networks, and in       teams, the networked structure of both formal and in-
Section 6, we compare their dynamical behavior. In Section         formal social relationships can improve information
7, we analyze their relationship to efficacy. Finally, in Section    flows, facilitate the coordination of activities, and result in
8, we present our conclusions.                                     better performance [28]. The more evenly the team
                                                                   members communicate with each other, the better the
2. Related Works                                                   teams seem to perform [38]. A more recent study using
                                                                   electronic badges to measure interpersonal communica-
The literature on the implications of functional and social        tion across startups found that the amount of commu-
communication patterns on team performance includes                nication correlates with better performance, though too
many types of corporations and areas. Some studies propose         much communication with other teams seems to be
that functional communication is related to productivity           detrimental [39].
[25], while others report that managers disregard formal               These studies either are qualitative or lack the detailed,
contacts to a surprising extent [4]. The rise in complexity has    fine-grained interaction data as the one we analyze in this
been shown to be related to a decline in hierarchical              paper. For example, while sensors may reveal offline
structures [21]. However, other studies claim that hierar-         communication patterns, the data collected from such
chies persist [5]. Social communications have also been            methods cannot differentiate between formal and informal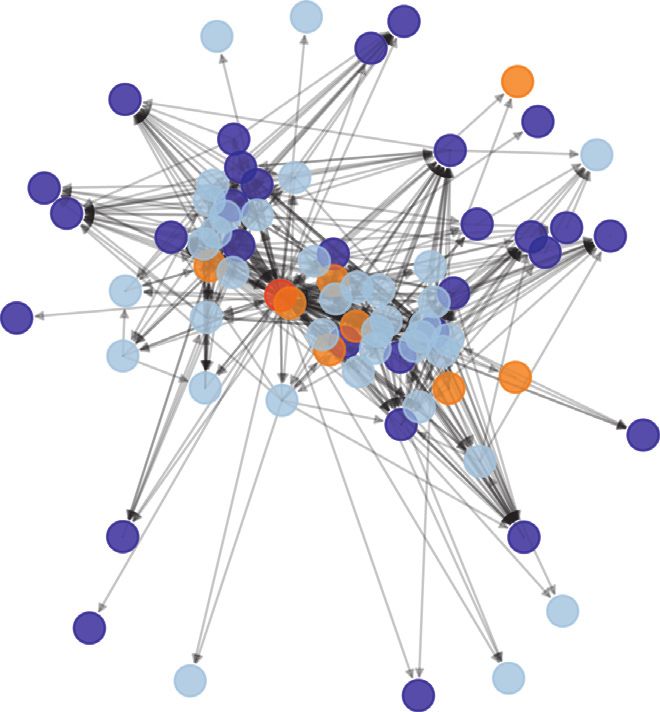
Complexity 3
communications. Understanding the role of these two proportional to the log value of the number of interactions
different types of interactions regarding team performance between any pair of users. These adjacency matrices are
is crucial for creating the right environmental conditions characterized by their sparsity and streaking horizontal lines,
for workers to develop their activities. Moreover, previous which indicate most users are not assigning work orders, but
studies generally lack the opportunity to observe multiple receiving them. This pattern is consistent with the hub-spoke
companies together and usually include single case studies, structure in Figure 2. Core users appear as horizontal
which limits the possibility to generalize results. streaks, while peripheral users account for the matrices’
sparsity. Moreover, core users’ horizontal streaks slice
3. Data through all job titles.
A user’s interaction pattern indicates their role in the
We analyze anonymized communication data from a enterprise. Figure 4 shows in-degree vs out-degree scatter
management software platform that organizes work in plots of select enterprises’ functional communication net-
industrial settings. The software integrates in a single works. Dots represent users, and colors are consistent with
platform both the assignment of work orders, which we their job titles. In-degree (x-axis) measures the number of
define as functional communications, and social interac- work orders a user receives, and out-degree (y-axis) mea-
tions among workers and team members in the form of sures the number of work orders a user assigns. Users above
online chats. These online chats are generally used by the diagonal assign more work orders than they receive.
workers to informally coordinate their activities during These users have leading roles and appear central in the
work hours. In total, we analyze the behavior of 38,137 network visualizations shown in Figure 2. Users below the
distinct users from 197 factories over a period of five years diagonal receive more work orders than they assign and, in
(2013–2018). The distribution of factories’ life-span in the the same figure, appear peripheral. In general, there are more
platform is shown in Supplementary Materials (Section S1). users below the diagonal than above it, which shows that a
Interactions include work-order assignment for functional few leaders account for most workers’ work orders. In some
communications and chats for social communications. cases, such as panels (a) and (i), a clear distinction between
Work orders have a creator and a target. Chats occur as a job titles or roles in teams manifests.
sequence of messages populated freely by workers and team In order to analyze social communication networks, we
members. extract the exchange of messages from each enterprise’s
historical chat data. These chats take place within the
4. Functional and Social management software platform and create the space for
Communication Networks workers and team members to interact and exchange in-
formation about their ongoing activities and work orders.
We first analyze the structure of functional communication We create one network for each enterprise. Nodes repre-
networks by extracting the assignment of work orders from sent users, and edges represent exchanged messages. Edges
each enterprise’s historical data. We create one network for are directed from the message sender to the recipient and
each enterprise. Nodes represent users, and edges represent weighted by the total number of exchanges between each
work-order assignments. Edges are directed from the work- pair of users. Figure 5 shows network visualizations for the
order creator to the assigned user and weighted by the total select enterprises’ social communication networks. Other
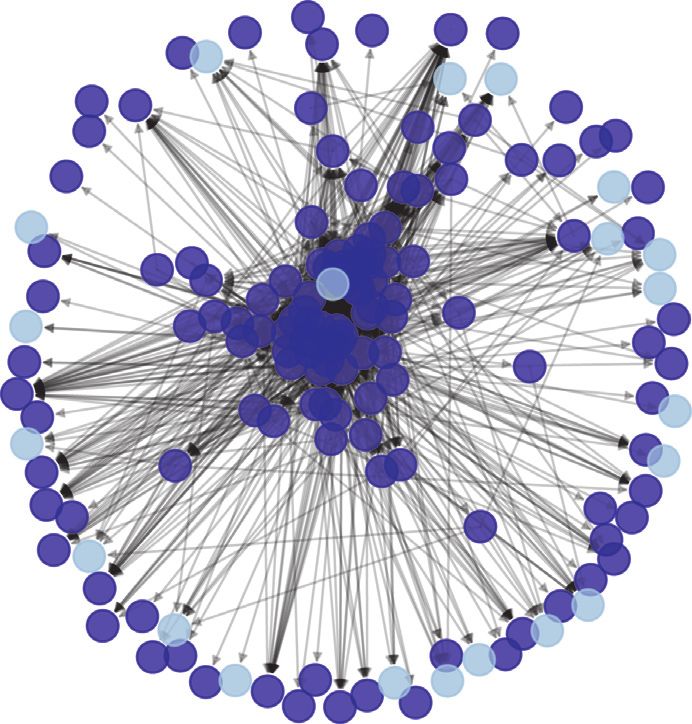
number of interactions between each pair of users. Figure 2 enterprises are shown in Section S2. Users have been
shows network visualizations of select enterprises’ functional colored by their job title: executives in red, managers in
communication networks (other enterprises are shown in dark blue, supervisors in orange, and operators in light
Section S2). Users have been colored by their job title: ex- blue.
ecutives in red, managers in dark blue, supervisors in orange, Social communication networks are characterized by
and operators in light blue. groups. For example, in Figures 5(b), 5(c), and 5(g), a clear
Functional communication networks are characterized preference of users to interact with those with a similar job
by a hub-spoke structure, which consists of a dense core of title manifests, specifically in managers with managers and
users assigning work orders out to users in a radial pe- operators with operators. We visualize the group structure
riphery. The core users are generally higher ranked than the of these networks with their adjacency matrices in a fashion
peripheral users. While the former distribute orders among similar to that in Figure 3, but here we sort users based on
core and peripheral users, the latter seem to only com- the agglomerative clusters they create as they interact.
municate with their superiors. Figure 6 shows the clustered adjacency matrices of the
An alternative method for visualizing a network’s in- select enterprises’ social communication networks pre-
teraction patterns is the adjacency matrix. Adjacency ma- sented in Figure 5. The number of clusters generally cor-
trices show the interactions between any pair of users responds to the groups observed in the networks of
organized in rows and columns. Figure 3 shows adjacency Figure 5. In panels (a), (b), and (c), clusters are clearly
matrices of the select enterprises’ functional communication visible in both the network and the matrices. In some cases,
networks presented in Figure 2. Users have been sorted by the matrices reveal groups that are not apparent (e.g., panel
their job title and their number of work-order assignments. (f )). This result contrasts the previous study [4], which
Row users are sending work orders, while column users states social ties are more likely to be made vertically than
are receiving them. The color (from white to black) is horizontally.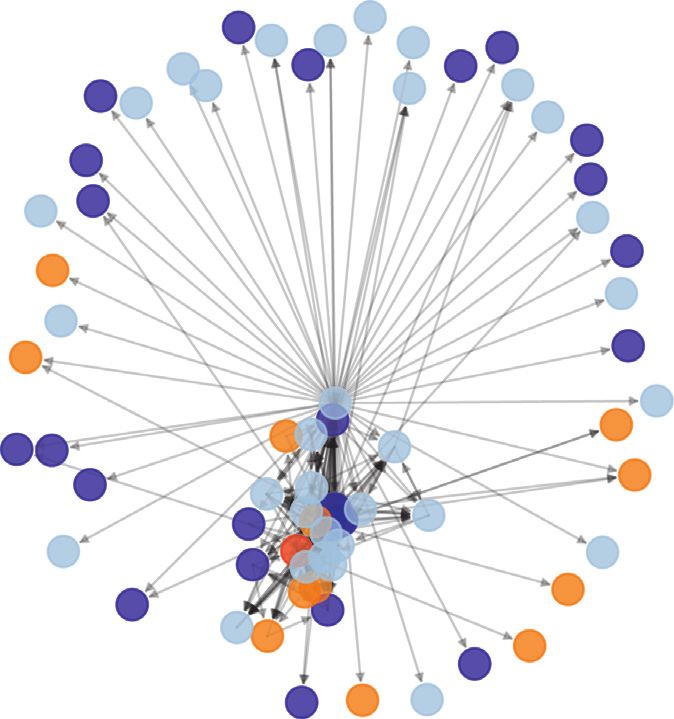
4                                                                                                                                Complexity

                          (a)                                         (b)                                        (c)

                          (d)                                         (e)                                        (f )

                          (g)                                         (h)                                         (i)

Figure 2: Visualization of functional communication networks from select enterprises. Distinct networks represent different enterprises.
Nodes are user colored by their role (red is for an executive, dark blue is for a manager, orange is for a supervisor, and light blue is for an
operator). Directed edges are work orders. Networks have a hub-spoke shape, consisting of a middle core and a radial periphery. Nodes were
positioned using the Fruchterman–Reingold force-directed algorithm [40]. Other enterprises are shown in Section S2.

5. Comparing Functional and Social                                          (communications), density, average clustering coefficient,
   Communication Networks                                                   inequality in connections (measured via the Gini coefficient
                                                                            of the degree distribution), and assortativity by degree and
We compare functional and social communication networks                     job title. We calculate these metrics for each network and
by analyzing multiple network features. These features                      analyze their distribution across all enterprises. The results
summarize the network structure as scalar values we can use                 are presented in Figure 7, and a set of statistical tests is
to compare types of communications within and across                        shown in Table 1.
companies. Specifically, we study the following network                          We measure the density of the network as the relative
properties: the number of nodes (users), number of edges                    number of existing edges with respect to all those possible.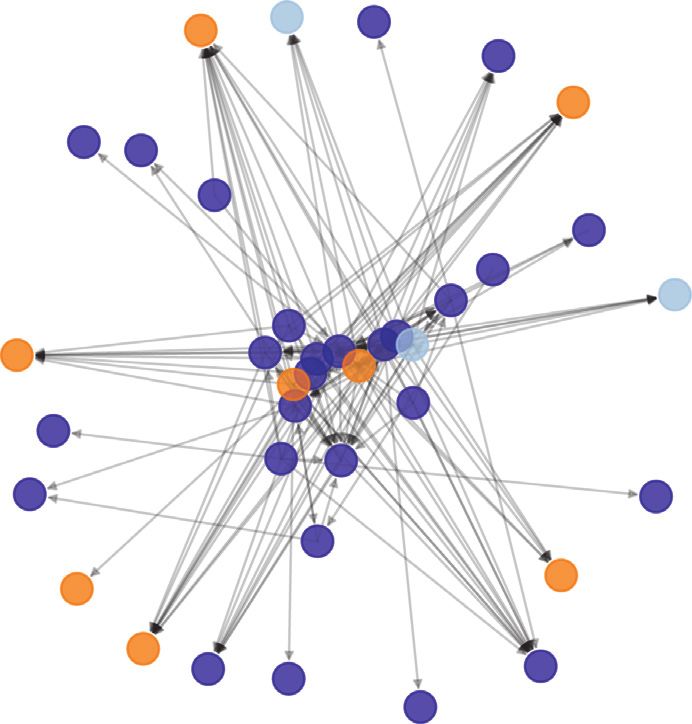
Complexity                                                                                                                                   5

                         (a)                                          (b)                                         (c)

                         (d)                                          (e)                                         (f )

                         (g)                                          (h)                                         (i)

Figure 3: Adjacency matrices of functional communication networks from select enterprises. Color intensity indicates the log value of the
weighted number of edges. Horizontal and vertical lines divide matrices into labeled, role-specific sections (red is for an executive, dark blue
is for a manager, orange is for a supervisor, and light blue is for an operator). Diagonal squares are areas of intrarole communication, and
others are areas of interrole communication. Adjacency matrices are sparse and distinguished by their streaking horizontal lines. Other
enterprises are shown in Section S2.

Density values lie between 0 and 1 and show how dense or                    networks is higher than that in functional ones (Figure 7(d)).
sparse networks are. The networks emerging from social                      The clustering coefficient counts the relative number of tri-
communications seem to be denser than the ones arising                      angular connections with respect to all those possible. It also
from functional interactions (Figure 7(c)). This is con-                    goes from 0 to 1 and shows that functional networks are less
sistent with the network visualizations and matrices                        cohesively connected than social communications.
shown in Figures 2–6. The radial topology of functional                         Functional networks are more centralized. We measure
networks creates a less dense structure than the clustered                  centralization via the Gini coefficient of the degree distri-
groups of social communications. Correspondingly, the                       bution for all networks (Figure 7(e)). The Gini coefficient of
average clustering coefficient in social communication                        the degree distribution quantifies the unequal concentration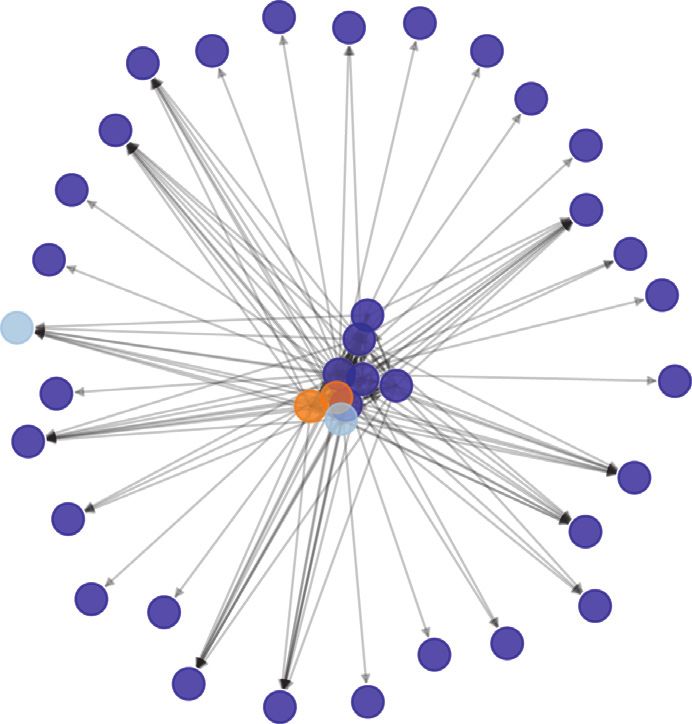
6 Complexity
105
102
102 104
103
101
Out-degree
Out-degree
Out-degree
101
102
101
100 100
100
0 0 0
0 100 101 102 0 100 101 102 0 100 101 102 103 104 105
In-degree In-degree In-degree
(a) (b) (c)
103 106
104
105
102 103 104
Out-degree
Out-degree
Out-degree
102 103
101
102
101
101
100 100 100
0 0 0
0 100 101 102 103 0 100 101 102 103 104 0 100 101 102 103 104 105 106
In-degree In-degree In-degree
(d) (e) (f )
105 104
104
101 103
103
Out-degree
Out-degree
Out-degree
102
102
101
101
100
100 100
0 0 0
0 101
0 100 101 102 103 104 105 0 10 0 100 101 102 103 104
In-degree In-degree In-degree
(g) (h) (i)
Figure 4: In-degree vs out-degree scatter plots of functional communication networks from select enterprises. Dots are user colored by their
role (red is for an executive, dark blue is for a manager, orange is for a supervisor, and light blue is for an operator). Dots above the diagonal
are users that assign more work orders than they receive. Dots below the diagonal are users that receive more work orders than they assign.
Dots near the diagonal are users that assign approximately as many work orders as they receive.
of edges among highly connected nodes. It also ranges We also analyze mixing patterns such as an asymmetrical
between 0 and 1, with 0 being the case where connections are structure and preference of users to segregate interactions
equally distributed among all nodes and 1 being the case based on job title. We quantify such mixing patterns using
where the most connected node gathers all possible con- assortativity [43], which measures the tendency of nodes to
nections. This metric is often used to estimate income in- be connected to those that are similar. For an asymmetrical
equality. In this case, the Gini coefficient of functional structure, we measure the tendency of nodes to be con-
networks is consistently higher than the one from social nected based on their degree. For segregation, we measure
communications, which suggests that functional networks the tendency of nodes to be connected based on their job
seem to be more hierarchical. title.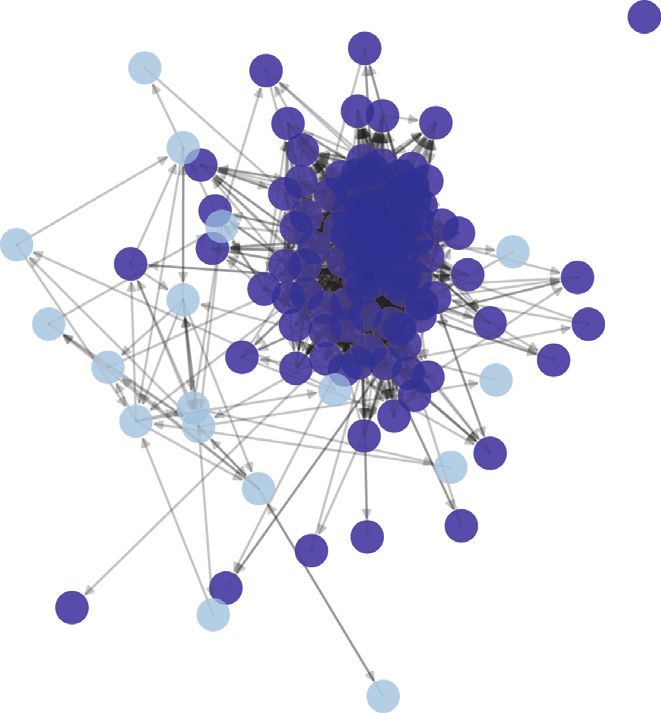
Complexity                                                                                                                                        7

                           (a)                                          (b)                                          (c)

                           (d)                                          (e)                                          (f)

                           (g)                                          (h)                                           (i)

Figure 5: Visualization of social communication networks from select enterprises. Distinct networks represent different enterprises. Nodes
are user colored by their role (red is for an executive, dark blue is for a manager, orange is for a supervisor, and light blue is for an operator).
Edges are directed and represent messages in online chats. Other enterprises are shown in Section S2.

    Assortativity by degree measures the similarity of con-                   indicates that connections are drawn independently. In
nections in the network with respect to node degree by                        Figure 7(f ), we show the histogram of the assortativity by
calculating the Pearson correlation of degrees at each end of                 degree coefficient of all enterprises and both types of
the edges. Positive assortativity means that nodes are linked                 communication networks (blue for functional and orange
to those with a similar degree of connectivity. Negative                      for social). Functional communication networks have a
assortativity indicates that highly connected nodes are linked                negative assortativity by degree, while social ones have no
to poorly connected ones. If the correlation is zero, it                      correlation. This shows that functional communication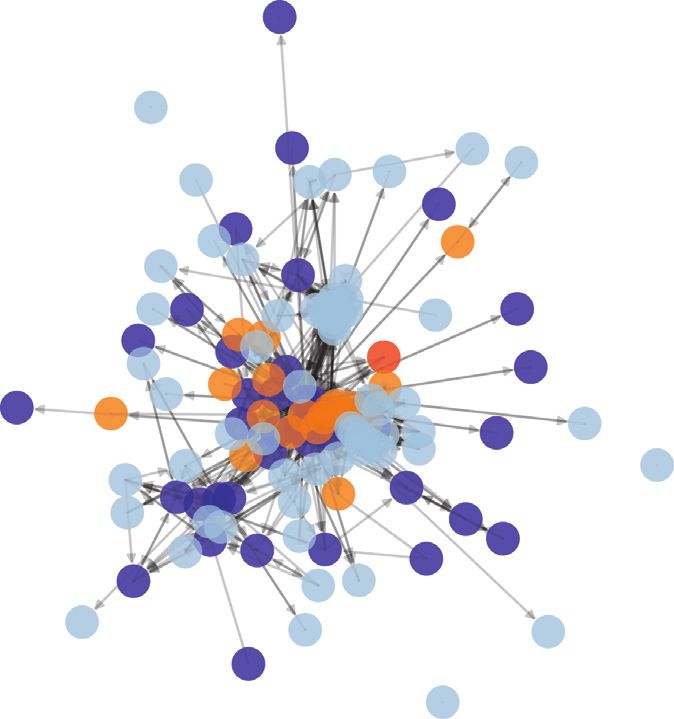
8                                                                                                                            Complexity

                       (a)                                          (b)                                         (c)

                       (d)                                          (e)                                         (f )

                       (g)                                          (h)                                         (i)

Figure 6: Clustered adjacency matrices of social communication networks from select enterprises. Color intensity indicates the log value of
the number of weighted edges. Nodes are sorted using an agglomerative clustering algorithm [41, 42]. The dendrogram representing the
sorting results is shown together with its respective matrices.

networks are more asymmetrical than social ones. This is                  asymmetrical communication structures persist in organi-
related to the hub-spoke structure in Figure 2 and reflects the            zations, especially in more traditional ones [5].
organization of leadership in the enterprise. Previous work                    We measure the segregation of interactions by job title
shows that networks of acquaintances, sexual interactions,                using assortativity by attribute (the attribute being job
and celebrities generally show positive assortativity by de-              title). Positive values show segregation of interactions by
gree [43], which demonstrates that the functional com-                    job title, while zero shows no correlation. In Figure 7(g),
munication networks in enterprises are not behaving like                  we show that social networks (orange) are much more
regular social networks. Moreover, it has been reported that              segregated by job title than functional networks, where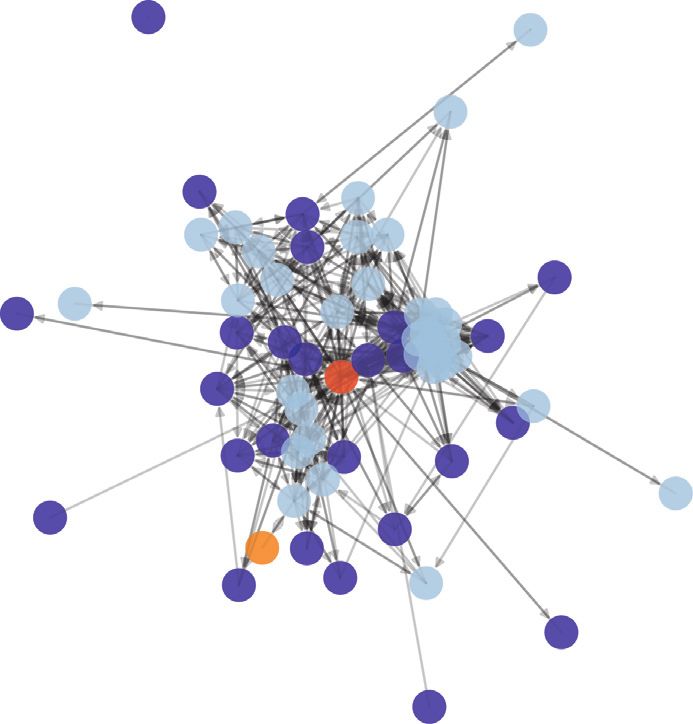
Complexity                                                                                                                                                                    9

      0.20                                                  0.20                                                                0.35
                                                                                                                                0.30
      0.15                                                  0.15
                                                                                                                                0.25
                                                                                                                                0.20
      0.10                                                  0.10

                                                      PDF

                                                                                                                          PDF
PDF

                                                                                                                                0.15

                                                            0.05                                                                0.10
      0.05
                                                                                                                                0.05

      0.00                                                  0.00                                                                0.00

             100       101       102      103                             101        103       105         10   7                      0.0     0.2     0.4   0.8      0.8   1.0
                          No. of users                                      No. of communications                                                      Density

                   Functional                                              Functional                                                         Functional
                   Social                                                  Social                                                             Social
                           (a)                                                      (b)                                                               (c)
      0.20                                                  0.20                                                                0.20

      0.15                                                  0.15                                                                0.15
PDF

                                                      PDF

      0.10                                                  0.10                                                                0.10

                                                                                                                          PDF
      0.05                                                  0.05                                                                0.05

      0.00                                                  0.00
                                                                                                                                0.00
             0.0    0.2    0.4     0.6    0.8   1.0                 0.0     0.2      0.4     0.6     0.8            1.0
                                                                                                                                       –1.0      –0.5     0.0       0.5     1.0
                       Average clustering                                         Gini coefficient
                                                                                                                                                  Degree assortativity
                   Functional                                             Functional
                                                                                                                                              Functional
                   Social                                                 Social
                                                                                                                                              Social
                          (d)                                                       (e)                                                               (f )
                                                            0.4

                                                            0.3
                                                      PDF

                                                            0.2

                                                            0.1

                                                            0.0
                                                                   –1.0     –0.5       0.0       0.5                1.0
                                                                            Job-title assortativity
                                                                          Functional
                                                                          Social
                                                                                    (g)

Figure 7: Properties of functional (blue) and social (orange) communication networks for all enterprises. (a) Distributions of a number of
users. (b) Distributions of a number of communications. (c) Distribution network density. (d) Distribution of average clustering. (e)
Distribution of Gini coefficients of the degree distributions. (f ) Distribution of degree assortativity coefficients. Negative values indicate
asymmetrical interactions. (g) Distribution of job-title assortativity coefficients. Positive values indicate segregated interactions. A set of
statistical tests comparing these distributions is shown in Table 1.

work orders are assigned across different types of em-                                          We estimate the significance of the differences among
ployees. This is consistent with the horizontal streaks                                    distributions arising from functional and social communica-
present in the matrices of Figure 3.                                                       tion networks by performing a set of statistical tests on each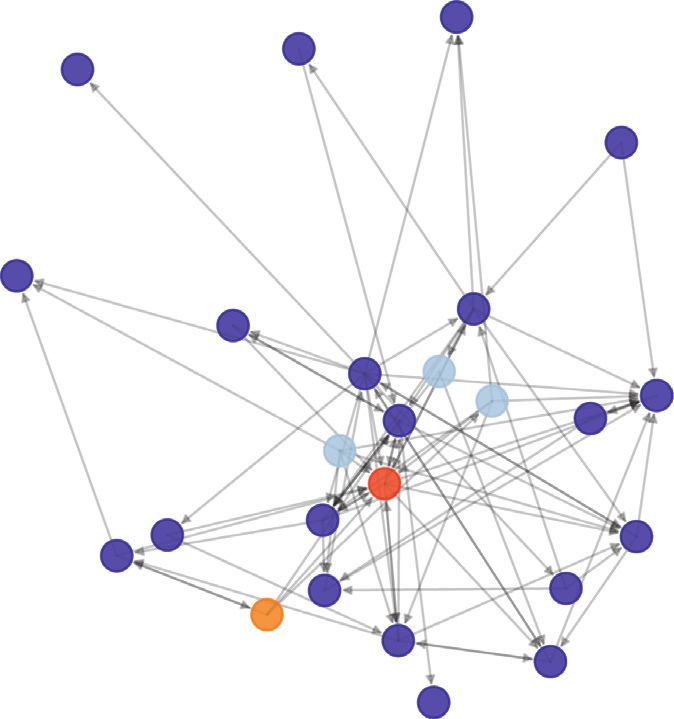
10                                                                                                                          Complexity

Table 1: Statistical tests comparing the distributions of network       platform. On the other side, the average clustering seems to
features from functional and social communication networks. The         rapidly converge over time and remain stable.
Kolmogorov–Smirnov (KS) test measures whether samples come                   The average Gini coefficient increases over time among
from the same distribution. Welch’s t-test is two-sided and mea-        both functional and social communication networks. This
sures whether two distributions have the same average. The dis-         means that new connections disproportionally originate or
tributions and averages significantly differ among functional and
                                                                        are directed to those nodes that already account for a large
social communication networks across all features.
                                                                        number of connections. While such a principle is related to
                                 KS test           Welch’s t-test       the rich-get-richer mechanism [7], the values we obtain are
Feature                    Test                   Test                  considerably higher than artificial Barabasi–Albert or real
                                     p value               p value
                          value                  value                  friends’ networks [47]. Moreover, consistently with the results
No. of users              0.25      1.53e − 05   5.53    7.194e – 08    presented in Section 5, the Gini coefficient of functional
No. of                                                                  networks is always higher than that of social communications
                          0.43      2.34e − 16    5.96    1.22e – 08
communications                                                          (Figure 8(e)), indicating that, at every point in time, most
Average clustering        0.31      2.93e − 08   −7.31    1.77e – 12    functional networks are more centralized.
Job-title assortativity   0.95      3.12e − 95   −39.59   7.76e – 136        Figure 8(f ) shows the assortativity by degree coefficient of
Degree assortativity      0.74      1.55e − 15   −20.70   1.38e – 64    all enterprises over time. Across the whole observation period,
Gini coefficient            0.25      1.53e − 05    1.96        0.05
                                                                        functional communication networks have a negative assor-
Density                   0.39      5.84e − 13   −9.13     1.11e – 17
                                                                        tativity by degree, while social ones have no correlation. This
                                                                        shows that functional communication networks are consis-
network feature. In particular, we apply (i) the Kolmogor-              tently more asymmetrical than social communication net-
ov–Smirnov test to measure whether the feature distributions            works. On the contrary, Figure 8(g) shows that social
of functional and social networks are the same and (ii) Welch’s         networks (orange) are increasingly more segregated by job
t-test to measure the difference between their averages. The             title than functional ones. While the segregation by job title in
results are presented in Table 1. Both the distributions and            functional networks stays roughly uncorrelated, social net-
averages significantly differ among both types of networks                works become more and more segregated over time. This
across all features (p < 0.001 in all cases, with the exception of      shows that functional networks are used for communication
the Gini coefficient for social networks, where p < 0.05).                across layers of the organization, while social communication
                                                                        is used among team members of similar level.
6. Dynamics of Network Metrics                                               In order to further analyze the group structure in
                                                                        functional and social communication networks, we calculate
We analyze the dynamics of functional and social commu-                 the average number of communications over time among the
nication networks by calculating the evolution of network               different job titles and across all companies. Results for social
features over time. We calculate these metrics cumulatively             communications are shown in Figure 9 and for functional
for each network at each month. The monthly data are then               communications in Figure 10. In both figures, (a) to (d) show
normalized into ten equally spaced bins between each                    communications originated from supervisors, managers,
company’s earliest and oldest work orders. In Figure 8, we              operators, and executives, respectively. In each panel, orange,
present the average curve across all companies and error bars           blue, light blue, and red lines show communications being
representing the standard error for each feature.                       received by supervisors, managers, operators, and executives,
    Figures 8(a) and 8(b) show the distributions of network             respectively. In social networks, the number of segregated
size in terms of users and edges over time. For both types of           communications by job title increases remarkably faster than
networks, the number of users grows linearly, while the                 the number of crossed interactions (Figure 9). In the case of
number of communications grows supralinearly. The dif-                  supervisors (Figure 9(a)), such an increase seems to be linear,
ferent growth rates between population and interactions                 while in the case of managers (Figure 9(b)) and operators
are consistent with scaling laws of human behavior [44].                (Figure 9(c)), the number of segregated communications
Just like communication in cities and other social systems              seems to accelerate in time. On the contrary, the segregation
[45], the number of possible interacting individuals increases          of formal communications is not analogous. In this case, top-
explosively due to a combinatoric effect of the existing pop-            down communications seem to be more (or just as) relevant
ulation. As systems grow, the number of combinations in-                as the segregated interactions.
creases much faster than the number of elements. Similar
scaling laws have explained GDP growth and technological                7. Characterizing Enterprise Efficacy
innovation [46]. In terms of management, it shows that the
number of possible teams that can arise from a set of workers           In order to determine how functional and social commu-
grows faster than the size of the company [16].                         nication network patterns influence enterprise efficacy, we
    Through time, social communication networks seem to                 define a score per enterprise based on the timely completion
be more cohesive than functional networks, which is shown               of their work orders. We define a work order’s score
in a consistently higher network density (Figure 8(c)) and              according to the following equation:
average clustering coefficient (Figure 8(d)). Although seem-                                           d −c
ingly converging, the network density slightly decreases over                                   si � i i ,                      (1)
                                                                                                     di − ai
time which can be due to the addition of new users to the
Complexity 11
1.0 1.0 1.0
0.8 0.8 0.8
No. of communications
No. of users
0.6 0.6 0.6
Density
0.4 0.4 0.4
0.2 0.2 0.2
0.0 0.0 0.0
0.0 0.2 0.4 0.6 0.8 1.0 0.0 0.2 0.4 0.6 0.8 1.0 0.0 0.2 0.4 0.6 0.8 1.0
Time Time Time
Functional Functional Functional
Social Social Social
(a) (b) (c)
1.0 1.0 1.00
0.75
0.8 0.8
0.50
Degree assortativity
Average clustering
Gini coefficient
0.6 0.6 0.25
0.00
0.4 0.4 –0.25
–0.50
0.2 0.2
–0.75
0.0 0.0 –1.00
0.0 0.2 0.4 0.6 0.8 1.0 0.0 0.2 0.4 0.6 0.8 1.0 0.0 0.2 0.4 0.6 0.8 1.0
Time Time Time
Functional Functional Functional
Social Social Social
(d) (e) (f)
1.00
0.75
0.50
Job-title assortativity
0.25
0.00
–0.25
–0.50
–0.75
–1.00
0.0 0.2 0.4 0.6 0.8 1.0
Time
Functional
Social
(g)
Figure 8: Dynamics of properties of functional (blue) and social (orange) networks for all enterprises. (a) No. of users per functional and
social networks over time. (b) No. of communications per functional and social networks over time. (c) Density per functional and social
networks over time. (d) Average clustering per functional and social networks over time. (e) Gini coefficients for functional and social
networks’ degree distributions over time. (f ) Degree assortativity for functional and social networks over time. (g) Job-title assortativity for
functional and social networks over time. Error bars indicate the standard error.12 Complexity
4000
8000
No. of social communications
No. of social communications
3000
6000
2000
4000
1000 2000
0 0
0.0 0.2 0.4 0.6 0.8 1.0 0.0 0.2 0.4 0.6 0.8 1.0
Time Time
Supervisor-supervisor Manager-supervisor
Supervisor-manager Manager-manager
Supervisor-operator Manager-operator
Supervisor-executive Manager-executive
(a) (b)
16000
400
14000
350
12000
No. of social communications
No. of social communications
300
10000
250
8000
200
6000 150
4000 100
2000 50
0 0
0.0 0.2 0.4 0.6 0.8 1.0 0.0 0.2 0.4 0.6 0.8 1.0
Time Time
Operator-supervisor Executive-supervisor
Operator-manager Executive-manager
Operator-operator Executive-operator
Operator-executive Executive-executive
(c) (d)
Figure 9: Average number of level-to-level communications of social networks over time for all enterprises. (a–d) Communications
originated by supervisors, managers, operators, and executives, respectively. Orange, blue, light blue, and red lines show communications
directed to supervisors, managers, operators, and executives, respectively. Error bars indicate the standard deviation. An analogous plot for
formal communications is shown in Figure 9.
where a i is the time when the work order i was assigned, the work order was completed earlier than scheduled, a
d i is the time it was due, c i is the time it was completed, positive score indicates the work order was completed
and s i is the resulting score. A negative score indicates late, and a score of zero indicates the work order wasComplexity 13
350000
35000
300000
30000
No. of formal communications
No. of formal communications
250000
25000
200000
20000
150000
15000
100000
10000
5000 50000
0 0
0.0 0.2 0.4 0.6 0.8 1.0 0.0 0.2 0.4 0.6 0.8 1.0
Time Time
Supervisor-supervisor Manager-supervisor
Supervisor-manager Manager-manager
Supervisor-operator Manager-operator
Supervisor-executive Manager-executive
(a) (b)
80000 160000
70000 140000
60000 120000
No. of formal communications
No. of formal communications
50000 100000
40000 80000
30000 60000
20000 40000
10000 20000
0 0
0.0 0.2 0.4 0.6 0.8 1.0 0.0 0.2 0.4 0.6 0.8 1.0
Time Time
Operator-supervisor Executive-supervisor
Operator-manager Executive-manager
Operator-operator Executive-operator
Operator-executive Executive-executive
(c) (d)
Figure 10: Average number of level-to-level communications of functional networks over time for all enterprises. (a–d) Communications
originated by supervisors, managers, operators, and executives, respectively. Orange, blue, light blue, and red lines show communications
directed to supervisors, managers, operators, and executives, respectively. Error bars indicate the standard deviation. An analogous plot for
social communications is shown in Figure 9.
completed on time. In general, lower scores indicate median score. Efficacy varies across enterprises.
better efficacy. Figure 11(a) shows the time series of the efficacy score for
We analyze efficacy on monthly basis. We aggregate companies that have been active for at least one year. In
enterprises’ work orders per month and calculate their general, companies go through a transition period before14 Complexity
1 1 1 1 1 1 1
0 0 0 0 0 0 0
1 1 1 1 1 1 1
0 0 0 0 0 0 0
1 1 1 1 1 1 1
0 0 0 0 0 0 0
1 1 1 1 1 1 1
0 0 0 0 0 0 0
1 1 1 1 1 1 1
0 0 0 0 0 0 0
1 1 1 1 1 1 1
0 0 0 0 0 0 0
1 1 1 1 1 1 1
0 0 0 0 0 0 0
1 1 1 1 1 1 1
0 0 0 0 0 0 0
1 1 1 1 1 1 1
0 0 0 0 0 0 0
1 1 1 1 1 1
Score
0 0 0 0 0 0
0 0.5 1
Time
(a)
0.200
0.175
0.150
0.125
PDF
0.100
0.075
0.050
0.025
0.000
–2.0 –1.5 –1.0 –0.5 0.0 0.5 1.0 1.5 2.0
Score
(b)
Figure 11: Efficacy score for selected enterprises. (a) Efficacy score time series of enterprises with at least one year of activity. (b)
Distribution of the monthly efficacy score over the last year of activity.
stabilizing their score. Figure 11(b) shows the distribu- behind the first peak comprises a small set of effective
tion of enterprises’ monthly scores over the last year of enterprises.
activity where the behavior is mainly stable. The distri- We correlated monthly network features with the cor-
bution is bimodal, with a peak just below zero and an- responding scores for each enterprise in order to determine
other, more prominent peak between zero and one. Since the influence of each property on efficacy. We consider only
a score of si � 0 indicates that the work order is done on the last twelve months of activity. Analogously with scores,
time, the smaller peak below zero is enterprises that are network features are also calculated on the monthly basis
completing the majority of their work orders early. The without aggregating edges across months. We characterize
larger peak between zero and one indicates that most each corporation with the following network properties for
enterprises are completing a majority of their work or- both functional and social interactions: the number of nodes
ders late. A score of si � 1 indicates that the work order (users), number of edges (communications), average clus-
took 100% or more of the time allotted. The tail trailing tering, assortativity by degree and job title, inequality inComplexity 15
Table 2: Correlation coefficients of functional and social com- Table 3: Principal component analysis (PCA) of functional and
munication network features with the efficacy score. Positive co- social communication networks and efficacy score. Coefficients of
efficients indicate that the feature correlates with a worse score. each feature for the first (PC-1) and second (PC-2) components are
Negative coefficients indicate that the feature correlates with a shown. Together, the main two components explain up to 76% of
better score. The number of users and that of communications are the variance (explained variance by component in parentheses).
in the logarithmic scale. Correlations coefficients are significant
(p < 0.001). Not significant coefficients are not shown. PC-1 (55%) PC-2 (21%)
Functional Social Functional Social
Network
No. of users −0.26 −0.19 −0.05 −0.18
Functional Social No. of communications −0.91 −0.23 0.28 −0.91
No. of users 0.27 0.20 Average clustering −0.02 0.01 −0.04 −0.12
No. of communications 0.27 — Degree assortativity 0.01 −0.01 0.03 0.02
Average clustering — −0.17 Job-title assortativity −0.01 −0.04 0.08 −0.16
Degree assortativity — 0.17 Gini coefficient −0.05 −0.03 0.01 −0.04
Job-title assortativity 0.26 — Density 0.02 0.05 −0.002 −0.03
Gini coefficient 0.17 — Efficacy score −0.10 0.08
Density −0.11 −0.23
each component. The first component (PC-1) is dominated
connections (measured via the Gini coefficient of the degree by the number of functional communications, and the
distribution), and density. In Table 2, we present the cor- second component (PC-2) is dominated by the number of
relation of these features with the scores. A negative cor- social communications. In both cases, the components are
relation indicates an improvement of efficacy, and a positive in the inverse direction of the number of communications,
correlation shows a deterioration. Missing correlations are meaning that features in the direction of the component are
not statistically significant. inversely proportional to the number of communications.
The number of users in both functional and social Good scores are in the direction of the first component, and
communication networks is correlated with inefficacy bad scores are in the direction of the second component.
(positive correlation coefficient with the score), which may Similarly, network density and average clustering in social
mean that larger corporations perform worse than smaller communications increase in the direction of the first
ones. Analogously, the number of functional communi- component and decrease in the direction of the second.
cations is associated with a worse efficacy, which can be This shows that effective companies are characterized for
related to the size of the company, but may also indicate having less functional communication and higher social
that adverse times require more communication for communication—especially in terms of the density and
completing tasks. Inequality in functional interactions and clustering of connections.
the degree assortativity of social networks correlate posi- In order to understand these composite relationships, we
tively with the score, meaning that more asymmetrical present scatter plots of the two main components in Fig-
networks are associated with inefficacy. Efficacy is instead ure 12. Each dot is a company at a given month, and the
associated with the density of the networks. Density cor- location in the scatter plot shows the dot product of the
relates negatively with the score, meaning that effective company’s feature vector and the corresponding component
teams are characterized for having a larger number of (PC-1 in the x-axis and PC-2 in the y-axis). Panels are
interacting individuals. This is also reflected in the average colored by different features (see titles). We identify three
clustering of social networks. The correlation of other regions in the space. Region A corresponds to big companies
metrics with the score does not seem to be statistically (red and green dots in panels (a) and (e)). Region B shows
significant. An analogous analysis applied to the average effective companies (blue dots in panel (i)). Region C shows
behavior over time rather than the monthly breakdown is ineffective companies (red dots in panel (i)). Big companies
shown in Supplementary Materials (Section S3). The results in region A are generally more ineffective than smaller
are consistent. companies in regions B and C. Effective companies in region
Finally, we study the aggregate structure of the data by B are characterized for having lower functional communi-
applying principal component analysis (PCA) to enter- cation (blue in panel (b)) and varied number of social
prises based on functional and social communication communications (from red to blue in panel (f )). They also
monthly network features including the corresponding have higher density in both types of networks (red in panels
score. The PCA is calculated by constructing a matrix (c) and (g)) and higher clustering in social communication
where rows are monthly observations of enterprises and networks (red in panel (h)). Ineffective companies in region
columns represent the corresponding network features and C are characterized for having a higher number of functional
score. This analysis enables the decomposition of the communications, lower number of social communications,
manifold in a reduced set of new dimensions that show and lower density and clustering coefficient in social net-
dominant behaviors. Components are ordered by the works. More features are presented in Supplementary Ma-
amount of variance they explain. In this case, the two main terials (see Section S4).
components explain up to 77% of the variance. In Table 3, These results show that certain social behaviors may be
we show the coefficients of network features and score in associated with efficacy in industrial settings. In particular,16 Complexity
4 4 4
3 (c) 3 (c) 3 (c)
2 2 2
PC-2 1 1 1
PC-2
PC-2
0 (b) 0 (b) 0 (b)
–1 –1 –1
–2 –2 –2
(a) (a) (a)
–3 –3 –3
–2 0 2 4 6 8 –2 0 2 4 6 8 –2 0 2 4 6 8
PC-1 PC-1 PC-1
–1 0 1 –1 0 1 –1 0 1
(a) (b) (c)
4 4 4
3 (c) 3 (c) 3 (c)
2 2 2
1 1 1
PC-2
PC-2
PC-2
0 (b) 0 (b) 0 (b)
–1 –1 –1
–2 –2 –2
(a) (a) (a)
–3 –3 –3
–2 0 2 4 6 8 –2 0 2 4 6 8 –2 0 2 4 6 8
PC-1 PC-1 PC-1
–1 0 1 –1 0 1 –1 0 1
(d) (e) (f )
4 4 4
3 (c) 3 (c) 3 (c)
2 2 2
1 1 1
PC-2
PC-2
PC-2
0 (b) 0 (b) 0 (b)
–1 –1 –1
–2 –2 –2
(a) (a) (a)
–3 –3 –3
–2 0 2 4 6 8 –2 0 2 4 6 8 –2 0 2 4 6 8
PC-1 PC-1 PC-1
–1 0 1 –1 0 1 –1 0 1
(g) (h) (i)
Figure 12: Principal component analysis (PCA) of enterprises based on functional and social communication monthly network features
including the corresponding efficacy score. Dots represent individual companies at particular months. Their location in the scatter plots
shows the dot product of the company’s feature vector and the corresponding component (PC-1 in the x-axis and PC-2 in the y-axis). Panels
are colored by different features (see titles). Features have been normalized by subtracting the average and dividing by the standard deviation
(scale on figure). The number of functional and social communications is in the logarithmic scale. Regions (A), (B), and (C) indicate the
location of big, effective, and ineffective companies, respectively. More features are presented in Supplementary Materials (see Section S4).
(a) Functional users. (b) Functional communications. (c) Functional clustering. (d) Functional density. (e) Social users. (f ) Social
communications. (g) Social clustering. (h) Social density. (i) Score.
excessive functional communication can be detrimental for and other labour productivity measures is still necessary for
timely completion of tasks and digital social interactions advancing such understanding.
may be beneficial. However, being effective on finishing
work orders is not necessarily equivalent to improving la- 8. Conclusion
bour productivity in terms of volume produced in labour
hours, which is out of the scope of this study. A further We constructed and characterized digitized functional and
investigation of the relationship between human dynamics social communication networks from industrial productionComplexity 17
plants and determined the network patterns that distinguish [2] N. S. Al Eslami Kandlousi, A. J. Ali, and A. Abdollahi,
both types of interactions and affect team efficacy, in terms of “Organizational citizenship behavior in concern of commu-
the timely completion of work orders. We found that functional nication satisfaction: the role of the formal and informal
communication networks are asymmetrical and social-media- communication,” International Journal of Business and
style communication networks are segregated by job title. We Management, vol. 5, no. 10, p. 11, 2010.
[3] C. O’Reilly, “Corporations, culture, and commitment: mo-
showed that efficacy is negatively associated with the number of
tivation and social control in organizations,” California
functional communications but positively associated with the Management Review, vol. 31, no. 4, pp. 9–25, 1989.
density of social communication networks. This shows that, [4] O. N. Rank, “Formal structures and informal networks:
beyond the volume of communications, the complexity of structural analysis in organizations,” Scandinavian Journal of
interactions matters for improving performance. Management, vol. 24, no. 2, pp. 145–161, 2008.
Effective industrial-management software is critical to [5] T. Diefenbach and J. A. A. Sillince, “Formal and informal
enterprise performance. Among the enterprises we analyzed, hierarchy in different types of organization,” Organization
those with more functional communications performed Studies, vol. 32, no. 11, pp. 1515–1537, 2011.
worse than others, which had a combination of less func- [6] R. Guimerà, L. Danon, A. Dı́az-Guilera, F. Giralt, and
tional communication together with an increased density of A. Arenas, “The real communication network behind the
social communications. While functional and structured formal chart: community structure in organizations,” Journal
communications support the organization, it is important to of Economic Behavior & Organization, vol. 61, no. 4,
pp. 653–667, 2006.
identify that newer and easier means to communicate with
[7] A.-L. Barabási, Network Science, Cambridge University Press,
workers, and workers to communicate with one another, Cambridge, UK, 2016.
increase efficacy and improve overall performance. [8] J. Allen, A. D. James, and P. Gamlen, “Formal versus informal
knowledge networks in R&D: a case study using social net-
Data Availability work analysis,” R&D Management, vol. 37, no. 3, pp. 179–196,
2007.
The network data used to support the findings of this study [9] D. Lazer, A. Pentland, L. Adamic et al., “Life in the network:
are available from the corresponding author upon request. the coming age of computational social science,” Science,
vol. 323, no. 5915, pp. 721–723, 2009.
[10] N. Eagle, A. Pentland, and D. Lazer, “Inferring friendship
Conflicts of Interest network structure by using mobile phone data,” Proceedings of
The authors declare that they have no conflicts of interest. the National Academy of Sciences, vol. 106, no. 36,
pp. 15274–15278, 2009.
[11] A. J. Morales, V. Vavilala, R. M. Benito, and Y. Bar-Yam,
Acknowledgments “Global patterns of synchronization in human communica-
tions,” Journal of The Royal Society Interface, vol. 14, no. 128,
We thank Rob Archer for assisting in the data collection,
Article ID 20161048, 2017.
Amir Akhavan for assisting in the data management, and [12] A. Bavelas, “Communication patterns in task-oriented
Rachel A. Rigg for proofreading the manuscript. groups,” The Journal of the Acoustical Society of America,
vol. 22, no. 6, pp. 725–730, 1950.
Supplementary Materials [13] C. Ellinas, “Perspective: organisations as complex systems,”
Civil Engineering and Environmental Systems, vol. 35, no. 1–4,
Figure S1: complementary cumulative distribution function pp. 1–5, 2018.
(CCDF) of companies’ life-span measured in months. Table [14] M. Cebrian, M. Lahiri, N. Oliver, and A. Pentland, “Mea-
S1: correlation coefficients of functional and social com- suring the collective potential of populations from dynamic
munication average network features with the average ef- social interaction data,” IEEE Journal of Selected Topics in
ficacy score. Figure S2: visualization of functional Signal Processing, vol. 4, no. 4, pp. 677–686, 2010.
communication networks from all enterprises. Figure S3: [15] Y. Bar-Yam, Making Things Work: Solving Complex Problems
adjacency matrices of functional communication networks in a Complex World, Knowledge Industry Press, Cambridge,
from all enterprises. Figure S4: visualization of social MA, USA, 2004.
[16] Y. Bar-Yam, Teams: A Manifesto, Vol. 2139, New England
communication networks from all enterprises. Figure S5:
Complex Systems Institute and MIT Media Laboratory,
adjacency matrices of social communication networks from
Cambridge, MA, USA, 2016.
all enterprises. Figure S6: distribution of the efficacy scores [17] Y. Bar-Yam, “Complexity rising: from human beings to
for all enterprises. Lower scores indicate better efficacy. human civilization, a complexity profile,” in Encyclopedia of
Figure S7: principal component analysis (PCA) of enter- Life Support Systems (EOLSS), UNESCO, Paris, France, 2002.
prises based on functional and social communication [18] W. Ross Ashby, “Requisite variety and its implications for the
monthly network features including the corresponding ef- control of complex systems,” in Facets of Systems Science,
ficacy score. (Supplementary Materials) pp. 405–417, Springer, Berlin, Germany, 1991.
[19] Y. Bar-Yam, “Multiscale variety in complex systems,” Com-
References plexity, vol. 9, no. 4, pp. 37–45, 2004.
[20] Y.-A. de Montjoye, A. Stopczynski, E. Shmueli, A. Pentland,
[1] J. C. Anderson and J. A. Narus, “A model of the distributor’s and S. Lehmann, “The strength of the strongest ties in col-
perspective of distributor-manufacturer working relation- laborative problem solving,” Scientific Reports, vol. 4, no. 1,
ships,” Journal of Marketing, vol. 48, no. 4, pp. 62–74, 1984. p. 5277, 2014.18 Complexity
[21] Y. Bar-Yam, “Complex systems and sports: complex systems [39] O. Lederman, D. Fehder, A. J. Morales, F. Murray, and
insights to building effective teams,” International Journal of A. Pentland, Communication Patterns and Performance in
Computer Science in Sport, vol. 2, 2003. Early Startups, USC Marshall School of Business, Los Angeles,
[22] Jyh-Shen Chiou, C.-H. Hsieh, and C.-H. Yang, “The effect of CA, USA, 2009.
franchisors’ communication, service assistance, and com- [40] T. M. J. Fruchterman and E. M. Reingold, “Graph drawing by
petitive advantage on franchisees’ intentions to remain in the force-directed placement,” Software: Practice and Experience,
franchise system,” Journal of Small Business Management, vol. 21, no. 11, pp. 1129–1164, 1991.
vol. 42, no. 1, pp. 19–36, 2004. [41] D. Müllner, “Modern hierarchical, agglomerative clustering
[23] J. L. Price, “Handbook of organizational measurement,” In- algorithms,” 2011, https://arxiv.org/abs/1109.2378.
ternational Journal of Manpower, vol. 18, no. 4/5/6, [42] Z. Bar-Joseph, D. K. Gifford, and T. S Jaakkola, “Fast optimal
pp. 305–558, 1997. leaf ordering for hierarchical clustering,” Bioinformatics,
[24] R. E. Kraut, R. S. Fish, R. W. Root, and B. L. Chalfonte, vol. 17, no. 1, pp. S22–S29, 2001.
Informal Communication in Organizations: Form, Function, [43] M. E. J. Newman, “Mixing patterns in networks,” Physical
and Technology (Citeseer), SAGE Publications, Thousand Review E, vol. 67, no. 2, Article ID 026126, 2003.
Oaks, CA, USA, 1990. [44] L. M. A. Bettencourt, J. Lobo, D. Helbing, C. Kuhnert, and
[25] J. K. Litterst and B. Eyo, “Gauging the effectiveness of formal G. B. West, “Growth, innovation, scaling, and the pace of life
communication programs: a search for the communication- in cities,” Proceedings of the National Academy of Sciences,
productivity link,” The Journal of Business Communication, vol. 104, no. 17, pp. 7301–7306, 2007.
vol. 19, no. 2, pp. 15–26, 1982. [45] M. Schläpfer, L. M. A. Bettencourt, S. Grauwin et al., “The
[26] J. Gray and H. Laidlaw, “Part-time employment and com- scaling of human interactions with city size,” Journal of The
munication satisfaction in an Australian retail organisation,” Royal Society Interface, vol. 11, no. 98, Article ID 20130789,
Employee Relations, vol. 24, no. 2, pp. 211–228, 2002. 2014.
[27] L. Wu, B. N. Waber, S. Aral, E. Brynjolfsson, and A. Pentland, [46] G. West, Scale: The Universal Laws of Growth, Innovation,
“Mining face-to-face interaction networks using sociometric Sustainability, and the Pace of Life in Organisms, Cities,
badges: predicting productivity in an IT configuration task,” Economies, and Companies, Penguin Press, New York, NY,
SSRN Electronic Journal, vol. 1130251, 2008. USA, 2017.
[28] A. Pentland, “The new science of building great teams,” [47] J. M Badham, “Commentary: measuring the shape of degree
Harvard Business Review, vol. 90, no. 4, pp. 60–69, 2012. distributions,” Network Science, vol. 1, no. 2, pp. 213–225,
[29] M. L. Maznevski and K. M. Chudoba, “Bridging space over 2013.
time: global virtual team dynamics and effectiveness,” Or-
ganization Science, vol. 11, no. 5, pp. 473–492, 2000.
[30] F. J. Yammarino, M. D. Mumford, M. S. Connelly, and
S. D. Dionne, “Leadership and team dynamics for dangerous
military contexts,” Military Psychology, vol. 22, no. 1,
pp. S15–S41, 2010.
[31] S. Warner, M. T. Bowers, and M. A. Dixon, “Team dynamics: a
social network perspective,” Journal of Sport Management,
vol. 26, no. 1, pp. 53–66, 2012.
[32] J. R. Anderson, “The relationship between student perceptions
of team dynamics and simulation game outcomes: an indi-
vidual-level analysis,” Journal of Education for Business,
vol. 81, no. 2, pp. 85–90, 2005.
[33] D. Ancona and H. Bresman, Team of Teams: New Rules of
Engagement for a Complex World, Harvard Business Press,
Brighton, MA, USA, 2007.
[34] G. S. McChrystal, T. Collins, D. Silverman, and C. Fussell,
Team of Teams: New Rules of Engagement for a Complex
World, Penguin Press, New York, NY, USA, 2015.
[35] S. Weisband, “Maintaining awareness in distributed team
collaboration: implications for leadership and performance,”
in Distributed Work, pp. 311–333, MIT Press, Cambridge,
MA, USA, 2002.
[36] R. E. Kraut, S. R. Fussell, S. E. Brennan, and J. Siegel, “Un-
derstanding effects of proximity on collaboration: implica-
tions for technologies to support remote collaborative work,”
in Distributed Work, pp. 137–162, MIT Press, Cambridge,
MA, USA, 2002.
[37] J. S. Olson, S. Teasley, L. Covi, and G. Olson, “The (currently)
unique advantages of collocated work,” in Distributed Work,
pp. 113–135, MIT Press, Cambridge, MA, USA, 2002.
[38] A. Williams Woolley, C. F. Chabris, A. Pentland, N. Hashmi,
and T. W. Malone, “Evidence for a collective intelligence
factor in the performance of human groups,” Science, vol. 330,
no. 6004, pp. 686–688, 2010.You can also read