A Field Development Plan for Catshill Brown Oilfield in Trinidad Utilizing Waterflood Simulation
←
→
Page content transcription
If your browser does not render page correctly, please read the page content below
vi
                      & En ronme
                 um             n
                                                                                                                                          OPEN     ACCESS Freely available online
                le
                                                   Journal of Petroleum &
                                ta
              ro

                                  lB
     al of Pet

                                    iotec nology
                                         h
                                                   Environmental Biotechnology
  urn
Jo

                ISSN: 2157-7463

                                                                                                                                                              Research Article

A Field Development Plan for Catshill Brown Oilfield in Trinidad
Utilizing Waterflood Simulation
Paul Amihere-Ackah1*, Prof. Raffie Hosein1 and Benjamin Makimilua Tiimub2
1
 University of the West Indies, St Augustine Campus, Trinidad and Tobago; 2College of Environmental and Resource Sciences, 310058,
Zhejiang University, Hangzhou, P.R. China

                                    ABSTRACT
                                    The identification of new oil fields onshore Trinidad and Tobago has become almost impossible. Therefore the
                                    possibility of producing by-passed hydrocarbon accumulation from the matured Catshill field was determined
                                    through a holistic field development plan using waterflooding. The field development plan involved detailed
                                    reservoir characterization study. There were two phases of development plans considered.
                                                   (1) Injecting water above the bubble point for a new field development
                                                   (2) Injecting water below the bubble point using existing field data. Effective use of petrel aided the building
                                                       of all geological maps of the area.
                                    Maps generated in Petrel were exported to Computer Modelling Group (CMG) for detailed reservoir simulation
                                    study. The estimated oil in place was 27.541 MMSTB. Primary production yielded 27.2% recovery factor which
                                    was less than half of the oil in place. Implementation of water injection above the bubble point pressure yielded
                                    49.8% recovery factor when produced for 10 years. By injecting water below the bubble point pressure using
                                    staggered line drive pattern, the recovery factor was 39.4%. It can be concluded that developing a field using
                                    waterflooding is best when pressure is high. However, there could still be significant recovery (39.4%) when field is
                                    matured. Economically, production will not be profitable if the oil price goes below 46 US$/bbl.
                                    Keywords: Field development; Reservoir; Matured oilfield; Waterflood simulation; Catshill

INTRODUCTION                                                                                               that the possibility of fields becoming matured is high. A holistic
                                                                                                           development scheme for recovering oil from these matured fields
Oil field development is a multi-disciplinary approach that comprise                                       is much necessary. Among such fields in Trinidad is the Catshill
of parameters relating to geological and structural characteristics,                                       oil field.
reservoir characteristics through to operational scheduling and
                                                                                                           According to the Ministry of Energy and Energy Industries in 2009
economic analysis and evaluation [1]. Reservoir lifecycle starts at
                                                                                                           [7], the first well drilled in Catshill was in November 1950. The
exploration and discovery [2]. When discovered it is produced                                              Catshill field is divided into two main parts, the Northeast and
until it ends at abandonment 2010. Many discovered field are ever                                          Southeast, each part of the field was discovered by the drilling of
diminishing and matured [3]. Increasing water and gas production,                                          CO-3 and CO-5 wells respectively in 1952. The two subdivision
decreasing pressure, and aging equipment are indicators of field                                           of the field is marked by a major fault known as the Boomerang
maturity [4]. Trinidad discovered oil in 1876 but commercial                                               fault which has a marked difference on either side with respect
production only began in 1908 [5]. Trinidad and Tobago has                                                 to biofacies and lithofacies. This research evaluates the Southwest
record in petroleum sector for more than one hundred (100) years                                           of the Catshill Field. The Southwest of the field produces from
with cumulative production of more than three (3) billion barrels                                          the k-sand commonly known as the CO-30 sand. Most of the oil
of oil. According to Ernst and Young [6] proven crude oil reserves                                         production comes from the sands that are of Upper Miocene
as at 2013 were estimated at 728 million barrels a publication                                             age [8]. The field has been in production for more than 40 years
by the Energy Information Administration (EIA). This indicates                                             with a decrease in pressure and production making the reservoir

Correspondence to: Paul Amihere-Ackah, 1Department of Chemical Engineering, Faculty of Engineering, University of the West Indies, St Augustine
Campus, Trinidad and Tobago, Tel: +233549512469; E-mail: amihereackahpaul112@gmail.com
Received: April 13, 2020, Accepted: May 04, 2020, Published: May 11, 2020
Citation: Amihere-Ackah P, Tiimub BM (2020) A Field Development Plan for Catshill Brown Oilfield in Trinidad Utilizing Waterflood Simulation
11:405. doi: 10.35248/2157-7463.20.11.405
Copyright: © 2020 Amihere-Ackah P, et al. This is an open-access article distributed under the terms of the Creative Commons Attribution License,
which permits unrestricted use, distribution, and reproduction in any medium, provided the original author and source are credited.

J Pet Environ Biotechnol, Vol. 11 Iss. 2 No: 405
                                                                                                                                                                             1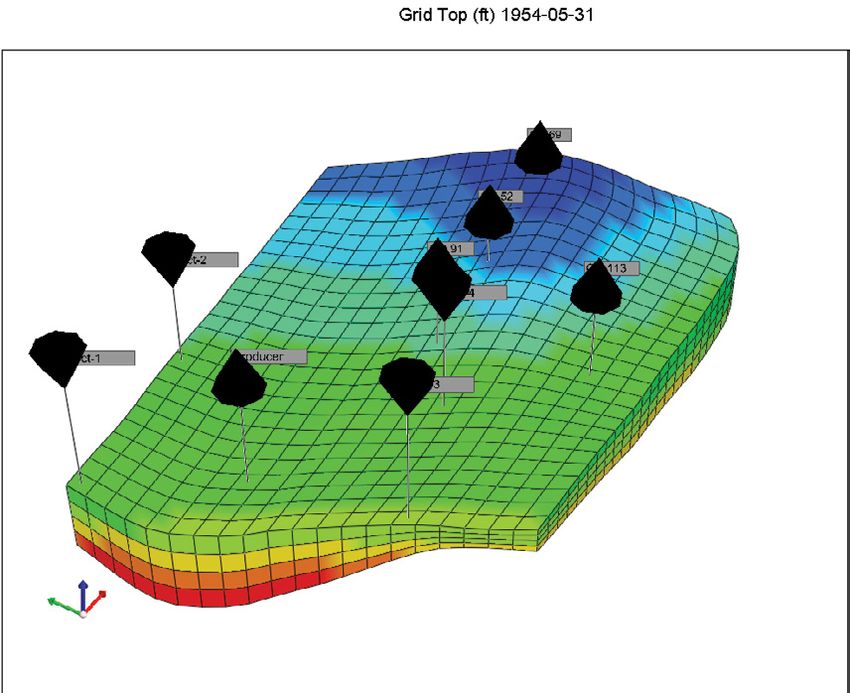
Amihere-Ackah P, et al.                                                                                              OPEN     ACCESS Freely available online

undersaturated [9]. The decline in oil production due to matured                location of the target oil first [4]. Locating the remaining oil and
field is also reported recently by Cambridge Energy Research                    building a development plan have enormous importance [19,20].
Associates where they estimated that the weighted decline of                    This study approach utilized waterflood simulation.
production from all existing world oil fields was roughly 4.5% in
2006 CERA [10]. which is in line with the 4-6% range estimated                  Reservoir simulation according to various literature including but
by ExxonMobil [11]. These reports depicts the need for a robust                 not limited [21-24] can be employed in well in inverse engineering
field development plan to determine further oil recovery from the               problems for optimizing existing numerical models and couple
mature field.                                                                   the dynamic and historic data (production) in the simulation.
                                                                                Waterflooding can lead to the recovery of about one-third of the
Mature fields development which consists mostly of secondary and
                                                                                original oil in place (OOIP) [25]. This study therefore focused on
tertiary production, account for more than 70% of the World's oil
                                                                                development of an existing onshore Catshill brown oil field by
and gas production. Averagely the recovery factor being 70% for
gas and about 35% for oil [12-14]. With optimized waterflooding                 presenting a comprehensive development plan using waterflood
and enhanced oil recovery methods, there is potential to increase               simulation (Figures 1-17 and Tables 1-6). It focused on:
the amount of petroleum that can be economically produced from                       (1) Waterflood simulation above the bubble point for a new
matured reservoirs [15]. The development phase fully integrated                          field development
reservoir characterization. These are theoretically the ideal
solutions, since complex 3D models are able to integrate localized                   (2) Waterflood simulation below the bubble point using
geological characteristics and the full physics of simulation [16-                       existing field data taking into account the recovery factors
18]. In other to achieve this, one needs to know the amount and                          from each scenario.

                Figure 1: Catshill field within the Ortoire Block South Trinidad (left) and Selected area of study from the base map (right).

         Figure 2: Structural cross section along strike Line F-F’.               Figure 3: Structural correlations for fault analysis along strike line E-E’.

J Pet Environ Biotechnol, Vol. 11 Iss. 2 No: 405
                                                                                                                                                            2
Amihere-Ackah P, et al. OPEN ACCESS Freely available online
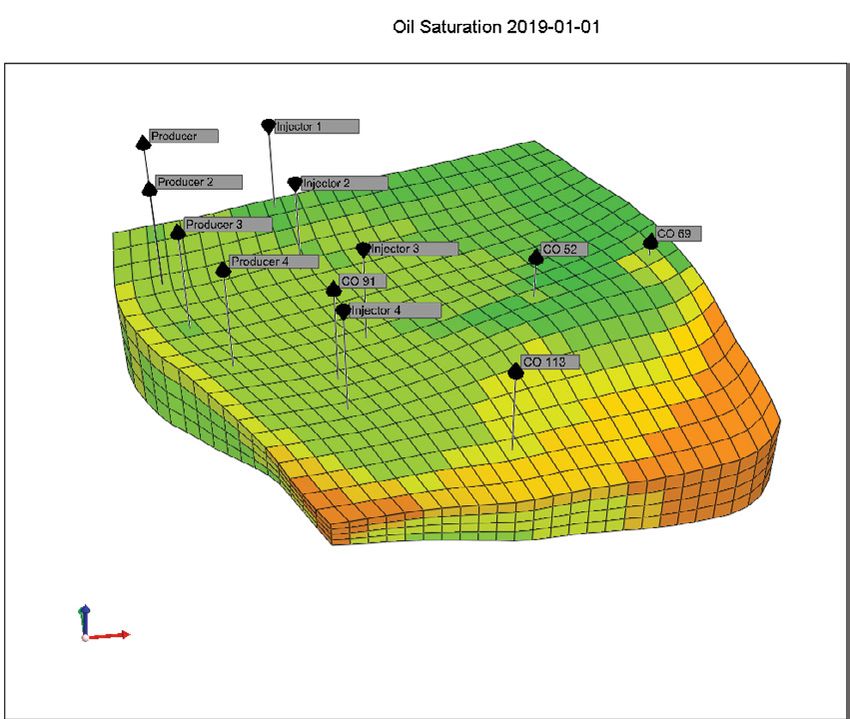
Figure 4: Top and bottom structure map respectively generated from petrel.
Figure 5: Procedure used to determine the net sand thickness excluding all shale intervals.
J Pet Environ Biotechnol, Vol. 11 Iss. 2 No: 405
3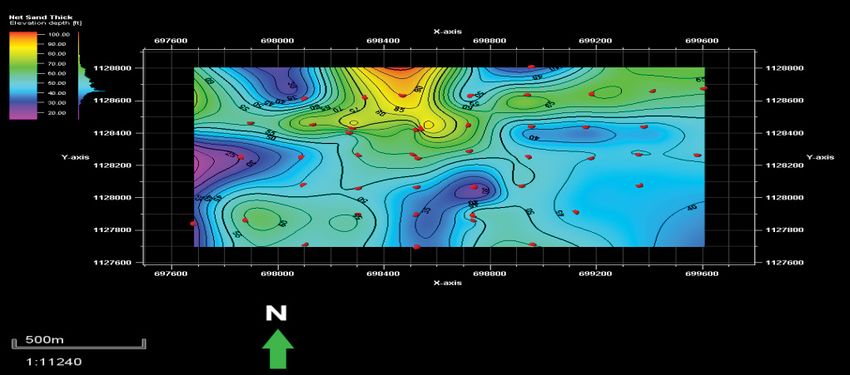
Amihere-Ackah P, et al.                                                                            OPEN   ACCESS Freely available online

                                                      Figure 6: Net sand map of CO-30 sand.

                                                   Figure 7: Net oil sand map of the CO-30 sand.

J Pet Environ Biotechnol, Vol. 11 Iss. 2 No: 405
                                                                                                                                    4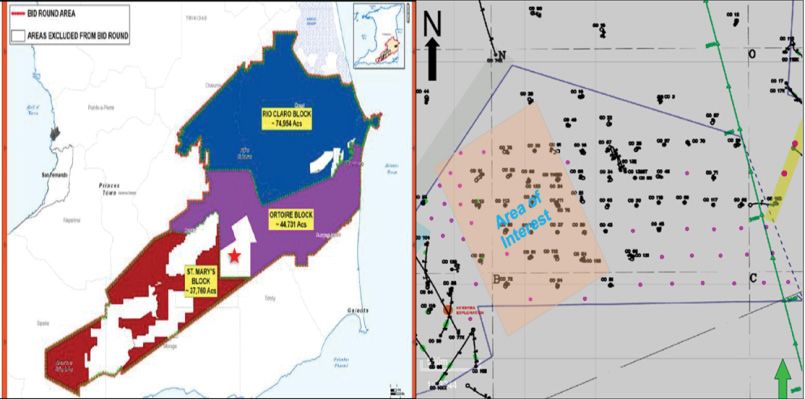
Amihere-Ackah P, et al.                                                                                                    OPEN   ACCESS Freely available online

                                               Figure 8: History matching of all wells to the field production data.

                                                   Figure 9: Ten year prediction run for all the wells of fault block C.
J Pet Environ Biotechnol, Vol. 11 Iss. 2 No: 405
                                                                                                                                                            5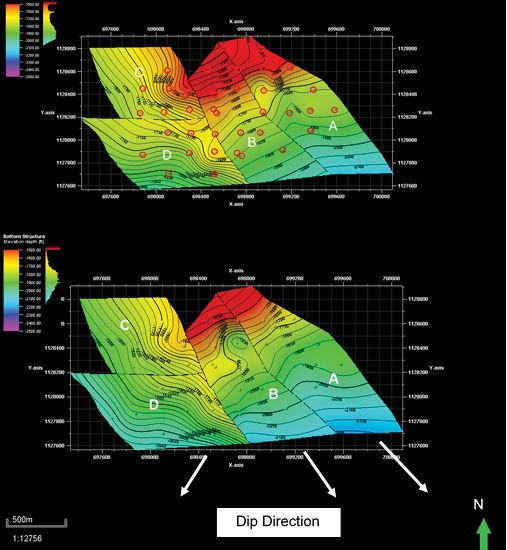
Amihere-Ackah P, et al.                                                                                              OPEN     ACCESS Freely available online

                  Figure 10: Aerial view of location of injectors and producers for the staggered line drive pattern at start of production.

                                                                                 Figure 12: Cumulative oil production for 10 years with water injection at
Figure 11: Cumulative oil production for 10 years with no water injection.       3500 b/d.

MATERIAL AND METHODS                                                             map. This followed type log signature identification for the CO-
                                                                                 30 sand (Appendix 1, Figure 18) and pulling section lines along
Geological analysis of the field                                                 dip and strike to develop cross section as well as determining sand
                                                                                 continuity from stratigraphic cross section (Appendix 1, Figure 20).
The field was intelligently and holistically reviewed using well                 From the logs, the Top of Sand (TOS) and Bottom of Sand (BOS)
logs, base maps, well files, seismic lines and field reports. Based              were carefully marked (Appendix 1, Figure 18). The True Vertical
on the reviewed data and reports of the field, an area of interest               Depth Sub Sea (TVDSS) were calculated using the available well
was chosen from the base map for further analysis (Figure 1). The                files to obtain elevation data for each well (Appendix 1, Table 13).
field was mapped to determine faults and possible contacts (Figure               To do the correlation, the SP and Resistivity log signatures present
3 and Appendix 1, Table 10 and 13). The regional faulting, initial               in the CO-30 sand were used to identify sand bodies of similar
dip and strike direction were identified using guide from the Kugler             pattern that would have been deposited at the same time and as a
J Pet Environ Biotechnol, Vol. 11 Iss. 2 No: 405
                                                                                                                                                        6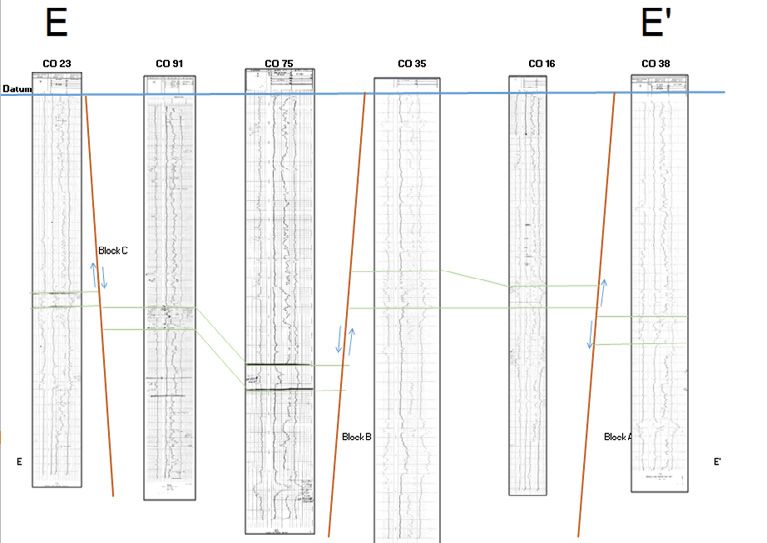
Amihere-Ackah P, et al.                                                                                        OPEN     ACCESS Freely available online

Figure 13: 3D view of the location of the five spot well pattern in CMG.
                                                                                  Figure 16: 3D view of oil saturation at 2019 after water-flood.

                                                                             sand package of southwest Catshill field and also the central focus
                                                                             of the study. Well logs of wells within the selected area of study
                                                                             were correlated using the type log as reference point. The depth
                                                                             measure used in the correlation was the standard true vertical
                                                                             depth (Appendix 1, Table 13). The correlation included structural
                                                                             correlation for each faulted block to investigate the displacement
                                                                             of the CO-30 sand package with respect to the fault movement
                                                                             (Figure 3). Sand in communication or not and either sealing or
                                                                             non-sealing were identified (Appendix 1, Table 9). The faults
                                                                             identified were mostly normal faults (Figures 2, 3 and Appendix 1,
                                                                             and Figures 19, 20).

                                                                             Building the structure map
Figure 14: Graphical presentation of the recovery factors from both flood    By utilizing information gathered on oil water contact, depth and
patterns from 2009-2019.                                                     faults (Appendix 1, Table 10 and 13) the structure map for the
                                                                             study area was generated using Petrel Software (Figure 4). The
                                                                             true vertical depths (TVD) for each well was calculated from
                                                                             the measured depth (MD) of the well logs. These values were
                                                                             subtracted from the elevation (Rotary Table or Kelly Bushing)
                                                                             (Appendix 1, Table 13). These top and bottom values were placed
                                                                             on the structure map at the specific location of the respective wells
                                                                             taking the regional faulting of the area into account. The map was
                                                                             then contoured using Petrel. This was done by also taking into
                                                                             consideration the existing faults and the additional faults based on
                                                                             contour misties and fluid anomalies. Due to the poor quality of
                                                                             the available seismic data, the use of the dipmeter logs were used
                                                                             to verify the direction in which the structure dips and orients. The
                                                                             depth range derived from the map is from 1500ft to 2500ft TVD
                                                                             (Appendix 1, Table 12). The faults were used to label the blocks in
                                                                             the field Block as A, B, C, and D (Figure 4 and Appendix 1, Table 11).

                                                                             Construction of net sand map
Figure 15: 3D view of oil saturation at 2009 and 2019 without water-flood.   To get the total net sand, the maximum and minimum shale line
                                                                             was drawn for the SP and a 50% line was drawn between the
result have the same environment of deposition (Figures 2, 3 and
                                                                             maximum and minimum line as the cut off value for shales and
Appendix 1, Figures 19, 20). The composite type log of CO-30
                                                                             sands (Figure 5). To the right of the 50% line is considered to be
sand which is highlighted in red rectangular dimension (Appendix
1, Figure 18) was used as a guide since it is the most profound              shale while to the left of the line is sand (Figure 5). The Interval

J Pet Environ Biotechnol, Vol. 11 Iss. 2 No: 405
                                                                                                                                                    7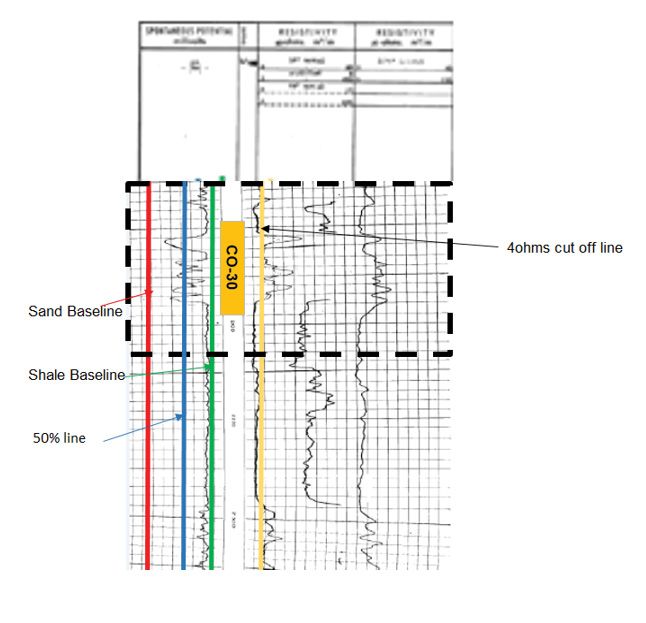
Amihere-Ackah P, et al.                                                                                                        OPEN          ACCESS Freely available online

                                                                 Figure 17: NPV variation with oil price.

                                                     Table 1: Rock and fluid properties analyzed for fault block C.
                                                                                                                                             Indonesian           Simandaux
                                                         Measured    Formation                    Rmf @        RW (Silver
            SP    SP       SP                      Rmf                                 BHT
Wells #                        Vshale Rt       Ro       Temperature Temperature                 formation      Bassiouni      Porosity AS       BS     SW       AS    BS    SW
           Shale Clean     Log                    (Ohm)                                 (ᵒF)
                                                           (ᵒF)         (ᵒF)                   temperature      method)
 CO 91       0     -45     -36     20     12   2     0.9        85         113.6         115          0.7         0.22          0.31    2.45 0.58 0.331 0.019 0.19 0.42
 CO 13       0     -45     -35     22     8    2     1          85         118.6         120          0.7         0.24          0.31    2.02 0.53 0.392 0.034 0.31 0.52
CO 113       0     -50     -30     40     15   2.4   3.2        80         108.7         110          2.4         0.27          0.31     2.5    1.2    0.27 0.037 0.19      0.4
 CO 20       0     -50     -30     40     18   2     0.1        84         118.2         120          0.1         0.05          0.31     3     1.44 0.225 0.006 0.03 0.17
CO 123       0     -30     -20     33     20   4     2.2        82         101.7         103          1.8         0.12          0.31    2.24 0.89      0.32    0.01 0.06 0.24
 CO 52       0     -83     -60     28     8    1.8   1.1        99         119.7         121          0.9         0.13          0.31    2.11    0.7   0.356 0.023 0.17 0.39
 CO 75       0     -24     -20     17     16   1.8   0.7        90         116.6         118          0.5         0.26          0.31    2.98 0.59      0.28 0.014 0.17      0.4
 Average
                                   29                                      113.9       115.3                      0.18          0.31                   0.311                0.36
  total

                                                         Table 2: Total fluids in place in fault bock C from CMG.
                                 Item                                                                        Fluid Production
                                                                           Oil (MSTB)                         Gas (MMSCF)                             Water (MSTB)
                   Cumulative Production                                      7490.1                             3630.4                                    0.29402
                   Current fluids in place                                    20046                               457.74                                    7101.4
                         Production Rates                                    0.02989                             5.68E-04                                  1.85E-06
     Average reservoir pressure excluding water zone                         51.81psia

                                 Table 3: Cumulative production from the field (Fault Block C) after 10 years by primary depletion.
                                   Item                                                                        Fluid Production
                                                                                       Oil (MSTB)                           Gas (MMSCF)                    Water (MSTB)
                         Cumulative Production                                             7490.1                             3630.4                           0.29402
                         Current fluids in place                                           20046                               457.74                           7101.4
                            Production Rates                                              0.02989                             5.68E-04                         1.85E-06
           Average reservoir pressure excluding water zone                                51.81psia

                                   Table 4: Production response from staggered line drive pattern from beginning of production.
                      Cumulative                                                                                                          Average reservoir           Recovery
                                                                  Cumulative water Cumulative water
Injection rate (b/d) Oil Produced Cumulative gas Produced (MMSCF)                                                                        pressure excluding            Factor
                                                                  Produced (MSTB) injected (MSTB)
                       (MSTB)                                                                                                             water zone (psia)             (%)
           1000                  13258                        3803.9                           90981                 98205                        49.45                  48.14
           1500                  12718                        3730.1                           137708                147186                       72.33                  46.18
           2000                  12827                        3663.5                           183863                195002                           96                 46.57
           2500                  13151                        3606.7                           216860                228692                      112.89                  47.75
           3000                  13177                        3597.8                           222338                234265                       115.9                  47.84
           3500                  13177                        3597.8                           222338                234265                       115.9                  47.84
           4000                  13177                        3597.8                           222338                234265                       115.9                  47.84
           4500                  13177                        3597.8                           222338                234265                       115.9                  47.84
           5000                  13177                        3597.8                           222338                234265                       115.9                  47.84

J Pet Environ Biotechnol, Vol. 11 Iss. 2 No: 405
                                                                                                                                                                              8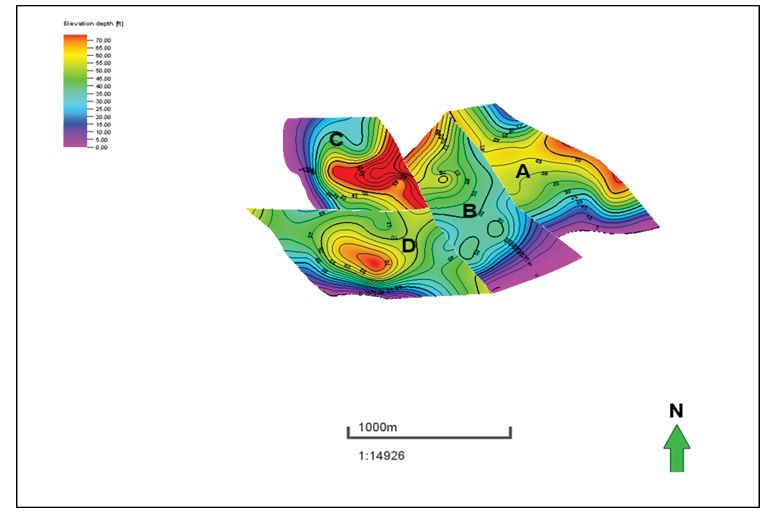
Amihere-Ackah P, et al.                                                                                                 OPEN   ACCESS Freely available online

                                Table 4: Production response from staggered line drive pattern from beginning of production.
                                                                                                                           Cumulative oil Production (bbl)
                                           Field Cumulative oil production up          Cumulative oil Production
              Well Name                                                                                                   from waterflood @1000b/d up to
                                                     to 2009 (bbl)                       @1000b/d up to 2009
                                                                                                                                       2019
                 CO 52                                     4454                                  675497                               675497
                 CO 69                                    59900                                  579857                               579857
                 CO 91                                    254618                                 802192                               858233
                CO 113                                     5937                                 1290000                               1330000

                          Table 5: Comparison of recorded field cumulative oil production history with waterflood oil production.
                    Field Cumulative oil production up to          Cumulative oil Production @1000b/d up           Cumulative oil Production (bbl) from
 Well Name
                                2009 (bbl)                                         to 2009                           waterflood @1000b/d up to 2019
    CO 52                              4454                                           675497                                       675497
    CO 69                             59900                                           579857                                       579857
    CO 91                             254618                                          802192                                       858233
   CO 113                              5937                                         1290000                                        1330000

                                             Table 6: Injection from beginning of production using five spot pattern.
                                                                                                                    Average reservoir
                          Cumulative Oil   Cumulative gas Cumulative water                     Cumulative water
Injection rate (b/d)                                                                                               pressure excluding Recovery Factor (%)
                         Produced (MSTB) Produced (MMSCF) Produced (MSTB)                      injected (MSTB)
                                                                                                                    water zone (psia)
         1000                    12756                 3644.9                88013                  97941                 93.74                 46.32
         1500                    13182                 3510.7                128993                140752                 134.36                47.86
         2000                    13628                 3406.2                155445                167646                 161.42                49.48
         2500                    13729                 3381.6                161705                174020                 168.37                49.85
         3000                    13729                 3381.6                161705                174020                 168.37                49.85
         3500                    13729                 3381.6                161705                174020                 168.37                49.85
         4000                    13729                 3381.6                161705                174020                 168.37                49.85
         4500                    13729                 3381.6                161705                174020                 168.37                49.85
         5000                    13729                 3381.6                161705                174020                 168.37                49.85

that is identified during the correlation that contains both sand                  log within Fault block C and VShale for respective zones of interest
and shale is known as the Net Gross Interval. The amount of                        were estimated (Table 1). Equation [1] was used to compute for the
shale that exists in the interval is then determined and is subtracted             volume of shale for each well using their well logs.
from the Net Gross Interval to yield the Total Net sand that was                            SPsh − SP
deposited in the system. These thicknesses values were then used                   Vsh =                                                        Equation (1)
for mapping the net sand map and contoured again using Petrel                              SPsh − SPcl
Software (Figure 6).
                                                                                   Where,
Generating net oil sand (NOS) map                                                  SPSH-SP value at shale baseline
The Net Oil Sand Map shows the distribution of the hydrocarbons                    SP-SP in the zone of interest (read from the log)
within the net sand in relation to the faults which form traps
                                                                                   SPcl- Maximum Sp deflection from the clean wet zone [26].
in the Catshill Field. The structure map and well log data were
used to calculate the total net oil sand thickness. The NOS map                    Water Resistivity (Rw)
took into consideration contacts (GWC/OWC) which showed
                                                                                   The water resistivity for the zones was determined using Silver and
the transitioning from hydrocarbon to water. For the generation
                                                                                   Bassiouni method [27] and the Spontaneous Potential Log data.
of the NOS map (Figure 7), only resistivity curves were available
                                                                                   Using the Silver and Bassiouni method (Appendix 1, Figure 21),
therefore a cut off resistivity value of 4 ohms was used to determine
                                                                                   the resistivity of water for the various wells in the Fault block C
whether hydrocarbon exists or not (Figure 5). A value of 4 ohms
                                                                                   was determined same as illustrated by well CO-20 in Appendix
was used since this value is typically used for the identification of              1, Figure 21. The formation temperature was first estimated in
hydrocarbons in the onshore southern basin Trinidad. The map                       Equation 3. The Rmf was converted to formation temperature.
was then generated using Petrel Software.                                          This was done using Arp’s equation as show below [28].
Formation evaluation                                                                 R1 + (T 1 + 7=
                                                                                                  ) R 2 (T 2 + 7 )                              Equation (2)
Volume of shale estimation: Utilizing the spontaneous Potential                    The Formation temperature (Tf) was estimated using the
log, the shale baseline and clean sand line were drawn for each well               following formula:

J Pet Environ Biotechnol, Vol. 11 Iss. 2 No: 405
                                                                                                                                                          9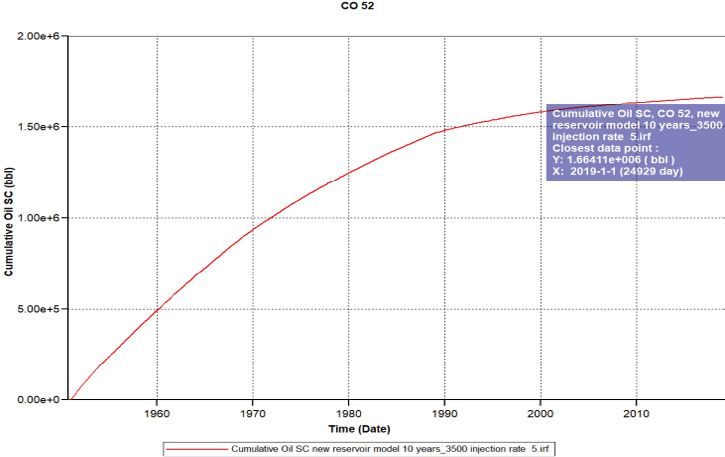
Amihere-Ackah P, et al. OPEN ACCESS Freely available online
Table 7: Water flooding from 2009-2019 and recovery factor.
Average reservoir
Cumulative Oil Cumulative gas Cumulative water Cumulative water
Injection rate (b/d) pressure excluding Recovery Factor (%)
Produced (MSTB) Produced (MMSCF) Produced (MSTB) injected (MSTB)
water zone (psia)
1000 10653 3753.1 9020.6 16072 68.09 38.68
1500 10728 3762 15022 24108 92.71 38.95
2000 10766 3745.9 21824 32144 139.78 39.09
2500 10795 3742.3 29255 40180 194.81 39.2
3000 10825 3739.8 37049 48216 240.8 39.31
3500 10854 3738.7 44944 56252 287.72 39.41
4000 10876 3737.4 52863 64288 334.85 39.49
3736.5
4500 10896 60803 72324 382.21 39.56
5000 10913 3736 68761 80360 429.71 39.62
Table 8: Water injection rates and cumulative fluid production from 2009-2019.
Average reservoir
Cumulative Oil Cumulative gas Cumulative water Cumulative water
Injection rate (b/d) pressure excluding Recovery Factor (%)
Produced (MSTB) Produced (MMSCF) Produced (MSTB) injected (MSTB)
water zone (psia)
1000 10038 3719.7 6501.8 16072 168.69 36.45
1500 10081 3718.4 13566 24108 332.06 36.6
2000 10120 3718.3 21423 32144 407.37 36.75
2500 10158 3718.7 29319 40180 491.12 36.88
3000 10192 3718.7 37233 40216 578.47 37
3500 10217 3718.5 45160 56252 666.78 37.09
4000 10239 3718.3 53075 64268 758.16 37.18
4500 10256 3718.1 60990 72324 854.76 37.24
5000 10269 3717.7 68920 80360 943.94 37.29
BHT − Ts evaluation of the fault block (Table 1, Appendix 1, Tables 10,
T f= Ts + D f Equation (3) 11, 12 and 13) were used to simulate waterflooding by paying key
TD
attention to the geological behaviour of the field as outlined above.
Determination of water saturation
Water injection above the bubble point pressure
The sand in the fault block is a shaly sand and therefore in the (development plan 1)
estimation of water saturation, Simandoux and Indonesian
equations were used. Based on water resistivity values calculated, The structure map, net sand map and net oil sand map were
a criterion of Rw0.2 for use of Indonesia equation thus According to the field reports reviewed, the field is a matured
Equation 4 were applied to determine the water saturation Table 1. field and has been produced from 1950 to 2009. To inject water
above the bubble point pressure, the field was treated as a new
m
Vsh (1 − vsh /2 ) + φ
1 2 field. In this case, the field production history was ignored. Then
S n /2 Equation (4) efficacious and judicious selection of waterflooding pattern was
Rt Rsh aRw we
done by utilizing both five spot pattern and staggered line drive.
Here, water was injected from the beginning of production (1950).
The simaneoux equation can be written as With the five spot pattern (Figure 13), four injection wells and
one producer located in the center of the reservoir was used. The
Sw =
− As + ( As 2
+ Bs ) injectors and producers were placed based on the distribution of
the oil saturation and the geology of the field was used (Figure 15
Rw *Vsh and 16). The staggered line drive consisted of five producers and
Where : As = four injectors (Figure 10). All the four (4) layers were perforated
φ * 2* Rsh
2
for the production wells but only the 4th layer was perforated
Rw for the injection wells. The rational was to inject water from
And Bs = 2 Equation (5)
φ * Rt beneath to move to surface by gravity to sweep enough oil to the
surface. Pressure was set at initial reservoir pressure of 2450psia.
Waterflood Simulation The field was produced from 1951 to 2009. That was the start
of production to the end of last production history of the field.
Information gathered from the geological analysis and formation This was done to know the recovery if the field was produced with
J Pet Environ Biotechnol, Vol. 11 Iss. 2 No: 405
10Amihere-Ackah P, et al. OPEN ACCESS Freely available online
waterflooding from the beginning when reservoir had enough Fault block c prediction run
energy. The simulation period was extended for additional 10 years
After the model has been validated by history matching, the
to compare production response (from 1951-2019). These had
capability of the fault block C to produce for a period of ten
long span which practice will be highly dependent on economics.
(10) years under primary energy drive (solution gas drive) was
This methodological processes was carried out to determine if
assessed. The field was produced for 10 years (from 2009-2019)
it is appropriate to introduce waterflooding at the beginning of and a decrease in trend of production was observed (Figure 9). The
production when pressure is high above the bubble point pressure. cumulative production was 7490.1 MSTB of oil of the total oil
in place (27.541MMSTB) representing a recovery factor of 27.2%
Water injection below the bubble point pressure
(Table 2 and 3).
(development plan 2) for brownfields
Injection from beginning of production and above the
The matured field data was used to build the model and
bubble point pressure utilizing staggered line drive pattern
waterflooded for 10 years to see the production response. The field
is matured and undersaturated with pressure below the bubble Simulation was done to determine how oil could have been
point. After building the static and dynamic reservoir model and recovered if water injection was initiated at the beginning of the
doing prediction run to see the field production by primary drive production period. There was high oil recovery factor with low
mechanism (Figure 9), water was injected from end of production water injection rate (Table 4). There was high oil production from
data to the next ten years (2009-2019) to ascertain the production the staggered line drive pattern at an injection rate of 1000b/d with
response. This was also done by utilizing both five spot pattern recovery factor of 48.14% (Table 4). The irreducible oil saturation
(Table 8) and staggered line drive (Table 7) of the same well occurred at injection rate of 2500b/d (Table 4). A comparison of
arrangement as in water injection above the bubble point. This already field production records with when waterflood was done
from the start (1951) was done and this is presented in Table 5.
provided good basis for comparison. But here, because of the
existing wells on the field, some of these wells were converted to Figure 10 shows the location of injectors and producers for the
injectors due to high water oil ratio (WOR of 5:1) was deemed staggered line drive pattern for fault block C of the Catshill field
uneconomic [9] to produce and was converted to injectors. Also, in aerial view. Most of the oil was saturated in the third (3rd) and
based on the distribution of the oil saturation and existing well fourth (4th) layers of the block. In this regard, the new injectors and
arrangements, new injection and production wells were also producers were located around this area (That is, the thickest zone).
placed to increase sweep efficiency. Here, water injection rate Also, the cumulative oil produced with and without waterflooding
was varied from 1000b/d to 5000b/d to get injection rate with showed that waterflooding produced much higher production
(Figures 11, 12).
better recovery, low water cut and economic (Tables 7 and 8). The
reservoir pressure and other petrophysical properties that were Utilizing five spot pattern for injection from beginning of
utilized are in Appendix 1, Table 12. The well arrangements were production
the same as in injection above the bubble point to provide good
bases for comparison. Figure 13 shows the 3D view of the location of the injectors and
producers in the five spot pattern arrangement for production
RESULTS from above bubble point.
Similarly, if waterflood was done at start of production, a much
Formation evaluation and analysis for block C higher recover factor of 49.85% at 2500b/d would have being
Table 1 shows the calculated rock and fluid properties for the fault recovered as against the 27.2% recorded from primary recovery.
block. These properties were used extensively in the overall field Although the staggered line drive produced 48.34% at low injection
rate of 1000b/d. Irreducible oil saturation was reached at 2500b/d
development processes. The well logs used were analyzed to evaluate
same as in staggered line drive (Table 6).
reservoir properties such as shale volume, water saturation, sand
thickness and permeability in order to obtain the hydrocarbon Water injection below the bubble point pressure using
potential of the wells. staggered line drive
History matching to validate reservoir model built Table 6 show that at injection rate of 3500b/d, a much higher
recovery was recorded (39.41%) which was comparatively higher
After the geological information and the reservoir rock and fluid
than utilizing five spot injection pattern (Table 6).
properties has been fed into the CMG launcher to build the
reservoir model, a history match was performed. There was an Injecting below the bubble point using five spot pattern
observed close match for all the wells in fault block C enough to
validate the model (Figure 8). Some wells did not match exactly In order to get best pattern to yield better sweep efficiency, five
due to the quality of the data. However, the level of deviation does spot pattern was applied to the model below the bubble point. The
not present significant difference to affect quality. From the Figure staggered line drive gave higher recovery factor compared to the
8, the maximum production per day was 180b/d which decreased five spot pattern arrangement below the bubble point (Tables 7
upon further production with respect to decline in pressure and and 8). Figure 14 shows a close match in oil recovery by injecting
at same injection rates for 10 years but with higher recoveries from
time increase.
J Pet Environ Biotechnol, Vol. 11 Iss. 2 No: 405
11Amihere-Ackah P, et al. OPEN ACCESS Freely available online
staggered line drive making it a better option. The oil saturation oil is about 35% [12-14]. The recorded value could be due to
without waterflood (production by primary energy) shows very the availability of enough energy [43] and the well arrangement
little differences for the 10-year prediction (Figure 15). The effect pattern in the reservoir therefore small water injection rates can
of water injection at 3500b/d for the 10-year period (from 2009- result in good recovery with corresponding low water cut and
2019) as shown in Figure 16. WOR [42,44,45] This underscores with a similar study where
the macroscopic sweep efficiency was maximized by controlling
Figure 17 illustrates changes in NPV as the oil price varies. As the
the injection and production rates [46]. The production from
oil price increases, the NPV also increases. The project will not be
the waterflood was compared with existing production history
profitable if the oil price goes below 46 $/bbl. This could imply
and the waterflooded reservoir recorded much higher cumulative
profitability at comparatively low prices.
oil production (Table 5). This implies that if waterflooding was
DISCUSSION implemented right at the start of the field development, much oil
would have been recovered (Tables 4 and 6). According to Sallam et
The geology of the area of study was carefully analysed [30,31]. This al. [47] the implementation of waterflood increased oil production
followed formation evaluations to obtain accurate rock and fluid by 31% of the original oil in place.
properties necessary to determine the oil in place and remaining oil With respect to field development plan two, the best well
that can be exploited (4,19,20,31-33]. The Oil in Place is accurately arrangement pattern was the staggered line drive (Table 7 and
obtained by the best estimate of rock and fluid properties such as Figure 14). This arrangement yielded a recovery factor of 39.41%
water saturation, shale volume, porosity and permeability (Table at injection rate of 3500b/d which compares with findings that on
1 and Appendix 1, Table 12) but often comes with uncertainties average Recovery Factor from mature oilfields around the world
collaborating with findings [33]. The porosity of the field was is between 20% and 40% [48] With optimized waterflooding,
determined from core sample analysis as 0.31 (Appendix 1, Table there is potential to increase the amount of petroleum that
12) which represents a good value [34]. The permeability ranged can be economically produced from matured reservoirs [15].
from 137mD to 618mD with oil and gas having an API˚ gravity Comparatively, the recovery was low for the matured field than
between 35 to 40 (Appendix 1, Table 12). The permeability range production above the bubble point. This was attributed to the
was necessary to allow to movement of fluids which is equally low reservoir pressure [42]. At this injection period the pressure
reported [30,35,36] that adequate permeability is required to had fallen below the bubble point pressure and therefore would
permit movement of fluids at an acceptable rate with available well not have enough reservoir energy to recover much oil over the
spacing. The API gravity (Appendix 1, Table 12) presents a good ten-year period compared to when pressure was above the bubble
case of light oil and suitable for waterflooding. point [42,49] It is important to note that, in order to achieve good
Waterflooding has been predominantly used to recover oil from recovery from the Fault Block C, additional four injectors and four
most reservoirs worldwide [37]. Therefore, the possibility was producers were placed in the reservoir (Figure 16). This accounted
assessed in the field development for plan (1) injection above the for the additional oil production which is expected to be obtained
bubble point and plan (2) injection below the bubble point. After following the field development plan implementation. This is in
estimating the amount of oil that can be recovered by solution gas agreement that waterflooding improve oil production rate [50,51].
drive, there was the need to implement the waterflooding since Considering the amount of oil recovered, it means that some of the
oil still remained trapped in the ground [52]. According to Meshioye
the recovery was low (27.2%) which agrees to findings [31,38]
et al. [25] on the average, waterflood can recover about one-third
that the lifecycle for primary recovery is generally short and the
of the original oil in place (OOIP), leaving behind about two-thirds
recovery factor is usually low. Waterflooding is less expensive and
as observed in this situation. At some point of the injection rate,
can recover considerable amount of oil with better sweep efficiency
the water cut increased and oil production decreased (Table 4).
[39-42]. The Static reservoir model built was history matched to
This could be due to water breakthrough and water outrunning
the field production history to validate the model (Figure 8). Some
the oil and therefore producing at a much faster rate than the oil
of the reservoir properties were altered within the range of values
production rate [53].
determined (Table 1 and Appendix 1, Table 12). For instance, the
permeability for the various layers was varied between 137 mD and It must be emphasized that with the increase of the injected water
618 mD as well as varying the thickness. The constraints were set volumetric flow rate there is a consequent increase in the water
based on the properties of the reservoir. For instance, the bottom produced, which it is a negative aspect of the water injection method
hole pressure was set at 2450 psia and the surface oil flowing rate (Tables 4, 6, 7 and 8). The recovery factors were an indication that
set ‘Altered’ to take into account the varying oil flow rate of the implementing waterflood in the development of the Fault Block C
field at particular pressure of the field [31]. The amount of oil would be paramount. According to Strandli [54] there is a strong
recovered over the ten-year period was less than half of the total relationship between IOR investments and economics (Appendix
oil in place [31]. 1, Table 14). As such, the profitability and suitability of the project
was evaluated under various price fluctuations taking into account
The Waterflooding was carried out first from the beginning of NPV variation with respect to oil price per US$/bbl. during the life
the initiation of the field when pressure was high to determine of the project by running a sensitivity analysis. A project profitability
how much could have been produced if the waterflood was started indicator requires NPV and P/I ratio to be more than zero. This
from the beginning when the field was first been developed. It was project had favorable P/I ratio (1.04%) implying that the risk of
observed that the recovery factor was the highest (about 49.85% undertaking the project is not a critical factor (Table 14). At low
with low water injection rates) (Tables 4 and 6). Although some prices of less than or equal to 45 US$/bbl., negative NPV is seen
researchers reported that on the average, the recovery factor for (Figure 17) translating that at these prices investment costs exceed
J Pet Environ Biotechnol, Vol. 11 Iss. 2 No: 405
12Amihere-Ackah P, et al. OPEN ACCESS Freely available online
return on revenue and will render project not ideal (abandon). 3. Blaskovich FT. Historical problems with old field rejuvenation.
This outcome is no different from the report of Layti in 2017 [55] Presented at the SPE Asia Pacific Conference on Integrated Modelling
for Asset Management, Society of Petroleum Engineers, Yokohama,
that the simultaneous increase in investment costs could result Japan in 2000.
in negative NPV enhancing the chance of unprofitable project.
4. Babadagli T. Development of mature oil fields—A review. J Pet Sci
This negative NPV scenario (Figure 17) could be possible with Eng. 2007;57:221-246.
waterflooding of matured field due to extra expenditure on water
5. Sinanan B, Evans D, Budri M. Conceptualizing an improved oil
treatment facilities, installation costs, injector and producer wells recovery master plan for Trinidad and Tobago. Paper Society of
and also drilling for reliable water source. However, the waterflood Petroleum Engineers 180853 presented at the Society of Petroleum
project for the field development could stand some varying prices Engineers Trinidad and Tobago Section Energy Resources Conference.
(46$/bbl-100 US$/bbl) having positive NPV (Figure 17) and still Port of Spain, Trinidad and Tobago in 2016.
be profitable except for prices below 46 US$/bbl (Figure 17) which 6. Ernst and Young. Enhanced oil recovery methods in Russia: Time is
Off the Essence, UK in 2013.
is similarly reported by Strandli [54].
7. Ministry of Energy and Energy Industries. The Petroleum Taxes Act.
CONCLUSION 2009;75:04
8. Koldewijn BW. Sand Distribution in the “Cruise” and “Forest”
Based on the results of the study, the following significant
Sediments of Ortoire. Geological Report 1145 (unpublished). Shell
deductions can be made Trinidad Ltd in 1961.
1. When water was injected above the bubble point pressure, 9. Archie C. Geological Evaluation of the Catshill Sands in the Catshill
high recovery factor was seen. This concludes that when Field. Report by the Petroleum Company of Trinidad and Tobago.
water is injected at the beginning of field development 1989:3-8.
when pressure is high enough can lead to high oil recovery 10. CERA. Finding the Critical Numbers: What Are the Real Decline
Rates for Global Oil Production? Private report written by Peter M.
2. Using waterflood for brown field development can recover Jackson and Keith M. Eastwood in 2007.
some amount of oil as proven by this study but associated
11. ExxonMobil. A report on energy trends, greenhouse gas emissions,
with increased CAPEX and operating and cannot stand and alternative energy, information to shareholders: February 2004
very low prices
12. Gaffney-cline and Associates. Mature Fields Optimisation. Alton,
3. From the economic analysis of the field development plan, Hampshire GU34 4PU, United Kingdom. Accessed May 23, 2019.
the implementation of the project taking into account 13. Höök M, Hirsch R, Aleklett K. Giant oil field decline rates and their
Productivity index, NPV, DCFROR and payout time is influence on world oil production. Energy Policy. 2009;37:2262–
recommendable but will depend highly on company’s 2272.
financial ability and decision. 14. Litvak M, Gane B, McMurray L, Skinner R . Field development
optimization in a giant oil field in Azerbaijan and a mature oil field
RECOMMENDATIONS in the North Sea. Presented at the offshore technology conference,
Offshore Technology Conference, Texas, USA in 2007.
Deducing from the study, the following recommendations can be
15. Udy J, Hansen B, Maddux S, Petersen D, Heilner S, Stevens K. Review
given for further research and development of oil fields:
of field development optimization of waterflooding, EOR, and well
1. When developing new field with waterflooding it will be placement focusing on history matching and optimization algorithms.
advantageous to initiate waterflooding from the start since Processes. 2017;5:-25.
it yields higher oil recovery. 16. Ahmed T. Reservoir Engineering Handbook. Gulf Professional
Publishing. Burlington. Massachusetts, US in 2006.
2. The use of other Enhanced Oil Recovery (EOR) method
should be studied and tested for further development of 17. Craft BC, Hawkins MF, Terry RE. Applied petroleum reservoir
engineering. Prentice-Hall Englewood Cliffs, 3rd edition in 1959,
matured fields although water injection proved laudable Upper Saddle River. New Jersey, USA.
but the recovery was not so high.
18. Dake LP. Fundamentals of reservoir engineering. Elsevier, Amsterdam,
3. Since the fault blocks identified are not in communication, The Netherlands in 1983.
it is paramount to undertake further detailed and technical 19. Wang P, Aziz K, Litvak ML. Optimization of Production from Mature
studies in assessing the feasibility of developing the other Fields. Presented at the 17th World Petroleum Congress, World
Fault Blocks especially Fault Block D of the CO-30 sand Petroleum Congress, Rio de Janeiro, Brazil. 2002:1-5.
of the Catshill field because of the reasonable by-passed 20. Wen-Rui H. Necessity and feasibility of PetroChina: Mature
hydrocarbon accumulation in such block. Field Redevelopment. Petroleum Exploration and Development.
2008;35(1):1-2.
REFERENCES
21. Fanchi JR. Principles of applied reservoir simulation. Gulf Professional
1. Mezzomo CC, Schiozer DJ. Field development planning optimization Publishing in 2005.
using reservoir simulation. Universidade Estadual de Campinas. 22. Aziz K, Settari, A. Petroleum reservoir simulation. Chapman and Hall
2019;2:1-8. in 1979, Norwell Massachusett, US.
2. Alqahtani MH. A systematic approach to offshore fields development 23. Cancelliere M, Viberti D, Verga F. A step forward to closing the loop
using an integrated workflow. Master's Thesis, Texas A&M University, between static and dynamic reservoir modeling. Oil and Gas Science
US in 2010. and Technology in 2014.
J Pet Environ Biotechnol, Vol. 11 Iss. 2 No: 405
13Amihere-Ackah P, et al. OPEN ACCESS Freely available online
24. Seiler A, Rivenaes JC, Aanonsen SI, Evensen G. Structural problems in Nigeria's Crude Oil Production. J Disper Sci Technol.
Uncertainty Series. Society of Petroleum Engineers in 2009 at 2008;29(3):362-365.
Richardson, Texas, US.
42. Muggeridge A, Cockin A, Webb K, Frampton H, Collins I, Moulds
25. Meshioye O, Mackay E, Chukuwezi M. Optimization of waterflooding T, et al. Recovery rates, enhanced oil recovery and technological limits.
using smart well technology. Paper Society of Petroleum Engineers Philos Trans A Math Phys Eng Sci. 2014;13:372.
136996 presented at the 34th annual SPE international conference
and exhibition held in 2010 at Tinapa, Calabar, Nigeria. 43. Correie B, Silva G, Cunha A, Santos B. Water Injection for Oil
Recovery by using Reservoir Simulation via CFD. Int J Multiphys.
26. Abiodun Matthew A. Passive or Spontaneous Logs. Lecture notes. 2017;11(1):83-90.
2014:31.
44. Bondino I, Nguyen R, Hamon G, Ormehaug PA, Skauge A, Jouenne
27. Silva P, Bassiouni Z. A Shaly Sand Conductivity Model Based on S. Tertiary polymer flooding in extra-heavy oil: an investigation using
Variable Equivalent Counter-ion Conductivity and Dual Water 1D and 2D experiments, core scale simulation and pore scale network
Concepts. SPWLA Transaction paper RR in 1985. models. International Symposium of the Society of Core Analysts,
28. David Schechter. Formation evaluation PETE 663, Passive Austin, Texas, USA in 2011.
measurements-sp in 2010. 45. Stephen CM, Duane BD, Richard NM. Waterflood Optimization
29. Simandoux P. Dielectric measurements on porous media: application of the Buffalo Coulee Bakken Heavy Oil Pool of Southwestern
to measurement of water saturation: Study of the behavior of Saskatchewan, Society of PetroleumEngineers, SPE30285 in 1995.
argillacious formation. SPWLA, Houston. 1963:97-124. 46. Asadollahi, M., Nævda, G. l. and Shafieirad, A. Efficient workflow for
30. Willhite FP. Waterflooding, Textbook Series. Society of Petroleum optimizing well controls. J Petrol Sci Eng. 2012;82-83:66-74.
Engineers, Dallas, USA. 1986:3.
47. Sallam S, Nasr M, Ahmad MM. The Effect of Water Injection on Oil
31. Zitha P, Felder R, Zornes D, Brown K, Mohanty K. Increasing Well Productivity. Conference Paper in 2015.
hydrocarbon recovery factors. Society of Petroleum Engineers in 2019.
48. Sandrea I, Sandrea R. Recovery factors leave vast target for EOR
32. Egwebe O. Petroleum exploration in the Niger Delta. NAPE technologies. Oil Gas J. 2007;105:44–47.
Publication. 2003;3:3-10.
49. Wang FP, Ambrose WA, Hentz TF. Engineering and Characterization
33. Ayoola EO. Volumetrices of field in Eastern Niger Delta, Proceedings of Giant East Texas Oil Field: North and South Pilot Studies. Proc.,
of the 23rd Annual Nape International Conference, Lagos Nigeria. Society of Petroleum Engineers the Annual Technology Conference
2004:10-16. and Exhibition. Denver. Colorado. USA in 2008.
34. Tissot BP, Welte DH. Petroleum formation and Occurrence. Springer-
50. Morrow N, Buckley J. Improved Oil Recovery by Low-Salinity
Verlag, Berlin. 1984:356-361.
Waterflooding. Journal of Petroleum Technology. 2011;63(5):106-112.
35. Craig FF. The Reservoir Engineering Aspects of Waterflooding.
Society of Petroleum Engineers in 1971, New York, Dallas, USA. 51. Khatib S, Walsh JM. Extending the Life of Mature Assets: How
integrating subsurface and surface knowledge and best practices can
36. Rose SC, Buckwalter JF, Woodhall RJ. The Design of Engineering increase production and maintain integrity. Society of Petroleum
Aspects of Water-flooding. Society of Petroleum Engineers in 1989, Engineers-170804-MS Annual Technical Conference and Exhibition
Richardson in Texas, USA. held in Amsterdam, The Netherlands. 2014;6-8
37. Craft BC, Hawkins MF. Applied Petroleum Reservoir Engineering. 52. Society of Petroleum Engineers. Microscopic Efficiency of
Prentice Hall PTR. Englewood Cliffs in 1991, New Jersey, US. Waterflooding in 2014.
38. Terry RE. Enhanced Oil Recovery. In Encyclopedia of Physical Science
53. Van Essen G, Zandvliet MP, Van DH, Bosgra O, Jansen J. Robust
and Tchnology, 3rd Edition, Robert A. Meyers Ed., Academic Press,
optimization of oil reservoir flooding. In Proceedings of the IEEE
2001;18:503-518.
International Conference on Control Applications in 2006.
39. Morsy S, Shengand JJ, Ezewu RO. Potential of Waterflooding in Shale
Formations. Paper Society of Petroleum Engineers 167510, presented 54. Strandli A. Rystad Energy venter ytterligere aktivitetsfall offshore.
at the Society of Petroleum Engineers Nigeria Annual International Hegnar in 2017 Retrieved from http://www.hegnar.no/Nyheter/
Conference and Exhibition, Lagos, Nigeria in 2013. Energi/2017/03/Rystad-Energy-venter-ytterligere-aktivitetsfall-
offshore.
40. Asheim H. Optimal Control of Water Drive. Society of Petroleum
Engineers.15978-MS General in 1987. 55. Layti F. Profitability of Enhanced Oil Recovery. Economic Potential of
LoSal EOR at the Clair Ridge Field, UK. Master's Thesis, University
41. Adeniyi OD, Nwalor JU, Ako CT. A review on water-flooding of Stavanger, Norway in 2017.
J Pet Environ Biotechnol, Vol. 11 Iss. 2 No: 405
14You can also read