Definition of the Ecological Flow (Eflow) using the Indicators of Hydrological Alteration and IARI as an operative tool for water management
←
→
Page content transcription
If your browser does not render page correctly, please read the page content below
Preprints (www.preprints.org) | NOT PEER-REVIEWED | Posted: 13 May 2021 doi:10.20944/preprints202105.0309.v1

 Article
 Definition of the Ecological Flow (Eflow) using the
 Indicators of Hydrological Alteration and IARI as an
 operative tool for water management
 Michele Greco1,2,*, Francesco Arbia2, Raffaele Giampietro2
 1 Engineering School, University of Basilicata, Potenza, Italy; michele.greco@unibas.it
 2 Regional Environmental Research Foundation of Basilicata, Potenza, Italy; michele.greco@farbas.it
 * Correspondence: michele.greco@unibas.it; Tel: +393293178389;

 Abstract: According to the Water Framework Directive, the Ecological Flow (Eflow) is assumed to
 be the minimum water discharge required to achieve and maintain the environmental objectives of
 “good quality status” in a natural water body. It is highly recognized that, the hydrological regime
 of natural flow plays a primary and crucial role influencing the physical conditions of habitats,
 which in turn determines the biotic composition and sustainability of aquatic ecosystems.
 Furthermore, the simple assumption to supply a minimum instream during dry periods is not
 enough any longer in order to protect the river environment. The recent hydro-ecological
 understanding states that all flow components might be considered as operational targets for water
 management, starting from base flows (including low flows) to high and flood regimes in terms of
 magnitude, frequency, duration, timing and rate of change. Several codes have been developed and
 applied on different case studies in order to define common tools to be implemented for the Eflow
 assessment. The study proposes the application of the Indicators of Hydrologic Alteration
 methodology (IHA by TNC) coupled to the valuation of the Index of Hydrological Regime
 Alteration (IARI by ISPRA) as an operative tool to define the ecological flow in each monitoring
 cross section to support the sustainable water resources management and planning. The case study
 of Agri River, in Basilicata (Southern Italy) is presented. The analyses have been carried out on
 monthly discharge data derived applying the HEC-Hydrological Modelling System at the basin
 scale using the daily rain data measurements obtained by the regional rainfall gauge stations and
 calibrated through the observed inlet water discharge registered at the Lago del Pertusillo reservoir
 station.

 Keywords: Ecological flow, Indicators of Hydrologic Alteration, Index of Hydrological Regime
 Alteration, HEC-HMS,

 1. Introduction
 The recent evolution of the European and national regulatory framework, as well as the
 obligation to adapt and achieve the requirement of good quality in water bodies imposed by the
 Water Framework Directive (WFD 2000/60/EC) [1] needs the definition of the Ecological Flow
 (Eflow). The Eflow represents the amount, quality and timing, of water discharge required to sustain
 riparian and estuarine ecosystems as well as the human livelihoods and well-being depending on
 these [2]. Ecological flow can be defined as the minimum value of the discharge to be maintained in
 the river to ensure good (better optimum) conditions for the existing ecosystems; according to
 appropriate criterion based on the hydrological and environmental conditions respecting the
 biological balance.
 The knowledge acquired in recent years in the field of hydro-ecology has highlighted the
 fundamental role of the hydrological river stages and their time variability, from drought up to flood,
 in relation to the life of river ecosystems in terms of maintenance, development and evolution of
 habitats, flora and benthos [3 - 8]. Thus, the Eflow might be assumed as the rate of natural discharge
 that should be left in the water body to maintain high value of water resources and water-related

 © 2021 by the author(s). Distributed under a Creative Commons CC BY license.
Preprints (www.preprints.org) | NOT PEER-REVIEWED | Posted: 13 May 2021 doi:10.20944/preprints202105.0309.v1

 ecosystems, according to the requirements of environmental protection [9]. Furthermore, the concept
 of Eflow evolved from the simple idea to determine the minimum water discharge needed for the
 existence of ecological species [10] to the complex view dealing with the possible implications on
 river ecosystem management in anthropogenic-stressed basins [11-13]. In other words, Eflow should
 represent the imposed conditions on river hydrology able to provide appropriate ecological functions
 under flow regulation restrictions induced by natural and/or anthropogenetic stresses [14].
 The European and Italian national frameworks to date, unfortunately, still note situations in which
 the current unavailability of specific measures and monitoring activities, requires the adoption and
 implementation of a transitional phase in which the "no deterioration" of the quality status of water
 body must be achieved and guaranteed. This condition might be determined on the basis of scientific
 methodologies arising from relevant international experiences, as suggested by the European
 Commission in the guidelines on ecological flow [15].
 Several methods are reported in literature which were developed in the field of eco-hydrology
 for the assessment of ecological flow [16]. In a general overview, these methods can be classified in
 the three following groups [17-19]:
 1 - Hydrological indicators and/or parameters, derived on the analysis of hydrological and
 hydraulic data arising from the monitoring activities without focusing on specific species or biotic
 communities.
 2 - Habitat assessment and change forecasting, based on the principle that good habitat
 conditions for several species are the consequence of the interaction among water discharge, riverbed
 geometry, and vegetation allowing the proper depth/flow velocity ratio necessary for species in
 various age groups.
 3 - Functional analyses through the analysis and understanding of functional relationships
 between hydrology and river ecosystem.
 The methods for Eflow assessment should consider the natural variability of river flow by providing
 different flow components in order to obtain the best condition of freshwater ecosystems, habitats,
 and wetland species [20]. Thus, the assessment of minimum life inflow might not be subject only to
 economic criteria but following the general principles of sustainable development which allows
 socio-economic growth according to the simultaneous maintenance of natural balance [21-23].
 Due to simplicity and straightforward application, hydrological and hydraulic methods are
 commonly used to compute Eflow, which is assumed depending on the given characteristic discharge
 observed in the water course. Meanwhile, hydraulic methods are supported by quantitative
 relationships between natural flows and habitats. These methods consider the effects of water flow
 variability on the habitat of main fish species referring to their optimal condition for living,
 reproduction, migration, and feeding.
 The geometrical parameters, like wetted perimeter, maximum depth, or aspect ratio are generally
 used coupled to vertical and cross-sectional flow velocity distribution. Whenever no velocity data are
 available, expeditive entropy-based models might be used for the assessment of the vertical velocity
 profile in order to derive local velocity-gradients and, thus, bed shear stress [24, 25]. The hydraulic
 methods are suggested for use in catchment areas where hydrometric observations are not available,
 or for controlled cross-sections [26-30]. Furthermore, in the flow-habitat models the ecological flow
 is calculated from interactions between the water discharge and the riverbed morphology, rather than
 establishing the suitable habitat conditions corresponding to the local morphological conditions. The
 IFIM [31-33] is one of the most common methodology used to estimate the environmental flow as
 well as PHABISM [34, 35], HABIOSIM [36] and RSS [37].
 In the present paper, the Indicators of Hydrological Alteration - IHA methodology [38-44] has been
 used coupled with the Hydrological Regime Alteration Index - IARI [45] in order to define the
 optimal value of the water discharge flowing in the water body able to warranty the acceptable
 sustainable water management for ecological integrity.
 Furthermore, the rational of the study deals with cascade models starting from a classical rainfall-
 runoff model, like HEC- Hydrological Modelling System (HEC-HMS) for the assessment of the
 daily/monthly water discharge flowing in a generic control cross section along the water body,
 feeding the IHA. Then, in the different timing for the water stage the percentile corresponding to the
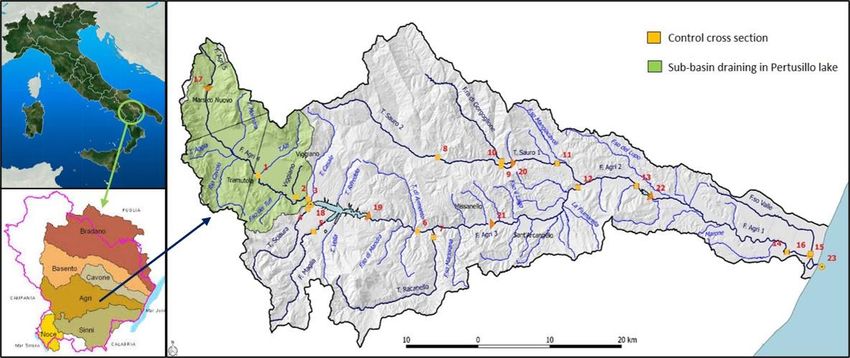
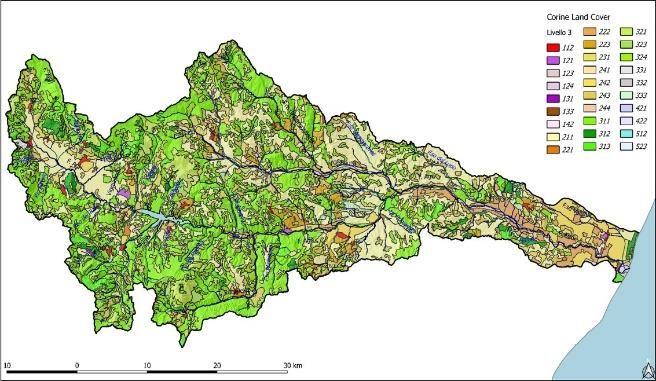
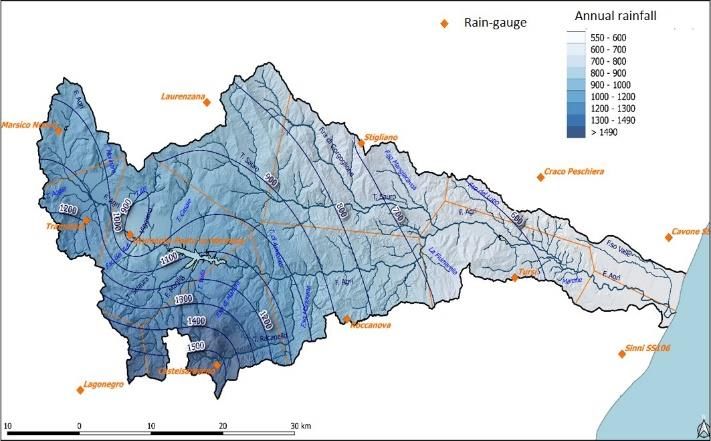
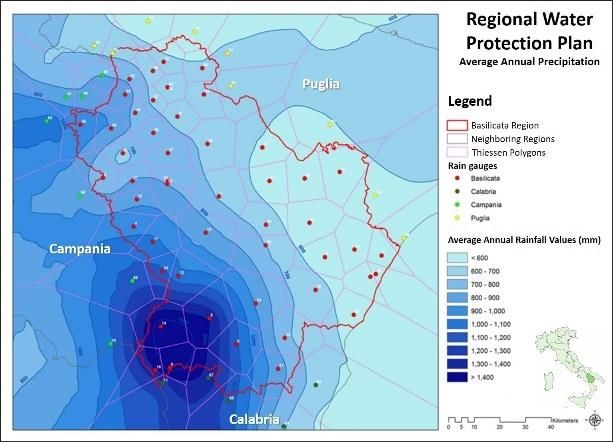
Preprints (www.preprints.org) | NOT PEER-REVIEWED | Posted: 13 May 2021 doi:10.20944/preprints202105.0309.v1

 minimum discharge is assumed satisfying the boundary condition imposed by the respect of the
 reference value of the IARI for good status at least. This value is assumed as the Eflow for the
 corresponding cross section.

 2. Materials and Methods

 Study area – The Agri River Basin
 The proposed analysis has been applied to all of the Lucanian river networks (Basilicata region
 - Southern Italy) but the present study refers to the case study of Agri River as a suitable example
 representing all the problems observed on the Lucanian river systems (Fig.1).
 In detail, the study area consists of the Agri River basin. Agri River is one of the six major rivers
 of the Basilicata region, with a drainage basin area over 1715 km 2 and varying morphology from
 mountainous and hilly, in the medium-high upstream part, to low hilly and flat, in the downstream
 portion (Fig. 2).

 Figure 1 – The Study area of Agri River, the map of control cross section and example of sub-basin

 The hydrographic network is substantially ramified, presenting a main stream of about 113 km
 long, whose mountainous reach with NNW-SSE trend, crossing the intermontane depression of the
 Alta Val d’Agri and then assuming a fairly regular W-E trend reaching the Ionian coast of Basilicata.
 The average annual rainfall is quite homogeneous along the basin, following the distributions aligned
 to the NW-SE ridge with a reference value of about 900 mm/yr (Fig. 3).

 Figure 2 – Corine Land Cover and Curve Number maps of Agri River basin
Preprints (www.preprints.org) | NOT PEER-REVIEWED | Posted: 13 May 2021 doi:10.20944/preprints202105.0309.v1

 Figure 3 – Rain-gauge network, the average annual regional rainfall and Agri River basin maps

 Methodology
 The evaluation of the hydrological regime alteration of a watercourse, both in terms of
 characterization and quantification, is a problem still not fully solved, leaving significant degrees of
 arbitrariness for decision makers, and depending on direct and indirect assessments of hydrological
 functional scenarios.
 Observing the international background, several methodologies have been developed for evaluating
 the alteration of the hydrological regime as summarily reported in Table 1 [46].

 Table 1. List of international methodologies for hydrological regime alteration.

 Method Acronym Country Reference
 The Indicators of Hydrologic Richter et al. (1996; 1997)
 IHA USA
 Alteration [38, 39]
 Indice di Alterazione del Regime
 IARI Italy Ispra (2011) [45]
 Idrologico
 Dundee Hydrological Regime
 DHRAM Scotland Black et al. (2005) [47]
 Alteration Method
 Hydrologic Index Tool HIT USA Henriksen et al. (2006) [48]
 Hydrology Driver Assessment Index HAI South Africa Kleynhans et al. (2005) [49]
 HIDRI- Protocolo 3 QM - HIDRI Spain Munné et al. (2006) [50]
 Histogram Matching Approach HAI Taiwan Shiau and Wu (2008) [51]
 Indices de Alteracion Hidrologica en Martínez Santa-María et
 IAHRIS Spain
 Rios al.(2008) [52]

 All the procedures mentioned in Table 1, are generally based on the comparison between an
 undisturbed condition and altered condition, both characterized by the value assumed by several
 descriptive parameters for different aspects of the hydrological regime.
 In particular, ISPRA (2011) [45] proposes the implementation of the combined use of "Indicators of
 Hydrologic Alteration" (IHA) and the “Hydrological Regime Alteration Index” (IARI), as a useful
 tool for assessing changes in the hydrological regime of a watercourse induced by anthropogenic
 pressures such as dams, diversions, hydroelectric plants, or any other type of action affecting the
 naturalness of the river system [53, 54].
 The analysis of the hydrological regime alteration of a watercourse, indeed, might be carried out at a
 cross-section of the watercourse on the basis of the IARI methodology, which provides a measure of
 the deviation of the hydrological regime, assessed on a daily or monthly scale, compared to the
 natural datum corresponding to the absence of any anthropogenic pressure.
 Furthermore, the IHA can be calculated using parametric (mean/standard deviation) or non-
 parametric (percentile) analysis starting from the time series of water discharge. The IHA parameters
 and their influence on the ecosystem are attributable to five main hydrological groups, HG, [38, 39]:
 • Group 1: the monthly condition of the watercourse;
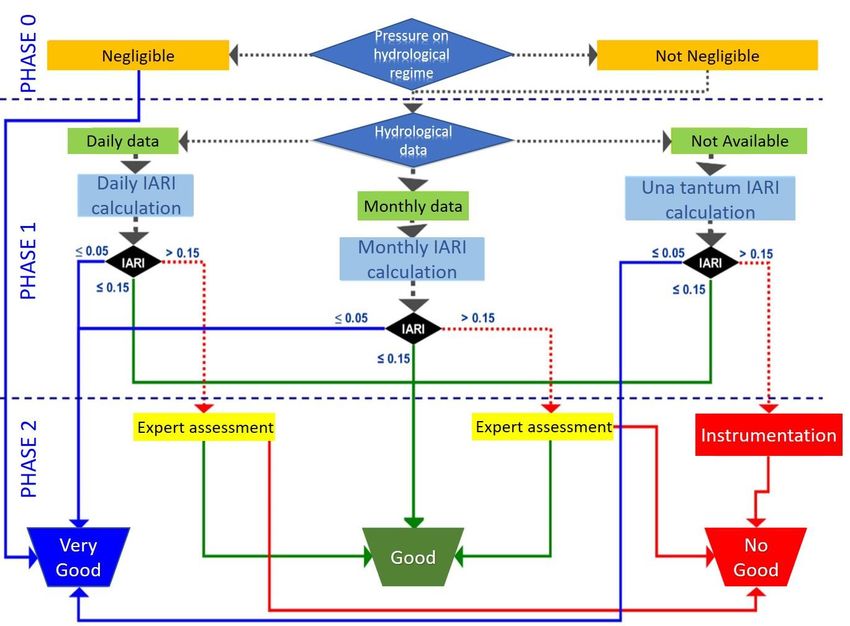
Preprints (www.preprints.org) | NOT PEER-REVIEWED | Posted: 13 May 2021 doi:10.20944/preprints202105.0309.v1

 • Group 2: minimum and maximum flow conditions at 3-7-30-90 days, zero flow days and base
 flow rates;
 • Group 3: the extreme conditions of the watercourse and the number of days with the same flow
 rate;
 • Group 4: frequency and duration of high and low impulse flows;
 • Group 5: the frequency of variability of the flow rate.
 and five different types of environmental flow components, EFC, as following:
 • Type 1, Minimum flow rate: represents the dominant condition in most water courses and
 represents the base flow;
 • Type 2, Extreme drought: present during drought periods, with very low levels of flow if not
 completely zero, to which correspond conditions of particular criticality for some types of
 organisms and could be a source of life for other species;
 • Type 3, High flow rate pulses: include any flow rate increase, such as significant rain periods,
 which are necessary and important for the relief of ecosystems at minimum flow rates;
 • Type 4, Small floods: these promote the mobility of aquatic fauna usually confined to swamps,
 ponds and shallow wetlands that usually correspond to poorly accessible habitats;
 • Type 5, Major floods: which corresponds to a reorganization of the biological and physical
 structure of a stream.
 The entire range of flow conditions represented by the EFC components (globally 33
 parameters), must be maintained in order to ensure river ecological integrity.
 The IARI is determined from the flow data, by comparing the "altered" flow rates with the
 corresponding natural flow rates, as indicated by the ISPRA [45] according to the following criteria:
 1) provide a quantitative measure of the deviation of the observed hydrological regime from the
 natural one that would occur in the absence of anthropogenic pressures;
 2) take into account the general and widespread scarcity and/or absence of data;
 3) be able to use all available hydrological information;
 4) use tools, methods and results already available from the competent entities that carried out the
 hydrological and water balance in the water protection plans;
 5) be easy to implement and calculate with the usual calculation tools.
 The procedure has the following characteristics:
 a) is defined at successive levels of in-depth analysis;
 b) is defined primarily on the basis of the monthly average flow rates to take into account the effect
 of seasonality and to use the results of the water balance of the protection plans;
 c) is defined differently for river sections with or without flow measurement instrumentation;
 d) is derived from the IHA method and the statistics used in the procedure can be easily calculated
 with the corresponding open-source software IHA.
 With regard to the reference values for the IARI, it is useful to point out that, conventionally, the
 following ranges are adopted:
 • 0 ≤ IARI ≤ 0.05 excellent
 • 0.05 < IARI ≤ 0.15 good
 • IARI > 0.15 no good
 Thus, the procedure for the assessment of the status of the hydrological regime through the
 determination of the IARI, is divided into three phases (Figure 4):
 1. Phase 0 - preliminary analysis: An analysis of the basin-scale pressures shall be carried out in order
 to identify the detectable conditions in the considered section by selecting one of the following
 conditions:
 • no or negligible pressure on the hydrological regime, it can be assumed that it is unchanged;
 • significant or not negligible pressures leading to impacts that cannot be assessed a priori, a
 necessary assessment must be made on an objective basis.
 2. Phase 1- calculation of the index: if in Phase 0 the identified conditions do not show the absence of
 impact on the hydrological regime due to pressure, the quantitative assessment of the alteration
 is carried out through the calculation of the IARI index.
Preprints (www.preprints.org) | NOT PEER-REVIEWED | Posted: 13 May 2021 doi:10.20944/preprints202105.0309.v1

 3. Phase 2- direct evaluation or consultation: this step is accessed whenever the results obtained in
 Phase 1 reveal critical elements. In such a case, a detailed analysis essentially based on the
 qualified information given by experts is provided in order to explain the causes and to confirm
 or not the exposed criticalities.

 Figure 4 - IARI evaluation procedure (ISPRA, 2011)

 In detail in each control cross section, based on the monthly time series relating to the "undisturbed"
 condition, the 25-th and 75-th percentiles, XN0.25,i and XN0.75,i, must be computed per each i-th IHA
 parameter (i.e the monthly flow discharge)
 Subsequently, for each i-th parameter, the characteristic value, Xi,k, corresponding to k-th reference
 period in which the altered condition occur, i.e. in the present case corresponds to the value of
 monthly flow rate assumed as the monthly ecological flow.
 Furthermore, through the comparison between the value Xi,k and the XN 0.25,i and XN 0.75,i, the term pi,k
 is calculated according to the procedural scheme reported in the following equation:
 0 if N 0.25,i ≤ , ≤ 0.75,

 , = , − N 0.25,i , − N 0.75,i (1)
 (| |,| |) , 0.75,
 { 0.75, − N 0.25,i 0.75, − N 0.25,i

 where:
 • i refers to the i-th IHA parameter;
 • k is the reference period;
 • Xi,k is, the characteristic value of the i-th parameter corresponding to k-th reference period in
 which the altered condition occur;
 • XN 0.25,i is the 25-th percentile of the i-th IHA parameter in the natural condition (unaltered
 condition);
 • XN 0.75,i is the 75-th percentile of the i-th IHA parameter in the natural condition (unaltered
 condition).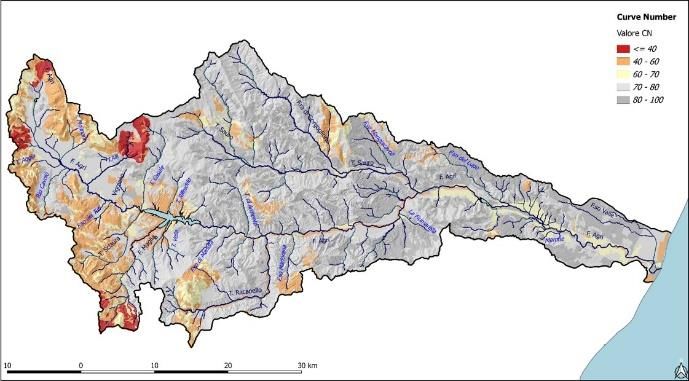
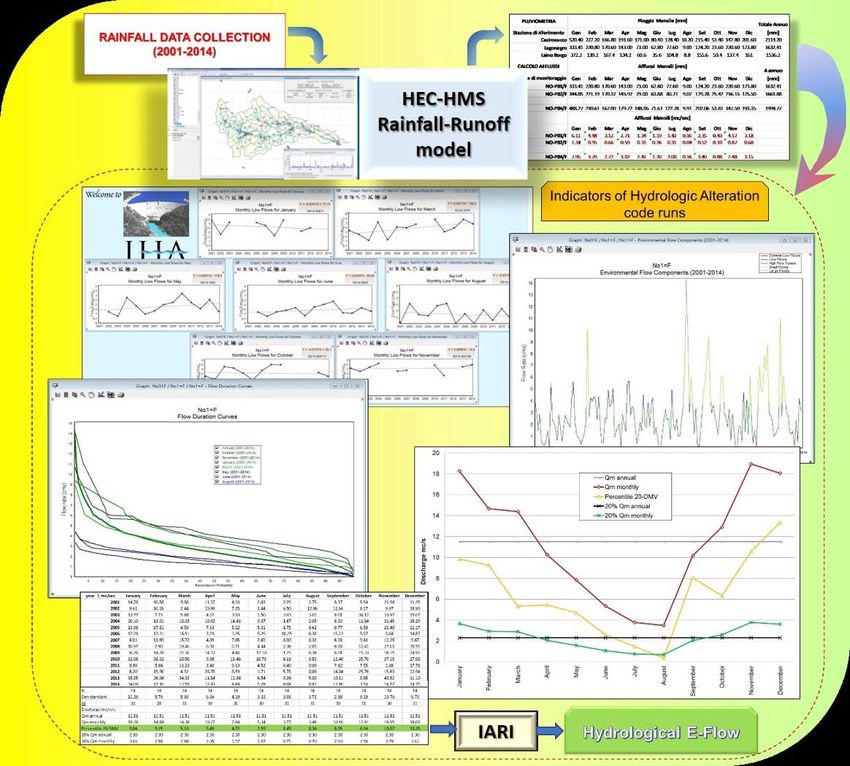
Preprints (www.preprints.org) | NOT PEER-REVIEWED | Posted: 13 May 2021 doi:10.20944/preprints202105.0309.v1

 In other words, if the value of the parameter Xi,k falls within the band delimited by the percentiles
 25% and 75%, the term pi,k is assumed to be zero, corresponding to a condition of ordinary fluctuation,
 otherwise it is equal to the minimum distance, normalized on the amplitude of the interval, from the
 limits of the band. IARI is therefore defined as the average of the values assumed by the terms pi,k.
 In order to identify the groups of elements which have the greatest influence on the alteration of the
 regime, also to plan any intervention measures, the IARI is estimated for each group and the average
 was then calculated as reported in the following Eq. 2 based on the number of parameters belonging
 to the generic group j=1,2,… ,5.

 1 1 1
 = ∑5 =1 ( ∑ =1 , ) = ∑33
 1 , , (2)
 33 33

 In this framework, the Eflow is considered as the hydrological alteration induced in the water
 body. Thus, the hydrological Eflow arises from the assessment of the levels of acceptability of
 Indicators of Hydrological Alteration (IHA) and the determination of the Hydrological Regime
 Alteration Index (IARI), at a generic river cross section.
 The methodology, therefore, defines the ecological flow as the i-th percentile of the distribution
 of the average monthly flows which provides a value of IARI corresponding to a “good” level at least.
 Whenever, no time series of water discharge are available, and a rain-gauge network is present, a
 classical catchment rainfall-runoff modelling can be used. In the present study the HEC-Hydrological
 Model System was employed using a suitable rainfall time series available from the regional civil
 protection gauge network. The HEC-HMS simulates the complete hydrologic processes of river
 catchment systems, and includes several traditional hydrologic analyses such as infiltration, unit
 hydrographs, and hydrologic routing [55 - 57].
 Following such an approach, the concept of ecological flow goes far beyond the commonly reductive
 idea in which the minimum ecological flow rate corresponds to a fixed percentage of the average
 annual flow rate. The Eflow, indeed, represents the monthly water discharge inducing acceptable
 alteration on the hydrological regime ensuring the functionality of the water body.
 The methodology is immediately spatially scaling and applicable to a generic cross section of any
 watercourse.

 3. Discussion and results
 Since the main objective of the above-described procedure is to detect any changes in the hydrological
 regime induced by the adoption of the Eflow, a crucial aspect is the definition of the reference
 condition for the hydrological regime corresponding to the “unaltered” condition. Therefore, ISPRA
 (ISPRA, 2011) suggests that this condition should be identified from a series of daily/monthly flow
 rates that can be taken as "natural" at least for 15 years, in order to ensure a sufficiently reliable
 hydrological evaluation.
 Omitting the detailed analysis and the numerical aspect of the briefly above mentioned, the proposed
 methodology has been applied to all the rivers of Basilicata, in order to assess the monthly
 hydrological Eflow to be guaranteed in each control section identified in the "Plan for monitoring
 surface water bodies" of the Basilicata Region. The case study of Agri River is discussed further
 below.
 In detail, the following steps are made for the first assessment of the hydrological Eflow (Fig. 5)
 1. collection of the hydrological data of the river under investigation: precipitation values observed
 at the available rain stations and the flow data observed at the measuring sections along the water
 course (minimum 15 years);
 2. hydrological analysis and implementation of the HEC-HMS at the basin scale for the evaluation
 of regionalization laws and to compute the average flow rates on a fixed time basis (monthly,
 annual);
Preprints (www.preprints.org) | NOT PEER-REVIEWED | Posted: 13 May 2021 doi:10.20944/preprints202105.0309.v1

 Figure 5 – Logical procedure for the Hydrological Eflow assessment

 Tables 2 and 3 report the reconstructed and observed data respectively, referred to the Pertusillo Lake
 control cross section selected along the Agri river. The Pertusillo Lake, indeed, represents the gauged
 section corresponding to the inlet of the reservoir in which the water discharge is measured by the
 Management Authority.
 The measures are generally collected daily in order to provide a daily inflow/outflow water storage
 balance.
 The data reported in the tables are referred to the average monthly discharge computed by
 HEC_HMS and the observed ones to the control cross section.
 The significance and the validation of the reconstructed data was evaluated using two criteria: the
 root mean square, ERMS, and mean absolute percentage error, EMA, expressed as follows:

 2
 1 ( ) − ( )
 =√ ∑ ( ) (3)
 =1 ( )

 1 ( ) − ( )
 = ∑ | |
 =1 ( ) (4)
Preprints (www.preprints.org) | NOT PEER-REVIEWED | Posted: 13 May 2021 doi:10.20944/preprints202105.0309.v1

 where Xo is the observed value, and Xc is the value estimated by the application of HEC-HMS.
 The tests were applied to the data set for the same period 2001-2007, obtaining 0.26 and 0.35 for ERMS
 and EMA respectively, which represents an acceptable result. Moreover, Figure 6 shows the
 comparison between the compute and observed average monthly discharge at the Pertusillo Lake
 cross section presenting a good correlation with R2=0.9836.

 Table 2. – Reconstructed water discharge data for the control cross section of Pertusillo Lake

 Reference Cross Section PR01 - Pertusillo Reservoir Monthly Water Discharge (mc/s)
 January February March April May June July August September October November December
 2001 8.43 7.54 6.99 7.24 4.17 2.39 2.42 1.20 2.71 4.78 2.97 7.18
 2002 8.31 6.98 5.40 8.42 5.96 2.50 2.73 3.55 5.47 6.58 8.16 10.40
 2003 10.05 6.19 7.51 5.15 4.11 2.60 3.38 1.06 2.48 5.16 8.69 8.55
 2004 11.63 10.94 8.86 7.12 7.52 3.16 2.59 0.94 4.36 4.90 7.30 11.90
 2005 6.24 4.93 11.08 3.70 4.35 1.89 2.09 2.82 3.81 5.61 11.71 16.04
 2006 6.63 9.39 8.59 5.89 1.66 2.89 2.72 2.73 3.90 0.96 3.63 8.27
 2007 4.12 10.19 6.54 5.32 5.22 3.30 0.23 0.40 1.73 5.28 6.75 5.85
 2008 4.37 10.61 1.92 4.65 2.84 2.56 2.51 0.66 3.98 5.05 11.38 10.96
 2009 20.01 18.39 7.78 15.23 6.46 1.74 2.23 2.90 3.55 6.03 8.02 11.40
 2010 11.17 15.33 16.35 8.14 11.92 3.84 2.62 1.28 2.01 4.60 10.02 9.25
 2011 6.03 15.41 5.18 5.58 7.10 2.70 1.21 1.48 3.09 4.16 5.38 8.47
 2012 6.28 6.11 13.22 12.52 5.31 1.16 1.93 0.41 3.52 5.94 8.21 9.23
 2013 17.38 17.12 14.90 4.39 5.81 4.27 2.29 2.53 2.53 5.23 6.27 13.94
 2014 12.62 6.46 9.21 11.05 5.44 3.78 2.62 0.68 4.42 3.15 8.63 6.58

 Table 3 – Observed water discharge data for the control cross section of Pertusillo Lake
 Reference Cross Section PR01 - Pertusillo Reservoir Observed Monthly Water Discharge (mc/s)
 January February March April May June July August September October November December
 1987 11.35 16.57 8.00 6.60 3.74 2.73 1.77 1.23 1.50 2.45 3.33 5.32
 1988 8.10 9.17 13.71 6.17 3.55 2.27 1.26 0.55 1.90 2.19 7.43 9.87
 1989 3.03 8.57 9.94 5.93 3.74 2.00 1.19 0.87 1.07 3.65 4.53 8.03
 1990 3.26 3.39 3.10 13.30 3.90 1.43 0.48 0.42 0.73 2.26 4.70 21.52
 1991 10.81 13.50 6.77 17.33 8.10 1.87 1.26 1.52 2.07 3.13 15.07 5.39
 1992 5.26 4.03 3.39 5.80 3.07 1.77 1.00 0.39 0.67 2.68 5.87 7.23
 1993 6.29 3.46 11.65 6.43 4.19 1.03 0.26 0.06 1.13 2.36 4.43 12.13
 1994 15.00 18.43 6.58 10.27 7.16 0.70 1.42 0.61 0.63 2.39 4.00 3.74
 1995 7.81 5.89 12.06 11.70 8.42 2.20 1.87 2.00 2.57 1.94 2.53 7.26
 1996 6.71 15.41 16.94 13.83 7.61 3.20 1.48 0.61 2.83 9.55 19.30 20.84
 1997 15.65 8.86 6.03 6.03 5.52 1.40 1.10 1.48 1.17 4.16 12.43 12.16
 1998 9.65 15.82 6.42 7.07 8.71 1.90 0.58 1.61 3.33 6.26 5.30 10.29
 1999 8.16 12.14 11.61 10.87 5.36 1.63 1.07 0.45 1.97 2.58 7.63 10.48
 2000 5.52 8.79 6.39 6.13 2.84 0.97 0.23 0.03 1.27 3.52 4.10 8.68
 2001 11.90 6.43 6.97 7.27 3.39 2.70 2.52 2.42 4.67 2.10 2.63 4.13
 2002 5.71 4.36 4.00 7.23 3.13 1.37 2.90 1.55 2.77 3.42 8.33 7.94
 2003 21.94 13.04 7.55 5.13 1.87 1.33 2.71 1.13 1.47 6.13 3.70 8.74
 2004 9.10 10.83 9.65 9.73 10.39 3.93 1.23 1.00 2.13 2.61 6.23 9.26
 2005 9.52 13.71 10.29 11.07 6.26 3.63 1.55 1.81 3.43 2.84 6.53 15.55
 2006 14.35 13.86 12.65 9.57 4.84 3.13 3.13 2.36 2.67 2.23 2.03 5.87
 2007 6.10 7.75 15.06 9.87 4.16 2.83 0.55 0.55 1.13 3.00 5.00 10.00
Preprints (www.preprints.org) | NOT PEER-REVIEWED | Posted: 13 May 2021 doi:10.20944/preprints202105.0309.v1

 Figure 6 – Computed vs observed average monthly water discharge at the Pertusillo Lake cross
 section

 3. implementation of the IHA calculation code (TNC) to the reconstructed flow discharge time
 series in each control cross section obtaining the EFC’s time distributions;
 4. implementation on “a non-parametric basis” analysis at the control cross section scale and for the
 entire observation period covered by the hydrological dataset (minimum 10 years), of the IHA
 code and evaluation of the corresponding EFCs;
 5. analysis of the regressive trend of the flow components and assessment of the flow rate
 corresponding to the 25-th and 75-th percentile of the flow distributions computed and observed
 on the reference time base respectively;
 6. in each control cross section, assessment of the hydrological Eflow as the i-th percentile of the
 monthly flow distribution for which the corresponding value of the IARI falls in the range 0,05-
 0,15, consistent to the “good“ level; in the present case study the Eflow is assumed to be the 20-
 th percentile of the monthly water discharge.
 Tables 4 and 5 report the computed and observed flow components in terms of annual and monthly
 average discharges and the 25-th and 75-th percentiles, evaluated at the Pertusillo Lake cross section
 as well as the monthly distribution of the 20-th percentile, here assumed to be the monthly Eflow.
 The corresponding values of the IARI are 0.12 and 0.05 for the computed and observed values of the
 Eflow respectively, both falling into the class of “good” level.
 Furthermore, Figures 7 and 8 draw the distribution of the main environmental flow components
 (average annual discharge, average monthly discharge, 20-th, 25-th and 75-th percentile) for both
 computed and observed and the relative variability during the year. These plots outline how the
 generic assumption of the Eflow as a constant value equal to a defined percentage of the average
 annual discharge (i.e. 20% of the average annual discharge) generates a relevant penalization to
 natural river conditions causing and overexploiting water resources throughout the year except for
 the summer season. In other words, the assumption of Eflow as a percentage of the average annual
 flow does not consider the natural variability of the river flow which provides different flow
 components in order to obtain the best condition for freshwater ecosystems, habitats, and wetland
 species.
Preprints (www.preprints.org) | NOT PEER-REVIEWED | Posted: 13 May 2021 doi:10.20944/preprints202105.0309.v1

 Table 4. Computed flow components and IARI for the control cross section of Pertusillo Lake: average
 annual discharge, average monthly discharge, 20-th percentiles (updated Hydrological Eflow), 25-th
 and 75-th monthly discharge and, IARI values for updated Eflow conditions (20-th percentile)

 Average Annual Discharge (mc/s)
 6.18 6.18 6.18 6.18 6.18 6.18 6.18 6.18 6.18 6.18 6.18 6.18
 Average Monthly Discharge (mc/s)
 9.52 10.40 8.82 7.46 5.56 2.77 2.25 1.62 3.40 4.82 7.65 9.86
 25-th percentile (mc/s)
 6.25 6.59 6.65 5.19 4.22 2.42 2.12 0.74 2.57 4.65 6.39 8.32
 75-th percentile (mc/s)
 11.52 14.23 10.61 8.35 6.34 3.26 2.62 2.68 3.96 5.53 8.67 11.29
 20-th Percentile - hydrological Eflow (mc/s)
 6.16 6.36 6.08 4.95 4.15 2.19 2.03 0.67 2.51 4.42 5.91 7.83
 pj,k -20-th percentile
 0.02 0.03 0.14 0.08 0.03 0.27 0.19 0.04 0.05 0.25 0.21 0.16
 IARI 0.12

 Table 5. Observed flow components and IARI for the control cross section of Pertusillo Lake: average
 annual discharge, average monthly discharge, 20-th percentiles (updated Hydrological Eflow), 25-th
 and 75-th monthly discharge and, IARI values for updated Eflow conditions (20-th percentile)

 Average Observed Annual Discharge (mc/s)
 5.73 5.73 5.73 5.73 5.73 5.73 5.73 5.73 5.73 5.73 5.73 5.73
 Average Observed Monthly Discharge (mc/s)
 9.29 10.19 8.99 8.92 5.24 2.10 1.41 1.08 1.96 3.40 6.43 9.73
 Observed 25-th percentile (mc/s)
 6.10 6.43 6.42 6.17 3.55 1.40 1.00 0.55 1.13 2.36 4.00 7.23
 Observed 75-th percentile (mc/s)
 11.35 13.71 11.65 10.87 7.16 2.73 1.77 1.55 2.67 3.52 7.43 10.48
 Observed 20-th Percentile - hydrological Eflow (mc/s)
 5.71 5.89 6.39 6.13 3.39 1.37 0.58 0.45 1.13 2.26 3.70 5.87
 pj,k -20-th percentile
 0.04 0.00 0.05 0.02 0.09 0.01 0.13 0.00 0.00 0.00 0.00 0.25
 IARI 0.05

 Figure 7 – Computed flow rate components for the control cross section of Pertusillo Lake
Preprints (www.preprints.org) | NOT PEER-REVIEWED | Posted: 13 May 2021 doi:10.20944/preprints202105.0309.v1

 Figure 8 – Observed flow rate components for the control cross section of Pertusillo Lake

 The proposed methodology, indeed, considers the maintenance of the environmental flow
 components variability as relevant and essential condition to cope with the impacts induced on the
 river system by anthropogenetic water discharge alteration. It does not represent a limitation of the
 water resources, but rather the valorisation and enhancement of the river environmental heritages.

 Figure 9 – Monthly distribution of the observed and computed flow rates at the Pertusillo Lake control
 cross section

 Finally, Figure 9 shows the monthly distribution of the observed and computed flow rates at the
 Pertusillo Lake control cross section outlining a general good response of the proposed modelling
 versus the real data, but, at the same time, proposes the main deviation between the two datasets.
 The computed monthly distributions, for both average discharge and Eflow, fit the observed values
 well during the winter, spring and partly in summer, while the autumnal season shows a relatively
 high deviation between the computed and observed values. Such a difference might be attributable
 to the necessity of a better calibration of the infiltration rate and aquifer recharge rate, which require
Preprints (www.preprints.org) | NOT PEER-REVIEWED | Posted: 13 May 2021 doi:10.20944/preprints202105.0309.v1

 further in site data and measurement. Nevertheless, the global response of the proposed
 methodology, still remains positive and generally conservative with respect to the water resource
 protection and the possible hydrological alteration induced to the river system and eco-system.

 5. Conclusions

 The aim of the study was to propose a hydrologically based methodology to define the ecological
 flow basing on the application of the Indicators of Hydrologic Alteration methodology (IHA by TNC)
 coupled to the valuation of the Index of Hydrological Regime Alteration (IARI by ISPRA).
 The approach deals with the application of cascade models starting from a classical rainfall-runoff
 model, like HEC- Hydrological Modelling System (HEC-HMS) for the assessment of the
 daily/monthly water discharge flowing in a generic control cross section along the water body,
 feeding the IHA. Then, the methodology defines the ecological flow as the i-th percentile of the
 distribution of the average monthly flows which provides a value of IARI corresponding to a “good”
 level at least. In the study the 20th percentile fit well the results ad the corresponding monthly
 discharge has been assumed as the monthly Eflow.
 The procedure has been carried out on monthly discharge data derived applying the HEC-
 Hydrological Modelling System at the basin scale of Agri River, using the daily rain data
 measurements obtained by the regional rainfall gauge stations and calibrated through the observed
 inlet water discharge registered at the Lago del Pertusillo reservoir station.

 Author Contributions: Conceptualization, methodology, resources, supervision, M.G. - software application,
 validation, formal analysis, data curation, M.G., F.A. and R.G. writing—original draft preparation, editing, M.G.
 – visualization, F.A. and R.G.

 Funding: This research received no external funds.

 Acknowledgments: The present work was a further result of the project “INDICARE” and carried out by the
 Engineering School of University of Basilicata – SI-UNIBAS, Regional Environmental Research Foundation –
 FARBAS.

 Conflicts of Interest: The authors declare no conflict of interest

 References
 1. Directive 2000/60/EC of the European Parliament and of the Council establishing a framework for the
 Community action in the field of water policy"
 2. O'Keeffe, J., 2009. Sustaining river ecosystems: balancing use and protection. Prog. Phys. Geogr. 33,
 339 e 357. https://doi.org/10.1177/0309133309342645.
 3. Arthington, A.H., S.E. Bunn, B.J. Pusey, D.R. Bluhorn, J.M. King, J.A. Day, R.E. Tharme, and J.H.
 O’Keefe, “Development of a Holistic Approach for Assessing Environmental Flow Requirements of
 Riverine Ecosystems.” In: Proceedings of an International Seminar and Workshop on Water Allocation for the
 Environment, John. J. Pigram and Bruce. P. Hooper (Editors). The Centre for Water Policy Research,
 Armidale, Australia, 1992, pp. 69-76.
 4. Poff, N.L., J.D. Allan, M.B. Bain, J.R. Karr, K.L. Prestegaard, B.D. Richter, R.E. Sparks, and J.C.
 Stromberg, The Natural Flow Regime: A Paradigm for River Conservation and Restoration. BioScience
 47, 1997:769-784.
 5. Bunn, S.E. and A.H. Arthington, Basic Principles and Ecological Consequences of Altered Flow
 Regimes for Aquatic Biodiversity. Environmental Management 30,2002:492-507.
 6. Richter, B.D., J.V. Baumgartner, J. Powell, and D.P. Braun, A Method for Assessing Hydrologic
 Alteration Within Ecosystems. Conservation Biology 10, 1996:1163-1174.
 7. Richter, B.D., J.V. Baumgartner, R. Wigington, and D.P. Braun, How Much Water Does a River Need?
 Freshwater Biology, 37, 1997:231-249.
 8. Richter, B.D., R. Mathews, D.L. Harrison, and R. Wigington,. Ecologically Sustainable Water
 Management: Managing River Flows for Ecological Integrity. Ecological Applications 13, 2003:206-224.
Preprints (www.preprints.org) | NOT PEER-REVIEWED | Posted: 13 May 2021 doi:10.20944/preprints202105.0309.v1

 9. Tharme, R.E., A global perspective on environmental flow assessment: emerging trends in the
 development and application of environmental flow methodologies for rivers. River Res. Appl. 19,
 2003, 397 e 441. https://doi.org/10.1002/rra.736.
 10. Poff, N.L., Matthews, J.H., Environmental flows in the Anthropocence: past progress and future
 prospects. Curr. Opin. Environ. Sustain. 5 (6), 2013, 667 e 675. https://doi.org/10.1016/j.cosust.2013.11.006
 11. Sisto, N.P.,. Environmental flows for rivers and economic compensation for irrigators. J. Environ.
 Manag. 90 (2), 2009, 1236 e 1240. https://doi.org/10.1016/j.jenvman.2008.06.005.
 12. Savalli, S., Saganeiti, L., Greco, M., Murgante, B., Integrated Assessment of the Anthropic Pressure
 Level on Natural Water Bodies: The Case Study of the Noce River (Basilicata, Italy), Lecture Notes in
 Computer Science, 2019, 11624 LNCS, pp. 269-278
 13. Arbia, F., Giuseppe, L.D., Giampietro, R., Greco, M., Mauro, P., Martino, G., Montella, A., Mussuto,
 G., Napoli, E., Smaldone, A., Assessment of the ecological potential of heavily modified water bodies
 in the Basilicata region, Italy: Case study of the agri river basin, WIT Transactions on Ecology and the
 Environment, 2019, 234(2019), pp. 131-141, doi: 10.2495/RBM19014.
 14. Vietz, G.J., Lintern, A., Webb, J.A., Straccione D., River Bank Erosion and the Influence of
 Environmental Flow Management. Environmental Management, 61, 454–468 (2018).
 https://doi.org/10.1007/s00267-017-0857-9
 15. EU Commission, 2015, WFD-CIS Guidance Document n. 31 - Ecological flows in the implementation
 of the Water Framework Directive
 16. Acreman, M., Dunbar, M.J., 2004. Defining environmental river flow requirements - a review. Hydrol.
 Earth Syst. Sci. 8, 861 e 876. https://doi.org/10.5194/hess-8-861-2004.
 17. Black, A.R., Rowan, J.S., Duck, R.W., Bragg, O.M., Clelland, B.E., 2005. DHRAM: A method for
 classifying river flow regime alterations for the EC water framework directive. Aquatic Conservation 15,
 427–446.
 18. Henriksen J. A., Heasley J., Kennen J.G., and Niewsand S. (2006). Users’ manual for the hydroecological
 integrity assessment process software (including the New Jersey Assessment Tools). U.S. Geological
 Surve y, Biological Resources Discipline, Open File Report 2006-1093:
 19. Kleynhans, CJ, Louw, MD, Thirion, C, Rossouw, NJ, and Rowntree, K (2005). River EcoClassification:
 Manual for EcoStatus determination (Version 1). Joint Water Research Commission and Department
 of Water Affairs and Forestry report. WRC Report No. KV 168/05.
 20. Acreman, M., Dunbar, M., Hannaford, J., Mountford, O., Wood, P., Holmes, N., Cowx, I., Noble, R.,
 Extence, C., Aldrick, J., (2008). Developing environmental standards for abstractions from UK rivers
 to implement the EU water frame-work directive. J. Hydrol. Sci. 53, 1105 e 1120.
 21. Operacz, A., ( 2015). Estimating the value of inviolable flow in surface water investments according to
 Kostrzewa method. Econ. Environ. 1 (52), 100-109.
 22. Operacz A.,Wałęga A., Cupak A., Tomaszewska B., (2018)The comparison of environmental flow
 assessment - the barrier for investment in Poland or river protection? J. Clean. Prod., 193, 575-592
 23. Młyński D., Operacz A., Wałęga A., (2020) Sensitivity of methods for calculating environmental flows
 based on hydrological characteristics of watercourses regarding the hydropower potential of rivers, J.
 Clean. Prod., Volume 250,
 24. Greco M., (2015) Effect of bed roughness on 1-D entropy velocity distribution in open channel flow,
 Hydrology Research, Volume 46, Issue 1, 2015, 1-10
 25. Greco, M., Moramarco, T., (2016). Influence of Bed Roughness and Cross Section Geometry on Medium
 and Maximum Velocity Ratio in Open-Channel Flow. J. Hydraul. Eng., Volume 142, Issue 1, 1
 26. Efstratiadis, A., Tegos, A., Varveris, A., Koutsoyiannis, D., (2014). Assessment of environmental flows
 under limited data availability: case study of the Acheloos River, Greece. J. Hydrol. Sci. 59 (3 e 4), 731-
 750.
 27. Greco, M. (2016). Entropy-Based Approach for Rating Curve Assessment in Rough and Smooth
 Irrigation Ditches. J. Irrig. Drain Eng., 10.1061/(ASCE)IR.1943-4774.0000986, 04015062, Volume 142,
 Issue 3, EID 2-s2.0-84958758546
 28. Greco M., Martino G., (2018): 1-D versus 2-D Entropy Velocity Law for Water Discharge Assessment
 in a Rough Ditch. Entropy, 20, ISSN: 1099-4300, doi: 10.3390/e20090638
 29. Bonakdari H., Gholami A., Mosavi A., Kazemian-Kale-Kale A., Ebtehaj I., Hossein Azimi A. (2020). A
 Novel Comprehensive Evaluation Method for Estimating the Bank Profile Shape and Dimensions of
 Stable Channels Using the Maximum Entropy Principle, Entropy 2020, 22, 1218; doi:10.3390/e22111218
Preprints (www.preprints.org) | NOT PEER-REVIEWED | Posted: 13 May 2021 doi:10.20944/preprints202105.0309.v1

 30. Farbod Abdolvandi A., Naghi Ziaei A., Moramarco T., Singh V.P. (2020): New approach to computing
 mean velocity and discharge, Hydrological Sciences Journal, DOI: 10.1080/02626667.2020.1859115
 31. Bovee, K.D., 1978. General management concepts. The incremental method of assessing habitat
 potential for coolwater species, with management implications. Am. Fish. Soc. Spec. Publ. 11, 340e346.
 32. Stalnaker C., Lamb B., Henriksen J., Bovee K., Bartholow J. (1995). The Instream Flow Incremental
 Methodology: a primer for IFIM. Biol. Sci. Rep. 29. 53.
 33. Tharme, R. E. (2003). A global perspective on environmental flow assessment: Emerging trends in the
 development and application of environmental flow methodologies for Rivers. River Research and
 Applications, 19, 397–441.
 34. Capra, H., Sabaton, C., Gouraud, V., Souchon, Y., Lim, P., 2003. A population dynamics model and
 habitat simulation as a tool to predict brown trout demography in natural and bypassed stream
 reaches. River Res. Appl. 19, 551e568. https://doi.org/10.1002/Rra.729.
 35. Booker, Douglas & Dunbar, M.. (2004). Application of Physical HAbitat SIMulation (PHABSIM)
 modelling to modified urban river channels. River Research and Applications. 20. 167 - 183.
 10.1002/rra.742.
 36. Acreman, M., Dunbar, M.J., 2004. Defining environmental river flow requirements a review. Hydrol.
 Earth Syst. Sci. 8, 861e876. https://doi.org/10.5194/hess-8-861-2004.
 37. Killingtviet, Å., Harby, A., 1994. Multipurpose planning with the River system simulator - a decision
 support system for water resources planning and operation. In: Proceedings of the First International
 Symposium on Habitat Hydraulics. Norwegian Institute of Technology, Trondheim.
 38. Richter, B.D., J.V. Baumgartner, J. Powell, and D.P. Braun, 1996. A Method for Assessing Hydrologic
 Alteration Within Ecosystems. Conservation Biology 10:1163-1174.
 39. Richter, B.D., J.V. Baumgartner, R. Wigington, and D.P. Braun, 1997. How Much Water Does a River
 Need? Freshwater Biology, 37:231-249.
 40. Richter, B.D. and H.E. Richter, 2000. Prescribing Flood Regimes to Sustain Riparian Ecosystems Along
 Meandering Rivers. Conservation Biology 14:1467-1478.
 41. Richter, B.D., R. Mathews, D.L. Harrison, and R. Wigington, 2003. Ecologically Sustainable Water
 Management: Managing River Flows for Ecological Integrity. Ecological Applications 13:206-224.
 42. Richter, B.D., A.T. Warner, J.L. Meyer, and K. Lutz, 2006. A Collaborative and Adaptive Process for
 Developing Environmental Flow Recommendations. River Research and Applications 22:297-318.
 43. The Nature Conservancy (TNC). 2011a. Conservation Gateway. “Environmental Flow Components”
 44. The Nature Conservancy (TNC). 2011b. Conservation Gateway. “Three-Level Hierarchy of
 Environmental Flow Methods”
 45. ISPRA, 2011: “Implementazione della Direttiva 2000/60/CE - Analisi e valutazione degli aspetti
 idromorfologici”
 46. Rinaldi, M., B. Belletti, W. Van de Bund; W. Bertoldi, A. Gurnell, T. Buijse, E. Mosselman. 2013. Review
 on eco-hydromorphological methods. Editors N. Friberg, M. O'Hare and A. Poulsen, Deliverable of
 the EU FP7 REFORM project. http://www.reformrivers.eu/
 47. Black, A.R., Rowan, J.S., Duck, R.W., Bragg, O.M., Clelland, B.E., 2005. DHRAM: A method for
 classifying river flow regime alterations for the EC water framework directive. Aquatic Conservation 15,
 427–446.
 48. Henriksen J. A., Heasley J., Kennen J.G., and Niewsand S. (2006). Users’ manual for the hydroecological
 integrity assessment process software (including the New Jersey Assessment Tools). U.S. Geological
 Surve y, Biological Resources Discipline, Open File Report 2006-1093:
 49. Kleynhans, CJ, Louw, MD, Thirion, C, Rossouw, NJ, and Rowntree, K (2005). River EcoClassification:
 Manual for EcoStatus determination (Version 1). Joint Water Research Commission and Department
 of Water Affairs and Forestry report. WRC Report No. KV 168/05.
 50. Munnè, A., C. SOLol ´ A & J. Pag ´ ES. 2006. ´ HIDRI: Protocolo para la valoracion de la calidad hidro-
 ´ morfologica de los r ´ ´ıos. Agencia Catalana de ` l’Aigua. Barcelona, Spain. 160 pp
 51. Shiau, J.T. & Wu, F.C. (2008). A histogram matching approach for assessment of flow regime alteration:
 application to environmental flow optimization. River Research and Applications, Vol. 24, pp. 914–928.
 DOI: 10.1002/rra.1102.
 52. Martínez Santa-María C, Fernández Yuste JA. (2008). IAHRIS Índices deAlteración Hidrológica en
 Ríos. Manual de Referencia Metodológica.Versión 1. CEDEX (Centro de Estudios y Experimentaciòn
 De ObrasPùblicas).
Preprints (www.preprints.org) | NOT PEER-REVIEWED | Posted: 13 May 2021 doi:10.20944/preprints202105.0309.v1

 53. The Nature Conservancy (TNC). (2011). Conservation Gateway. “Environmental Flow Components”
 54. The Nature Conservancy (TNC). (2011). Conservation Gateway. “Three-Level Hierarchy of
 Environmental Flow Methods”
 55. Hydrologic Engineering Center (1998) HEC-HMS Hydrologic Modeling System. User’s Manual. U.S.
 Army Corps of Engineers, Davis, CA.
 56. Dotson H.W. (2001) Watershed Modeling With HEC-HMS (Hydrologic Engineering Centers-
 Hydrologic Modeling System) Using Spatially Distributed Rainfall. In: Gruntfest E., Handmer J. (eds)
 Coping With Flash Floods. NATO Science Series (Series 2. Environmental Security), vol 77. Springer,
 Dordrecht.
 57. Bulcock H. Jewitt G. 2010 Hydrological modeling system, HEC-HMS user’s manual, Hydrology and
 Earth System Sciences, 14, 383-392
 58. Claps P, Fiorentino M. 1997. Probabilistic flow duration curves for use in environmental planning and
 management. In: Harmancioglu NB, Alpaslan MN, Ozkul SD, Singh VP, editors. Integrated approach
 to environmental data management systems, NATO ASI ser., partnership subser. 2, vol. 31. Dordrecht:
 Kluwer; p. 255–266
 59. Merz, R, Blöschl G, (2004) Regionalization of catchment model parameters. J. Hydrol. 287, 95–123.
 60. Ganora D, Claps P, Laio F, Viglione A. 2009. An approach to estimate non-parametric flow duration
 curves in ungauged basins. Water Resour Res. 45. doi:10.1029/2008WR007472
You can also read