The impact of improved satellite retrievals on estimates of biospheric carbon balance - atmos-chem-phys.net
←
→
Page content transcription
If your browser does not render page correctly, please read the page content below
Atmos. Chem. Phys., 20, 323–331, 2020
https://doi.org/10.5194/acp-20-323-2020
© Author(s) 2020. This work is distributed under
the Creative Commons Attribution 4.0 License.

The impact of improved satellite retrievals on estimates of
biospheric carbon balance
Scot M. Miller1 and Anna M. Michalak2
1 Department   of Environmental Health and Engineering, Johns Hopkins University, Baltimore, MD, USA
2 Department   of Global Ecology, Carnegie Institution for Science, Stanford, CA, USA

Correspondence: Scot M. Miller (smill191@jhu.edu)

Received: 22 April 2019 – Discussion started: 22 May 2019
Revised: 16 October 2019 – Accepted: 6 November 2019 – Published: 8 January 2020

Abstract. The Orbiting Carbon Observatory 2 (OCO-2) is             1   Introduction
NASA’s first satellite dedicated to monitoring CO2 from
space and could provide novel insight into CO2 fluxes across
the globe. However, one continuing challenge is the devel-         Over the past 5 years, the field of CO2 remote sensing
opment of a robust retrieval algorithm: an estimate of atmo-       has evolved rapidly. The sheer number of satellites has in-
spheric CO2 from satellite observations of near-infrared ra-       creased with the launch of TanSat in 2016 (Yang et al., 2018),
diation. The OCO-2 retrievals have undergone multiple up-          GOSAT-2 in 2018 (e.g., Nakajima et al., 2012), and OCO-3
dates since the satellite’s launch, and the retrieval algorithm    in 2019 (e.g., Eldering et al., 2019). Several additional satel-
is now on its ninth version. Some of these retrieval updates,      lites have also been funded or proposed (e.g., Polonsky et al.,
particularly version 8, led to marked changes in the CO2 ob-       2014; Tollefson, 2016). In addition, the actual CO2 observa-
servations, changes of 0.5 ppm or more. In this study, we          tions or satellite retrievals have also been changing. Roughly
evaluate the extent to which current OCO-2 observations can        once per year, the NASA Atmospheric CO2 Observations
constrain monthly CO2 sources and sinks from the biosphere,        from Space (ACOS) science team releases a new version of
and we particularly focus on how this constraint has evolved       the OCO-2 and GOSAT observations that incorporates the
with improvements to the OCO-2 retrieval algorithm. We             most recent advances in the retrieval algorithm and addresses
find that improvements in the CO2 retrieval are having a po-       observational errors that have been identified by the scientific
tentially transformative effect on satellite-based estimates of    community (e.g., O’Dell et al., 2012). Early top-down studies
the global biospheric carbon balance. The version 7 OCO-2          of CO2 fluxes using OCO-2 employed version 7 of the obser-
retrievals formed the basis of early inverse modeling stud-        vations (e.g., Chatterjee et al., 2017; Crowell et al., 2019; Liu
ies using OCO-2 data; these observations are best equipped         et al., 2017; Nassar et al., 2017), but the ACOS team has sub-
to constrain the biospheric carbon balance across only con-        sequently updated the observations through version 9 (at the
tinental or hemispheric regions. By contrast, newer versions       time of writing).
of the retrieval algorithm yield a far more detailed constraint,      The OCO-2 observations have changed markedly through
and we are able to constrain CO2 budgets for seven global          this process. One of the largest changes occurred with the
biome-based regions, particularly during the Northern Hemi-        release of version 8 of the OCO-2 observations in Septem-
sphere summer when biospheric CO2 uptake is greatest. Im-          ber 2017 (Fig. 1). This update incorporated a multitude of
provements to the OCO-2 observations have had the largest          changes to the quality control prescreening process, the for-
impact on glint-mode observations, and we also find the            ward spectroscopy model, the retrieval algorithm, and the
largest improvements in the terrestrial CO2 flux constraint        bias correction (O’Dell et al., 2018b). These changes led
when we include both nadir and glint data.                         to widespread improvements in the observations; version 8
                                                                   has smaller random errors when compared to ground-based
                                                                   observations, a smaller bias between land nadir and land
                                                                   glint observations, and less bias across many northern high-

Published by Copernicus Publications on behalf of the European Geosciences Union.
324                                             S. M. Miller and A. M. Michalak: Impact of improved satellite CO2 retrievals

Figure 1. Differences between versions 7 and 8 of the OCO-2 observations (a) and between versions 8 and 9 of the observations (b). Version
8 was a much larger update to the observations than version 9. We average all of the differences between observations onto a grid to make
the differences more visually apparent. The results shown here are for observations collected in 2015, the time period analyzed in this study.
In addition, this map only displays grid boxes with more than 250 total observations in 2015.

latitude terrestrial regions (Wunch et al., 2017; O’Dell et al.,         example, Miller et al. (2018) explored the detectability of
2018b). These improvements had a particularly large impact               biospheric CO2 fluxes using version 7 of the OCO-2 obser-
on glint-mode observations. For example, a correction to the             vations. They found that OCO-2 observations can be used
averaging kernel reduced a 0.3 ppm bias in land glint data rel-          to identify variations in biospheric fluxes within continental
ative to land nadir (O’Dell et al., 2018b). Previously, inverse          or hemispheric regions but that the observations have lim-
modeling studies using version 7 of the OCO-2 retrieval did              ited ability to constrain biospheric CO2 fluxes across smaller
not assimilate land glint and land nadir observations simul-             regions. The authors constructed a series of synthetic data
taneously due to this bias (e.g., Crowell et al., 2019). Fur-            experiments to understand the most important factors limit-
thermore, version 7 glint observations had biases greater than           ing the CO2 flux constraint; they concluded that atmospheric
1 ppm across the southern ocean that have been remedied in               transport errors and prior flux errors play a role, but retrieval
version 8. These errors appeared to be due to high-altitude              errors are a particularly salient factor. The OCO-2 science
aerosols, so the version 8 algorithm includes a new aerosol              team has also developed an ensemble of inverse modeling
layer in the upper troposphere and lower stratosphere that               estimates of CO2 fluxes, and recent comparisons show re-
has remedied many of these biases. Overall, the observations             sults that are broadly parallel to Miller et al. (2018): inverse
rated as good quality in version 8 are very different from               models provide consistent CO2 flux totals for continents or
those in version 7: 24 % of the observations that were marked            hemispheres but diverge for smaller regions (e.g., Crowell
as high quality in version 7 were marked as low quality in               et al., 2019).
version 8, and 34 % of the observations marked as high qual-                The present study is a follow-up to Miller et al. (2018). We
ity in version 8 were marked as low quality in version 7.                reexamine the conclusions of that study in light of recent im-
   More recently, version 9 of the OCO-2 observations was                provements in OCO-2 observations of CO2 . We also identify
released in October 2018. Improvements in version 9 of the               opportunities for future improvements to the retrievals.
retrieval algorithm yielded smaller changes in the observa-
tions (O’Dell et al., 2018a). In particular, this version in-
cludes a correction for small-scale biases over land due to              2     Methods
topography. Furthermore, the ACOS team relaxed a filter
                                                                         2.1    Overview
that discards observations collected over dark surfaces, and
this change yields more observations over tropical forests               Uncertainties in biospheric fluxes are thought to be greater
(O’Dell et al., 2018a). In spite of these advances, there are            than in other CO2 source types (e.g., National Research
still many opportunities for further improving the retrievals.           Council, 2010; Huntzinger et al., 2012; Le Quéré et al.,
For example, OCO-2 retrievals appear to show biases across               2018), and the CO2 signal from biospheric fluxes is often
most of the northern tropical oceans (O’Dell et al., 2018b).             larger than from other source types. Hence, we design a set
   These improvements to the observations should also im-                of top-down experiments to examine whether we can detect
prove the reliability or accuracy of CO2 fluxes estimated us-            variations in biospheric CO2 sources and sinks within dif-
ing the observations. Several studies indicate that errors in            ferent regions of the globe and different months of the year
the retrieval can have a substantial impact on the strength of           using OCO-2 observations. In the present study, these varia-
the CO2 flux constraint (e.g., Chevallier et al., 2007; Baker            tions are defined as any spatial or temporal patterns in CO2
et al., 2010; Crowell et al., 2019; Miller et al., 2018). For            fluxes that have been gridded to the resolution of a global

Atmos. Chem. Phys., 20, 323–331, 2020                                                        www.atmos-chem-phys.net/20/323/2020/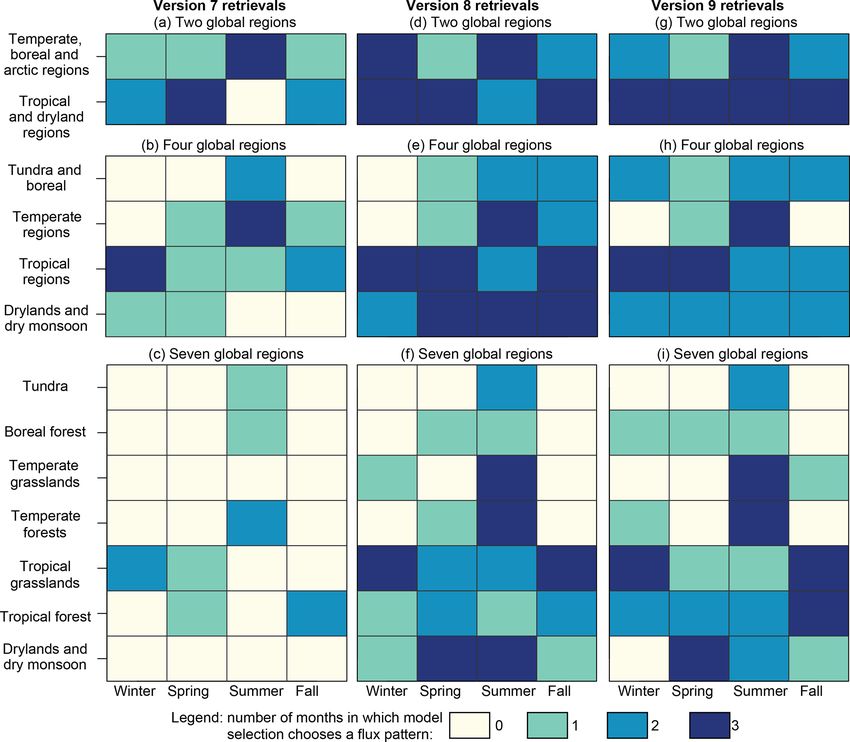
S. M. Miller and A. M. Michalak: Impact of improved satellite CO2 retrievals                                                    325

                                                                     and seven global regions, respectively, in each of these ex-
                                                                     periments. All of these regions are based on a map of global
                                                                     biomes presented in Olson et al. (2001). The seven-region
                                                                     map contains broad global biomes aggregated from those in
                                                                     Olson et al. (2001), while the two- and four-region maps have
                                                                     been aggregated from Olson et al. (2001) to form even larger
                                                                     regions. We use a biome-based map because inverse model-
                                                                     ing studies often estimate CO2 flux totals for biome-based
                                                                     regions, and these regions have clear ecological significance.
                                                                        We construct this set of experiments for each of the last
                                                                     three versions of the OCO-2 observations and examine how
                                                                     the results change with the retrieval version. These exper-
                                                                     iments are identical except for the retrieval version used.
                                                                     Therefore, this setup provides a means to understand how im-
                                                                     provements in the observations are improving the constraint
                                                                     on biospheric CO2 fluxes. We examine these questions for
                                                                     each month within the year 2015 – to understand how these
                                                                     results vary by season and by region or biome.

                                                                     2.2   Implementation of the top-down experiments

                                                                     We design a regression framework to determine whether we
                                                                     can detect variations in CO2 fluxes using OCO-2 observa-
                                                                     tions. This section provides an overview of the approach,
                                                                     but Miller et al. (2018) provides full descriptive and math-
                                                                     ematical detail. This regression will try to match CO2 ob-
                                                                     servations from OCO-2 using numerous atmospheric model
                                                                     outputs. Each model output estimates the enhancement in to-
                                                                     tal column CO2 (XCO2 ) from fluxes in a particular region
                                                                     and a particular month. We generate all of these model out-
                                                                     puts of CO2 using the Parameterized Chemistry and Trans-
                                                                     port Model (PCTM) (Kawa et al., 2004). The model setup
                                                                     used here has a spatial resolution of 1◦ latitude by 1.25◦ lon-
                                                                     gitude, and we incorporate CO2 fluxes at a 3-hourly time
                                                                     resolution. The wind fields used to drive PCTM are from
                                                                     the Modern-Era Retrospective analysis for Research and Ap-
                                                                     plications (MERRA) product (Rienecker et al., 2011). This
                                                                     setup is identical to Miller et al. (2018).
                                                                        We run many atmospheric model simulations using nu-
Figure 2. The two hemispheric regions (a), four continental re-      merous different biospheric CO2 flux estimates. The regres-
gions (b), and seven biome-based regions (c) used in this study.     sion will try to reproduce OCO-2 observations using a linear
These regions are based upon the world biome map by Olson et al.     combination of these model simulations. For example, in the
(2001). The two- and four-region maps are constructed by aggregat-   seven-region experiments, we use seven different geographic
ing individual biomes into larger regions.                           regions, seven biospheric CO2 flux estimates, and 16 differ-
                                                                     ent months (September 2014–December 2015). We discard
                                                                     results from the first 4 months as model spin-up. These com-
atmospheric model: 1◦ latitude by 1.25◦ longitude and a 3-           binations equate to 784 total atmospheric model outputs. We
hourly time interval.                                                further run atmospheric model simulations using a spatially
   Detecting variations in CO2 fluxes is a prerequisite for          and temporally constant flux in each region and each month,
constraining CO2 budgets or flux totals; we must be able to          and we allow the regression to use these model outputs as
detect variations in CO2 sources and sinks across a region           well. The Supplement and Miller et al. (2018) describe the
if we are to constrain budgets across any region of smaller          CO2 flux estimates and regression in greater detail.
size. We begin with two large hemispheric regions and then              This approach provides a means to evaluate when and
decrease the size of those regions to create increasingly chal-      where current satellite observations can constrain variations
lenging tests of the OCO-2 observations (Fig. 2); we use four        in CO2 fluxes. At least some of the atmospheric model out-

www.atmos-chem-phys.net/20/323/2020/                                                    Atmos. Chem. Phys., 20, 323–331, 2020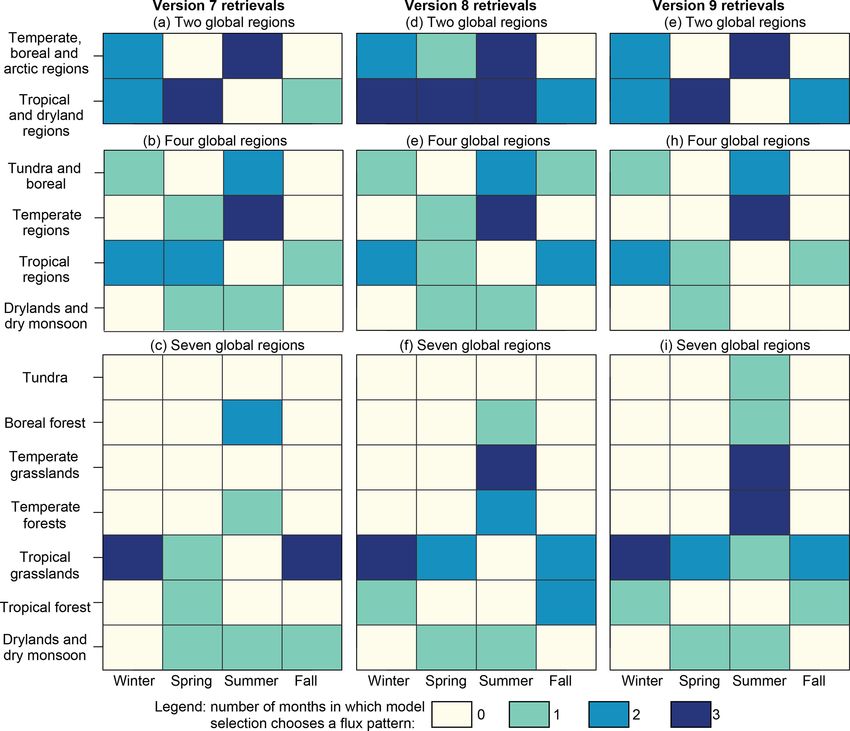
326                                          S. M. Miller and A. M. Michalak: Impact of improved satellite CO2 retrievals

puts that are driven by biospheric CO2 flux estimates should       commonly used in regression modeling (e.g., Ramsey and
help reproduce the OCO-2 observations better than the model        Schafer, 2012, chap. 12) and more recently in atmospheric
outputs that are driven by spatially and temporally constant       inverse modeling (e.g., Gourdji et al., 2012; Miller et al.,
fluxes. If so, a model with spatially and temporally vari-         2013; Shiga et al., 2014; Fang et al., 2014; Fang and Micha-
able fluxes is better able to reproduce OCO-2 observations         lak, 2015). To this end, we create different combinations of
than a model with constant fluxes. This result would imply         model outputs and use each combination in the regression.
that OCO-2 observations can be used to detect variations in        We score each combination based upon how well it repro-
biospheric CO2 sources and sinks within a given region for         duces the OCO-2 observations; combinations with a lower
a given month. By contrast, suppose that the atmospheric           weighted sum of squares error receive a better score. Each
model outputs driven by biospheric CO2 flux estimates do           combination is also scored based upon the total number of
not reproduce the OCO-2 observations any better than the           model outputs in that combination. Specifically, combina-
model outputs with constant CO2 fluxes. This result would          tions with a greater number of model outputs receive a larger
imply one of several conclusions. First, the observations may      penalty for complexity, and this penalty prevents combina-
not be sensitive to fluxes from the region or month in ques-       tions that overfit the data from receiving an anomalously
tion. This outcome may occur if the magnitude of fluxes is         good score. The best combination of atmospheric model out-
small in a given region or if there are no OCO-2 observations      puts is the one with the lowest score. We subsequently ex-
near that region. Second, errors in the atmospheric model or       amine this combination and tally whether at least one atmo-
in the OCO-2 observations may obscure variations in XCO2           spheric model output using a biospheric flux estimate was
that are due to CO2 fluxes. Lastly, the biospheric CO2 flux        selected for each region and each month of the year. Miller
estimates used in the atmospheric model may not be skilled         et al. (2018) and the Supplement describe this approach in
and may not reflect real-world biospheric CO2 fluxes. How-         greater detail, including the specific equations for the BIC.
ever, in this study, we offer up seven biospheric CO2 flux
estimates for each region and each month, and at least one of
these estimates should correlate with real-world CO2 fluxes        3     Results and discussion
to a reasonable extent. Hence, it is unlikely that this explana-
tion would drive the results. Rather, it is more likely that the   3.1    Strength of the biospheric CO2 flux constraint
observations are not sensitive to fluxes from a given region
or that errors in the model–data system are too large.             The constraint on CO2 fluxes using recent versions of the
   Note that anthropogenic, biomass burning, ocean, and bio-       OCO-2 observations is a step-change improvement relative
spheric fluxes all contribute to XCO2 observed by OCO-2,           to previous versions. Overall, there was only a limited ability
and we need to account for non-biospheric CO2 fluxes in or-        to detect variations in monthly CO2 fluxes across individual
der to isolate the signal from biospheric fluxes in the regres-    biomes using version 7 of the retrievals (Fig. 3a–c, Miller
sion. We model atmospheric enhancements of XCO2 from               et al., 2018). However, these capabilities have changed using
anthropogenic emissions using EDGAR v4.2 FT2010 (Euro-             versions 8 and 9 of the observations (Fig. 3d–i). Variations in
pean Commission, 2013; Olivier et al., 2014), climatologi-         CO2 fluxes are detectable across tropical biomes throughout
cal ocean fluxes using Takahashi et al. (2016), and biomass        much of the year and across temperate biomes in the North-
burning fluxes using the Global Fire Emissions Database            ern Hemisphere summer when fluxes from these regions are
(GFED), version 4.1 (van der Werf et al., 2010; Giglio et al.,     most variable. These results imply that the updated OCO-2
2013); each of these model outputs is considered in the re-        observations can be used to detect and constrain variations in
gression.                                                          monthly CO2 fluxes from seven biome-based regions in cer-
   We further implement model selection to evaluate when           tain circumstances – in about two-thirds of all months in the
and where current satellite observations can constrain vari-       tropics and during the Northern Hemisphere summer in the
ations in biospheric CO2 fluxes. Model selection will deter-       extratropics.
mine which combination of atmospheric model outputs to                The improvement in the flux constraint is particularly ev-
include in the regression based upon which best reproduces         ident in the four- and seven-region experiments (Fig. 3b–c
the OCO-2 observations. If this combination includes at least      and e–f). In the four-region model selection experiments, the
one biospheric CO2 flux model for a given region and season,       OCO-2 observations can be used to detect variations in trop-
we conclude that the observations likely can be used to con-       ical fluxes for most months of the year (Fig. 3e). In other
strain variations in CO2 fluxes. However, if this combination      words, at least one biosphere flux model is found to explain a
does not include any biospheric CO2 flux model for a given         sufficiently large fraction of the observed variability in XCO2
region and season, we conclude that the observations likely        as to be selected via the BIC model selection procedure for
cannot be used to constrain flux variations for that region and    the tropical regions for most months. This result indicates
season.                                                            that spatiotemporal variability in CO2 fluxes from within
   We specifically employ a form of model selection known          each of these regions is preserved in the OCO-2 observations.
as the Bayesian information criterion (BIC), an approach           This represents a marked improvement over results when us-

Atmos. Chem. Phys., 20, 323–331, 2020                                                 www.atmos-chem-phys.net/20/323/2020/
S. M. Miller and A. M. Michalak: Impact of improved satellite CO2 retrievals                                                            327

Figure 3. Results of the model selection experiments using versions 7, 8, and 9 of the OCO-2 observations. Versions 8 and 9 provide a
much stronger constraint on biospheric CO2 fluxes than version 7. The top row (a, d, g) displays the results of the experiments with two
global regions, the second row (b, e, h) with four global regions, and the third row (c, f, i) with seven global regions. Each box is color-
coded based upon the number of months in which at least one biospheric flux model is chosen using model selection. Dark colors indicate
a strong constraint on monthly CO2 fluxes while light colors indicate a weak constraint. Note that these experiments include nadir-, target-,
glint-mode observations. In addition, version 7 results are the same as those in Miller et al. (2018).

ing observations from version 7 of the OCO-2 retrieval algo-                These improvements appear greatest across tropical
rithm (Fig. 3b and e, Miller et al., 2018). The results using            biomes. There is a consistent flux signal from many tropi-
the newer versions 8 and 9 also show substantial improve-                cal regions throughout the year, and hence we are able to
ments in other regions, including dryland and dry monsoon                detect variations in fluxes from tropical regions across dif-
regions, temperate regions, and high-latitude regions (Fig. 3e           ferent seasons using versions 8 and 9 of the observations.
and h).                                                                  By contrast, the atmospheric signal due to biospheric CO2
   The seven-region model selection experiments are an even              fluxes in northern mid- and high latitudes has the largest ab-
more challenging test of current observations. These experi-             solute magnitude during the Northern Hemisphere summer.
ments examine whether we can detect spatiotemporal vari-                 As a result, we see a large improvement in the flux constraint
ations in biospheric fluxes across seven broad, aggregated               in midlatitudes in the Northern Hemisphere summer but not
global biomes. These experiments produce much better re-                 in other times of year when the absolute magnitude of CO2
sults using versions 8 and 9 of the observations. Specifically,          fluxes is smaller. Furthermore, there are far fewer land nadir
biospheric flux models are selected across tropical and sub-             and land glint observations in northern mid- and high lati-
tropical biomes for at least 1 month of every season. The                tudes in the Northern Hemisphere winter relative to summer.
same is true across all temperate and high-latitude biomes                  One notable feature of all model selection experiments is
for a minimum of 1 month during the Northern Hemisphere                  the result for dryland and dry monsoon regions (Fig. 2c).
summer.                                                                  At first glance, it may appear surprising that biospheric flux

www.atmos-chem-phys.net/20/323/2020/                                                          Atmos. Chem. Phys., 20, 323–331, 2020
328                                          S. M. Miller and A. M. Michalak: Impact of improved satellite CO2 retrievals

models are selected for so many months in this region, given      servations do or do not pass quality control. O’Dell et al.
that some parts of this region are very dry and presumably        (2018b) detail these changes in much greater detail.
have small CO2 fluxes. Several semiarid regions within this          With that said, a few of these improvements appear to have
classification have a very distinct monsoon that can bring        a particularly salient impact on the results of this study. For
over 500 mm of precipitation per month (e.g., northeastern        example, the largest improvements have generally been to
Brazil, western India, and Pakistan). As a result, there is a     the glint-mode observations. A 0.2 to 0.3 ppm bias between
large spatial contrast in CO2 fluxes across these regions dur-    land nadir and land glint observations in version 7 has been
ing the Northern Hemisphere spring and summer – large CO2         remedied in version 8, and version 8 glint observations show
uptake in places with a spring and summer monsoon and little      smaller biases across many ocean regions. Furthermore, ver-
to no fluxes in places like the Sahara or the Arabian Penin-      sion 8 exhibits less random noise in all types of observations,
sula.                                                             but that noise reduction is largest in glint observations, both
   Note that the results using version 9 of the observations      over land and over the oceans (O’Dell et al., 2018b).
are not very different from those using version 8. The change        Indeed, we also see the largest improvement in the flux
in the observations between versions 8 and 9 is only incre-       experiments conducted in this study when we include glint
mental (e.g., Fig. 1b). Version 9 has a lower quality control     mode observations. Figure 4 displays the results of the model
threshold for surfaces with low albedo, resulting in more ob-     selection experiments when the glint data are excluded. The
servations across tropical rainforests (O’Dell et al., 2018a),    figure shows results using version 7, 8, and 9 of the obser-
and this version includes a topography correction that mostly     vations. The improvement between versions 7 and 8 is much
manifests at small spatial scales. The latter change could be     smaller when the glint observations are excluded than when
very important for studies that estimate point sources or ur-     they are included (Fig. 3). Even in terrestrial regions, these
ban emissions using OCO-2. However, these changes are un-         glint observations may play a key role in the overall flux con-
likely to make a large difference in this study both given        straint. For example, the absolute number of nadir and glint
the large size of the regions examined and the 1◦ latitude by     observations over land are roughly equal; there are 4.3 × 10⁶
1.25◦ longitude spatial resolution of the atmospheric model       land nadir observations with a positive quality control flag for
simulations. The Supplement includes a detailed discussion        2015 and 4.3 × 10⁶ land glint observations during the same
of the subtle differences between the model selection results     time period.
using versions 8 and 9 of the observations.                          Note that this study focuses on detecting variations in CO2
                                                                  fluxes from terrestrial regions in individual months. To that
                                                                  end, certain types of flux estimation problems are beyond the
3.2   Drivers of the results
                                                                  scope of the current study. For example, there is strong evi-
                                                                  dence that OCO-2 observations are still biased across north-
Numerous factors affect the accuracy of CO2 fluxes esti-          ern tropical oceans, and reductions in these biases could
mated from satellite data. These factors include the accuracy     improve ocean flux estimates derived from OCO-2 (Baker,
and precision of the observations, the atmospheric transport      2018; O’Dell et al., 2018b). Furthermore, there is always a
model, and the prior flux estimate used in the inverse model.     possibility that the observations have a bias that is correlated
Improvements in any of these inverse modeling inputs could        across regions larger than those examined in this study. For
improve the constraint on biospheric CO2 fluxes. We find that     example, the observations show a small, time-dependent drift
recent improvements to the retrieval are having a particularly    from one year to another (O’Dell et al., 2018b). The approach
large impact on the strength of the CO2 flux constraint. Fur-     used in this study would be unlikely to detect the impact of
thermore, these improvements are not restricted to a single       those biases.
satellite like OCO-2. Rather, the ACOS retrievals and bias
correction (O’Dell et al., 2012, 2018b) will be directly appli-
cable to other NASA carbon monitoring missions, including         4   Conclusions
the recently launched OCO-3 mission (Eldering et al., 2019)
and the planned GeoCarb mission (Polonsky et al., 2014).          CO2 observations from the OCO-2 satellite have changed
   These improvements to the retrieval algorithm have had an      enormously with recent improvements to the retrieval algo-
effect on both glint and nadir observations from OCO-2 col-       rithm. New observations are more self-consistent (e.g., better
lected in almost every region of the globe. The sheer number      agreement between glint and nadir data) and compare better
of different changes makes it challenging to pinpoint exactly     against ground-based observations. In some regions, these
which have had the largest impact on the CO2 flux constraint;     changes are comparable in magnitude to the atmospheric
there have been numerous updates to the quality control pre-      CO2 enhancement due to biospheric CO2 sources and sinks.
screening, the forward spectroscopy model, the retrieval al-         In this study, we specifically examine how these changes
gorithm, and the bias correction. Furthermore, these updates      to the retrieval algorithm have improved the constraint on
have had multiple effects on the reported CO2 observations,       biospheric CO2 fluxes, and we find that the improvement is
reducing white noise, reducing bias, and changing which ob-       large. Using observations based on version 7 of the retrieval

Atmos. Chem. Phys., 20, 323–331, 2020                                               www.atmos-chem-phys.net/20/323/2020/
S. M. Miller and A. M. Michalak: Impact of improved satellite CO2 retrievals 329
Figure 4. Results of the model selection experiments using only nadir- and target-mode observations. The improvement between versions
7 and 8 is less pronounced when we exclude glint observations and include only nadir- and target-mode data. Version 7 results here are the
same as those in Miller et al. (2018).
algorithm, we find that biospheric fluxes can only be con- Center (GES DISC) at https://disc.gsfc.nasa.gov/OCO-2 (last ac-
strained across continental or hemisphere-sized regions, as cess: 24 February 2019).
these observations can rarely be used to detect or constrain
variations in CO2 fluxes across smaller regions. By contrast,
we find a step-change improvement in the biospheric CO2 Supplement. The supplement related to this article is available on-
flux constraint using updated versions of the OCO-2 obser- line at: https://doi.org/10.5194/acp-20-323-2020-supplement.
vations, based on versions 8 and 9 of the retrieval algorithm.
Specifically, these improvements make it possible to detect
variations in CO2 fluxes within seven global biome-based re- Author contributions. SMM and AMM designed and wrote the
study.
gions during many seasons of the year. This improvement is
particularly large when both nadir and glint data are included.
This study indicates that improvements to space-based
Competing interests. The authors declare that they have no con-
CO2 observations are yielding large improvements in global
flicts of interest.
monitoring of biospheric carbon fluxes. As new CO2 mon-
itoring missions like OCO-3 and GeoCarb launch into or-
bit, these improvements will have a lasting impact on space- Acknowledgements. We thank Christopher O’Dell, Annmarie El-
based monitoring of CO2 . dering, and David Crisp for their feedback on the research. The
OCO-2 data are produced by the OCO-2 project at the Jet Propul-
sion Laboratory, California Institute of Technology, and obtained
Data availability. All OCO-2 observations are available from from the OCO-2 data archive maintained at the GES DISC.
NASA’s Goddard Earth Sciences Data and Information Services
www.atmos-chem-phys.net/20/323/2020/ Atmos. Chem. Phys., 20, 323–331, 2020330 S. M. Miller and A. M. Michalak: Impact of improved satellite CO2 retrievals
Financial support. This research has been supported by NASA Gourdji, S. M., Mueller, K. L., Yadav, V., Huntzinger, D.
(grant nos. 80NSSC18K0976 and 80NSSC18K0165). N., Andrews, A. E., Trudeau, M., Petron, G., Nehrkorn, T.,
Eluszkiewicz, J., Henderson, J., Wen, D., Lin, J., Fischer, M.,
Sweeney, C., and Michalak, A. M.: North American CO2 ex-
Review statement. This paper was edited by Manvendra K. Dubey change: inter-comparison of modeled estimates with results from
and reviewed by two anonymous referees. a fine-scale atmospheric inversion, Biogeosciences, 9, 457–475,
https://doi.org/10.5194/bg-9-457-2012, 2012.
Huntzinger, D., Post, W., Wei, Y., Michalak, A., West, T., Ja-
cobson, A., Baker, I., Chen, J., Davis, K., Hayes, D., Hoff-
References man, F., Jain, A., Liu, S., McGuire, A., Neilson, R., Pot-
ter, C., Poulter, B., Price, D., Raczka, B., Tian, H., Thorn-
Baker, D.: OCO-2 v9 ocean glint bias correction, in: Fall Science ton, P., Tomelleri, E., Viovy, N., Xiao, J., Yuan, W., Zeng,
Team Meeting, NASA OCO-2 Science Team, Boulder CO, 2018. N., Zhao, M., and Cook, R.: North American Carbon Pro-
Baker, D. F., Bösch, H., Doney, S. C., O’Brien, D., and Schimel, gram (NACP) regional interim synthesis: Terrestrial bio-
D. S.: Carbon source/sink information provided by column CO2 spheric model intercomparison, Ecol. Modell., 232, 144–157,
measurements from the Orbiting Carbon Observatory, Atmos. https://doi.org/10.1016/j.ecolmodel.2012.02.004, 2012.
Chem. Phys., 10, 4145–4165, https://doi.org/10.5194/acp-10- Kawa, S. R., Erickson, D. J., Pawson, S., and Zhu, Z.: Global CO2
4145-2010, 2010. transport simulations using meteorological data from the NASA
Chatterjee, A., Gierach, M. M., Sutton, A. J., Feely, R. A., data assimilation system, J. Geophys. Res.-Atmos., 109, d18312,
Crisp, D., Eldering, A., Gunson, M. R., O’Dell, C. W., https://doi.org/10.1029/2004JD004554, 2004.
Stephens, B. B., and Schimel, D. S.: Influence of El Niño Le Quéré, C., Andrew, R. M., Friedlingstein, P., Sitch, S., Hauck,
on atmospheric CO2 over the tropical Pacific Ocean: Find- J., Pongratz, J., Pickers, P. A., Korsbakken, J. I., Peters, G. P.,
ings from NASA’s OCO-2 mission, Science, 358, eaam5776, Canadell, J. G., Arneth, A., Arora, V. K., Barbero, L., Bastos,
https://doi.org/10.1126/science.aam5776, 2017. A., Bopp, L., Chevallier, F., Chini, L. P., Ciais, P., Doney, S. C.,
Chevallier, F., Bron, F.-M., and Rayner, P. J.: Contribution of Gkritzalis, T., Goll, D. S., Harris, I., Haverd, V., Hoffman, F. M.,
the Orbiting Carbon Observatory to the estimation of CO2 Hoppema, M., Houghton, R. A., Hurtt, G., Ilyina, T., Jain, A.
sources and sinks: Theoretical study in a variational data as- K., Johannessen, T., Jones, C. D., Kato, E., Keeling, R. F., Gold-
similation framework, J. Geophys. Res.-Atmos., 112, d09307, ewijk, K. K., Landschützer, P., Lefèvre, N., Lienert, S., Liu, Z.,
https://doi.org/10.1029/2006JD007375, 2007. Lombardozzi, D., Metzl, N., Munro, D. R., Nabel, J. E. M. S.,
Crowell, S., Baker, D., Schuh, A., Basu, S., Jacobson, A. R., Cheval- Nakaoka, S., Neill, C., Olsen, A., Ono, T., Patra, P., Peregon,
lier, F., Liu, J., Deng, F., Feng, L., McKain, K., Chatterjee, A., A., Peters, W., Peylin, P., Pfeil, B., Pierrot, D., Poulter, B., Re-
Miller, J. B., Stephens, B. B., Eldering, A., Crisp, D., Schimel, hder, G., Resplandy, L., Robertson, E., Rocher, M., Rödenbeck,
D., Nassar, R., O’Dell, C. W., Oda, T., Sweeney, C., Palmer, P. I., C., Schuster, U., Schwinger, J., Séférian, R., Skjelvan, I., Stein-
and Jones, D. B. A.: The 2015–2016 carbon cycle as seen from hoff, T., Sutton, A., Tans, P. P., Tian, H., Tilbrook, B., Tubiello,
OCO-2 and the global in situ network, Atmos. Chem. Phys., 19, F. N., van der Laan-Luijkx, I. T., van der Werf, G. R., Viovy, N.,
9797–9831, https://doi.org/10.5194/acp-19-9797-2019, 2019. Walker, A. P., Wiltshire, A. J., Wright, R., Zaehle, S., and Zheng,
Eldering, A., Taylor, T. E., O’Dell, C. W., and Pavlick, R.: B.: Global Carbon Budget 2018, Earth Syst. Sci. Data, 10, 2141–
The OCO-3 mission: measurement objectives and expected 2194, https://doi.org/10.5194/essd-10-2141-2018, 2018.
performance based on 1 year of simulated data, Atmos. Liu, J., Bowman, K. W., Schimel, D. S., Parazoo, N. C., Jiang,
Meas. Tech., 12, 2341–2370, https://doi.org/10.5194/amt-12- Z., Lee, M., Bloom, A. A., Wunch, D., Frankenberg, C., Sun,
2341-2019, 2019. Y., O’Dell, C. W., Gurney, K. R., Menemenlis, D., Gierach, M.,
European Commission, Joint Research Centre (JRC)/Netherlands Crisp, D., and Eldering, A.: Contrasting carbon cycle responses
Environmental Assessment Agency (PBL): Emission Database of the tropical continents to the 2015–2016 El Niño, Science,
for Global Atmospheric Research (EDGAR), release 358, eaam5690, https://doi.org/10.1126/science.aam5690, 2017.
EDGARv4.2 FT2010, available at: http://edgar.jrc.ec.europa.eu Miller, S. M., Wofsy, S. C., Michalak, A. M., Kort, E. A., An-
(last access: 15 November 2019), 2013. drews, A. E., Biraud, S. C., Dlugokencky, E. J., Eluszkiewicz,
Fang, Y. and Michalak, A. M.: Atmospheric obser- J., Fischer, M. L., Janssens-Maenhout, G., Miller, B. R.,
vations inform CO2 flux responses to envirocli- Miller, J. B., Montzka, S. A., Nehrkorn, T., and Sweeney,
matic drivers, Global Biogeochem. Cy., 29, 555–566, C.: Anthropogenic emissions of methane in the United
https://doi.org/10.1002/2014GB005034, 2015. States, P. Natl. Acad. Sci. USA, 110, 20018–20022,
Fang, Y., Michalak, A. M., Shiga, Y. P., and Yadav, V.: Using at- https://doi.org/10.1073/pnas.1314392110, 2013.
mospheric observations to evaluate the spatiotemporal variabil- Miller, S. M., Michalak, A. M., Yadav, V., and Tadić, J. M.: Char-
ity of CO2 fluxes simulated by terrestrial biospheric models, acterizing biospheric carbon balance using CO2 observations
Biogeosciences, 11, 6985–6997, https://doi.org/10.5194/bg-11- from the OCO-2 satellite, Atmos. Chem. Phys., 18, 6785–6799,
6985-2014, 2014. https://doi.org/10.5194/acp-18-6785-2018, 2018.
Giglio, L., Randerson, J. T., and van der Werf, G. R.: Analy- Nakajima, M., Kuze, A., and Suto, H.: The current status of GOSAT
sis of daily, monthly, and annual burned area using the fourth- and the concept of GOSAT-2, Proc. SPIE, 8533, 8533–8533–10,
generation global fire emissions database (GFED4), J. Geophys. https://doi.org/10.1117/12.974954, 2012.
Res.-Biogeo., 118, 317–328, https://doi.org/10.1002/jgrg.20042,
2013.
Atmos. Chem. Phys., 20, 323–331, 2020 www.atmos-chem-phys.net/20/323/2020/S. M. Miller and A. M. Michalak: Impact of improved satellite CO2 retrievals 331 Nassar, R., Hill, T. G., McLinden, C. A., Wunch, D., Jones, D. Ramsey, F. and Schafer, D.: The statistical sleuth: A course in meth- B. A., and Crisp, D.: Quantifying CO2 emissions from individual ods of data analysis, Cengage Learning, Boston, MA, 2012. power plants from space, Geophys. Res. Lett., 44, 10045–10053, Rienecker, M. M., Suarez, M. J., Gelaro, R., Todling, R., Bacmeis- https://doi.org/10.1002/2017GL074702, 2017. ter, J., Liu, E., Bosilovich, M. G., Schubert, S. D., Takacs, National Research Council: Verifying greenhouse gas emis- L., Kim, G.-K., Bloom, S., Chen, J., Collins, D., Conaty, A., sions: Methods to support international climate agree- da Silva, A., Gu, W., Joiner, J., Koster, R. D., Lucchesi, R., ments, The National Academies Press, Washington, DC, Molod, A., Owens, T., Pawson, S., Pegion, P., Redder, C. R., Re- https://doi.org/10.17226/12883, 2010. ichle, R., Robertson, F. R., Ruddick, A. G., Sienkiewicz, M., and O’Dell, C. W., Connor, B., Bösch, H., O’Brien, D., Frankenberg, Woollen, J.: MERRA: NASA’s Modern-Era Retrospective Anal- C., Castano, R., Christi, M., Eldering, D., Fisher, B., Gunson, M., ysis for Research and Applications, J. Climate, 24, 3624–3648, McDuffie, J., Miller, C. E., Natraj, V., Oyafuso, F., Polonsky, I., https://doi.org/10.1175/JCLI-D-11-00015.1, 2011. Smyth, M., Taylor, T., Toon, G. C., Wennberg, P. O., and Wunch, Shiga, Y. P., Michalak, A. M., Gourdji, S. M., Mueller, D.: The ACOS CO2 retrieval algorithm – Part 1: Description and K. L., and Yadav, V.: Detecting fossil fuel emissions pat- validation against synthetic observations, Atmos. Meas. Tech., 5, terns from subcontinental regions using North American in 99–121, https://doi.org/10.5194/amt-5-99-2012, 2012. situ CO2 measurements, Geophys. Res. Lett., 41, 4381–4388, O’Dell, C., Eldering, A., Crisp, D., Fisher, B., and Gunson, M.: Re- https://doi.org/10.1002/2014GL059684, 2014. cent improvements and remaining challenges in the retrieval of Takahashi, T., Sutherland, S., and Kozyr, A.: Global ocean XCO2 from the Orbiting Carbon Observatory-2, in: Fall Meet- surface water partial pressure of CO2 database: Measure- ing, American Geophysical Union, Washington DC, 2018a. ments performed during 1957–2015 (Version 2015), Tech. Rep. O’Dell, C. W., Eldering, A., Wennberg, P. O., Crisp, D., Gunson, ORNL/CDIAC-160, NDP-088(V2015), Oak Ridge National M. R., Fisher, B., Frankenberg, C., Kiel, M., Lindqvist, H., Man- Laboratory, U.S. Department of Energy, Oak Ridge, Tennesee, drake, L., Merrelli, A., Natraj, V., Nelson, R. R., Osterman, G. B., https://doi.org/10.3334/CDIAC/OTG.NDP088(V2015), 2016. Payne, V. H., Taylor, T. E., Wunch, D., Drouin, B. J., Oyafuso, Tollefson, J.: Next generation of carbon-monitoring satel- F., Chang, A., McDuffie, J., Smyth, M., Baker, D. F., Basu, S., lites faces daunting hurdles, Nature News, 533, 446–447, Chevallier, F., Crowell, S. M. R., Feng, L., Palmer, P. I., Dubey, https://doi.org/10.1038/533446a, 2016. M., García, O. E., Griffith, D. W. T., Hase, F., Iraci, L. T., Kivi, van der Werf, G. R., Randerson, J. T., Giglio, L., Collatz, G. R., Morino, I., Notholt, J., Ohyama, H., Petri, C., Roehl, C. M., J., Mu, M., Kasibhatla, P. S., Morton, D. C., DeFries, R. S., Sha, M. K., Strong, K., Sussmann, R., Te, Y., Uchino, O., and Ve- Jin, Y., and van Leeuwen, T. T.: Global fire emissions and the lazco, V. A.: Improved retrievals of carbon dioxide from Orbiting contribution of deforestation, savanna, forest, agricultural, and Carbon Observatory-2 with the version 8 ACOS algorithm, At- peat fires (1997–2009), Atmos. Chem. Phys., 10, 11707–11735, mos. Meas. Tech., 11, 6539–6576, https://doi.org/10.5194/amt- https://doi.org/10.5194/acp-10-11707-2010, 2010. 11-6539-2018, 2018b. Wunch, D., Wennberg, P. O., Osterman, G., Fisher, B., Naylor, B., Olivier, J., Janssens-Maenhout, G., Munteam, M., and Peters, J.: Roehl, C. M., O’Dell, C., Mandrake, L., Viatte, C., Kiel, M., Trends in global CO2 emissions; 2014 Report, PBL Nether- Griffith, D. W. T., Deutscher, N. M., Velazco, V. A., Notholt, J., lands Environmental Assessment Agency; European Commis- Warneke, T., Petri, C., De Maziere, M., Sha, M. K., Sussmann, sion, Joint Research Centre, Ispra, Italy, 2014. R., Rettinger, M., Pollard, D., Robinson, J., Morino, I., Uchino, Olson, D. M., Dinerstein, E., Wikramanayake, E. D., Burgess, O., Hase, F., Blumenstock, T., Feist, D. G., Arnold, S. G., Strong, N. D., Powell, G. V. N., Underwood, E. C., D’amico, J. A., K., Mendonca, J., Kivi, R., Heikkinen, P., Iraci, L., Podolske, Itoua, I., Strand, H. E., Morrison, J. C., Loucks, C. J., J., Hillyard, P. W., Kawakami, S., Dubey, M. K., Parker, H. A., Allnutt, T. F., Ricketts, T. H., Kura, Y., Lamoreux, J. F., Sepulveda, E., García, O. E., Te, Y., Jeseck, P., Gunson, M. R., Wettengel, W. W., Hedao, P., and Kassem, K. R.: Ter- Crisp, D., and Eldering, A.: Comparisons of the Orbiting Carbon restrial ecoregions of the world: A new map of life on Observatory-2 (OCO-2) XCO2 measurements with TCCON, At- Earth, BioScience, 51, 933–938, https://doi.org/10.1641/0006- mos. Meas. Tech., 10, 2209–2238, https://doi.org/10.5194/amt- 3568(2001)051[0933:TEOTWA]2.0.CO;2, 2001. 10-2209-2017, 2017. Polonsky, I. N., O’Brien, D. M., Kumer, J. B., O’Dell, C. W., Yang, D., Liu, Y., Cai, Z., Chen, X., Yao, L., and Lu, D.: First global and the geoCARB Team: Performance of a geostationary mis- carbon dioxide maps produced from TanSat measurements, Adv. sion, geoCARB, to measure CO2 , CH4 and CO column- Atmos. Sci., 35, 621–623, https://doi.org/10.1007/s00376-018- averaged concentrations, Atmos. Meas. Tech., 7, 959–981, 7312-6, 2018. https://doi.org/10.5194/amt-7-959-2014, 2014. www.atmos-chem-phys.net/20/323/2020/ Atmos. Chem. Phys., 20, 323–331, 2020
You can also read