Automated Detection of Acute Myocardial Infarction Using Asynchronous Electrocardiogram Signals-Preview of Implementing Artificial Intelligence ...
←
→
Page content transcription
If your browser does not render page correctly, please read the page content below
JOURNAL OF MEDICAL INTERNET RESEARCH                                                                                                             Han et al

     Original Paper

     Automated Detection of Acute Myocardial Infarction Using
     Asynchronous Electrocardiogram Signals—Preview of
     Implementing Artificial Intelligence With Multichannel
     Electrocardiographs Obtained From Smartwatches: Retrospective
     Study

     Changho Han1*, MD, MSc; Youngjae Song2*, PhD; Hong-Seok Lim3*, MD, PhD; Yunwon Tae2, MSc; Jong-Hwan
     Jang1, PhD; Byeong Tak Lee2, MSc; Yeha Lee2, PhD; Woong Bae2, MSc; Dukyong Yoon1,4, MD, PhD
     1
      Department of Biomedical Systems Informatics, Yonsei University College of Medicine, Yongin, Republic of Korea
     2
      VUNO Inc, Seoul, Republic of Korea
     3
      Department of Cardiology, Ajou University School of Medicine, Suwon, Republic of Korea
     4
      Center for Digital Health, Yongin Severance Hospital, Yonsei University Health System, Yongin, Republic of Korea
     *
      these authors contributed equally

     Corresponding Author:
     Dukyong Yoon, MD, PhD
     Department of Biomedical Systems Informatics
     Yonsei University College of Medicine
     363, Dongbaekjukjeon-daero, Giheung-gu
     Yongin, 16995
     Republic of Korea
     Phone: 82 3151898450
     Email: dukyong.yoon@yonsei.ac.kr

     Abstract
     Background: When using a smartwatch to obtain electrocardiogram (ECG) signals from multiple leads, the device has to be
     placed on different parts of the body sequentially. The ECG signals measured from different leads are asynchronous. Artificial
     intelligence (AI) models for asynchronous ECG signals have barely been explored.
     Objective: We aimed to develop an AI model for detecting acute myocardial infarction using asynchronous ECGs and compare
     its performance with that of the automatic ECG interpretations provided by a commercial ECG analysis software. We sought to
     evaluate the feasibility of implementing multiple lead–based AI-enabled ECG algorithms on smartwatches. Moreover, we aimed
     to determine the optimal number of leads for sufficient diagnostic power.
     Methods: We extracted ECGs recorded within 24 hours from each visit to the emergency room of Ajou University Medical
     Center between June 1994 and January 2018 from patients aged 20 years or older. The ECGs were labeled on the basis of whether
     a diagnostic code corresponding to acute myocardial infarction was entered. We derived asynchronous ECG lead sets from
     standard 12-lead ECG reports and simulated a situation similar to the sequential recording of ECG leads via smartwatches. We
     constructed an AI model based on residual networks and self-attention mechanisms by randomly masking each lead channel
     during the training phase and then testing the model using various targeting lead sets with the remaining lead channels masked.
     Results: The performance of lead sets with 3 or more leads compared favorably with that of the automatic ECG interpretations
     provided by a commercial ECG analysis software, with 8.1%-13.9% gain in sensitivity when the specificity was matched. Our
     results indicate that multiple lead-based AI-enabled ECG algorithms can be implemented on smartwatches. Model performance
     generally increased as the number of leads increased (12-lead sets: area under the receiver operating characteristic curve [AUROC]
     0.880; 4-lead sets: AUROC 0.858, SD 0.008; 3-lead sets: AUROC 0.845, SD 0.011; 2-lead sets: AUROC 0.813, SD 0.018;
     single-lead sets: AUROC 0.768, SD 0.001). Considering the short amount of time needed to measure additional leads, measuring
     at least 3 leads—ideally more than 4 leads—is necessary for minimizing the risk of failing to detect acute myocardial infarction
     occurring in a certain spatial location or direction.

     https://www.jmir.org/2021/9/e31129                                                                   J Med Internet Res 2021 | vol. 23 | iss. 9 | e31129 | p. 1
                                                                                                                        (page number not for citation purposes)
XSL• FO
RenderX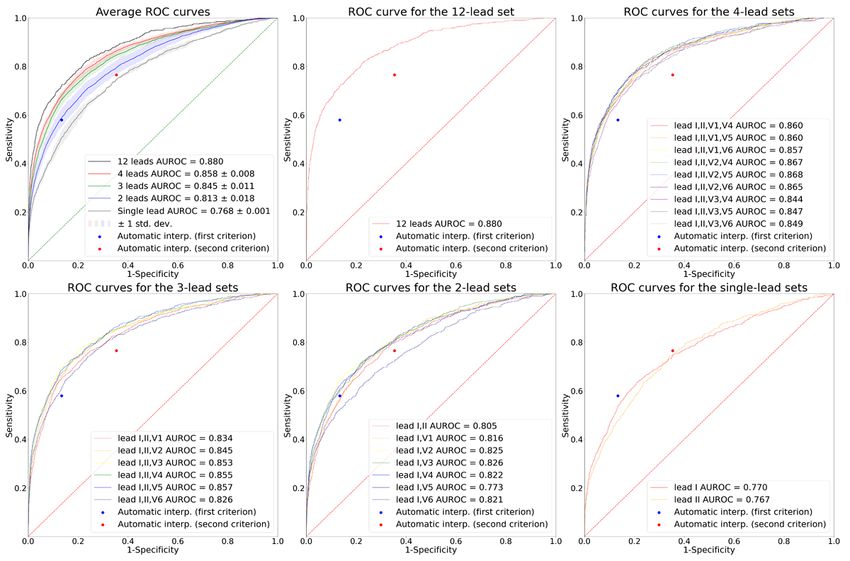
JOURNAL OF MEDICAL INTERNET RESEARCH                                                                                                       Han et al

     Conclusions: By developing an AI model for detecting acute myocardial infarction with asynchronous ECG lead sets, we
     demonstrated the feasibility of multiple lead-based AI-enabled ECG algorithms on smartwatches for automated diagnosis of
     cardiac disorders. We also demonstrated the necessity of measuring at least 3 leads for accurate detection. Our results can be used
     as reference for the development of other AI models using sequentially measured asynchronous ECG leads via smartwatches for
     detecting various cardiac disorders.

     (J Med Internet Res 2021;23(9):e31129) doi: 10.2196/31129

     KEYWORDS
     wearables; smartwatches; asynchronous electrocardiogram; artificial intelligence; deep learning; automatic diagnosis; myocardial
     infarction; timely diagnosis; machine learning; digital health; cardiac health; cardiology

                                                                           different leads are asynchronous when measured in this way.
     Introduction                                                          There are also reports evaluating the concordance of
     Wearable devices, simply referred to as “wearables,” are smart        multiple-lead ECG obtained by smartwatches compared with
     electronics or computers that are integrated into clothing and        the standard 12-lead ECG in detecting conditions related to
     other accessories that can be worn on or attached to the body         ischemic heart disease when read by physicians [11-13].
     [1]. The consumer adoption of wearable technology for health          To the best of our knowledge, previous studies on automated
     care services is skyrocketing owing to increasing interest in         diagnosis or classification of ECGs using artificial intelligence
     personalized health management, disease prevention, and fitness       (AI) have utilized either single-lead ECGs or synchronous
     [2,3]. One such technology is continuous/day-to-day                   multiple-lead ECG signals as input [14-19]. Application of
     measurement of single-lead electrocardiograms (ECGs) via              asynchronous ECG signals for AI model development is largely
     smartwatches or other portable/handheld devices [4-6]. These          unexplored. Such an application needs to be assessed to ensure
     devices can provide a novel opportunity for facilitating timely       that multiple lead-based AI-enabled ECG models can be
     diagnostics by extending the availability of ECG measurement          implemented on smartwatches. Moreover, the adequate number
     to the general population outside the hospital.                       of sequentially recorded leads from smartwatches that would
     Smartwatches and other portable/handheld ECG devices                  ensure sufficient diagnostic power of the AI-enabled ECG model
     measure single-lead ECG when the 2 electrode detectors are            needs to be verified.
     attached to 2 different parts of the body [5]. However, useful        In this study, we aimed to develop an AI model for detecting
     information from other leads can potentially be neglected when        acute myocardial infarction using asynchronous ECG lead sets
     only a single lead is evaluated [7]. Analyzing electrical activity    and then compare the performance of our model with that of an
     of the heart from different spatial locations by measuring            automatic ECG interpretation provided by a commercial ECG
     multiple leads is necessary for accurate and robust detection of      analysis software. Such a model could prove the feasibility of
     cardiac disorders, such as myocardial infarction, pulmonary           AI-enabled ECG algorithms on smartwatches. As a prerequisite
     embolism, and acute left or right heart failure [8,9]. Accordingly,   to develop such a model, we derived asynchronous ECG signals
     the standard 12-lead ECG is the most commonly used                    from standard 12-lead ECG reports to simulate a situation
     assessment among physicians for evaluation of the heart.              similar to the sequential recording of ECG leads via
     Previous studies have explored the possibility and described          smartwatches. Moreover, we aimed to find the optimal number
     the methodology of measuring multiple ECG leads using                 of leads for sufficient diagnostic power by randomly masking
     smartwatches [9,10]. Multiple ECG leads can be obtained from          each lead channel during the training phase and
     smartwatches by sequentially placing the smartwatch on                validating/testing our model with various targeting lead sets
     different parts of the body (Figure 1). The ECG signals from          (and masking the remaining lead channels).

     https://www.jmir.org/2021/9/e31129                                                             J Med Internet Res 2021 | vol. 23 | iss. 9 | e31129 | p. 2
                                                                                                                  (page number not for citation purposes)
XSL• FO
RenderX
JOURNAL OF MEDICAL INTERNET RESEARCH                                                                                                                 Han et al

     Figure 1. Example of measuring multi-lead electrocardiogram (ECG) from a smartwatch. Multiple-lead ECG can be obtained from smartwatches by
     sequentially placing the smartwatch on different parts of the body. The figure depicts an example of measuring leads I, II, V1, and V4 sequentially.
     Lead I can be recorded with the smartwatch on the left wrist and the right index finger on the crown. Then, after removing the smartwatch from the left
     wrist, lead II can be recorded with the smartwatch on the left lower quadrant of the abdomen and the right index finger on the crown. Next, leads V1
     and V4 can be recorded with the smartwatch on the fourth intercostal space at the right sternal border and fifth intercostal space at the midclavicular
     line, respectively, with the right index finger on the crown in both cases.

                                                                                  emergency room visit time or the diagnosis of the patients, from
     Methods                                                                      the AUMC Electronic Medical Records database.
     Ethics Approval                                                              For our study, we identified and extracted ECGs recorded within
     The Institutional Review Board of Ajou University Hospital                   24 hours from each visit to the emergency room between June
     approved this study (protocol AJIRB-MED-MDB-20-597) and                      1994 and January 2018 from patients aged 20 years or older.
     waived the requirement for informed consent because only                     For each visit to the emergency room, all diagnoses made during
     anonymized data were used retrospectively.                                   the stay in hospital were collected. If either International
                                                                                  Classification of Diseases, Tenth Revision (ICD-10) code I21
     Data Sample and Labeling                                                     (acute myocardial infarction) or I22 (subsequent ST elevation
     We utilized standard 12-lead ECG reports collected from                      and non-ST elevation) was entered, the ECGs for those visits
     General Electric (GE) ECG machines at Ajou University                        were labeled as having acute myocardial infarction. For visits
     Medical Center (AUMC), a tertiary teaching hospital in South                 that had neither of the 2 ICD-10 codes entered, the ECGs for
     Korea. These ECG reports of AUMC originally exist as PDFs                    those visits were labeled as not having acute myocardial
     and are stored in a database. Thus far, the ECG database contains            infarction.
     a total of 1,039,550 ECGs from 447,445 patients, collected
                                                                                  We split the data into training/validation (80%) and independent
     between June 1994 and January 2018. A previous study
                                                                                  hold-out test (20%) sets, and then further split the
     extracted raw waveforms, demographic information, and ECG
                                                                                  training/validation set into training (85%) and validation (15%)
     measurement parameters/automatic ECG interpretations made
                                                                                  sets. To reduce ambiguity, we excluded patients whose time of
     by the GE Marquette 12SL ECG Analysis Program from these
                                                                                  registration for the ICD-10 codes for acute myocardial infarction
     reports [20]. In these reports, each lead is 2.5 seconds in duration
                                                                                  (I21 or I22) was either “null” (meaning that the registration time
     and sampled at 500 Hz. We also collected clinical data, such as
                                                                                  was not entered and thus is unknown) or not within 24 hours
                                                                                  of ECG measurement.

     https://www.jmir.org/2021/9/e31129                                                                       J Med Internet Res 2021 | vol. 23 | iss. 9 | e31129 | p. 3
                                                                                                                            (page number not for citation purposes)
XSL• FO
RenderX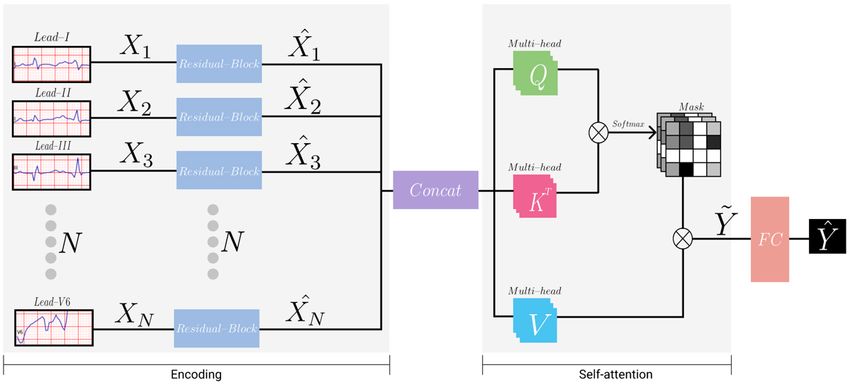
JOURNAL OF MEDICAL INTERNET RESEARCH                                                                                                                     Han et al

     After model development, we compared the performance of our                    each lead channel and then tested our model with various target
     model with that of the automatic ECG interpretation provided                   lead sets (while masking the remaining lead channels) to
     by the GE ECG analysis program. To derive the performance                      determine the optimal number of leads for sufficient diagnostic
     of the automatic ECG interpretation for detecting acute                        power. The tested lead sets are specified in Multimedia
     myocardial infarction, we categorized the interpretations in 2                 Appendix 2. For the multiple-lead sets, we included lead I in
     different ways. First, the automatic ECG interpretation was                    all cases, given that lead I is the most basic lead channel that
     categorized as myocardial infarction if the interpretation                     can be measured from a smartwatch: lead I can be measured by
     included at least one of the following three phrases: “ACUTE                   placing the right index finger on the crown without removing
     MI,” “ST elevation,” and “infarct.” The second categorizing                    the smartwatch from the left wrist. The lead channels in each
     criterion consisted of the 3 phrases in the first labeling criterion           4-, 3-, and 2-lead set are completely asynchronous. Thus, the
     along with the following three phrases: “T wave abnormality,”                  lead channels included in the 4-lead sets were leads I and II
     “ST abnormality,” and “ST depression.” We thus derived 2                       (calculated from leads aVR, aVL, and aVF) for the limb leads
     distinct performance indices from these 2 categories.                          and all the possible combinations of 2 precordial leads that could
                                                                                    be derived from the ECG report while maintaining complete
     Deriving Asynchronous Lead Sets From ECG Reports                               asynchrony. The lead channels included in the 3-lead sets were
     Multimedia Appendix 1 shows an example of a standard 12-lead                   leads I and lead II (calculated from leads aVR, aVL, and aVF)
     ECG report used at AUMC. These ECG reports are                                 for the limb leads and 1 precordial lead. The lead channels
     asynchronous as a whole while being synchronous when                           included in the 2-lead sets were lead I and either lead II
     grouped into 4 subsets of 3 leads each. The x-axis of the ECG                  (calculated from leads aVR, aVL, and aVF) or 1 precordial lead.
     report represents time flow; the waveforms on the left side are                We also tested 2 single-lead cases (lead I or II).
     recorded earlier than those on the right side. The total recorded
     time of this ECG report is 10 seconds. In Multimedia Appendix                  Primary and Secondary Aims of the Study
     1, leads I, II, and III are shown to have been recorded 2.5                    Our primary aim was to develop an AI model for detecting acute
     seconds earlier than leads aVR, aVL, and aVF, which were                       myocardial infarction from asynchronous ECG signals, which
     recorded 2.5 seconds earlier than leads V1, V2, and V3, which                  outperforms the automatic ECG interpretation provided by the
     in turn had been recorded 2.5 seconds earlier than leads V4,                   GE ECG analysis program. Our secondary aim was to determine
     V5, and V6.                                                                    the optimal number of leads required for sufficient diagnostic
                                                                                    power. Model performances were assessed using the following
     As previously mentioned, asynchronous ECG lead sets can be
                                                                                    statistics: area under the receiver operating characteristic curve
     derived from ECG reports to simulate a situation similar to the
                                                                                    (AUROC), area under the precision-recall curve (AUPRC),
     sequential recording of ECG leads via smartwatches. For
                                                                                    sensitivity, specificity, positive predictive value (PPV), and
     example, a 4-lead subset consisting of leads I, aVR, V1, and
                                                                                    negative predictive value (NPV).
     V4 from the ECG report is completely asynchronous. According
     to the Einthoven law and Goldberger equation, for the 6 limb                   Neural Network Architecture and Training
     leads (leads I, II, III, aVR, aVL, and aVF), the remaining 4 leads             Figure 2 illustrates the architecture of the neural network model
     can be calculated even if only 2 leads are available [21,22].                  used in our study. The model was divided into two phases:
     Here, we trained/validated our AI model by randomly masking                    encoding and self-attention.
     Figure 2. Illustration of the neural network's architecture. The encoding phase encodes each lead channel with a weight-shared structure. The self-attention
     phase captures the relation between each lead channel.

     https://www.jmir.org/2021/9/e31129                                                                           J Med Internet Res 2021 | vol. 23 | iss. 9 | e31129 | p. 4
                                                                                                                                (page number not for citation purposes)
XSL• FO
RenderX
JOURNAL OF MEDICAL INTERNET RESEARCH Han et al
Encoding Phase combinations can be set as target leads. The specific
The model took the input of 2.5 seconds from each 12-lead ECG combinations that we tested are specified in Multimedia
channel, which was downsampled from 500 Hz to 250 Hz. Each Appendix 2. After acquiring the attention matrices, we computed
lead was processed in a separate but weight-shared encoder. the dot products of the values with attention matrices such that
Details of the architecture of the encoder are summarized in the model could reflect the relation between leads. Afterward,
Multimedia Appendix 3. The encoder consisted of 16 residual these outputs from all the multi-heads were concatenated and
blocks with 2 or three 1-dimensional convolutional neural linearly projected so that the final output dimension of the
network (CNN) layers in each block [23]. Every CNN layer multi-head self-attention module became 512 (the same as the
was followed by a batch normalization layer and a ReLU original input of the multi-head self-attention module).
activation function. All the CNN layers had a kernel size of 7 We then flattened the output of lead channels before feeding
and the “same” padding. In the first residual block, the output them into the classifier. The classifier had 2 layers of dense
of the first ReLU activation function was connected to the layers, which reduced the dimension from 6144 (512 × 12) to
block’s output via a pooling layer. In the following 15 residual 1, followed by a sigmoid layer that calibrated the probability
blocks, the input and output of each block were connected via
of acute myocardial infarction (ie, ) range from 0 to 1. We
skip connection. CNN layers with a stride of 2 were applied
split the data into training/validation (80%) and independent
every 2 or 4 residual blocks. The depth (number of features) of
hold-out test (20%) sets, and then further split the
the CNN layers increased by a factor of 2 per 4 residual blocks.
training/validation set into training (85%) and validation (15%)
For example, a stride described as “2,1,1” in Multimedia
sets. For training, we used the Adam optimizer with a batch
Appendix 3 implies that there are 3 CNN layers in that block
size of 32 and a learning rate of 0.001. We also applied weight
and the stride of those CNN layers are 2, 1, and 1, respectively.
decay and several data augmentation techniques, including
The “Length” and “Depth” columns in Multimedia Appendix
random Gaussian noise, time scaling, and signal masking, to
3 are the length and depth of the output of each block. Each
prevent overfitting. To tune the hyperparameters, we utilized
feature of the final output of the encoder was average pooled
validation data sets with extensive experiment settings (ie, 12-,
to obtain length=1.
4-, 3-, 2-, and single-lead settings). We implemented the model
Self-attention Phase using the Pytorch library.
To capture the associations among each lead channel, we utilized
a multi-head self-attention module that consisted of queries, Results
keys, and values. Each query, key, and value represented a single
Data Set Characteristics
dense layer that took all output from the encoder (ie, )
From the AUMC ECG database, we extracted 97,742 patients
[24]. We computed the dot products of the query with all keys
aged 20 years or older with 183,982 ECGs recorded within 24
and applied a softmax function to obtain N×N attention matrices,
hours from each visit to the emergency room (Figure 3). After
where N is the number of lead channels. During the training
applying the exclusion criteria, we included 76,829 patients
phase of the model, to ensure generalization and applicability
with 138,549 ECGs in the training and validation data set, and
for any lead combinations (eg, various 4-, 3-, 2-, and single-lead
19,109 patients with 34,371 ECGs in the test data set. The data
sets), we randomly masked each lead channel on the attention
set characteristics are summarized in Table 1. The proportion
matrices. Meanwhile, we masked all the lead channels except
of ECGs labeled as acute myocardial infarction was 1.78% for
for the specific targeting leads during the inference phase. For
the training and validation data set, and 1.61% for the test data
instance, if the target leads were I and V1, we masked all other
set.
leads but leads I and V1 during the inference phase. Any lead
https://www.jmir.org/2021/9/e31129 J Med Internet Res 2021 | vol. 23 | iss. 9 | e31129 | p. 5
(page number not for citation purposes)
XSL• FO
RenderXJOURNAL OF MEDICAL INTERNET RESEARCH Han et al
Figure 3. Patient flow diagram. The patients were split into training and validation (80%) and test (20%) data sets. ECG: electrocardiogram, ICD-10:
International Classification of Diseases, Tenth Revision.
Table 1. Data set characteristics.
Characteristics Training and validation (n=138,549) Test (n=34,371)
Patients, n 76,829 19,109
Age (years), mean (SD) 59.00 (16.98) 59.00 (16.95)
Sex
Male
Electrocardiographs, n 75,552 18,426
Patients, n 40,662 10,043
Female
Electrocardiographs, n 64,097 15,945
Patients, n 36,170 9066
Acute myocardial infarction, n 2465 554
with 3 or more leads had a better performance than the automatic
Model Performance interpretations: their corresponding ROC and PR curves
Figures 4 and 5 show the receiver operating characteristic (ROC) consistently lay above the corresponding dots of the automatic
and the precision-recall (PR) curves for the various target lead ECG interpretations. Similarly, the single-lead sets had worse
sets. The dots indicate the performance of the automatic ECG performance than the automatic ECG interpretations: the
interpretations provided by the GE ECG analysis program. The corresponding ROC and PR curves lead sets lay below the
sensitivity, specificity, PPV, and NPV of the first labeling corresponding dots of the automatic ECG interpretations. For
criterion of the automatic ECG interpretation were 0.579, 0.866, the 2-lead sets, some of the ROC and PR curves lay above and
0.066, and 0.992, respectively. The corresponding values of the some below the corresponding dots of the automatic ECG
second labeling criterion of the automatic ECG interpretation interpretations, which implied that not all the 2-lead sets had a
were 0.765, 0.647, 0.034, and 0.996, respectively. Lead sets better performance than the automatic interpretations.
https://www.jmir.org/2021/9/e31129 J Med Internet Res 2021 | vol. 23 | iss. 9 | e31129 | p. 6
(page number not for citation purposes)
XSL• FO
RenderXJOURNAL OF MEDICAL INTERNET RESEARCH Han et al
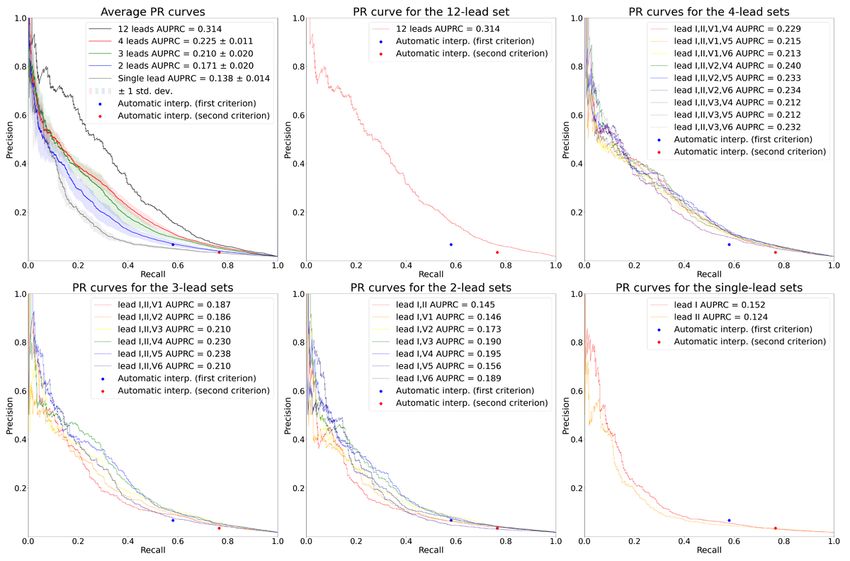
Figure 4. ROC curves for the various target lead sets. The plot on the upper left shows the average ROC curves according to the number of leads. The
solid lines depict the average ROC curves, and the shaded areas depict 1 SD of the ROC curves. The rest of the plots show the ROC curves for the 12-,
4-, 3-, 2-, and single-lead sets, respectively. In all plots, the performance of the automatic ECG interpretations is depicted as dots. AUROC: area under
the receiver operating characteristic curve; ROC: receiver operating characteristic curve.
https://www.jmir.org/2021/9/e31129 J Med Internet Res 2021 | vol. 23 | iss. 9 | e31129 | p. 7
(page number not for citation purposes)
XSL• FO
RenderXJOURNAL OF MEDICAL INTERNET RESEARCH Han et al
Figure 5. PR curves for the various target lead sets. The plot on the upper left shows the average PR curves according to the number of leads. The solid
lines depict the average PR curves, and the shaded areas depict 1 SD of the PR curves. The rest of the plots show the PR curves for the 12-, 4-, 3-, 2-,
and single-lead sets, respectively. In all plots, the performance of the automatic ECG interpretations is depicted as dots. AUPRC: area under the
precision-recall curve; PR: precision-recall.
The average AUROCs for the 12-, 4-, 3-, 2-, and single-lead significant at a significance level of .05, as revealed through
sets were 0.880, 0.858 (SD 0.008), 0.845 (SD 0.011), 0.813 (SD the DeLong test.
0.018), and 0.768 (SD 0.001), respectively. The average
When we set the thresholds of the lead sets to match the
AUPRCs for the 12-, 4-, 3-, 2-, and single-lead sets were 0.314,
specificity of the first labeling criteria of the automatic ECG
0.225 (SD 0.011), 0.210 (SD 0.020), 0.171 (SD 0.020), and
interpretation (specificity=0.866), the 12-, 4-, and 3-lead sets
0.138 (SD 0.014), respectively. These values indicate that the
demonstrated an average gain in sensitivity of 13.9%, 10.2%
average AUROC and AUPRC increased as the number of leads
(SD 1.6%), and 8.5% (SD 2.7%), respectively (Table 2),
increased. All the comparisons of AUROCs between ROC
compared to the automatic ECG interpretation, while
curves having the median AUROC from lead sets with different
maintaining a high NPV above 0.99. The results for the second
numbers of leads (“12-lead set” vs “4-lead set [leads I, II, V1,
labeling criteria (specificity=0.647) revealed average gains in
V5]” vs “3-lead set [leads I, II, V3]” vs “2-lead set [leads I,
sensitivity of 11.9%, 9.8% (SD 1.2%), and 8.1% (SD 1.5%) for
V6]” vs “single-lead set [lead I]”) were statistically significant
the lead sets with 12, 4, and 3 leads, respectively (Table 2),
at a significance level of .05, as revealed through the DeLong
while maintaining a high NPV above 0.99. The sensitivities of
test [25]. All the comparisons of AUROCs between ROC curves
the 2-lead sets were, on average but not consistently, slightly
having the highest AUROC from lead sets with different
higher than those of the automatic ECG interpretations when
numbers of leads (“12-lead set” vs “4-lead set [leads I, II, V2,
the thresholds of the 2-lead sets were set to match the
V5]” vs “3-lead set [leads I, II, V5]” vs “2-lead set [leads I,
specificities of the automatic ECG interpretations. Single-lead
V3]” vs “single-lead set [lead I]”) were also statistically
sets had lower sensitivities than the automatic ECG
interpretations when the specificities were matched.
https://www.jmir.org/2021/9/e31129 J Med Internet Res 2021 | vol. 23 | iss. 9 | e31129 | p. 8
(page number not for citation purposes)
XSL• FO
RenderXJOURNAL OF MEDICAL INTERNET RESEARCH Han et al
Table 2. Average sensitivity, positive predictive value, and negative predictive value according to the number of leads when the thresholds were set
to match the specificity of the first or second labeling criteria of automatic electrocardiogram interpretation.
Sensitivity Positive predictive value Negative predictive value
At specifici- At specifici- At specifici- At specifici- At specifici- At specifici-
ty=0.866 (first la- ty=0.647 (second ty=0.866 (first la- ty=0.647 (second ty=0.866 (first la- ty=0.647 (second
beling criteria) labeling criteria) beling criteria) labeling criteria) beling criteria) labeling criteria)
Automatic electrocardio- 0.579 0.765 0.066 0.034 0.992 0.996
gram interpretation
12-lead set 0.718 0.884 0.081 0.039 0.995 0.997
4-lead sets, mean (SD) 0.681 (0.016) 0.863 (0.012) 0.077 (0.002) 0.039 (0.001) 0.994 (0.000) 0.997 (0.000)
3-lead sets, mean (SD) 0.664 (0.027) 0.846 (0.015) 0.075 (0.003) 0.038 (0.001) 0.994 (0.000) 0.996 (0.000)
2-lead sets, mean (SD) 0.589 (0.038) 0.794 (0.030) 0.067 (0.004) 0.036 (0.001) 0.992 (0.001) 0.995 (0.001)
Single-lead sets, mean (SD) 0.505 (0.029) 0.745 (0.001) 0.058 (0.003) 0.033 (0.000) 0.991 (0.001) 0.994 (0.000)
Previous studies on automated diagnosis or classification of
Discussion multiple-lead ECGs using AI have used synchronous ECG
Principal Findings signals as input. The results from these studies are insufficient
for the evaluation of the feasibility of multiple lead-based
In this study, we developed an AI model for detecting acute AI-enabled ECG algorithms on smartwatches since only
myocardial infarction by randomly masking each lead channel asynchronous ECG signals can be obtained from smartwatches.
during the training phase and testing the model using various To the best of our knowledge, our study is the first to utilize
target ECG lead sets with the remaining lead channels masked. asynchronous ECG signals for AI model development. Future
First, we found that the performances of lead sets with 3 or more studies could aim at developing AI models with asynchronous
leads compared favorably with that of the automatic ECG ECG signals for detecting cardiac disorders other than acute
interpretations provided by the GE ECG analysis program, with myocardial infarction, such as cardiac arrhythmias or contractile
a 8.1%-13.9% gain in sensitivity when the threshold was set to dysfunctions.
match the specificity of the automatic ECG interpretations, and
with the ROC and PR curves lying above the corresponding Our study has important medical and economic impacts. First,
dots of the automatic ECG interpretations. Only some of the our model can significantly reduce time to diagnosis, and
2-lead sets compared favorably with the automatic ECG consequently reduce time to reperfusion, which is the elapsed
interpretations. When only a single lead was evaluated, acute time between the onset of symptoms and reperfusion and is
myocardial infarction could be underdiagnosed; thus, useful critical to the clinical outcome of the disease [26]. The ECG is
information from other leads could potentially be neglected. commonly the first diagnostic test in the evaluation of
Indeed, single-lead sets performed worse than the automatic myocardial infarction, and it should be acquired as early as
ECG interpretations. practicable [27]. Traditionally, the bulky ECG equipment and
the need for a trained physician for diagnosis have required the
Multiple-lead ECG is necessary for the accurate and robust transfer of patients to hospitals, even in emergency situations.
detection of cardiac disorders, particularly acute myocardial This practice greatly delays time to diagnosis, which would be
infarction. Given that multiple-lead ECGs can be obtained by most ideal if made directly in the field. With our model
smartwatches only in an asynchronous manner, our results imply implemented on smartwatches, reliable preliminary diagnosis
that multiple lead-based AI-enabled ECG algorithms can be can be made even before contact with emergency services,
implemented on these devices. Such implementation could thereby greatly reducing the time from the onset of symptoms
facilitate timely diagnostics to enhance outcomes and reduce to diagnosis. With the preliminary diagnosis already made,
mortality among cardiovascular disease populations outside the patients can be promptly triaged to the most appropriate form
hospital. of treatment after accounting for geographical factors and
Second, we found that model performance generally increased available facilities [26]. The final diagnosis should be made by
as the number of leads increased (12-lead set: AUROC 0.880; a trained physician after arriving at the appropriate facility, but
4-lead sets: AUROC 0.858, SD 0.008; 3-lead sets: AUROC with the aid of our model, the time required for the entire process
0.845, SD 0.011; 2-lead sets: AUROC 0.813, SD 0.018; can be greatly reduced. The threshold for a positive result from
single-lead sets: AUC 0.768, SD 0.001). With smartwatches, our model can be altered to balance between over- and
measuring additional leads would only take less than a minute, undertriage. Second, our model has the potential to greatly
and the benefit of doing so would greatly outweigh the risk. In reduce mortality and the related economic burden due to acute
an emergency situation, we suggest measuring at least 3 leads myocardial infarction. Untimely diagnosis or treatment results
(ie, I, II, and V5) and ideally more than 4 leads (ie, I, II, V2, in increased myocardial damage and mortality. The extent of
and V5) to minimize the risk of failing to detect acute myocardial salvage is greatest if patients are reperfused in the
myocardial infarction occurring in a certain spatial location or first 3 hours after onset of symptoms [28]. For every 30-minute
direction. delay in coronary reperfusion, the relative 1-year mortality rate
increases by 7.5% [29]. Our model can reduce mortality due to
https://www.jmir.org/2021/9/e31129 J Med Internet Res 2021 | vol. 23 | iss. 9 | e31129 | p. 9
(page number not for citation purposes)
XSL• FO
RenderXJOURNAL OF MEDICAL INTERNET RESEARCH Han et al
acute myocardial infarction by facilitating timely diagnosis and However, our study also has some limitations. First, our labeling
reperfusion. Consequently, the economic cost caused by lost method might be problematic. The diagnosis of acute myocardial
productivity from premature mortality due to acute myocardial infarction does not ensure that the patient’s initial ECG in the
infarction, which is estimated to be US $40.5 billion annually emergency room would show explicit signs of acute myocardial
in the United States, can also be reduced [30]. Third, since our infarction. Thus, some ECGs labeled as acute myocardial
study indicates the feasibility of multiple lead-based AI-enabled infarction in our data set might not explicitly show signs of
ECG algorithms on smartwatches, it can promote the acute myocardial infarction. Nevertheless, our model showed
development of AI models with asynchronous ECG signals for high performance, with our 12-lead set having an AUROC of
detecting cardiac disorders other than acute myocardial 0.880. Second, the 12-lead set is not completely asynchronous.
infarction, thus accelerating market growth in this field. When grouped into 4 subsets with 3 leads in each subset, the
ECGs are asynchronous intersubset-wise, while being
Strengths and Limitations synchronous intrasubset-wise. Thus, the maximum number of
Our study has several strengths. First, our model only takes leads that can compose a completely asynchronous lead set in
ECG as input and does not require other additional clinical data. our study was 4. The diagnostic capacity of a model tested with
This implies that our model is highly applicable in real-world, 5 or more completely asynchronous lead sets needs to be
real-time settings where no medical practitioners are available. evaluated in future studies. Third, our model cannot be deemed
Smartwatches are the only requirement for applying our model. as a confirmatory test. The final confirmatory diagnosis should
Second, our model is theoretically implementable with all be made by a trained physician after the patient arrives in
smartwatches, which further strengthens our study in terms of hospital. However, with the preliminary diagnosis made by our
real-world applicability. That is, creating a mobile software app model, patients can be efficiently triaged to get the most
that activates the ECG hardware, instructs the wearer on how appropriate form of treatment after accounting for geographical
to measure the leads, preprocesses the measured leads to satisfy factors and available facilities, even before contact with
the input conditions of our AI model (eg, resampling the ECG emergency services. Finally, our model was not validated with
to 250 Hz, snipping 2.5 seconds from each lead), and runs our external data sets. In future studies, external validation should
AI model, would be sufficient for real-world implementation. be performed to ensure the reliability of our model in new
We believe that with the aid of mobile app developers, such an environments.
app would not be technically difficult to develop. We leave this
as a subject for further study. Third, we did not exclude ECGs Conclusions
on the basis of waveform abnormalities. This implies that our In conclusion, this study shows the feasibility of multiple
model is applicable regardless of ECG abnormalities, thereby lead-based AI-enabled ECG algorithms on smartwatches for
greatly enhancing the generalizability to real-world settings. the automated diagnosis of cardiac disorders by developing an
Fourth, our model was trained, validated, and tested with a very AI model for detecting acute myocardial infarction with
large data set of 172,920 ECGs recorded from 95,938 patients. asynchronous ECG signals. We also showed that measuring at
A large enough data set can reduce overfitting to the training least 3 leads, and ideally more than 4 leads, is necessary for
set, thus increasing generalizability to other data sets [31,32]. accurate detection. Our results show that single-lead sets lack
Fifth, as mentioned in the Methods section, our model is diagnostic performance. From our results, we look forward to
applicable to any lead combinations (eg, various 4-, 3-, 2-, and the development of other AI models that detect various cardiac
single-lead sets). This is because we randomly masked each disorders using sequentially measured, asynchronous ECG leads
lead channel on the attention matrices during the training phase. from smartwatches. Such models, along with our model, can
Thus, users would be able to choose any lead combination in facilitate timely diagnostics to enhance outcomes and reduce
accordance with their preferences or situation. mortality among various cardiac disease populations outside
the hospital.
Acknowledgments
This work was supported by the Korea Medical Device Development Fund grant funded by the Korean government (the Ministry
of Science and ICT; Ministry of Trade, Industry and Energy; Ministry of Health & Welfare; and Ministry of Food and Drug
Safety) (project number 1711138152, KMDF_PR_20200901_0095). This study was also supported by a new faculty research
seed money grant of Yonsei University College of Medicine for 2021 (2021-32-0044). We thank Medical Illustration & Design,
part of the Medical Research Support Services of Yonsei University College of Medicine, for all artistic support related to this
work.
Conflicts of Interest
CH and HSL declare that they have no competing interests. YS, YT, BTL, YL, and WB are employees of VUNO Inc. JHJ is an
employee of Medical AI Inc. DY is an employee of BUD.on Inc. VUNO Inc, Medical AI Inc, and BUD.on Inc did not have any
role in the study design, analysis, decision to publish, or the preparation of the manuscript. There are no patents, products in
development, or marketed products to declare.
https://www.jmir.org/2021/9/e31129 J Med Internet Res 2021 | vol. 23 | iss. 9 | e31129 | p. 10
(page number not for citation purposes)
XSL• FO
RenderXJOURNAL OF MEDICAL INTERNET RESEARCH Han et al
Multimedia Appendix 1
Standard 12-lead ECG report example.
[PNG File , 769 KB-Multimedia Appendix 1]
Multimedia Appendix 2
Tested lead sets.
[DOCX File , 19 KB-Multimedia Appendix 2]
Multimedia Appendix 3
Architecture of the encoder.
[DOCX File , 20 KB-Multimedia Appendix 3]
References
1. Wright R, Keith L. Wearable Technology: If the Tech Fits, Wear It. J Electron Resour Med Libr 2014 Dec 03;11(4):204-216.
[doi: 10.1080/15424065.2014.969051]
2. Lee SM, Lee D. Healthcare wearable devices: an analysis of key factors for continuous use intention. Serv Bus 2020 Oct
15;14(4):503-531. [doi: 10.1007/s11628-020-00428-3]
3. Kalantari M. Consumers' adoption of wearable technologies: literature review, synthesis, and future research agenda.
IJTMKT 2017;12(3):274. [doi: 10.1504/ijtmkt.2017.089665]
4. Koltowski L, Balsam P, Glowczynska R, Rokicki JK, Peller M, Maksym J, et al. Kardia Mobile applicability in clinical
practice: A comparison of Kardia Mobile and standard 12-lead electrocardiogram records in 100 consecutive patients of a
tertiary cardiovascular care center. Cardiol J 2021;28(4):543-548 [FREE Full text] [doi: 10.5603/CJ.a2019.0001] [Medline:
30644079]
5. Benezet-Mazuecos J, García-Talavera CS, Rubio JM. Smart devices for a smart detection of atrial fibrillation. J Thorac
Dis 2018 Nov;10(Suppl 33):S3824-S3827 [FREE Full text] [doi: 10.21037/jtd.2018.08.138] [Medline: 30631488]
6. Seshadri DR, Bittel B, Browsky D, Houghtaling P, Drummond CK, Desai MY, et al. Accuracy of Apple Watch for Detection
of Atrial Fibrillation. Circulation 2020 Feb 25;141(8):702-703. [doi: 10.1161/CIRCULATIONAHA.119.044126] [Medline:
32091929]
7. Al-Zaiti SS, Callaway CW, Kozik TM, Carey MG, Pelter MM. Clinical Utility of Ventricular Repolarization Dispersion
for Real-Time Detection of Non-ST Elevation Myocardial Infarction in Emergency Departments. J Am Heart Assoc 2015
Jul 24;4(7):e002057 [FREE Full text] [doi: 10.1161/JAHA.115.002057] [Medline: 26209692]
8. Meo M, Zarzoso V, Meste O, Latcu DG, Saoudi N. Spatial variability of the 12-lead surface ECG as a tool for noninvasive
prediction of catheter ablation outcome in persistent atrial fibrillation. IEEE Trans Biomed Eng 2013 Jan;60(1):20-27. [doi:
10.1109/TBME.2012.2220639] [Medline: 23033326]
9. Samol A, Bischof K, Luani B, Pascut D, Wiemer M, Kaese S. Recording of Bipolar Multichannel ECGs by a Smartwatch:
Modern ECG Diagnostic 100 Years after Einthoven. Sensors (Basel) 2019 Jun 30;19(13):2894 [FREE Full text] [doi:
10.3390/s19132894] [Medline: 31261981]
10. Samol A, Bischof K, Luani B, Pascut D, Wiemer M, Kaese S. Single-Lead ECG Recordings Including Einthoven and
Wilson Leads by a Smartwatch: A New Era of Patient Directed Early ECG Differential Diagnosis of Cardiac Diseases?
Sensors (Basel) 2019 Oct 10;19(20):4377 [FREE Full text] [doi: 10.3390/s19204377] [Medline: 31658713]
11. Spaccarotella CAM, Polimeni A, Migliarino S, Principe E, Curcio A, Mongiardo A, et al. Multichannel Electrocardiograms
Obtained by a Smartwatch for the Diagnosis of ST-Segment Changes. JAMA Cardiol 2020 Oct 01;5(10):1176-1180 [FREE
Full text] [doi: 10.1001/jamacardio.2020.3994] [Medline: 32865545]
12. Avila CO. Novel Use of Apple Watch 4 to Obtain 3-Lead Electrocardiogram and Detect Cardiac Ischemia. Perm J
2019;23:19-25 [FREE Full text] [doi: 10.7812/TPP/19-025] [Medline: 31314734]
13. Muhlestein JB, Le V, Albert D, Moreno FL, Anderson JL, Yanowitz F, et al. Smartphone ECG for evaluation of STEMI:
results of the ST LEUIS Pilot Study. J Electrocardiol 2015;48(2):249-259. [doi: 10.1016/j.jelectrocard.2014.11.005]
[Medline: 25601407]
14. Ribeiro AH, Ribeiro MH, Paixão GMM, Oliveira DM, Gomes PR, Canazart JA, et al. Automatic diagnosis of the 12-lead
ECG using a deep neural network. Nat Commun 2020 Apr 09;11(1):1760 [FREE Full text] [doi:
10.1038/s41467-020-15432-4] [Medline: 32273514]
15. Attia ZI, Noseworthy PA, Lopez-Jimenez F, Asirvatham SJ, Deshmukh AJ, Gersh BJ, et al. An artificial intelligence-enabled
ECG algorithm for the identification of patients with atrial fibrillation during sinus rhythm: a retrospective analysis of
outcome prediction. Lancet 2019 Sep 07;394(10201):861-867. [doi: 10.1016/S0140-6736(19)31721-0] [Medline: 31378392]
16. Chen Y, Liu C, Tseng V, Hu YF, Chen SA. Large-scale Classification of 12-lead ECG with Deep Learning. 2019 Presented
at: IEEE EMBS International Conference on Information Technology Applications in Biomedicine (ITAB); May 19-22,
2019; Chicago, IL. [doi: 10.1109/bhi.2019.8834468]
https://www.jmir.org/2021/9/e31129 J Med Internet Res 2021 | vol. 23 | iss. 9 | e31129 | p. 11
(page number not for citation purposes)
XSL• FO
RenderXJOURNAL OF MEDICAL INTERNET RESEARCH Han et al
17. Kwon J, Lee SY, Jeon K, Lee Y, Kim K, Park J, et al. Deep Learning-Based Algorithm for Detecting Aortic Stenosis Using
Electrocardiography. J Am Heart Assoc 2020 Apr 07;9(7):e014717 [FREE Full text] [doi: 10.1161/JAHA.119.014717]
[Medline: 32200712]
18. Adedinsewo D, Carter RE, Attia Z, Johnson P, Kashou AH, Dugan JL, et al. Artificial Intelligence-Enabled ECG Algorithm
to Identify Patients With Left Ventricular Systolic Dysfunction Presenting to the Emergency Department With Dyspnea.
Circ Arrhythm Electrophysiol 2020 Aug;13(8):e008437. [doi: 10.1161/CIRCEP.120.008437] [Medline: 32986471]
19. Jang J, Kim TY, Yoon D. Effectiveness of Transfer Learning for Deep Learning-Based Electrocardiogram Analysis. Healthc
Inform Res 2021 Jan;27(1):19-28 [FREE Full text] [doi: 10.4258/hir.2021.27.1.19] [Medline: 33611873]
20. Chung D, Choi J, Jang J, Kim TY, Byun J, Park H, et al. Construction of an Electrocardiogram Database Including 12 Lead
Waveforms. Healthc Inform Res 2018 Jul;24(3):242-246 [FREE Full text] [doi: 10.4258/hir.2018.24.3.242] [Medline:
30109157]
21. Goldberger E. A simple, indifferent, electrocardiographic electrode of zero potential and a technique of obtaining augmented,
unipolar, extremity leads. American Heart Journal 1942 Apr;23(4):483-492. [doi: 10.1016/s0002-8703(42)90293-x]
22. Einthoven W. Weiteres über das Elektrokardiogramm. Pflüger Arch 1908 May;122(12):517-584. [doi: 10.1007/bf01677829]
23. He K, Zhang X, Ren S, Sun J. Deep Residual Learning for Image Recognition. 2016 Presented at: IEEE Conference on
Computer Vision and Pattern Recognition (CVPR); June 27-30, 2016; Las Vegas, NV. [doi: 10.1109/cvpr.2016.90]
24. Vaswani A, Shazeer N, Parmar N, Uszkoreit J, Jones L, Gomez A, et al. Attention is all you need. arXiv Preprint posted
online June 12, 2017. [FREE Full text]
25. DeLong ER, DeLong DM, Clarke-Pearson DL. Comparing the areas under two or more correlated receiver operating
characteristic curves: a nonparametric approach. Biometrics 1988 Sep;44(3):837-845. [Medline: 3203132]
26. Brown AJ, Ha FJ, Michail M, West NEJ. Prehospital Diagnosis and Management of Acute Myocardial Infarction. In:
Primary Angioplasty: A Practical Guide. Singapore: Springer; 2018.
27. Link MS, Berkow LC, Kudenchuk PJ, Halperin HR, Hess EP, Moitra VK, et al. Part 7: Adult Advanced Cardiovascular
Life Support: 2015 American Heart Association Guidelines Update for Cardiopulmonary Resuscitation and Emergency
Cardiovascular Care. Circulation 2015 Nov 03;132(18 Suppl 2):S444-S464. [doi: 10.1161/CIR.0000000000000261]
[Medline: 26472995]
28. Gersh BJ, Stone GW, White HD, Holmes DR. Pharmacological facilitation of primary percutaneous coronary intervention
for acute myocardial infarction: is the slope of the curve the shape of the future? JAMA 2005 Feb 23;293(8):979-986. [doi:
10.1001/jama.293.8.979] [Medline: 15728169]
29. De Luca G, Suryapranata H, Ottervanger JP, Antman EM. Time delay to treatment and mortality in primary angioplasty
for acute myocardial infarction: every minute of delay counts. Circulation 2004 Mar 16;109(10):1223-1225. [doi:
10.1161/01.CIR.0000121424.76486.20] [Medline: 15007008]
30. Bishu KG, Lekoubou A, Kirkland E, Schumann SO, Schreiner A, Heincelman M, et al. Estimating the Economic Burden
of Acute Myocardial Infarction in the US: 12 Year National Data. Am J Med Sci 2020 May;359(5):257-265. [doi:
10.1016/j.amjms.2020.02.004] [Medline: 32265010]
31. Karystinos GN, Pados DA. On overfitting, generalization, and randomly expanded training sets. IEEE Trans Neural Netw
2000;11(5):1050-1057. [doi: 10.1109/72.870038] [Medline: 18249833]
32. Yip KY, Gerstein M. Training set expansion: an approach to improving the reconstruction of biological networks from
limited and uneven reliable interactions. Bioinformatics 2009 Jan 15;25(2):243-250 [FREE Full text] [doi:
10.1093/bioinformatics/btn602] [Medline: 19015141]
Abbreviations
AI: artificial intelligence
AUMC: Ajou University Medical Center
AUPRC: area under the precision-recall curve
AUROC: area under the receiver operating characteristic curve
CNN: convolutional neural network
ECG: electrocardiogram
GE: General Electric
NPV: negative predictive value
PPV: positive predictive value
PR: precision-recall
ROC: receiver operating characteristic
https://www.jmir.org/2021/9/e31129 J Med Internet Res 2021 | vol. 23 | iss. 9 | e31129 | p. 12
(page number not for citation purposes)
XSL• FO
RenderXJOURNAL OF MEDICAL INTERNET RESEARCH Han et al
Edited by G Eysenbach; submitted 23.06.21; peer-reviewed by HS Kim, Z Su; comments to author 15.07.21; revised version received
27.07.21; accepted 01.08.21; published 10.09.21
Please cite as:
Han C, Song Y, Lim HS, Tae Y, Jang JH, Lee BT, Lee Y, Bae W, Yoon D
Automated Detection of Acute Myocardial Infarction Using Asynchronous Electrocardiogram Signals—Preview of Implementing
Artificial Intelligence With Multichannel Electrocardiographs Obtained From Smartwatches: Retrospective Study
J Med Internet Res 2021;23(9):e31129
URL: https://www.jmir.org/2021/9/e31129
doi: 10.2196/31129
PMID:
©Changho Han, Youngjae Song, Hong-Seok Lim, Yunwon Tae, Jong-Hwan Jang, Byeong Tak Lee, Yeha Lee, Woong Bae,
Dukyong Yoon. Originally published in the Journal of Medical Internet Research (https://www.jmir.org), 10.09.2021. This is an
open-access article distributed under the terms of the Creative Commons Attribution License
(https://creativecommons.org/licenses/by/4.0/), which permits unrestricted use, distribution, and reproduction in any medium,
provided the original work, first published in the Journal of Medical Internet Research, is properly cited. The complete bibliographic
information, a link to the original publication on https://www.jmir.org/, as well as this copyright and license information must
be included.
https://www.jmir.org/2021/9/e31129 J Med Internet Res 2021 | vol. 23 | iss. 9 | e31129 | p. 13
(page number not for citation purposes)
XSL• FO
RenderXYou can also read