MODELING INCREASED ELECTRIC VEHICLE CHARGING DEMAND IN QUEBEC
←
→
Page content transcription
If your browser does not render page correctly, please read the page content below
MODELING INCREASED ELECTRIC VEHICLE
CHARGING DEMAND IN QUEBEC

Samuel Forget Lord (IQCarbone)
Jonathan Dowds (University of Vermont)
Mark Purdon (IQCarbone & ESG-UQAM)
Olivier Bahn (GERAD & HEC Montréal)
Lisa Aultman-Hall (University of Vermont)

                                            December 2019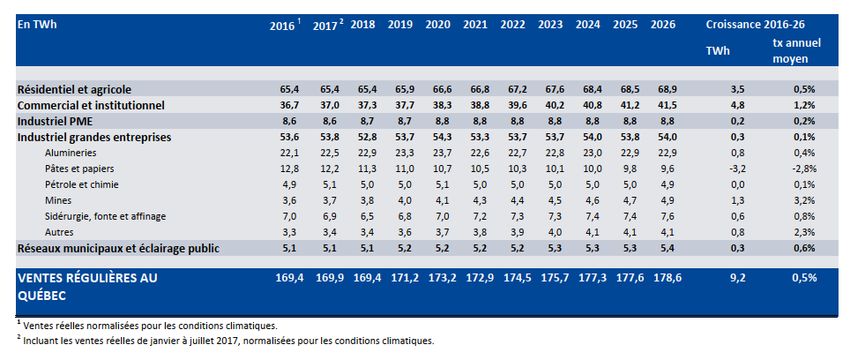
TABLE OF CONTENTS

SUMMARY .................................................................................................................................... 1
INTRODUCTION .......................................................................................................................... 2
THE MODEL.................................................................................................................................. 4
   Overview of the PEV-CDM........................................................................................................ 4
   Comparison of U.S. and Quebec Datasets .................................................................................. 7
   PEV-CDM’s strengths and limitations ....................................................................................... 8
MODELING RESULTS ................................................................................................................. 9
   Presentation of Quebec Results .................................................................................................. 9
   Interpretation of Results ............................................................................................................ 11
THE MODEL’S PLACE IN THE ECOSYTEM .......................................................................... 13
   Synergy with other models ....................................................................................................... 13
   How can the PEV-CDM model help at policy elaboration? ..................................................... 14
NEXT STEPS ............................................................................................................................... 16
CONCLUSION ............................................................................................................................. 18
ACKNOWLEDGEMENTS .......................................................................................................... 19
APPENDIX: Model Outputs - Demand by Hour ......................................................................... 20
REFERENCES ............................................................................................................................. 21

                                                                                                                                            ii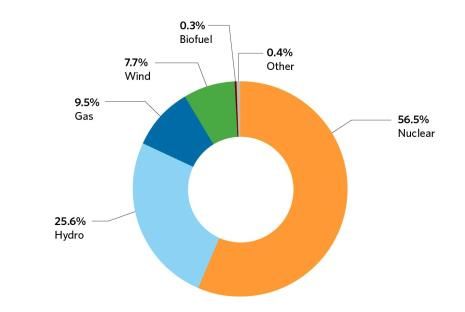
SUMMARY
The interactions between electric vehicle charging and renewable power generation are an
important consideration for any jurisdiction seeking to use increased electric vehicle penetration
as strategy to reduce greenhouse (GHG) emission in the transportation sector. This paper
describes a model for developing highly-resolved, time-of-day specific charging demand from
travel survey data that is consistent with real-world driving patterns and applied to Quebec. Since
vehicle charging timing is dependent on electric vehicle supply equipment (EVSE) availability,
three EVSE scenarios are considered: 1) home-only, 2) home and workplace only, 3) universal
EVSE. The modeling described here provides a valuable approach for understanding the
interactions between power grid operation and demand profiles while exploring a range of
assumptions about EVSE availability and charging behaviors. All EVSE scenarios result in
increased peak demand that could decrease electricity net export and then, contribute to an
increase of generation by non-renewable generating sources. This indicates that pricing or other
mechanisms that influence charging decisions could result in lower cost and lower emissions
outcomes. Results are discussed in light of the renewable energy resources available in Quebec
and emerging low-carbon transportation policies.

                                                                                                     1
INTRODUCTION
In order for Canada to achieve its commitments under the Paris Agreement and for Quebec to
realize its 2030 greenhouse gas (GHG) emission reduction target, it is increasingly recognized
that steep emissions reductions from transportation sector will be required. GHG emissions in the
transport sector have been constantly rising in Canada since 1990 and now represent over 28% of
Canada’s total emissions (ECCC, 2019). With fewer emissions from the power sector, the
transport sector’s share of total emissions in Quebec has risen to over 40% (MELCC, 2018).
Widespread vehicle electrification is a widely cited mitigation strategy for realizing emission
reductions of this magnitude (Creutzig et al., 2015). Furthermore, early research on the impacts
of vehicle electrification on electric grid management indicated the potential for significant
benefits (Parks et al., 2007). Vehicle-grid integration, including bidirectional vehicle-to-grid
interactions that effectively allow plug-in electric vehicles (PEVs) to function as storage device,
offer the potential for creating significant synergies between PEVs and renewable energy
generation (Lund and Kempton, 2008; Niesten and Alkemade, 2016). In this context, it is
important to understand the interactions between unmanaged vehicle charging and renewable
energy generation.
As vehicle electrification accelerates, the magnitude and timing of PEV charging will have
important implications for grid operations, including the integration of intermittent renewable
energy sources, and the cost of GHG emissions reductions. This paper describes an assessment
of the suitability of available travel survey data in Quebec for use with a plug-in electric vehicle
charging demand model (PEV-CDM) developed at the University of Vermont (UVM) and an
application of that model to the greater Montreal area (see Figure 1). The PEV-CDM was first
developed and applied using data from the National Household Travel Survey (NHTS) for the
northeast United States (Howerter, 2019; Howerter et al., 2020) and builds on an earlier charging
model described in Dowds et al. (2013). This paper represents a first effort to apply the model in
Canada, and could be extended to other Canadian provinces.
2Figure 1: 2013 OD survey Greater Montreal area
Source: AMT (2013: 12-13)
Quebec offers an interesting place to explore the impact of PEVs on charging demand. Given
that electricity production in Quebec comes mainly from hydroelectricity and that surplus
electricity is expected in coming years (Hydro-Québec, 2017), transport electrification is a
promising strategy for reducing emission in Quebec. In Quebec, the use of PEVs is also
incentivized through subsidies for the purchase of PEVs and electric vehicle supply equipment or
EVSE (TÉQ, 2019). A zero emission vehicle mandate has also been in place since 2016 that
requires auto manufacturers to hit PEV sales credit targets (Government of Quebec, 2018) while
the development of the charging infrastructure throughout the road network is finance by the
government. As part of its 2030 Sustainable Mobility Policy and Action Plan 2018-2030, Quebec
has the goal to have one million PEV on the road by 2030 (MTQ, 2018). The Sustainable
Mobility Policy also proposes a 20% reduction of solo car trips, a 40% reduction of petroleum
consumption in the transport sector and a 37.5% reduction below 1990 levels of GHG emissions
in the transport sector. These efforts are part of suite of climate policies in the transport sector
that includes the Quebec-California carbon market as well as the vehicle emission standards and
3the development of a clean fuel standard led by the federal government (Axsen et al., 2017;
Melton et al., 2017; Purdon et al., 2019; Scott, 2017).
For this project, a joint team from the University of Vermont (UVM) and Institut québécois du
carbone (IQCarbone), in collaboration with partners at the Ministry of Transportation of Quebec
(MTQ) and university partners assessed whether or not MTQ data could be used with the PEV-
CDM. These institutions are all partners of the Joint Clean Climate Transport Research
Partnership (JCCTRP), which seeks to cultivate research linkages between the policy and
modeling communities in Quebec, Vermont, Ontario and California. This process revealed that
the MTQ data was sufficient to run a slightly simplified version of the PEV-CDM. Efforts were
also made to apply the model in Ontario but it proved infeasible to acquire the necessary
transportation within the time allotted.
THE MODEL
Overview of the PEV-CDM
Many PEV charging studies have made simplifying assumptions about vehicle travel, e.g. that all
vehicles travel the same average mileage, and charging behavior, e.g. that all charging occurs at
in the evening or off-peak (Ahmadi et al., 2015; Calnan et al., 2013; Foley et al., 2013). Other
studies have constructed charging demand models using travel survey data in the context of grid
modeling but their demand modeling has been limited to plug-in hybrid electric vehicles (Dowds
et al., 2013; Vithayasrichareon et al., 2015). Some modeling efforts have simulated PEV
“charging profiles” under assumptions that all vehicles will charge upon arrival as long as a stop
has charging infrastructure and a 10-minute dwell time constraint is met (Vithayasrichareon et
al., 2015). In reality, PEV charging decisions vary among individuals and several studies indicate
that a driver’s desire to charge increases as the state of charge (SOC) decreases.
The PEV-CDM addresses this gap in the literature by producing hourly vehicle charging demand
that is consistent with real-world driving patterns. Vehicle-based analysis of light-duty vehicle
travel is used to inform minute-by-minute charging with electricity demand aggregated by the
hour. These results are first determined for daily vehicle travel and then estimated for weekly
vehicle charging. Final output for a single electric vehicle is a hourly, week-long vector of
4charging demand in kWh. All electric vehicle week vectors are then summed to arrive at total
additional electric vehicle electricity charging demand and replicate to create annual charging
demand patterns.
The PEV-CDM is built on two key assumptions. First, that travel patterns are dependent on the
spatial distribution of origins and destination which change relatively slowly and therefore that
near-future driving patterns will be broadly similar to the driving patterns occurring today.
Second, that drivers are unlikely to significantly alter their travel patterns in order to
accommodate technological differences between internal combustion engine vehicles (ICEVs)
and PEVs, meaning that the driving patterns of future PEV drivers can be approximated by
current ICEV travel patterns when that travel is compatible with PEV electric range. Given these
assumptions, travel survey data can be converted to time-specific charging demand. Scenario
analysis conducted with the PEV-CDM can capture how charging station availability (also
known as electric vehicle supply equipment or EVSE availability), vehicle characteristics, and
individual charging preference influences the timing of vehicle charging.
The PEV-CDM has been applied to model the impact of PEV charging demand in the northeast
US. The main dataset used is the National Household Travel Survey (NHTS) produced by the
US Department of Transportation. It documents every trip taken by each household member for
all responding households as well as what vehicle (if any) was used for each trip. The NHTS
includes daily, non-commercial travel by all modes, detailed characteristics, and expansion
weights.
The PEV-CDM uses household travel survey data as its main input and simulates hourly PEV
charging demand in four main steps:
1. First, vehicle travel profiles are created that link a trip log (recording the timing, mileage,
and purpose of all unique trips taken by the vehicle), a corresponding stop log (recording
the timing and duration for all periods on the travel day when the vehicle was stopped
and the purpose for the trip preceding that stop), and household and driver attributes (e.g.
gender, age, household income). Three derived variables, the longest trip length on the
travel day, the total traveled miles for the travel day, and the total number of trips taken
on the travel day are also calculated for each profile.
52. Second, the model calculates a PEV Compatibility Score for each vehicle profile. The
compatibility score determines the relative frequency with which particular vehicle
profiles are sampled by the PEV-CDM. Scores are calculated based on vehicle
characteristics and travel patterns as well as on household variables and
sociodemographic characteristics of the primary driver. Because of differences between
the demographic data available in the MTQ dataset and in the NHTS dataset (discussed in
more detail below), the Compatibility Score used in the Montreal application is a
simplified version of the Compatibility Score used in the original applications of the
PEV-CDM. The multipliers that contribute to the Compatibility Scores for the Montreal
application are shown in Table 1 below. After the compatibility scores are calculated for
each vehicle in the dataset, they are multiplied by the survey expansion weights to give
the final weights for sampling profiles for each PEV type.
Table 1: Compatibility Score Multipliers
Variable Multiplier Notes
Household Income Income/4 > PEV Price: 1 Current literature shows a weak relationship
between income and PEV adoption.
Income/4 < Price: 1-1000/diff
Household Vehicle 2 or more vehicles: 1 Current literature shows higher PEV adoption for
multi-vehicle households from Axsen et al., 2017
Count 1 vehicle: 0.8
Driver Age 1-0.0042*(age-16) Decreased likelihood of PEV ownership with age
from Carley et al. 2013 (16)
Longest Trip Trip length < PEV range: 1 Profile is considered incompatible with a PEV
type is the longest trip is greater than PEV range
Length Trip length > PEV range: 0
Total Daily Trip Total Miles < PEV range: 1 Profile computability is reduced if the total daily
mileage exceeds PEV range reflecting range
Miles Total miles > PEV range: 0.5
anxiety
Minimum Battery SOC > 0.1: 1 Profile compatibility is reduced if SOC falls below
SOC if charging at 10% (range anxiety) and incompatible if the SOC
SOC < 0.1: 0.7
every opportunity is falls to 0.
SOC < 0: 0
3. A random draw of seven daily profiles (with probabilities of selection in proportion to
their relative Compatibility Scores) are selected to create a full-week travel profile. In
applications of the PEV-CDM using NHTS data, five weekday and two weekend profiles
are used to create the weekly profile but only weekday travel is captured in the MTQ
data.
64. The PEV-CDM charging behavior logic is applied to the weekly travel profile to
determine the timing of charging given different EVSE availability scenarios. The
charging logic is depicted in the figure below. Vehicles will never charge at stops without
EVSE or when their battery is fully charged and will always charge at stops with EVSE if
they lack sufficient energy to complete their next trip. In other cases, the charging
decision is probabilistic. The charging process is repeated iteratively until the battery
state of charge at the start and end of the week are identical to avoid discontinuities and
then the weekly demand can be replicated to create a full year of charging demand.
Figure 2: Charging Demand Model Schematic
Comparison of U.S. and Quebec Datasets
The MTQ data used for this study is 2013 Montreal OD survey. Several difference in the MTQ
to the NHTS data are discussed below.
1. The MTQ data is only collected for weekdays (Monday-Friday) during Fall 2013 and
therefore does not capture weekend (Saturday-Sunday) or other seasons travel patterns. In
order to create annual outputs from the PEV-CDM, it was necessary to use weekday data
for weekend travel and to use the period of the survey for the whole year. Since trip
7timing and trip destinations vary between weekdays and weekends (e.g., Krumm, 2012),
this introduces an additional degree of error in the model inputs.
2. MTQ trip data is not associated with a vehicle identification and therefore driver
identification is used as a proxy. Hence, it is not possible to capture if a vehicle is used by
multiple drivers during the day. Furthermore, vehicle type information is not asked in the
Montreal OD survey, so it is not possible to distinguish between car and truck trips. In the
application of the PEV-CDM to the northeast United States, daily travel profiles for cars
and trucks were never intermingled when creating weekly profiles. For the Montreal
application of the PEV-CDM, all travel profiles were equally likely to be used for car and
truck travel. To the degree that travel patterns (timing, distance, destinations) are
correlated with vehicle type, this also introduces some degree of error to the model.
3. The distance of the trips that started or ended outside of the Greater Montreal could not
be calculated in the MTQ data. Hence, those trips have been removed from PEV-CDM
runs (about 1% of the overall trips). It should be noted that charging demand would be
higher if these trips were included.
4. Finally, the demographic information included in the MTQ data is not exactly the same
as in the NTHS data. MTQ age information is a five years interval, the household income
group are larger in MTQ data than NTHS and there is no information on educational
attainment. These issues required several simplifications to the calculation of vehicle
Compatibility Scores.
PEV-CDM’s strengths and limitations
The strength of the PEV-CDM is that it utilizes empirical driver behavior to produce detailed
for charging demand profiles that are consistent with the real-world travel behavior. Sensitivity
and scenario analysis conducted with the PEV-CDM can be used to explore the impacts of EVSE
availability and charging behavior preferences on hourly electricity demand. Since the timing of
electricity demand determines what generating resources are available to meet charging demand
and impacts the technical and economic challenges for operating the grid, the PEV-CDM is well
suited to use with dispatch models and other energy sector modeling tools. In this application,
8the model is also unique in being able to link trip tour-based travel behavior data with time
resolved electricity demand and regional dispatch capacity and, consequently, GHG emissions.
There are some limitations with the PEV-CDM. It does not predict the share of PEVs that will be
on the road, only user-defined scenarios of PEV penetration. It also assumes that drivers will not
alter their driving patterns. But there is evidence that the range of current PEVs disincentives
their use for long-distance transport. Another limitation is that the PEV-CDM model does not
include information in current EVSE in Quebec. This is important because Quebec has the
largest network of ZEV charging stations in the country. It might be important to include a
component to the PEV-CDM model that incorporates the existing charging station network in
Quebec, including the geographic distribution of charging stations, on PEV electricity demand.
A region with relatively more public EVSE would be presumably more likely to have charging
stop outside of home. Finally, the current iteration of the PEV-CDM assumes that vehicle
charging begins as soon as a vehicle arrives at a stop. The UVM research team is exploring PEV-
CDM implementation where charging demand is represented so that charge timing can be
optimized within a dispatch model subject to the constraints of the vehicles' actual travel
behavior.
Several additional refinements to PEV-CDM have been identified by Howerter et al. (2020).
These include sensitivity analysis surrounding the probability of charging at discretionary
charging opportunities. The current probabilities reflect relatively conservative charging
behavior that may result in drivers maintaining a higher SOC by charging more frequently than
is consistent with current observations. In addition, as the PEV market is rapidly changing, the
PEV performance characteristic modeled here could become dated and future modeling with
different range and efficiency characteristics should be considered. The potential use of chagrin
data survey could also help to improve model calibration.
MODELING RESULTS
Presentation of Quebec Results
Once IQCarbone completed a variety of data processing steps to format the MTQ data to be
consistent with the input requirements of the PEV-CDM, UVM conducted three small-scale
9applications of the PEV-CMD modeling different EVSE scenarios for the greater Montreal
region. These EVSE scenarios were:
1. Home Charging Only: In this scenario EVSE is available at all home locations but is
unavailable at all other stop types.
2. Home and Work Charging: In this scenario EVSE available at both home and work
locations but is unavailable at all other stop types.
3. Universal Charging: In this scenario EVSE available at all stop locations.
The PEV-CDM was run for 10,000 fully-electric PEVs for each scenario, which has been found
to produce stable results in previous research that can be scaled up to represent actual PEV
penetration at various levels as demanded by Quebec climate and transport policy. Reflecting the
distributions of PEV cars and PEV trucks in the study region, two thirds of the vehicles were
models as cars and one third as trucks. Cars were divided between low and high range vehicles.
Vehicle range and performance characteristics are shown in the Table 2.
Table 2: Fully-electric PEV Characteristics
Low Range High Range Low Range
PEV Car PEV Car PEV Truck
Electric Range (mi) 110 310 290
Drive efficiency (kWh/100 mi) 30 30 35
Fraction of modeled PEVs 0.33 0.33 0.33
To simulate total annual charging demand, a week have been simulated by stringing together
seven randomly selected days for the three scenarios. The week is then replicated 52 time to
create a full year. Aggregate charging demand is fairly comparable across the model runs but
highest in the universal EVSE scenario (Table 3). Universal EVSE availability leads to higher
overall charging demand since a greater number of higher mileage vehicle profiles are PEV
compatible with more EVSE.
10Table 3: Aggregate Annual Charging Demand by EVSE Scenario for 10,000 fully-
electrics PEVs for Greater Montreal area
EVSE Scenario Annual Charging Demand (MWh)
Home Charging Only 23,445
Home and Work Charging 23,338
Universal Charging 24,568
Figure 3 below shows the proportion of total fully-electric PEV charging that occurs in each hour
of the day for the “home charging only” and “universal charging” scenarios. As is evident in the
figure, the availability of charging at non-home locations shifts a significant portion of charging
demand from the evening and overnight hours to daytime hours which would promote greater
compatibility with solar photovoltaics and, depending on the baseline demand, contribute to a
more level load curve. For example, Hydro-Quebec has estimated that solar might contribute 1.3
TWh by 2029 (Hydro-Québec, 2019a: 6).
Figure 3: Proportion of total PEV charging
0.12
% of Daily PEV Charing Demand in Each Hour
0.1
0.08
0.06
0.04
0.02
0
7:00 PM
12:00 PM
1:00 PM
2:00 PM
3:00 PM
4:00 PM
5:00 PM
6:00 PM
8:00 PM
9:00 PM
10:00 PM
11:00 PM
1:00 AM
2:00 AM
3:00 AM
4:00 AM
5:00 AM
6:00 AM
7:00 AM
8:00 AM
9:00 AM
10:00 AM
11:00 AM
12:00 AM
Home Only Charging Universal Charging
Interpretation of Results
A first finding is that transport data available in Quebec might be used in the PEV-CDM model.
The PEV-CDM is designed to convert household travel survey data into time-of-day specific
electricity demand for vehicle charging. This project demonstrated a high-level of compatibility
11between travel data collected in Quebec and the PEV-CDM. While there are several differences
between the NTHS and MTQ data, these differences did not preclude using the MTQ data with
the PEV-CDM.
Second, consistent with the northeast U.S. application, the Quebec application of the PEV-CDM
model demonstrated that EVSE availability is an important determinant of the timing of vehicle
charging. Given the charging logic represented in the charging demand model, our results
indicate that when charging infrastructure was available at more stop locations, a larger portion
of charging demand was shifted into the morning hours relative to home-only charging scenarios.
This is important for balancing demand more evenly throughout the day rather than
concentrating charging in the evening hours.
Third, although Quebec is an important exporter of electricity over the year, it has some
electricity demand peak that reduce substantially net export of electricity. These peaks of
electricity demand happen between 6h00-9h00 and between 16h00-20h00 during cold winter
days (Hydro-Québec, 2019). All EVSE scenarios result in increasing these peak demands.
Considering that these decreases of net export are costly and contribute to electricity production
from non-renewable energy, electricity rate modulated on time of the day demand could
influence charging decision and result in lower cost as well as lower emission outcomes.
A final finding is that expected PEV charging demand appears quite feasible under a range of
low-carbon transport scenarios in Quebec if we extend greater Montreal result to the province
(greater Montreal represent more than half of the province population). In Table 4 we
specifically model fully-electric PEV penetration under the Quebec ZEV mandate for 2020 and
2025. These calculations were based on the fact that 30,850 fully-electric PEVs circulated in
Quebec in 2019 (AVEQ, 2019). Future PEVs that would be added to the Quebec passenger
vehicle fleet is based on a forecast of new car sales for 2020, estimated that 435,000 new
vehicles (Scotiabank, 2019: 4). The ZEV mandate requires at least 9.5% of total ZEV credits to
be earned by intermediate and large automakers by 2020 and 22% by 2025. The ZEV credits
work so a PEV with a ~400 km range qualifies for 3 ZEV credits. While different combinations
of fully-electric PEVs and partially-electric ZEVs are permitted under the Quebec ZEV mandate,
we simplify the calculations by using fully-electric PEVs.
12Based on these calculations, approximately 44,000 fully-electric PEVs are on the road in 2020
and 167,000 fully-electric PEVs by 2025. Using a simple multiplier based on the 10,000 ZEVs of
the original modeling run, we estimate total ZEV annual charging demand at between 103,158-
108,099 MWh in 2020 and 391,532-410,286 MWh in 2025 (Table 4). We note that are results
are comparable to other estimates of PEV electricity demand. Hydro-Quebec has estimated that
635,000 PEV would be on the road in 2029, which would lead to an increase of 2.3 TWh in
electricity demand (Hydro-Québec, 2019a: 6-7). If we take our 2025 estimate of electricity
demand for fully-electric PEVs and multiply to reach the number of PEVs estimated by Hydro-
Quebec for 2029, we arrive at 1.56 TWh. We note that our estimate is close to Hydro-Quebec
estimation of solar’s contribution of 1.3 TWh by 2029 (Hydro-Québec, 2019a: 6).
Table 4: Fully-electric PEV annual charging demand under various Quebec policy
scenarios
EVSE Scenario Units Original Model 2020 ZEV mandate 2025 ZEV Mandate
ZEV Fleet Units 10,000 44,000 167,000
Home Charging Only MWh 23,445 103,158 391,532
Home and Work Charging MWh 23,338 102,687 389,745
Universal Charging MWh 24,568 108,099 410,286
THE MODEL’S PLACE IN THE ECOSYTEM
Synergy with other models
The PEV-CDM is part of a model integrating transport and energy systems components
developed by researchers at the University of Vermont (Aultman-Hall et al., 2012; Dowds et al.,
2013; Farmer et al., 2010; Hilshey et al., 2012; Jackson and Aultman-Hall, 2010; Nam et al.,
2015). One of the main uses of the PEV-CDM charging demand to date has been to produce
input for an electric power dispatch modeling. The complete model integrates daily travel data-
based charging profiles with a linear optimization, generation expansion/dispatch model. The
model allows considerable detail for charging timing, which determines what generating
resources are available to meet. See Figure 4.
13Dispatch modeling enables the assessment of how vehicle electrification impacts the power
generation in terms of costs, emissions, and energy renewable utilization. In the northeast U.S.
generating capacity is divide among gas, nuclear, hydro and a growing set of renewable. The
integrated model is particularly innovative, given that energy system and transport models are
often conceptually distinct modeling efforts with, traditionally, little overlap between models and
modeling communities. The integrated energy-transport system model developed by researchers
at UVermont is one of the first of its kind. While the NHTS is the primary dataset for the PEV-
CDM, the generation expansion/dispatch model relies on dataset known as eGrids, which is
maintained by the EPA. It includes all power generating facilities in each state along with the
capacity, efficiency, and emissions attributes of those power plants.
FIGURE 4 : OVERVIEW OF UVERMONT INTEGRATED E NERGY-TRANSPORT SYSTEM MODEL
How can the PEV-CDM model help at policy elaboration?
The PEV-CDM model lends itself to various policy applications. Charging demand profile
created by the PEV-CDM can be used for a wide range of energy modeling applications to
address a variety of questions related to vehicle electrification. At the macroscale, the UVM
research team has used charging profiles from the PEV-CDM and its predecessor model to
explore renewable energy utilization for vehicle charging as well as the cost of decarbonization
14(Howerter et al., 2020; Howerter, 2019; Dowds et al., 2013) and to explore the impact of vehicle
charging on transformer aging at the microscale (Hilshey et al., 2012).
One pertinent example comes from application of the full, integrated energy-transport system
model in New England and New York (Howerter et al., 2020). Results provide evidence of the
importance of workplace charging: in the scenario with universally available charging
infrastructure, 39% of all non-home charging demand occurred at workplaces and work stops
had the highest percentage of non-home charging events. The “home-work” scenarios also had
the lowest overall levels of additional CO2 emissions and the lowest maximum hourly emissions
per PEV throughout the entire year. All EVSE scenarios result in increased peak demand and
increased generation by non-renewable generating sources. This indicates that pricing or other
mechanisms that influence charging decisions could result in lower cost, lower emissions
outcomes. It also suggests that the availability of EVSE and related charging infrastructure could
have an impact on grid management. Investment decisions pertaining to EVSE should consider
how its availability will affect the time at which electricity is consumed during the day and hence
the overall costs of electricity.
Given Quebec’s hydroelectric potential, application of the full integrated energy-transport
system model is arguably of less interest given low carbon content of hydropower relative to
other fuels (Gagnon and Chamberland, 1993; Tremblay et al., 2004; Weissenberger et al., 2010).
Currently, there is over 45,400 MW of installed hydro capacity in Quebec which generates
approximately 96% of the electricity in the province (Whitmore and Pineau, 2018: 18). Wind
power is the second largest source of electricity in the province with 3,882 MW of installed
capacity that generates 4% of electricity. In this context charging demand and dispatch modeling
would likely be more meaningful when conducted a regional level (e.g. Quebec and Ontario or
Quebec and the northeast U.S.) where a more diverse set of generators could be called upon to
serve charging demand.
A more interesting policy question for Quebec may be how PEV penetration might affect the
energy balance in Quebec, particularly electricity produced by Hydro-Quebec. Total domestic
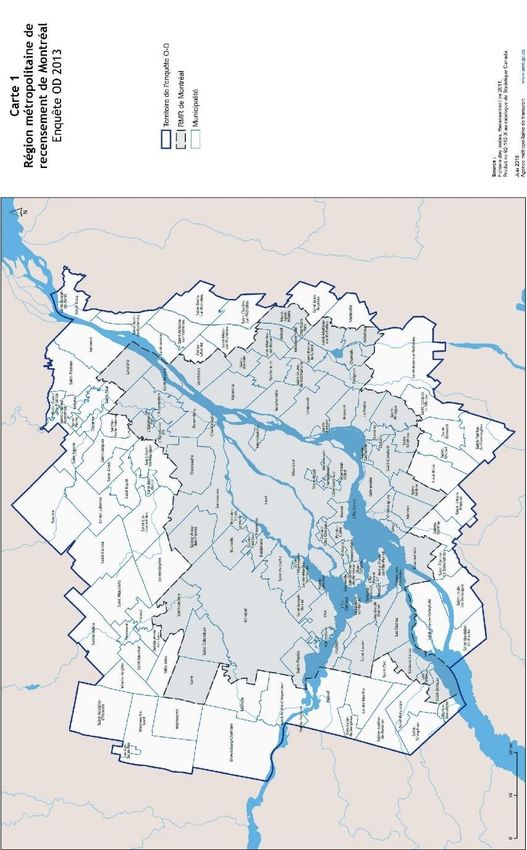
electricity sales in Quebec were forecast at 173 TWh in 2020 and 178 TWh in 2025 (Figure 5).
An additional 35-38 TWh might be expected to be exported on an annual basis between 2020
15and 2025. Of 206 TWh of electricity sold by Hydro-Québec in 2017, 34 TWh was exported to
Québec's outside markets while exports reached a record for the year 2018 at 36 TWh (Hydro-
Québec, 2018; 2019b). Recall that, based on calculations above, total annual charging demand
for a fully-electric PEV in Quebec of 167,000 vehicles in 2025 was estimated at 0.39-0.41 TWh.
This indicates that switching to fully-electric PEVs is unlikely in Quebec is expected to result in
only a modest increase in electricity demand that is unlikely to constitute a major diversion of
Hydro-Quebec’s international business.
Finally, the application of the PEV-CDM, developed for US transportation data, in the Canadian
context is important for cultivating research ties, policy understanding and international
cooperation between US and Canada. This is particularly important given continued integration
of US and Canadian auto-markets (Macdonald, 2019; Yates and Holmes, 2019) as well as
coordination of important climate and transport policy initiatives.
Figure 5: Forecasted electricity sales by sector in Quebec
Source: Hydro-Québec (2017: 6)
NEXT STEPS
The logical next step would be to expand the application of the PEV-CDM in other Canadian
provinces and incorporate the electricity generation and dispatch modeling component in order to
16apply the full integrated transport-energy system model there. As has been suggested earlier,
given the orientation of the JCCTRP, Ontario is the most appropriate province to consider next.
Full application of the UVM energy-transport model in Ontario appears quite feasible. While
appropriate Ontario travel data was identified with JCCTRP partners and preliminary evaluation
suggested that it would also be compatible with the PEV-CDM, confidentiality restrictions
prevented that acquisition of Ontario data within the timeframe of this project.
In Ontario, passenger transportation emissions (cars, trucks, bus, rail, domestic aviation)
accounted for roughly 66% of transportation-related emissions in 2014, growing 15% since
1990, due primarily to increased vehicle miles traveled (VMT) and an increase in fleet
composition of larger vehicles like SUVs, minivans and pick-up trucks (Government of Ontario,
2017). Freight emissions are also significant, making up roughly 30% of transport-related
emissions in 2014 (Government of Ontario, 2017).
However, the power generation sector is much more diversified in Ontario, which makes the
application of the generation expansion/dispatch model of considerable interest. In comparison to
Quebec, nuclear currently dominates Ontario’s power sector followed by hydroelectricity and
gas (Figure 6). The phase out of coal-fired electricity in 2014, which a decade earlier had
provided 25 per cent of the province’s electricity supplies, has significantly decarbonized the
electricity system. The province’s now relatively low-carbon electricity system, which
consistently produces surpluses overnight, has made the increased use of electric vehicles
attractive.
17Figure 6: Projected production by fuel type to meet Ontario’s energy demand, 2019-
2021
Source: IESO (2019)
CONCLUSION
In this paper we have applied the PEV-CDM developed by researchers at the University of
Vermont for application in the Canadian province of Quebec. Modeling outputs have been
consistent with other efforts to estimate the electricity demand of levels of fully electric PEVs in
Quebec consistent with the province’s climate and transport policies. Our estimate of PEV
electricity demand comparable to ZEV policy in Quebec is approximately 0.10-0.11 TWh in
2020, 0.39-0.41 TWh in 2025 and 1.56 TWh by 2029. This is well below current rates of
electricity exports of Hydro-Quebec, which stood at 36 TWh in 2018, and comparable to
estimated future solar capacity in Quebec. Results also indicate that the EVSE and related
charging infrastructure will likely have a significant impact on when PEVs are charged during
the day. This offers the opportunity to design charging infrastructure to balance with electricity
demand and grid management.
Next steps for this modeling effort in Quebec would include assessing the impact of PEV
charging demand as estimated by the PEV-CDM on electricity generating costs, wind utilization,
and GHG emissions for Greater Montreal. In addition, the modeling could be expanded in
18geographic from Greater Montreal to Quebec as a whole and potentially Ontario as well.
Refinement and validation of the charging logic with surveys of current PEV owners or other
data sources would also be valuable.
Also significant, our findings indicate that the PEV-CDM model might be more widely applied
across Canada to estimate PEV electricity demand. Application in Canadian provinces in
addition to Quebec would be arguably more interesting, given the ability to link the PEV model
outputs to an energy system component to estimate GHG emissions. PEV-CDM was developed
to use NHTS data which is available for all 50 U.S. States and Washington D.C. Hence, this
study could likely be extended to other jurisdictions. Household travel surveys similar to the
NHTS are conducted in many jurisdictions including Quebec and Ontario.
The PEV-CDM can function as a standalone tool and provide insight into issues such as the total
energy demand required for PEV charging, the impact of EVSE availability on the timing of
charging demand and overall indication of the alignment between charging demand and
intermittent renewable energy sources such as wind and solar. Its greatest research values
however, comes when linked to other energy sector models. To date, the demand profiles
produced by the PEV-CDM have been used as inputs to transformer aging and economic
dispatch models. Future improvements to the PEV-CDM that could incorporate price signals
from energy sector models into charging decisions would further enhance the utility of the
model. However, this integrated transport-energy model has been developed and deployed
successfully already by UVermont researchers in the northeastern US. Given that the authors of
the current paper have already identified necessary travel data in Ontario and that its electricity is
sourced from a broader array of sources than in Quebec, it makes an excellent candidate for
extending the integrated transport-energy model into another Canadian province.
ACKNOWLEDGEMENTS
The development of the PEV-CDM was supported by the USDOT through the National Center
for Sustainable Transportation at UC Davis and by the Joint Clean Climate Research Partnership
(JCCTRP). The JCCTRP is supported through a Partnership Development Grant from the
Canadian Social Sciences and Humanities Research Council (SSHRC). Marc-André Tessier at
MTQ has provide 2013 OD survey data for the Greater Montreal area.
19APPENDIX: Model Outputs - Demand by Hour
Demand Demand Share
Home Only Home & Work Universal Home Only Home & Work Universal
1:00 AM 2.588456556 2.842461968 1.112457724 1:00 AM 0.041364336 0.047247205 0.015914
2:00 AM 2.021559796 2.272276716 0.826054584 2:00 AM 0.032305151 0.037769626 0.011817
3:00 AM 1.575752826 1.748405266 0.591125567 3:00 AM 0.025181017 0.029061871 0.008456
4:00 AM 1.18212068 1.300484781 0.493925395 4:00 AM 0.018890654 0.021616568 0.007066
5:00 AM 0.883381879 0.984281213 0.419630411 5:00 AM 0.014116716 0.016360654 0.006003
6:00 AM 0.670429727 0.746990848 0.738735278 6:00 AM 0.010713674 0.01241643 0.010568
7:00 AM 0.486617579 0.561922408 2.111680847 7:00 AM 0.007776299 0.009340235 0.030208
8:00 AM 0.526971259 0.545623039 4.344696205 8:00 AM 0.008421164 0.009069308 0.062152
9:00 AM 0.592334601 0.67817386 6.945684654 9:00 AM 0.00946569 0.011272559 0.09936
10:00 AM 0.701839653 0.752165702 6.444753534 10:00 AM 0.011215615 0.012502446 0.092194
11:00 AM 0.873955245 0.898288229 5.291266534 11:00 AM 0.013966075 0.014931284 0.075693
12:00 PM 1.089047667 1.164870979 4.255754027 12:00 PM 0.017403318 0.019362404 0.06088
1:00 PM 1.501450704 1.642945423 3.485295481 1:00 PM 0.023993646 0.027308925 0.049858
2:00 PM 1.808922972 1.791746394 3.079974917 2:00 PM 0.028907148 0.029782284 0.04406
3:00 PM 2.06572457 2.177279064 2.646013845 3:00 PM 0.033010917 0.036190581 0.037852
4:00 PM 2.687386054 2.88175553 2.830497617 4:00 PM 0.04294526 0.04790034 0.040491
5:00 PM 3.919856845 3.835098241 3.394801924 5:00 PM 0.062640524 0.063746736 0.048564
6:00 PM 5.726709635 5.222803876 4.295769737 6:00 PM 0.09151459 0.086813083 0.061452
7:00 PM 6.965374515 6.054550076 4.617183486 7:00 PM 0.111308838 0.10063831 0.06605
8:00 PM 6.521538438 5.722696761 4.063107528 8:00 PM 0.1042162 0.095122268 0.058124
9:00 PM 5.607564909 4.954838392 2.961230721 9:00 PM 0.089610621 0.082358979 0.042361
10:00 PM 4.857289585 4.424010671 2.252590551 10:00 PM 0.077620989 0.073535598 0.032224
11:00 PM 4.307212244 3.800860642 1.571612714 11:00 PM 0.068830583 0.063177641 0.022482
12:00 AM 3.415514182 3.156953721 1.130107298 12:00 AM 0.054580973 0.052474665 0.016167
Total 62.57701212 60.1614838 69.90395058 Total 1 1 1
20REFERENCES
Ahmadi L, Elkamel A, Abdul-Wahab S, Pan M, Croiset E, Douglas P and Entchev E (2015) Multi-
period optimization model for electricity generation planning considering plug-in hybrid
electric vehicle penetration. Energies 8:3978-4002.
AMT (2013) Enquête Origine-Destination 2013: La mobilité des personnes dans la région de
Montréal, Agence métropolitaine de transport (AMT), Montréal.
Aultman-Hall L, Sears J, Dowds J and Hines P (2012) Travel Demand and Charging Capacity for
Electric Vehicles in Rural States: Vermont Case Study. Transportation Research Record
2287:27-36.
AVEQ (2019) Statistiques SAAQ-AVÉQ sur l'électromobilité au Québec en date du 30 septembre
2019, Association des Véhicules Électriques du Québec. Website (accessed 2 December
2019): https://www.aveq.ca/actualiteacutes/statistiques-saaq-aveq-sur-lelectromobilite-
au-quebec-en-date-du-30-septembre-2019-infographie, Montreal.
Axsen J, Goldberg S and Wolinetz M (2017) Accelerating the Transition to Electric Mobility in
Canada, The Case for a National ZEV Mandate, Équiterre, Montreal.
Calnan P, Deane J and Gallachóir BÓ (2013) Modelling the impact of EVs on electricity
generation, costs and CO2 emissions: assessing the impact of different charging regimes
and future generation profiles for Ireland in 2025. Energy Policy 61:230-237.
Creutzig F, Jochem P, Edelenbosch OY, Mattauch L, van Vuuren DP, McCollum D and Minx J
(2015) Transport: A roadblock to climate change mitigation? Science 350:911-912.
Dowds J, Hines PDH and Blumsack S (2013) Estimating the impact of fuel-switching between
liquid fuels and electricity under electricity-sector carbon-pricing schemes. Socio-
Economic Planning Sciences 47:76-88.
ECCC (2019) National Inventory Report 1990-2019 - Greenhouse Gas Sources and Sinks in
Canada, Environment and Climate Change Canada, Ottawa.
Farmer C, Hines P, Dowds J and Blumsack S (2010) Modeling the impact of increasing PHEV
loads on the distribution infrastructure, in 2010 43rd Hawaii International Conference on
System Sciences pp 1-10, IEEE.
Foley A, Tyther B, Calnan P and Gallachóir BÓ (2013) Impacts of electric vehicle charging under
electricity market operations. Applied Energy 101:93-102.
Gagnon L and Chamberland A (1993) Emissions from hydroelectric reservoirs and comparison of
hydroelectricity, natural gas and oil. Ambio 22:568-569.
Government of Ontario (2017) Climate Change, Government of Ontario. Website (accessed 2
August 2018): https://www.ontario.ca/page/climate-change, Toronto.
Government of Quebec (2018) A Snapshot of the Zero Emission Vehicle (ZEV) Standard,
Government of Quebec, Quebec. Website (accessed 10 September 2018):
http://www.mddelcc.gouv.qc.ca/changementsclimatiques/vze/feuillet-vze-reglement-
en.pdf.
Hilshey AD, Hines PD, Rezaei P and Dowds JR (2012) Estimating the impact of electric vehicle
smart charging on distribution transformer aging. IEEE Transactions on Smart Grid 4:905-
913.
Howerter SE (2019) Modeling Electric Vehicle Energy Demand and Regional Electricity
Generation Dispatch for New England and New York, University of Vermont, Burlington.
21Howerter SE, Dowds J, Hines P and Aultman-Hall L (2020) Modeling Electric Vehicle Energy
Demand and Regional Electricity Generation Dispatch for New England and New York
99th Annual Meeting of the Transportation Research Board, Washington D.C.
Hydro-Québec (2017) État d’avancement 2017 du Plan d’approvisionnement 2017-2026, Hydro-
Québec, Montréal.
Hydro-Québec (2018) Rapport Annuel 2017, Hydro-Québec, Montreal.
Hydro-Québec (2019a) Portrait des ressources énergétiques d’Hydro-Québec, Hydro-Québec,
Montreal.
Hydro-Québec (2019b) Rapport Annuel 2018, Hydro-Québec, Montreal.
IESO (2019) Reliability Outlook: An adequacy assessment of Ontario’s electricity system from
October 2019 to March 2021, Independent Electricity System Operator (IESO) Toronto.
Jackson E and Aultman-Hall L (2010) Analysis of real-world lead vehicle operation for modal
emissions and traffic simulation models. Transportation Research Record 2158:44-53.
Krumm J (2012) How People Use Their Vehicles: Statistics from the 2009 National Household
Travel Survey. , SAE International.
Lund H and Kempton W (2008) Integration of renewable energy into the transport and electricity
sectors through V2G. Energy policy 36:3578-3587.
Macdonald L (2019) Upsetting the Apple Cart? Implications of the NAFTA Re-Negotiations for
Canada–US Relations, in Canada–US Relations pp 193-213, Springer.
MELCC (2018) Inventaire québécois des émissions de gaz a effet de serre en 2016 et leur évolution
depuis 1990, Ministère de l’Environnement et de la Lutte contre les changements
climatiques, Québec.
Melton N, Axsen J, Goldberg S, Moawad B and Wolinetz M (2017) Canada's ZEV Policy
Handbook, Metcalf Foundation.
MTQ (2018) Politique de mobilité durable – 2030 : Transporter le Québec vers la modernité,
Québec, Ministère des Transports, de la Mobilité durable et de l’Électrification des
transports (MTQ).
Nam R, Dowds J, Lee BH, Aultman-Hall L and Johnson A (2015) Modeling travel choices to
assess potential greenhouse gas emissions reductions, University of Vermont.
Transportation Research Center.
Niesten E and Alkemade F (2016) How is value created and captured in smart grids? A review of
the literature and an analysis of pilot projects. Renewable and Sustainable Energy Reviews
53:629-638.
Parks K, Denholm P and Markel T (2007) Costs and Emissions Associated with Plug-In Hybrid
Electric Vehicle Charging in Teh Xcel Energy Colorado Service Territory, National
Renewable Energy Laboratory, Golden, CO.
Purdon M, Giuliano G, Witcover J, Murphy C, Ziaja S, Kaiser C, Winfield M, Séguin C, Papy J,
Kim S-O, Coderre L-C, Goulet M and Fulton L (2019) Climate and Transportation Policy
Sequencing in California and Quebec, Joint Clean Climate Transport Research Partnership
(JCCTRP), Montreal.
Scotiabank (2019) Global Economics, Global Auto Report (November 29, 2019), Scotiabank,
Toronto.
Scott W (2017) Low Carbon Fuel Standards in Canada. Smart Prosperity Institute Policy Brief
February 2017:1-12.
TÉQ (2019) Roulez vert - Cadre normatif, Transition énergétique Québec (TÉQ), Québec.
22Tremblay A, Lambert M and Gagnon L (2004) Do hydroelectric reservoirs emit greenhouse gases?
Environmental Management 33:S509-S517.
Vithayasrichareon P, Mills G and MacGill IF (2015) Impact of electric vehicles and solar PV on
future generation portfolio investment. IEEE Transactions on Sustainable Energy 6:899-
908.
Weissenberger S, Lucotte M, Houel S, Soumis N, Duchemin É and Canuel R (2010) Modeling the
carbon dynamics of the La Grande hydroelectric complex in northern Quebec. Ecological
Modelling 221:610-620.
Whitmore J and Pineau P-O (2018) État de l’énergie au Québec 2019, Chaire de gestion du secteur
de l’énergie, HEC Montréal, Montréal.
Yates C and Holmes J (2019) The Future of the Canadian Auto Industry, Canadian Centre for
Policy Alternatives.
23You can also read