Exploring the Properties and Growth of Student Interaction Networks on Twitter: Insights on STEM Learning and Engagement
←
→
Page content transcription
If your browser does not render page correctly, please read the page content below
Paper ID #32624

Exploring the Properties and Growth of Student Interaction Networks on
Twitter: Insights on STEM Learning and Engagement
Md Nizamul Hoque Mojumder, Florida International University
Dr. Arif Mohaimin Sadri, Florida International University
     Dr. Arif Mohaimin Sadri is an Assistant Professor in the Moss Department of Construction Management
     (MDCM) of the Moss School of Construction, Infrastructure and Sustainability (MSCIS) at the Florida
     International University (FIU). Previously he was a Visiting Assistant Professor in the Department of Civil
     and Environmental Engineering at the Rose-Hulman Institute of Technology and an Adjunct Professor in
     the Civil Engineering Dept. at the Valparaiso University. Dr. Sadri received his doctoral training from
     the Lyles School of Civil Engineering at Purdue University with a solid background in Civil Engineering
     (Transportation), Network Science, and Social Science. Dr. Sadri specializes in resilience engineering,
     evacuation modeling, shared mobility, social influence modeling, machine learning, agent-based model-
     ing, and network modeling. Dr. Sadri’s research focuses on the critical interdependence between social
     and infrastructure networks and integrates human proactive decision-making components into the civil in-
     frastructure management challenges. Dr. Sadri develops human-centered and network-driven techniques
     that complement to the science of infrastructure resilience and sustainability.

                               c American Society for Engineering Education, 2021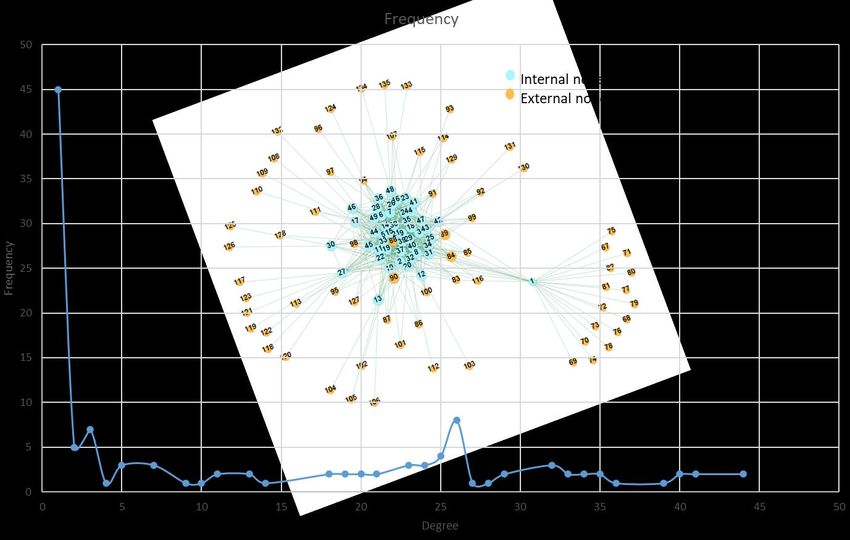
Exploring the Properties and Growth of Student Interaction Networks on Twitter:
                  Insights on STEM Learning and Engagement
1. INTRODUCTION AND MOTIVATION

Network science is becoming emergent to quantify different aspects of various physical and
social networks. By implementing experiments on large-scale, real networks, many new network
concepts, properties, and measures have been developed. Such experiments have identified
several statistical properties and unifying principles of the real networks. Significant research
efforts have helped develop new network modeling tools, replicate the structural properties
observed from empirical network data and build these networks effectively to acquire more
advanced knowledge of evolutionary network growth mechanisms [1]. Most of the real networks
have interesting properties[2], unlike random graphs that show possible mechanisms that direct
network building and ways to manipulate network structure with specific goals [3].

Social network analysis (SNA) is used to explore an individuals’ social ties, network density, and
strength [2]. The study of the Social Network (SNA) helps to analyze relevant data which are
interconnected in nature. SNA can be effective to analyze students’ community interactions to
measure student relations. SNA allows students to examine how they participate in an informal
atmosphere by equal participation [4]. Bruun et al. explored how self-reported student
interactions can be viewed as meaning-making processes and use this to understand how
quantitative measures that describe the position in a network, called centrality measures, can be
understood in terms of the interactions that occur in the context of a university physics course
[5]. Applying social network analysis (SNA) to measure student experiences, Dou et al. found a
correlation between the role of the students in their social network classroom and enhanced
production of self-efficacy [6].

Social media has been an immense influencer for making decisions nowadays [7], [8]. People are
not only being connected but also making their career progress through it and the networks of
relevant people are powerful [9]. Recent studies show that social media plays a vital role in
effective information dissemination even in extreme situations for a particular group of people
[10]. The degree of influence of a particular student group and other people connected with these
student’s activities were monitored and found a positive impact of connectivity of the group
themselves and with the practicing professionals too. The engagement of STEM learning
students can greatly increase the number of STEM enrollment. The development of society and
progression greatly depends on STEM knowledge and empowerment. One of the greatest
challenges of the University has been keeping the attraction of students in a particular course and
their persistence [11].

This research is focused on the importance of social impact while considering STEM learning.
Students are encouraged to engage in social media activities related to the topics covered in
particular STEM courses and interact with students in class as well as out-of-class peers (senior
students, alumni, practitioners, subject matter experts among others) [12]. Along these lines of
research, studies have shown that similar activities led to an increment in the number of physics
majors by a factor of 400% [13], [14], which is indicative of the inefficacy of classroom-based
methods to address such increments. The advancement of society greatly depends on the number

                                                1
of experts in science, technology, and math (STEM). But surprisingly in four years of college,
more than thirty percent of students failed to graduate with a STEM degree [15]. To observe and
measure the social interactions of a fully online class of BCN2210- Construction Materials and
Methods at the Florida International University in Spring 2020, a task was given to post any
information of their choice relating to the construction and also comment on at least two other
student's posts. This also gauged interests of social media participants with similar backgrounds
like alumni, faculty, senior students, etc. who observed such activities and reacted to these posts.

The goal of this study is to explore student’s social media communication patterns on Twitter
involving both in-class interactions as well as the ones from out-of-class social media followers.
Twitter was used in particular since it is a public social media platform and people with similar
interests can connect, interact and engage. The dynamics and growth of student social media
interaction networks were explained using network science theories and principles. Specific
research questions of this study include:
    • How to systematically integrate social media activities in a STEM course?
    • How students’ social media interactions in a STEM class grow over time?
    • How to quantify social media interactions using key network metrics such as degree,
        density, centrality, clustering among others?
    • Are there unifying characteristics of social interaction networks of STEM students?
    • How are student’s networks influenced by their followers from both in-class and out-of-
        class members?

To answer these questions, student’s Twitter data regarding their online participation as well as
information about their followers (publicly available) were collected using Twitter streaming
Application Programming Interface (API)[16]–[18]. Such data have been used to conduct
network visualization and analysis to obtain meaningful insights regarding student interactions.

In Figure 1, a hypothetical network figure is created to introduce the network concepts and
metrics such as degree (number of followers), density, centrality, among others. There are nine
nodes drawn in a green circle and the nodes are connected by straight lines. Node 9 is the most
central in the figure and it is connected with 4 other nodes. As it is connected with four nodes,
we say node 9 has a degree of four. Then, nodes 1, 3, 5, and 7 are each connected with two other
nodes, as such, each of these nodes has a degree of two. Similarly, nodes 2, 4, 6, and 8 have a
degree of three. Again, node 9 having more connectivity than other nodes it has a more closeness
centrality value of 0.381.

                                                 2
Closeness Centrality

                                              Edge betweenness
                                              Centrality

Figure 1: Simple network

Figure 2: Social network of student's

                                        3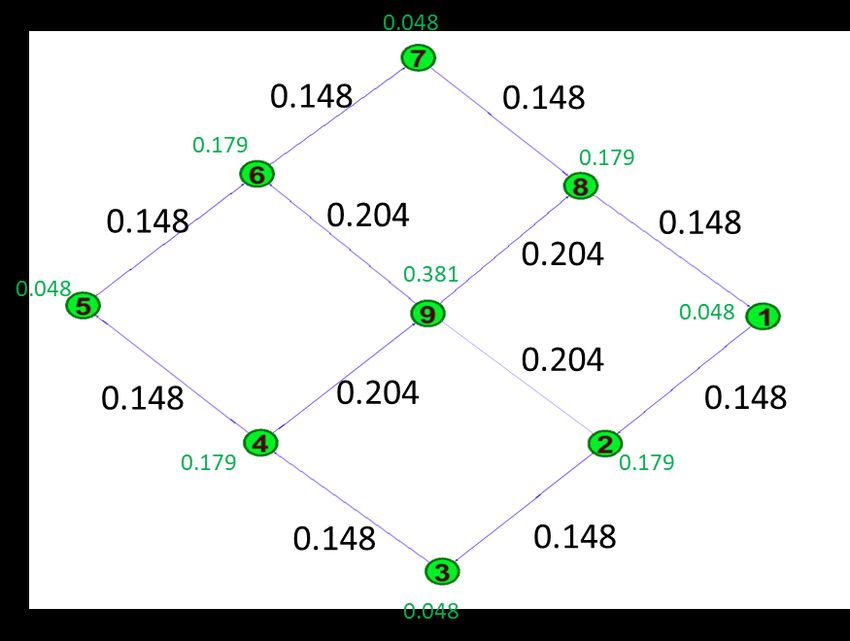
Through online social media (Twitter or Facebook), in-class students can be connected with
other students as well as some other external people such as alumni, faculty members,
supervisors (Figure 2). All the influential students are situated in a central position of the circle
or class and connected with most of the other students of the class. That’s how social media
could provide a great opportunity to expose to a larger learning and engagement network
environment by establishing new connections with both internal and external members of a
STEM course.

2. BACKGROUND AND RELATED WORK

Existing literature explored the influence of social media on the different communities in various
scenarios. Malik et al. (2018) explored social media (Twitter) based activism campaigns to
examine engineering diversity factors, whereas conventional methods to increase diversity
within the engineering domain failed to achieve desired results. Authors claimed that information
from social media can also be used for better understanding and developing the diversity of
engineering. They presented findings from #ILookLikeAnEngineer campaign using Twitter data,
which aimed at increasing gender diversity in the engineering work as a case study to illustrate
the viability of the approach. The campaign provided continuous momentum to the complete
effort to increase diversity and new ways to connect with the relevant audience. The analysis
displayed that STEM-related diversity programs may draw attention from different communities,
including individuals, large organizations, media channels, and community interest groups [19].

Trustworthy user identification on social media for emergency management organizations is
performed by Pandey et al. (2018) using artificial intelligence and machine learning. Twitter data
is also used here for a fine-grained understanding of credible sources to develop trusted user-
specific (organizations, individuals both affiliated and non-affiliated with organizations)
networks during three types of humanitarian or disaster events. Using a diverse set of social,
event, and concise representation features derived from user profile metadata, the authors
proposed a reliable user classification method. The detailed experiments showed a contrasting
user identity participation behavior in their ways of communication; for example, the use by an
organization and organization-affiliated users of lower authoritative information sharing. This
study provides recommendations for the development of reliable content analysis systems for
humanitarian organizations and disaster response agencies in real-time [20].

Intersectional self-expressions in Twitter are examined by Johri et al. (2018) during a hashtag
activism campaign for engineering diversity. Authors analyzed the self-expressions of
participants on a project to increase engineering diversity (# ILookLikeanEngineer) and found
that, consistent with the viewpoint of intersectionality, in addition to their identification as an
engineer, participants opted to extend and clarify their engineering identity; express their
association with an organization or company and also the individual aspects of their personality
(family or hobbies). Besides, conveying support for someone they met who was an engineer;
articulating solidarity with other diversity-related social causes; and expressing excitement for or
humorously referencing the movement are also found as significant. This research illustrates the
inherent difficulty of identifying people as they self-express [19].

                                                   4
Le et al. (2019) developed a framework to use social media data for workplace learning by
analyzing cybersecurity-related tweets. The research provided a structure that describes how data
can be developed by using descriptive, material, and network analysis to explore how
professionals learn. Findings depicted that most of the tweets covered multiple subjects and used
three or more hashtags; the popular users were not automatically the most powerful (based on
retweets); companies and other organizations had the highest number of followers, but the most
retweeted were the individual users who were the experts in their field. Besides, infographics
were the main content of popular tweets, and the overall sentiment of cybersecurity-related
tweets was found negative as many hashtags tweet represented current threats [21].
A thorough small-scale review of the research study was presented by Toole (2019) on
networked learning teacher communities for Continuous Professional Development (CPD) by
using a Virtual Learning Environment (VLE). Findings of this study indicate that while
networked learning environments have positive CPD impacts including improved social learning
mechanisms, increased use of formal and informal training, learning across time and space
barriers, and increased levels of engagement, challenges remain that may impede continued
professional development. This suggests that it is possible to test a networked learning
community at a chosen HEI with a subgroup of VLE teachers and that further qualitative and
quantitative research could be carried out [22].
“National Engineering Week” was monitored by Malik et al. (2018) using Twitter data to
understand the engineering community engagement. The authors used three quantitative
methods to study the effect of the outreach: qualitative analysis, content analysis, and analysis of
the network. It was noticed that engineering firms and individual users dominated the
involvement of the Twitter campaign, accompanied by small participation by educational
institutions, professional engineering associations, and non-profits. Besides, not a single news
media outlet had been listed as a participating client suggesting the campaign's lower media-
driven public reach. The tweets could be classified as event promotion from a content
perspective, highlighting engineering company employees, or encouraging and inspiring the
public (especially women and children) to be an engineer [23].
Johri et al. (2018) also examined how different users and activities initiate connectivity over
Twitter. Authors explored here how a campaign (#ILookLikeAnEngineer) of social media
activism aimed at enhancing the diversity of gender within technology gained momentum in its
early period. The results showed that varied engagement–of user types–increased activity at
crucial moments. These causes are classified into four types: a) Event-based: the arrangement of
the project with the issue-related offline incidents (SFO diversity, disruption, etc.); b) Media
based: news coverage of media events (CNN, BBC, etc.); c) Industry based: the web
involvement of large organizations (Microsoft, Tesla, Google, Cisco, etc.) in the campaign; and
d) Personality based: association of events with famous and/or established personalities [24].
For analyzing diverse complex systems from natural, social, and technological domains use of
networks can be helpful [25] and even in the safety of traffic engineering by detecting traffic
accidents rapidly [26]. A small world property is also found in the transportation network [27],
[28] and analysis of such network can help to attract people to public transit [29]. Apart from
that, the online social network interaction can be analyzed to better design and implement
5guidelines during crisis moments [30]–[33]. It is challenging to devise an effective qualitative
method for the comparison of networks as the data grows remarkably [34]. Concept inventory is
used to assess students’ conceptual understanding in the specific domain with the help of
multiple-choice questions [35], [36]. Using an informal environment for educational
experimentation may help integrating STEM formal learning environments [12]. Again, peer
influence can greatly enhance STEM learning which can be achieved through social media [37].
From the above literature, it can be summarized that researchers explored the potential of social
media data (Twitter) to solve a variety of problems. Among these, very few studies investigated
how social media can benefit the STEM learning environment and engagement. Moreover, the
empirical literature is inconclusive on how to systematically integrate social media in a STEM
course and observe students’ social media interactions and peer influence on learning, which is
the key contribution of this study.
3. METHODOLOGY AND DATA COLLECTION
Social networks have interesting properties, unlike random graphs that suggest possible
mechanisms to direct network creation and ways to manipulate network structure with specific
goals. To achieve the goal and objectives of the study and to explore the properties of student
interaction networks both in-class and outside members, key network metrics used in this study
are explained below. These definitions and explanations can support the interpretation of the
findings presented in the result analysis section.
Degree- A node degree is the number of direct links in a graph to other nodes [17]. The degree
distribution in real networks (probability of a randomly selected node has a degree of n, where n
is a positive integer) is significantly different from the Poisson distribution, usually assumed in
random graph modeling.
Density- The density is the ratio of edges to nodes [38], for undirected graphs is d = 2m/n(n-1)
and for directed graphs is d = m/n(n-1). where (n) is the number of nodes and (m) is the number
of edges in the network graph.
Betweenness Centrality- The betweenness centrality of a node is the sum of the fraction of all-
pairs shortest paths that pass through it [39], [40]. It computes the shortest-path betweenness
centrality for nodes.
Closeness Centrality- Closeness centrality of a node is the reciprocal of the average shortest path
distance to overall reachable nodes. It means the distance of two points of a graph is the shortest-
path distance between these and n number of nodes that can reach each point [41].
Clustering Coefficient- For unweighted graphs, the clustering coefficient is a measure of the
degree to which nodes in a graph tend to cluster together, which is the ability of a given node to
cluster with other nodes [42].
6Then, Twitter data was collected using Twitter streaming API in python codes. Using the Twitter
ID provided by the students' historical tweets were extracted [7], [31], [43], [44]. The collected
specific tweets were filtered from 5th January 2019 to 11th April 2019. Each of the user IDs was
assigned a unique label to keep the identity secured. Out of sixty-five in-class students, forty-
nine students were found active on Twitter with tweets and re-tweets. Then, the followers' list of
these forty-nine students was collected separately using the student’s username on Twitter. Here,
four students had more than 90 plus followers and 24 students with no followers. The rest of the
students was found with a smaller number of followers on Twitter. For all the forty-nine
students, 69 external mentions were found [2], [18].
4. DISCUSSION OF FINDINGS
From the collected Twitter data, the student’s user mentions’ networks of BCN2210 course from
the Spring 2020 semester are created for different network measures; such as degree, density,
clustering coefficient, and closeness centrality (Table 2).
Node 46
Node 1
Figure 3: Student's connectivity with internal and external nodes during Spring 2020
7Table 1: Network-level properties
Events Counts
Number of total tweets 1,325
Tweets without mentions 254
Number of nodes 118
Number of edges 1,070
Number of directed edges 831
Number of unique edges 770
Clustering coefficient 0.176
Average degree 13.05
In Figure 3, the network is having 118 nodes out of which 49 nodes are from the BCN2210
course. The whole network is plotted in Figure 3 where node level 1 to 49 is assigned to student
id (pseudo labels as previously explained) and the rest of the labels are assigned for other nodes.
The internal nodes are mostly connected with each other and very few nodes have more external
node connection than the internal node connection. For example, node 1 has a good amount of
external node connectivity along with internal nodes. On the other hand, node 46 has very
limited external connectivity. The network has 1,070 edges which included repeated user
mentions and 770 unique edges (i.e. without repetitions) which are developed over the Spring
2020 semester.
Number of Edges over Time
1200
1000
Number of Edges
800
600
400
200 Number of Edges Number of Directed Edges Number of Unique Edges
0
1/7 1/14 1/21 1/28 2/4 2/11 2/18 2/25 3/3 3/10 3/17 3/24 3/31 4/7 4/14
Date (m/day),2020
Figure 4: Number of Edges over Time.
8Number of Nodes over Time
140
120
Number of Nodes
100
80
60 Number of Nodes
40
20
0
1/7 1/14 1/21 1/28 2/4 2/11 2/18 2/25 3/3 3/10 3/17 3/24 3/31 4/7 4/14
Date (m/day), 2020
Figure 5: Number of Nodes over Time.
Average Degree over time
20
18
16
Average Degree
14
12
10
8 Average Degree
6 Average Degree for Unique Edges
4
2
0
1/7 1/14 1/21 1/28 2/4 2/11 2/18 2/25 3/3 3/10 3/17 3/24 3/31 4/7 4/14
Date (m/day), 2020
Figure 6: Average Degree over Time.
From the graphical representation in Figure 4,5 and 6 followings are the key insights:
• The number of edges represents the users' mentions (students who are trying to attract
based on their interests) which includes repeating user mentions (shown in Figure 4). For
example, students notify others by mentioning them through social media on a given
STEM topic or ideas they are posting. This allows students to interact and identify other
online peers having similar interests.
• The number of unique edges represents the unique user mention where repeating
mentions were discarded (shown in Figure 4). Students connecting with new participants
create unique edges and grow their network with more participants. The difference
between the number of unique edges and the number of total edges (with repeating
9mentions) is insignificant which indicates that students are more likely to find newer
connections (i.e. user mentions) compared to the connections they already established.
• The network growth was prominent for the first few weeks and the network hardly
increased for the next few weeks. It was found that the class had no deliverables from
February 2nd to March 8th, 2020 which resulted in less activity in the network. It shows
that the timing of social media deliverables strongly influences network growth.
The average degree indicates how many other students for a given student are connected
or influenced on average. Within the first 25 days, the average degree of the students’
network increased from 2.29 to 12.92. Although the number of participants increased
over time, the average degree of the students’ network drops down after a certain point
for having fewer active participants. After a few weeks of no deliverables when the
deliverables were assigned again the average connectivity of the students increased again.
This means the quiet participants' activity has increased with new deliverables.
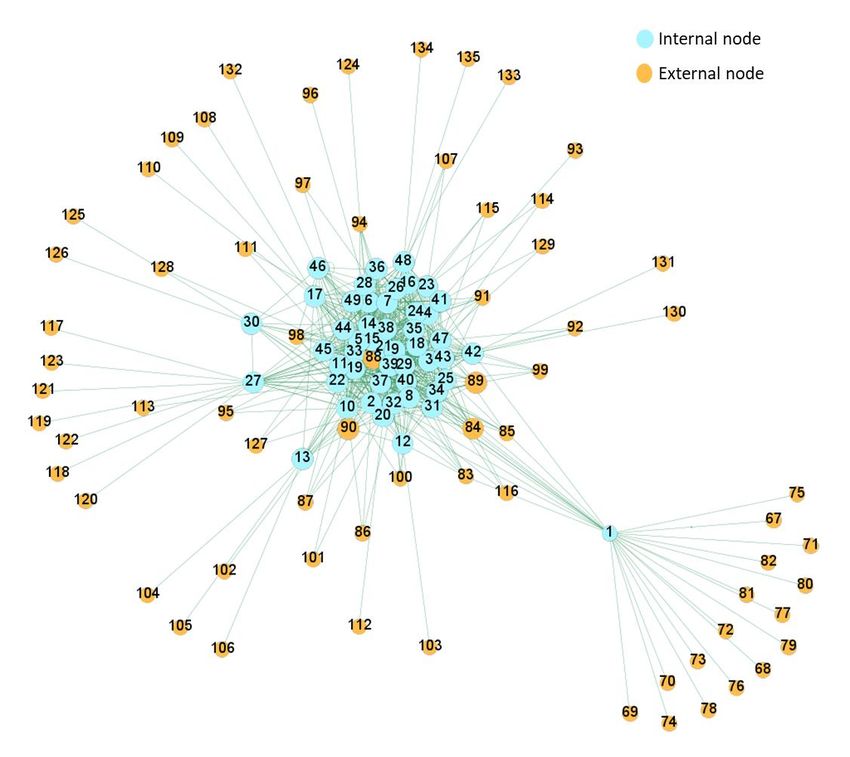
Figure 7: Degree of all nodes (internal and external)
10Figure 8: Degree of internal nodes
From the graphical representation in Figures 7-9, below are the key insights:
• The network degree distributions of the nodes follow the power law [45] (shown in
Figure 7). Which means most of the node having a very low degree, whereas only a few
nodes having a very large degree.
• The degree distribution of the students (internal nodes) does not follow the power law.
The students’ connectivity was found to be 13 to 44 with other participants (shown in
Figure 8). Most of the students have a degree of 26. From Table 3, statistical properties of
students (internal nodes), we can see the median, mode and average degree are close to
26.
• While closeness centrality indicates the reachability of a given node from all other nodes
in that network, the average closeness centrality of the student networks seemed to have
increased initially, reaching the peak of 0.45 in the middle of the semester. This is
indicative of students who took part in social media activities held an equivalent central
position in the network. However, it dropped later in the semester since, as more new
students participated in social media posting, they did not mention as many other nodes
as was expected.
• In contrast, betweenness centrality indicates how many times a given node falls under the
shortest path of any two other nodes in the network. Figure 9 indicates that such
centralities in the student interaction network drop-down fast at the beginning of the
semester and continues to be close to zero throughout the semester.
11Table 2: Statistical properties of internal nodes
Statistical Properties Value
Number of Nodes 49
Sum of Degrees 1342
Mean (Average) Degree 27.388
Median Degree 26
Degree Mode 26, appeared 8 times
Largest Degree 44
Smallest Degree 13
Figure 9: Average Centrality over time
6. CONCLUSIONS
The objective of this research is to promote student engagement in STEM learning and
demonstrating an opportunity for leveraging social media as a pedagogical platform. As such, the
study utilizes social media interactions on Twitter from students in an online class of Construction
Materials and Methods during Spring 2020. Traditional datasets have limited capacity to capture
online information sharing and interactions of students and external peers in a STEM class with
such details and coverage. The fully online class consisted of 66 students enrolled in the fully
online class and 49 of them provided Twitter handle through an end-of-semester survey. Twitter
Application Programming Interface (API) was used to retrieve students’ online interactions in five
consecutive deliverables during the semester. These deliverables included student social media
interactions on several topics covered in class such as (i) construction; (ii) delivery methods,
drawings and specifications, zoning regulations, building codes, construction standards; (iii) soil
types, properties, gradation, testing, and exploration; (iv) concrete ingredients, making, placing
and reinforcing concrete, sitecast and precast concrete, wood products, masonry; and (v) steel
construction. The requirement was to post any information of their choice (photo, video, text,
12website link, or anything relevant) already covered in the class and comment to at least five other
students. To maximize peer influence, students used several keywords (such as #course number,
#university name, #construction) as hashtags and mentions. Interactions from external peers such
as experts, alumni faculty, senior students among others were also observed. A few of the posts
from the students' social network are shown below:
• “I can't wait to see how the Inter Miami stadium turns out. Its construction is scheduled to
be done by March”.
• “Steel comes with very distinct qualities that make it the material of choice among
construction professionals”.
• Wooden construction isn't as popular as it is up north, but the energy efficiency is extremely
significant compared to others.
Analyses of such interaction networks showed significant growth of students’ social media
activity and connectivity over time i.e. the number of network agents and their connectivity
increased significantly from the first deliverable to the final deliverable. These also exhibit
small-world properties that are evident in many real networks. For example, within the first 25
days of assigning the initial deliverable, five times more participants and twenty-seven times
more interactions were observed. We also observed that the degree (i.e. number of immediate
neighbors) distribution follows power-law which means many nodes with less interaction and
very few in the network are having most of the interactions. Within the first 25 days, the average
degree of the participants increased from 2.29 to 12.92. Social media engagement of the students
can be monitored following the slope of network growth over time. For example, network
growth was observed to be the least since no social media participation deliverable was assigned
in February. Most of the external nodes which have greater connectivity with other nodes in the
network are user mentions such as @ FIU_Mossschool, which can serve as an information hub to
influence internal as well as external peers. Through network analysis, influential and non-
influential students can be identified which could help instructors and educators to prepare a
better strategy to increase the students’ engagement in any particular course. Some of the key
insights of this study include: (i) students who are highly active on social media, are also likely
to engage with students with similar activity level; (ii) students are more likely to find newer
connections (i.e. user mentions) compared to the connections they already established; (iii) the
timing of social media participation deliverables increases the likelihood students’ interaction
activities in the network. The absence of such deliverables slowed down the network growth and
resulted in reduced average connectivity of the students’ network.
The insights of this study can be useful in facilitating STEM learning and engagement with more
efficient peer influence. The findings of this research will help to craft targeted information-
sharing strategies for various student groups based on their interaction, activities, and
characteristics on how students react to what others post on social media on a related STEM
topic. Although the findings of this study are obtained by applying network science theories in
STEM learning, this study has some limitations and could be improved in future research. The
data was collected only for 49 students who were enrolled in Spring 2020. In future studies, by
conducting similar experiments, more data can be collected to perform a comparative analysis of
network growth. The study also did not consider the emerging discussion topics that may exist in
the tweeting activities of the students as well as external peers. The study is limited to exploring
13network growth within a semester, however, future studies may uncover whether such network
connectivity sustains even after the end of the semester. The study is also inconclusive on how
social media interactions on a STEM topic may influence knowledge building. The study was
limited to the class of Construction Material and Methods; more efforts are needed to find out
whether such network growth patterns exist in different STEM courses.
REFERENCES
[1] S. Hasan, S. Ukkusuri, H. Gladwin, and P. Murray-Tuite, “Behavioral model to understand
household-level hurricane evacuation decision making,” J. Transp. Eng., vol. 137, no. 5, pp. 341–
348, 2011, doi: 10.1061/(ASCE)TE.1943-5436.0000223.
[2] A. M. Sadri, S. Hasan, S. V. Ukkusuri, and J. E. Suarez Lopez, “Analysis of social interaction
network properties and growth on Twitter,” Soc. Netw. Anal. Min., vol. 8, no. 1, p. 0, 2018, doi:
10.1007/s13278-018-0533-y.
[3] M. E. J. Newman, “The Structure and Function of Complex Networks ∗,” vol. 45, no. 2, pp. 167–
256, 2003.
[4] E. Brewe, L. H. Kramer, G. E. O. Brien, E. Brewe, L. H. Kramer, and G. E. O. Brien, “Changing
Participation Through Formation of Student Learning Communities,” vol. 85, 2010.
[5] J. Bruun and E. Brewe, “Talking and learning physics : Predicting future grades from network
measures and Force Concept Inventory pretest scores,” vol. 020109, pp. 1–13, 2013, doi:
10.1103/PhysRevSTPER.9.020109.
[6] R. Dou, E. Brewe, G. Potvin, J. P. Zwolak, and Z. Hazari, “Understanding the development of
interest and self-efficacy in active-learning undergraduate physics courses,” Int. J. Sci. Educ., vol.
40, no. 13, pp. 1587–1605, 2018, doi: 10.1080/09500693.2018.1488088.
[7] M. Elzomor, P. Pradhananga, and A. M. Sadri, “Using social media to improve minority students’
skills when connecting courses with different educational modalities,” ASEE Annu. Conf. Expo.
Conf. Proc., vol. 2020-June, 2020, doi: 10.18260/1-2--35472.
[8] A. M. Sadri, S. V. Ukkusuri, and H. Gladwin, “Modeling joint evacuation decisions in social
networks: The case of Hurricane Sandy,” J. Choice Model., vol. 25, no. March, pp. 50–60, 2017,
doi: 10.1016/j.jocm.2017.02.002.
[9] “Network Effects in Education | Getting Smart.” [Online]. Available:
https://www.gettingsmart.com/2017/06/network-effects-in-education/.
[10] M. Nicola et al., “The socio-economic implications of the coronavirus pandemic (COVID-19): A
review,” Int. J. Surg., vol. 78, no. April, pp. 185–193, 2020, doi: 10.1016/j.ijsu.2020.04.018.
[11] J. P. Zwolak, R. Dou, E. A. Williams, and E. Brewe, “Students ’ network integration as a predictor
of persistence in introductory physics courses,” vol. 010113, pp. 1–14, 2017, doi:
10.1103/PhysRevPhysEducRes.13.010113.
[12] D. Denick et al., “STEM thinking in informal environments: Integration and recommendations for
formal settings,” ASEE IL-IN Sect. Conf., pp. 1–17, 2013, [Online]. Available:
http://ilin.asee.org/2013/index_files/denick.pdf.
[13] E. Brewe, L. Kramer, and V. Sawtelle, “Investigating student communities with network analysis
of interactions in a physics learning center,” vol. 010101, pp. 1–9, 2012, doi:
10.1103/PhysRevSTPER.8.010101.
[14] R. Dou, E. Brewe, J. P. Zwolak, G. Potvin, E. A. Williams, and L. H. Kramer, “Beyond
performance metrics : Examining a decrease in students ’ physics self-efficacy through a social
networks lens,” vol. 020124, pp. 1–14, 2016, doi: 10.1103/PhysRevPhysEducRes.12.020124.
[15] E. A. Williams, J. P. Zwolak, R. Dou, and E. Brewe, “Linking engagement and performance : The
social network analysis perspective,” Phys. Rev. Phys. Educ. Res., vol. 15, no. 2, p. 20150, 2019,
14doi: 10.1103/PhysRevPhysEducRes.15.020150.
[16] K. C. Roy, S. Hasan, A. M. Sadri, and M. Cebrian, “Understanding the efficiency of social media
based crisis communication during hurricane Sandy,” Int. J. Inf. Manage., vol. 52, no. January, p.
102060, 2020, doi: 10.1016/j.ijinfomgt.2019.102060.
[17] A. M. Sadri, S. Hasan, S. V. Ukkusuri, and M. Cebrian, “Exploring network properties of social
media interactions and activities during Hurricane Sandy,” Transp. Res. Interdiscip. Perspect., vol.
6, p. 100143, 2020, doi: 10.1016/j.trip.2020.100143.
[18] A. M. Sadri, S. Hasan, and S. V. Ukkusuri, “Analyzing social interaction networks from twitter for
planned special events,” arXiv, pp. 1–20, 2017.
[19] A. Malik, A. Johri, R. Handa, H. Karbasian, and H. Purohit, “#ILookLikeAnEngineer: Using
social media based hashtag activism campaigns as a lens to better understand engineering diversity
issues,” arXiv, 2018.
[20] R. Pandey, H. Purohit, and A. Johri, “AI for Trustworthiness !,” 2018.
[21] B. D. Le, G. Wang, M. Nasim, and M. A. Babar, “Gathering cyber threat intelligence from twitter
using novelty classification,” Proc. - 2019 Int. Conf. Cyberworlds, CW 2019, no. June, pp. 316–
323, 2019, doi: 10.1109/CW.2019.00058.
[22] C. O’Toole, “‘Virtual Learning Environment Faculty Continuing Professional Development -
Networked Learning Communities’ A Critical Literature Review,” Irish J. Technol. Enhanc.
Learn., vol. 4, no. 1, pp. 48–67, 2019, doi: 10.22554/ijtel.v4i1.50.
[23] A. Malik, “# EngineersWeek : Broadening our Understanding of Community Engagement
Through Analysis of Twitter Use During the National EngineersWeek # EngineersWeek :
Broadening our Understanding of Community Engagement through Analysis of Twitter Use
during the Nati,” 2018.
[24] A. Johri, H. Karbasian, A. Malik, R. Handa, and H. Purohit, “How diverse users and activities
trigger connective action via social media: Lessons from the Twitter hashtag campaign
#ILookLikeAnEngineer,” arXiv, 2018, doi: 10.24251/hicss.2018.273.
[25] F. Gursoy and B. Badur, “Extracting the signed backbone of intrinsically dense weighted
networks,” pp. 1–17, 2020, [Online]. Available: http://arxiv.org/abs/2012.05216.
[26] A. B. Parsa, A. Movahedi, H. Taghipour, S. Derrible, and A. (Kouros) Mohammadian, “Toward
safer highways, application of XGBoost and SHAP for real-time accident detection and feature
analysis,” Accid. Anal. Prev., vol. 136, no. December 2019, p. 105405, 2020, doi:
10.1016/j.aap.2019.105405.
[27] S. Derrible and C. Kennedy, “Applications of graph theory and network science to transit network
design,” Transp. Rev., vol. 31, no. 4, pp. 495–519, 2011, doi: 10.1080/01441647.2010.543709.
[28] S. Derrible and C. Kennedy, “The complexity and robustness of metro networks,” Phys. A Stat.
Mech. its Appl., vol. 389, no. 17, pp. 3678–3691, 2010, doi: 10.1016/j.physa.2010.04.008.
[29] S. Derrible and C. Kennedy, “Network analysis of world subway systems using updated graph
theory,” Transp. Res. Rec., no. 2112, pp. 17–25, 2009, doi: 10.3141/2112-03.
[30] M. N. H. Mojumder, M. A. Ahmed, and A. M. Sadri, “Identifying Ridesharing Risk, Response and
Challenges in the Emergence of Novel Coronavirus (COVID-19) using Interactions in Uber
Drivers Forum,” Front. Built Environ., vol. 7, p. 4, 2021, doi: 10.3389/FBUIL.2021.619283.
[31] A. M. Sadri, S. Hasan, S. V. Ukkusuri, and M. Cebrian, “Understanding information spreading in
social media during hurricane sandy: User activity and network properties,” arXiv, 2017.
[32] K. C. Roy, M. A. Ahmed, S. Hasan, and A. M. Sadri, “Dynamics of Crisis Communications in
Social Media: Spatio-temporal and Text-based Comparative Analyses of Twitter Data from
Hurricanes Irma and Michael,” Amanda Hughes, Fiona McNeill, Christopher W. Zobel (Eds.),
ISCRAM 2020 Conf. Proc. – 17th Int. Conf. Inf. Syst. Cris. Response Manag., no. May, pp. 812–
824, 2020, [Online]. Available:
http://idl.iscram.org/files/kamolroy/2020/2273_KamolRoy_etal2020.pdf.
[33] A. M. Sadri, S. Hasan, and S. V. Ukkusuri, “Joint inference of user community and interest
patterns in social interaction networks,” Soc. Netw. Anal. Min., vol. 9, no. 1, p. 0, 2019, doi:
1510.1007/s13278-019-0551-4.
[34] M. Tantardini, F. Ieva, L. Tajoli, and C. Piccardi, “Comparing methods for comparing networks,”
Sci. Rep., vol. 9, no. 1, pp. 1–19, 2019, doi: 10.1038/s41598-019-53708-y.
[35] B. D. Gane, D. Denick, N. Jorion, L. V. Di Bello, J. W. Pellegrino, and R. A. Streveler,
“Continuous improvement of a concept inventory: Using evidence centered design to refine the
thermal and transport concept inventory,” ASEE Annu. Conf. Expo. Conf. Proc., vol. 122nd ASEE,
no. 122nd ASEE Annual Conference and Exposition: Making Value for Society, 2015, doi:
10.18260/p.23743.
[36] D. L. Denick, “Difficulty as a concept inventory design consideration: An exploratory study of the
concept assessment tool for statics (CATS),” ProQuest Diss. Theses, p. 192, 2015, [Online].
Available: https://search.proquest.com/docview/1709248510?accountid=15272.
[37] A. M. Sadri, “Enhancing peer influence in STEM learning and engagement through social media
interactions using network science principles,” ASEE Annu. Conf. Expo. Conf. Proc., vol. 2020-
June, 2020, doi: 10.18260/1-2--34572.
[38] A. M. Sadri, S. V. Ukkusuri, and H. Gladwin, “The Role of Social Networks and Information
Sources on Hurricane Evacuation Decision Making,” Nat. Hazards Rev., vol. 18, no. 3, 2017, doi:
10.1061/(ASCE)NH.1527-6996.0000244.
[39] U. Brandes, “On variants of shortest-path betweenness centrality and their generic computation,”
Soc. Networks, vol. 30, no. 2, pp. 136–145, 2008, doi: 10.1016/j.socnet.2007.11.001.
[40] S. Derrible, “Network centrality of metro systems,” PLoS One, vol. 7, no. 7, 2012, doi:
10.1371/journal.pone.0040575.
[41] L. C. Freeman, “Centrality in Social Networks Conceptual Clarification,” vol. 1, no. 1968, pp.
215–239, 1978.
[42] J. Onnela and K. Kaski, “Generalizations of the clustering coefficient to weighted complex
networks 1,” pp. 2–5, 2007, doi: 10.1103/PhysRevE.75.027105.
[43] A. M. Sadri, S. Hasan, S. V. Ukkusuri, and M. Cebrian, “Crisis communication patterns in social
media during hurricane sandy,” Transp. Res. Rec., vol. 2672, no. 1, pp. 125–137, 2018, doi:
10.1177/0361198118773896.
[44] M. D. A. Ahmed, A. M. Sadri, and M. H. Amini, “Data-driven Inferences of Agency-level Risk
and Response Communication on COVID-19 through Social Media based Interactions,” arXiv, pp.
1–19, 2020.
[45] A. M. Sadri, S. Hasan, S. V. Ukkusuri, and J. E. Suarez Lopez, “Analysis of social interaction
network properties and growth on Twitter,” Soc. Netw. Anal. Min., vol. 8, no. 1, pp. 1–13, 2018,
doi: 10.1007/s13278-018-0533-y.
16You can also read