Comparisons of Activity Budgets, Interactions, and Social Structures in Captive and Wild Chimpanzees (Pan troglodytes) - Mdpi
←
→
Page content transcription
If your browser does not render page correctly, please read the page content below
animals
Article
Comparisons of Activity Budgets, Interactions, and
Social Structures in Captive and Wild Chimpanzees
(Pan troglodytes)
Nodoka Inoue and Masaki Shimada *
 Department of Animal Sciences, Teikyo University of Science, 2525 Yatsusawa, Uenohara,
 Yamanashi Prefecture 409-0193, Japan; d-magic.mn-30@i.softbank.jp
 * Correspondence: shimada@ntu.ac.jp; Tel.: +81-554-63-6814

 Received: 20 May 2020; Accepted: 17 June 2020; Published: 19 June 2020

 Simple Summary: For chimpanzees in zoos, the key aim of environmental enrichment is to enable
 them to exhibit behaviors, interactions, and societies similar to chimpanzees in the wild. A comparison
 of observational data, showed that the proportion of their time spent on collecting foraging was
 significantly lower in captive chimpanzees (located in Tama) than in wild chimpanzees (located in
 Mahale), but no significant difference was found between the two groups in terms of the proportion
 of their total time spent collecting, extractive, and hunting foraging. The percentage of time
 spent performing mutual grooming was much higher in Tama than in Mahale. Males, but not
 females, in Mahale formed a core social group, but no sex-specific differences were found in Tama.
 The multiple artificial feeders allowed chimpanzees in Tama to spend more time on extractive foraging
 to achieve a similar proportion of time on foraging as compared with that of the wild chimpanzees.
 The environmental enrichment for chimpanzees in Tama can be considered to be successful.

 Abstract: Chimpanzees in zoos with sufficient and appropriate environmental enrichment devices are
 expected to exhibit behaviors, interactions, and societies similar to those in the wild. In this study, we
 compared the activity budgets of each observed behavior, characteristics of social grooming, and social
 networks of captive chimpanzees at Tama Zoological Park (Tama) with those of wild chimpanzees at
 Mahale Mountains National Park, Tanzania (Mahale), and tested our predictions. We surveyed 16
 chimpanzees in both Tama and Mahale and recorded the behaviors and individuals in proximity
 of each focal individual and social grooming the focal individuals participated in. The proportion
 of time spent collecting foraging was significantly lower in Tama than in Mahale. Additionally, the
 percentage of mutual grooming was much higher in Tama than in Mahale. All focal individuals in
 Mahale performed mutual grooming interactions, including grooming handclasp (GHC) but this was
 not observed in Tama. The result of a high rate of mutual grooming in chimpanzees in Tama without
 GHC and the finding that individuals forming the core of their social network are sex independent
 suggest that chimpanzees placed in an appropriate environmental enrichment have idiosyncratic
 grooming or social features, even in captivity.

 Keywords: chimpanzee; Tama Zoological Park; Mahale Mountains National Park; social network;
 social grooming; environmental enrichment

1. Introduction

1.1. Environmental Enrichment for Captive Chimpanzees
     Environmental enrichment can be defined as any proactive effort to improve the living environment
of captive animals based on knowledge of their behavior and ecology in the wild [1,2]. One of the

Animals 2020, 10, 1063; doi:10.3390/ani10061063                                www.mdpi.com/journal/animals
Animals 2020, 10, 1063 2 of 17
ultimate goals of environmental enrichment in captive animals is to bring their behavioral repertoire and
daily behavioral time budgets closer to those of their wild counterparts [3]. Environmental enrichment
for captive primates should encompass all five of the following categories: social, physical, nutritional,
occupational, and sensory [1,4]. For example, devising enrichment in the form of an improved feeding
method or using more appropriate feeders can be thought of as nutritional, occupational, and sensory
enrichment [3,5,6]. Likewise, the installation and introduction of three-dimensional structures and
playground equipment can be considered to be occupational and physical enrichment [7]. In addition,
rearing multiple individuals in a group can be thought of as social enrichment [4,6,8].
Zoos in Japan have been working to improve their environmental enrichment for captive
chimpanzees. For example, Tama Zoological Park, Tokyo (Tama) provides many forms of enrichment
for their captive chimpanzees based on the criteria mentioned above. The introduction of several
types of enrichment items in Tama allows chimpanzees to spend more time foraging and fulfills the
aims of physical, occupational, and sensory enrichment [5,9,10]. Foraging was subdivided into the
following three categories: collecting, extractive, and hunting foraging [11]. Collecting foraging is the
behavior of directly eating food resources, such as fruits and leaves, collected from the environment.
Extractive foraging is a series of behaviors, such as preparing tools to extract, remove, process, and eat
hidden food resources, such as roots, the inside of hard nuts or seeds [12], and invertebrate animals
such as carpenter ants that live inside trees [13]. Hunting foraging is a series of behaviors such as
chasing and catching mobile vertebrate animals, and sharing or eating their meats [14,15]. For example,
the so-called “artificial anthill” in Tama is a feeder with juice inside, which can be acquired as each
individual goes through different steps, such as obtaining a stick to insert by procuring a tree branch,
inserting and pulling the stick, and licking juice from the stick [16]. Artificial anthills have succeeded
in causing chimpanzees to exhibit extractive foraging, which is similar to the ant-fishing behavior
observed in some groups of wild chimpanzees, such as the ones in Mahale Mountains National Park,
Tanzania (Mahale). Chimpanzees in Mahale create probes from plant materials, insert them into the
entrance of the nest of wood-boring carpenter ants (Camponotus spp.), then, withdraw the probes and
eat the ants [13,17,18].
Few studies have clarified the effects of environmental enrichment. Previous studies on
chimpanzees in Tama have been conducted on the process of acquiring skills for nut cracking and the
parenting behavior of mothers [19,20]. However, there has been no quantitative comparative study
conducted on the activity budgets, social grooming, or social structure of captive Tama chimpanzees
and those of wild groups.
1.2. Purpose of Research and Predictions
The purpose of this study was to test the hypothesis that captive chimpanzees living under
conditions with appropriate environmental enrichment would behave, interact, and form social
structures in a similar manner to wild chimpanzees, and to determine the effect and function of
environmental enrichment on captive chimpanzees. To test this hypothesis, we compared the activity
budgets, grooming interaction features, and social network of captive chimpanzees at Tama with those
of wild chimpanzees in Mahale and tested the following predictions.
In Tama, the proportion of time spent on collecting foraging is expected to be lower than that
of chimpanzees in Mahale, since captive chimpanzees eat scheduled baits or food items given by
zookeepers at regular intervals while wild chimpanzees forage for food resources in the field themselves.
In contrast, because of the zoo environment in Tama, hunting is impossible, but chimpanzees are
still expected to spend much of their time on extractive foraging because of the installation of
multiple artificial feeders [16]. Therefore, the percentage of time spent foraging, that is, the total
time for collecting, extractive, and hunting foraging, is expected to be comparable to that of the
chimpanzees in Mahale. Because of the comparatively smaller size of the outside enclosure (0.23 ha),
the percentage of time spent by Tama chimpanzees on traveling is expected to be lower than that of the
Mahale chimpanzees.Animals 2020, 10, 1063 3 of 17
Mutual grooming is a form of social grooming in which the amounts of grooming individuals
give and receive from a partner are inevitably the same [21,22]. When two individuals exchange
one-directional grooming, the amount of grooming is mutually beneficial only if the two individuals
meet in the long term, but when the chance of meeting in the future is uncertain, it is more rational to
exchange mutual grooming and receive the same amount of grooming from the partner at the same
time [23,24]. Therefore, chimpanzees in Tama, where each individual can be in close proximity to all
other individuals, are predicted to have a lower proportion of mutual grooming than chimpanzees in
Mahale, where it is always possible to be away from each other at great physical distances for a long
period of time [25,26].
To avoid lethal aggressive interactions between captive males (e.g., [27]), the zookeepers in Tama
decide, on a daily basis, which combination of individuals to keep in the outside enclosure, out of the
animals kept in Tama. Therefore, in Tama, there is no need for males to form alliances and compete with
other males for a competitive advantage [28,29]. In addition, there are no externally hostile neighboring
groups, and the need for males to form strong social bonds with each other or alliances is also lower
than in Mahale [30]. Because proximity is known to be an indicator of an affiliative relationship
between individuals [31], male–male proximity is predicted to be higher than female–female proximity
or male–female proximity in Mahale, but this is not the case in Tama [32–34]. Finally, chimpanzees in
Mahale, similar to other wild groups, are predicted to form a male-dominated society. In other words,
the males take central positions and form the core of the social network of the members in Mahale, but
no such tendency is predicted in Tama [35].
2. Methods and Materials
2.1. Subjects and Observational Methods
The first author (NI) conducted observations on Tama chimpanzees from April to October 2019,
with 42 observation days in total. In Tama, there were 19 captive individuals in total during the study
period. Out of the 19 individuals, 5 males (1 adult, 3 young, and 1 juvenile) and 11 females (10 adults
and 1 young) that were routinely released into outdoor enclosure were selected as the focal individuals
in our study (Table 1). The zookeepers decided which individuals to exhibit in the outdoor enclosure
each day based on the estrus cycle of each female chimpanzee, while the other individuals were kept
in private enclosures in the back yard. Approximately 10 out of the 16 focal individuals were exhibited
daily in the outdoor enclosure in areas measuring 0.23 ha. There are two 15 m tall steel towers on the
premises, and three-dimensional structures such as wooden towers [16,19]. The presence of a central
hill in the outside enclosure allowed each individual to create blind spots and avoid excessive gazing
from visitors in the zoo. In the outdoor enclosures, there are many enrichment items associated with
foraging, such as so-called “bamboo tube feeders”, “braided fire hoses”, “UFO catchers”, and “artificial
anthills,” all of which have mechanisms that allow the chimpanzees to exercise complex movements
and spend a long time obtaining the food resources found inside [16,19,20].
Mahale is located on the eastern shore of Lake Tanganyika, at the western end of Tanzania in
Africa. The entire area of Mahale is approximately 1600 km2 , where more than 10 independent groups
are distributed. One of groups, the M group, has an area of approximately 2700 ha [36]. The second
author (MS) conducted observations on Mahale chimpanzees from October 2001 to February 2002,
with 69 observation days in total. In the M group in Mahale, there were 55 individuals in total during
the study period. Eight males (7 adults and 1 young) and eight adult females were selected as the focal
individuals for the wild group out of the 55 chimpanzees (Table 1).Animals 2020, 10, 1063 4 of 17
Table 1. The list of focal individuals in both study groups. * Tama, Tama Zoological Park, Tokyo; Wild,
born in wild; Izu, Izu Shaboten Zoo, Shizuoka; KS, Kumamoto Sanctuary, Kumamoto; Noichi, Noichi
Zoological Park, Kochi; M, M group in Mahale [36], K, K group in Mahale [36], O, a group other than
M or K group [36].
Group Name Abbreviation Sex Age Age Category Place of Birth *
Bonbon bo 14 Young Tama
Deckie de app. 41 Adult Wild
Male
Gin gi 11 Young Tama
Max mx 12 Young Tama
Fubuki fu 5 Juvenile Tama
Tama Peach pc 29 Adult Izu
Nana na 36 Adult Tama
Peco pe app. 58 Adult Wild
Chico ci 25 Adult Tama
Female
Cherry ch 29 Adult Tama
Berry be 19 Adult Tama
Momoko mo 26 Adult KS
Mikan mi 13 Adult Tama
Marina mr 29 Adult KS
Mil ml 16 Adult Tama
Sakura sa 10 Young Noichi
Alofu AL 20 Adult M
Bonobo BB 21 Adult M
Carter CT 17 Adult M
Male
Kalunde DE 39 Adult M
Fanana FN 24 Adult M
Mahale Hanby HB 22 Adult M
Masudi MA 25 Adult K
Pimu PM 14 Young M
Cynthia CY 20 Adult O
Nkombo NK 32 Adult K
Opal OP 31 Adult O
Female
Pinky PI 30 Adult O
Totzy TZ 20 Adult M
Wakusi WX 41 Adult O
Christina XT 27 Adult O
Zola ZL 15 Adult O
In both groups, we conducted observations using the focal sampling method [37]. The focal
animal was changed approximately every 5 h in Tama and every 2 h in Mahale. Before we began
observing, focal animals were selected so that there was as little sampling bias as possible among the
three time periods per day (until 12 am, 1 pm to 2 pm, after 2 pm) and total observation days in each
group. When observing animals in the field or outside enclosure, the focal individual was not always
within the view of the observer. Therefore, for the recording of behaviors and proximate individuals,
it was reasonable to use the instantaneous sampling method or one-zero sampling method with
appropriate sampling intervals according to the observation conditions, rather than the continuousAnimals 2020, 10, 1063 5 of 17
sampling method [37]. In Tama, during the daytime when chimpanzees were in the outside enclosure,
the behaviors of the focal animals and the individuals approaching within 3 m of them were recorded
using the instantaneous sampling method at 3 min intervals. In Mahale, the behaviors of the focal
animals were recorded using the instantaneous sampling method at 1 min intervals, and the individuals
approaching within 10 m of these focal animals were recorded using the one-zero sampling method at
5 min intervals. In both groups, the activities of chimpanzees were recorded according to the following
categories: foraging, traveling, resting, social grooming, and others (all the remaining activities that
cannot be classified into these four categories, according to the ethogram of wild chimpanzees) [38].
The feeder-using behavior in Tama (processing a probe or stick, inserting it into artificial anthill, and
licking the fruit juice) was defined as extractive foraging, as was the ant-fishing process in Mahale [13].
“Others” included activities such as drinking water, solitary play, social play, vocalization, or aggressive
behaviors. Abnormal behaviors, such as coprophagy, hair plucking, self-injurious behavior, or pacing,
were recorded if observed [5,39,40].
In both groups, we used all occurrence sampling methods to record sequences of social grooming
interactions, including focal individuals, in seconds. A grooming clique was defined as a configuration
of directly connected individuals through grooming interactions at a given moment [22]. We used a
modified version of this definition to record only observed social grooming, including focal individuals
that directly groomed the other individual or were directly groomed by the other individuals as a
sequential chain of grooming cliques. The types of grooming cliques were coded by a three-digit
number, according to Nakamura [41]. The leading number indicated whether the focal individual
was mutually groomed or not, and the number in the middle indicated whether the focal individual
was grooming the partner or not; we gave a value of 1 if it was, and 0 if it was not. The last number
indicated the number of individuals grooming the focal individual.
Furthermore, the grooming handclasp (GHC) is known as an interactive pattern of mutual
grooming in which both individuals groom around the underarm of another individual with either
one clasping the other’s corresponding wrist, arm, or hand, by crossing wrists or clasping each other’s
hands on their heads [42–44]. In each group, we checked whether or not each focal individual engaged
in mutual grooming, including GHC.
2.2. Variables and Data Analysis
The activity budget of each behavior category in the total observation time of each individual was
calculated for each group.
Using the data of individuals in close proximity to the focal individual, a proximity index (PIAB )
between individuals A and B was applied to the following Equation (1) and calculated as a simple
proximity ratio [35]:
TA(B) + TB(A)
PIAB = (1)
TA + TB
where TA represents the total observation time of focal individual A, TA(B) represents the total time the
focal individual A is close to B, while A is observed.
Adjacency matrices for both groups were created using PIs between 16 individuals. When drawing
and analyzing social networks, once all the proximity relationships are left in and the same group
is observed over a long period of time, as in this study, all individuals are connected to each other
and miss a meaningful social structure. Thus, filtering was performed so that only PIs with values
equal to or higher than the third quartile remained [37]. Non-directed networks were created using
the relationships left by the filtering, and they were regarded as representative social networks of
chimpanzees in Tama and Mahale [35,45]. Social network analysis was conducted for these networks,
and the eigenvector centralities of each individual were calculated in both groups.
The amounts of mutual grooming and total social grooming for each individual were calculated
in seconds, and the mutual grooming ratio was defined as the value of the former divided by the latter.Animals 2020, 10, 1063 6 of 17
Data for individuals that were rarely observed participating in any social grooming, as well as those
for a juvenile individual (fu), were excluded from the analysis.
2.3. Statistical Analyses
The activity budget of each behavioral category and the mutual grooming ratio of each individual
were compared between groups (Tama/Mahale) using a nonparametric test (Mann–Whitney’s U test).
One activity budget and one mutual grooming ratio per individual were included in each analysis.
Since the data used to derive the PIs were different between Tama and Mahale, the PIs could not
be compared directly between groups. Therefore, the PIs of each individual were compared with the
sex combinations (male–male/female–female/male–female) using a nonparametric test (Kruskal–Wallis
test). When the result was significant, multiple comparisons by Holm’s method were performed.
For the comparison of eigenvector centralities between males and females in each group, we used
randomization test [46]. Firstly, we performed Welch’s two sample t-test for observed eigenvector
centralities between males and females to obtain observed t-values. Then, we performed 10,000
resamples of the eigenvector centrality of each sex, calculated the resampled t-values for each by
the Welch’s method, and examined the p-value of the obtained t-values that were smaller than the
observed t-value, using the distribution of resampled t-values.
Data were analyzed using the statistical freeware HAD [47], UCINET6.0, NetDraw 2.166 [48], and
in R (R Core Team, version 3.4.4). The significance level was set at α = 0.05.
2.4. Ethical Approval
To conduct field research on wild chimpanzees in Mahale, M.S. complied with protocols approved
by the Tanzania Wildlife Research Institute (TAWIRI) and adhered to the legal requirements of the
government of Tanzania. Our research on captive chimpanzees in Tama was approved by the Teikyo
University of Science Animal Committee (no. 19C027) and permitted by Tama Zoological Park. Our
research adhered to the American Society of Primatologists (ASP) Principles for the Ethical Treatment
of Non-Human Primates.
3. Results
3.1. Activity Budget
The mean +SD observation time per subject was 1573.1 ± 197.2 min (n = 16) in Mahale and 609.4
± 76.3 min (n = 16) in Tama (Table S1). All chimpanzees in both groups were in good health during the
observation period, and no abnormal behavior was observed. The activity budget of each behavioral
category for each focal individual in both groups is shown in Figure 1.
The activity budgets of collecting foraging for each individual in Tama (11.4 ± 4.9%) were found
to be significantly lower than those in Mahale (18.2 ± 4.2%) (Mann–Whitney’s U test, U = 37.0, df = 1,
p < 0.001). However, the activity budgets of all the foraging types that combined collecting, extractive,
and hunting foraging were found to be not significantly different between the two groups (Tama
18.8 ± 7.4% and Mahale: 21.3 ± 5.3%, Mann–Whitney’s U test, U = 98.0, df = 1, p = 0.266).
The activity budgets of traveling for each individual in Mahale (Mahale 15.4 ± 2.9%) were found
to be higher than those in Tama (12.0 ± 3.6%) (Mann–Whitney’s U test, U = 57.0, df = 1, p = 0.008).Animals 2020, 10, 1063 7 of 17
Animals 2020, 10, x 7 of 17
Figure 1. Percentage of time in each behavioral category for each individual in both groups. The
Figure above
numbers 1. Percentage of time in of
the abbreviations each
the behavioral categorynames
focal individuals’ for each individual
indicate in both
the total groups.
number The
of minutes
numbers above the abbreviations
that each individual was observed. of the focal individuals’ names indicate the total number of minutes
that each individual was observed.
3.2. Social Grooming and Mutual Grooming
The activity budgets of collecting foraging for each individual in Tama (11.4 ± 4.9%) were found
The list of all the observed grooming cliques is shown in Table 2, and the ratio of each grooming
to be significantly lower than those in Mahale (18.2 ± 4.2%) (Mann–Whitney’s U test, U = 37.0, df = 1,
clique to social
p < 0.001). grooming
However, for each
the activity focalofindividual
budgets is shown
all the foraging in Figure
types that 2. In
combined the observed
collecting, types
extractive,
of and
grooming cliques, (111), (112), and (114) were mutual grooming, while the other
hunting foraging were found to be not significantly different between the two groups (Tama 18.8 types were
one-directional grooming.
± 7.4% and Mahale: 21.3 ± 5.3%, Mann–Whitney’s U test, U = 98.0, df = 1, p = 0.266).
The activity budgets of traveling for each individual in Mahale (Mahale 15.4 ± 2.9%) were found
to Table 2. Types
be higher thanofthose
grooming cliques
in Tama during
(12.0 the(Mann–Whitney’s
± 3.6%) study period. BlackUcircles indicate
test, U = 57.0,the
df focal
= 1, pindividual,
= 0.008).
white circles indicate the other individuals, → indicates who the grooming was directed toward, ↔
indicates
3.2. mutual grooming,
Social Grooming ##Grooming
and Mutual or ### indicates two or three individuals simultaneously grooming a
focal individual. The gray rows indicate mutual grooming.
The list of all the observed grooming cliques is shown in Table 2, and the ratio of each grooming
clique toClique
Code of socialTypes
grooming for each focal
Configuration individual
of Participating is shown in Figure
Individuals Number2.ofIn the observed
Participating types of
Individuals
grooming001 cliques, (111), (112), and (114) #→•were mutual grooming, while the other 2 types were one-
directional
010grooming. •→# 2
111 •↔# 2
011 #→•→# 3
002 ##→• 3
112 #→•↔# 3
003 ###→• 4
012 ##→•→# 4
114 ###→•↔# 5
Since the total observation seconds of social grooming was extremely short, data of pe (0) and fu
(219) in Tama were excluded from the statistical analysis. The mutual grooming ratio for each focal
individual in Tama (26.8 ± 22.0%) was found to be significantly higher than those in Mahale (6.7 ±
5.7%) (Mann–Whitney’s U test, U = 59.5, df = 1, p = 0.030, Figure 2).
All the focal individuals in Mahale performed GHC at least once, while no individual did so in
Tama during the study period.Animals 2020, 10, 1063 8 of 17
Animals 2020, 10, x 8 of 17
Figure
Figure 2. Percentage of
2. Percentage of time
time spent
spent in
in each
each type
type of
of grooming
grooming clique
clique for
for each
each individual
individual in
in both
both groups.
groups.
The
The numbers above the abbreviations of the focal individuals’ names indicate the total number of
numbers above the abbreviations of the focal individuals’ names indicate the total number of
seconds that each individual participated in a social grooming interaction.
seconds that each individual participated in a social grooming interaction.
3.3. Social Networks and Network Indices
Table 2. Types of grooming cliques during the study period. Black circles indicate the focal individual,
The
whitePIcircles
matrices of thethe
indicate chimpanzees in Tama
other individuals, → and Mahale
indicates whoare
theshown in Tables
grooming S2 and S3,
was directed respectively.
toward, ↔
In Tama,
indicates PIs of each
the mutual pair ○○
grooming, of focal
or ○○○individuals
indicates twowere notindividuals
or three significantly different among
simultaneously groomingtheir
a sex
combinations (Kruskal–Wallis test, χ2 = 1.832, df = 2, p = 0.400, Figure 3a). In contrast, in Mahale, the
focal individual. The gray rows indicate mutual grooming.
PIs were significantly different among the sex combinations (Kruskal–Wallis test, χ2 = 35.947, df = 2,
Code of Clique Configuration of Participating Number of Participating
p < 0.001, Figure 3b). Multiple comparison between sex combinations by Holm’s method revealed
Types Individuals Individuals
that male–male 001PIs (0.168 ± 0.068) were significantly
○→● higher than the female–female
2 PIs (0.091 ± 0.065)
(Z = 4.276, p35.947, df = 2, p < 0.001, Figure 3b). Multiple comparison between sex combinations by Holm’s method
revealed that male–male PIs (0.168 ± 0.068) were significantly higher than the female–female PIs
(0.091 ± 0.065) (Z = 4.276, p < 0.001) and male–female PIs (0.085 ± 0.065) (Z = 5.916, p < 0.001), whereas
there
Animalswere
2020, sno significant difference between female–female PIs and male–female PIs (Z = −0.873,
10, 1063 p
9 of 17
= 0.383).
(a)
(b)
Figure
Figure 3.
3.Proximity
Proximityindexes
indexes(PIs)
(PIs)of
ofeach
eachsex
sexcombination
combinationof offocal
focalindividuals
individualsin inTama
Tama (a)
(a)and
andMahale
Mahale
(b).
(b). Error
Error bars
bars indicate
indicate standard
standard deviation.
deviation. ****denotes
denotesaa significance of pp 0.05).
nonsignificant (p 0.05).
All of the
Using thefocal individuals
PI matrices, in Tama
social connected
networks basedtoon
at least one other
proximity for individual
both groups in the
aresocial network
described in
and constituted
Figure one large
4. Using these cluster the
networks, thateigenvector
contained all of the individuals,
centralities even when
for each focal filtered,
individual so that
of each only
group
PIs with
were values above the third quartile remained (Figure 4a). In Mahale, an adult female (OP) was
calculated.
depicted
All ofas the
isolated
focalfrom the social
individuals innetwork among theto16atfocal
Tama connected leastindividuals
one other(Figure
individual4b). However, the
in the social
PIs between
network andOP and each one
constituted of the other
large 15 individuals
cluster were greater
that contained than
all of the 0 (Table S3),
individuals, indicating
even that OP
when filtered,
and the other individuals had the opportunity to be in close proximity, albeit less frequently,
so that only PIs with values above the third quartile remained (Figure 4a). In Mahale, an adult female during
the study
(OP) period. as isolated from the social network among the 16 focal individuals (Figure 4b).
was depicted
The eigenvector
However, the PIs betweencentrality
OP and for each
each of
focal
the individual of males (0.325
other 15 individuals ± 0.055)than
were greater was0found
(TabletoS3),
be
significantly higher than those of females (0.116 ± 0.053), in Mahale (randomization test, observed t
= −7.2076, p < 0.001). However, the eigenvector centrality for each focal individual of males (0.182
± 0.075) and females (0.251 ± 0.065), in Tama, were not significantly different (randomization test,
observed t = 1.4101, p = 0.9057).Animals 2020, 10, x 10 of 17
indicating
Animals that OP and the other individuals had the opportunity to be in close proximity, albeit
2020, 10, 1063 less
10 of 17
frequently, during the study period.
(a)
(b)
Figure
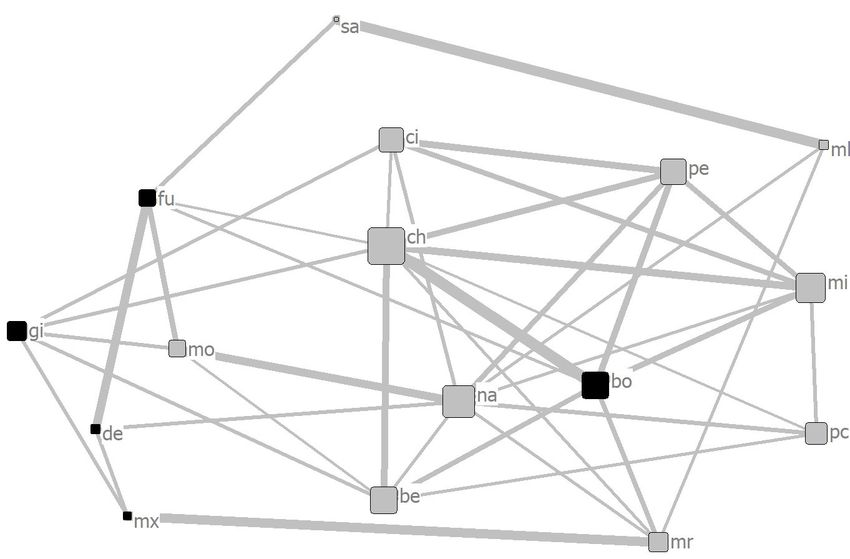
Figure 4. Social
4. Social network
network based
based on proximity
on the the proximity between
between focalfocal individuals
individuals in Tama
in Tama (a) and
(a) and Mahale
Mahale (b).
(b). Black and gray squares represent males and females, respectively. The size of the
Black and gray squares represent males and females, respectively. The size of the square represents thesquare
valuerepresents the valuecentrality
of the eigenvector of the eigenvector centrality
of each focal of each
individual in thefocal individual
network. in the network.
The thickness The
of the line is
an indicator of the proximity index (PI) value between connected individuals. The abbreviation of each
individual’s name is placed next to each square.Animals 2020, 10, 1063 11 of 17
4. Discussion
4.1. Activity Budgets
As predicted, the activity budgets of collecting foraging of each individual in Tama were
significantly lower than those in Mahale. There were no significant differences between the combined
collecting, extractive, and hunting foraging percentages of the two groups, although hunting foraging
was never observed in Tama.
Although the activity budgets for collecting foraging of captive chimpanzees tend to be shorter than
those of wild individuals, when they rely only on scheduled baits that do not require processing [3,5,49],
our results suggest that the multiple artificial feeders in Tama could have contributed to the increased
duration of extractive foraging. Therefore, the total activity budget of foraging in captivity was
approximately similar to that in the wild. Providing enrichment items to captive animals is considered
to contribute to an increase in the time they spend eating and to an improvement in their physical,
occupational, and sensory well-being [10]. The result that we found no abnormal behavior in Tama
and Mahale suggests that the introduction of abundant and complicated enrichment items associated
with foraging improved the well-being of captive chimpanzees and made abnormal behavior among
them less likely to occur [9,39,40,50].
As predicted, the activity budgets of traveling for each individual in Tama were significantly
lower than those in Mahale. One of the reasons why captive chimpanzees spent less time traveling
than wild chimpanzees is that their outside enclosure was physically narrower than the home range of
the wild groups. The ring area of M group chimpanzees, in Mahale, was 2700 ha, which is much larger
than the 0.23 ha outside enclosure in Tama [19,36].
In contrast, previous studies have shown that there are large regional differences in the activity
budgets for traveling in wild chimpanzees, from 6% in Budongo to 22% in the Tai Forest [51–53],
depending on socio-ecological factors, such as individual density or food availability [54]. The values
of activity budgets for traveling in Tama (12.0 ± 3.6%) and Mahale (15.4 ± 2.9%) in this study were
within this range. Thus, the results suggest that the proportion of traveling in the daily activities of
Tama chimpanzees was not necessarily lower than that of the wild chimpanzees in total. The area
of outside enclosure is much larger than 0.15 ha, which is the international standard for 19 captive
chimpanzees set by AZA (the Association of Zoos & Aquariums) [55]. Three-dimensional structures,
such as towers that are 15 m high and ropes between them in the outside enclosure, on the one hand,
allow the captive chimpanzees to generate behavioral diversity similar to that of wild chimpanzees
spending a long time in the trees. On the other hand, however, it should be noted if excessive traveling
is observed in chimpanzees living in enclosure, it can be a sign of stereotyping or stress.
4.2. Features of Grooming Interactions in Tama and Mahale
Contrary to what was predicted, the proportion of mutual grooming in the total social grooming
of chimpanzees in Tama (26.8 ± 22.0%) was higher than that in Mahale (6.7 ± 5.7%). Comparable
data are limited, based on our knowledge; only data on chimpanzees in Mahale studied from 1996 to
1997 are available [23], as well as data from Wamba for bonobos [56]. According to these previous
studies, the mutual grooming ratio in Mahale chimpanzees in the past was 10.4% of total social
grooming (recalculated from Figure 2 in Nakamura [22]), while that of wild bonobos in Wamba was
approximately 0.27% (recalculated from Figure 2 in Sakamaki [56]). A comparison of our result with
with these data, shows that our result of the mutual grooming ratio in Tama was suggested to be much
higher than those of wild chimpanzees in Mahale, both in the present and the past, and accentuates the
extremely low values in bonobos. Although a fission–fusion manner of variation in group membership
is a common feature of the genus Pan [38,57], wild bonobos form a larger party with more stable
memberships than those of wild chimpanzees [57,58]. Considering that most of the individuals in
Tama live in the same outside enclosure during the day, our results were opposite those predicted byAnimals 2020, 10, 1063 12 of 17
the hypothesis, i.e., that the uncertainty to encounter each other in the future would lead to a higher
mutual grooming ratio [24,59].
One alternative explanation for the high mutual grooming ratio between individuals in Tama and
the low ratio in Wamba is that the ratio could be an indicator of the degree of affiliative relationships
between them [31,59,60]. Mutual grooming is thought to form a stronger social bond as it requires
both partners to be actively involved and ensures reciprocity with respect to the amount of grooming
between partners as opposed to one-directional grooming [22,24,60]. In addition, the number of
affiliative interactions, such as mutual grooming, in captive chimpanzees, is likely be higher than in
wild chimpanzees owing to crowding and the abundance of time that can be spent on social interaction
in the more restricted area [8]. Future research is necessary to verify this possibility.
Our results suggest that social grooming idiosyncrasies could be present in Tama that have not
been discovered yet due to focusing on GHC. Although mutual grooming is an interactive pattern that
is a prerequisite for GHC, the results of this study suggest that groups with a high mutual grooming
ratio do not necessarily exhibit GHC. Thus, the high mutual grooming ratio that occurs without GHC
can be considered to be an idiosyncratic grooming variation in the groups in Tama [61–63].
4.3. Social Characteristics of Captive Chimpanzees
With the exception of OP in Mahale, each individual had at least two individuals in strong
proximity to each other, and they formed one large cluster in both groups (Figure 3). These results
suggest that both groups formed well-connected gathering networks [22,35].
The PIs of each pair of focal individuals in Tama were independent of the sex combination of
the pairs (Figure 3a), while in Mahale, the male–male PIs were higher than the female–female and
male–female PIs (Figure 3b). These results support the predictions about differences in proximity
because of sex combinations between individuals. In addition, the eigenvector centralities of the social
networks based on the proximity for males in Mahale were higher than those for females in Mahale,
but no sex-specific differences were found in Tama (Figure 5). These results support the predictions
about differences in position and core formation in the social network due to the sex of individuals.
Figure 5. Comparisons of eigenvector centrality between males and females in each group. Error bars
indicate standard deviation. *** denotes a significance of p < 0.001, and N.S. denotes a nonsignificant
(p > 0.05).Animals 2020, 10, 1063 13 of 17
The results from the Mahale chimpanzees, in this study, suggest that the males form the core of the
multimale–multifemale group (Figure 4b), which is a finding that has often been reported in previous
studies of chimpanzee societies in the wild [25,45,64]. In contrast, male chimpanzees in captivity do
not need to cooperate, form a strong alliance with each other, or be aggressive toward other individuals
in the group for a higher status [32–34]. Most of the members in Tama were always in close proximity
to each other in their outside enclosures [65]. However, some of the combinations of individuals, such
as bo and de, mo and pc, or fu and pc, were not kept in the outside enclosure at the same time to
eliminate the possibility of accidents such as lethal struggles. Therefore, the PIs between them were all
0 (Table S2).
The differences in social relationships or social networks in Tama from those in Mahale could be
due to the lack of hostile external groups and fierce conflicts with group members [29,30,66], as well as
the need for alliances or the artificial migration system of individuals in zoos, which were different
from those in the wild [1,3,32].
5. Conclusions
In Tama, chimpanzees attempted extractive foraging for food resources from multiple feeders,
which suggests that the proportion of time spent foraging in total was closer to that of the wild
chimpanzees. Bringing the proportion of time spent foraging closer to that of the wild chimpanzees is
thought to inhibit the occurrence of abnormal behaviors [67], which was not observed in Tama. In
addition, the proportion of time spent traveling in Tama was also in the range of those of wild groups,
due to the three-dimensional structures or ropes between them in the outside enclosure, despite their
narrow ranging area.
Environmental enrichment can help to simulate environmental conditions seen in the wild which
can make the behavior of captive chimpanzees resemble that of wild groups. Thus, it is important to
assess environmental enrichment for captive chimpanzees in terms of whether their behavior resembles
that of wild groups, such as a high proportion of time spent foraging or traveling with no abnormal
behaviors. From this perspective, the environmental enrichment for chimpanzees in Tama can be
considered to have been successful [1,68,69]. The observed different social structures could be due
to the differences in the living conditions in which the two groups live. In addition, the behavior of
captive chimpanzees is generally limited by the available space and influenced by zookeepers, and
thus, tends to have limited options for behavioral decision making and social partners. However,
the idiosyncratic social grooming interactions found in Tama suggest that chimpanzees reared in a
restricted and potentially stressful environment can use mutual grooming to build and maintain social
cohesion and affiliative relationships [27,70].
Supplementary Materials: The following are available online at http://www.mdpi.com/2076-2615/10/6/1063/s1,
Table S1: Summary of the total number of total observation days and the total observation hours for each time
period of each focal individual for each group. Table S2: Proximity index (PI) matrix for all focal individuals in
Tama. The first quartile, mean, and third quartile were 0.0168, 0.0525, and 0.0653, respectively. Table S3: Proximity
index (PI) matrix for all focal individuals in Mahale. The first quartile, mean, and third quartile were 0.0560, 0.0745,
and 0.1296, respectively.
Author Contributions: This study was designed by N.I. for a graduate thesis for a bachelor degree under the
supervision of M.S.; the manuscript was originally written by N.I. in Japanese, and reviewed and translated into
English by M.S.; both authors collected behavioral data. Both authors have read and agreed to the published
version of the manuscript.
Funding: This work was supported by a MEXT Grant-in-Aid (KAKENHI) (grant numbers 19255008, 26284138,
17H06342).
Acknowledgments: We are grateful to the following zookeepers for their support of our study in Tama: Yurika
Kobayashi, Mizuho Noda, Kaori Itoh, Sumito Sato, and Tatsuya Hirakawa. We thank the Tanzania Commission
for Science and Technology (COSTECH), the Tanzania National Parks Authority (TANAPA), the Tanzania Wildlife
Research Institute (TAWIRI), the Mahale Mountains National Park (MMNP), and the Mahale Gombe Wildlife
Research Centre (MGWRC) for granting us permission to conduct research in Mahale.Animals 2020, 10, 1063 14 of 17
Conflicts of Interest: The authors declare no conflict of interest. The funders had no role in the design of the
study; in the collection, analyses, or interpretation of data; in the writing of the manuscript, or in the decision to
publish the results
References
1. Bloomsmith, M.A.; Brent, L.Y.; Schapiro, S.J. Guidelines for developing and managing an environmental
enrichment program for nonhuman primates. Lab. Anim. Sci. 1991, 41, 372–377.
2. Barber, J.C. Programmatic approaches to assessing and improving animal welfare in zoos and aquariums.
Zoo Biol. 2009, 28, 519–530. [CrossRef]
3. Buchanan-Smith, H.M. Environmental enrichment for primates in laboratories. Adv. Sci. Res. 2010, 5, 41–56.
[CrossRef]
4. Keeling, M.E.; Alford, P.L.; Bloomsmith, M.A. Decision analysis for developing programs of psychological
well-being: A bias-for-action approach. In Through the Looking Glass: Issues of Psychological Well-Being in
Captive Nonhuman Primates; Novak, M.A., Petto, A.J., Eds.; American Psychological Association: Washington,
DC, USA, 1991; pp. 57–65. [CrossRef]
5. Morimura, N. Note on effects of a daylong feeding enrichment program for Chimpanzees (Pan troglodytes).
Appl. Anim. Behav. Sci. 2007, 106, 178–183. [CrossRef]
6. Yamanashi, Y.; Matsunaga, M.; Shimada, K.; Kado, R.; Tanaka, M. Introducing tool-based feeders to
zoo-housed chimpanzees as a cognitive challenge: Spontaneous acquisition of new types of tool use and
effects on behaviours and use of space. J. Zoo Aquar. Res. 2016, 4, 147–155. [CrossRef]
7. Ochiai-Ohira, T.; Matsuzawa, T. Introduction of two wooden climbing frames as environmental enrichment
for captive chimpanzees (Pan troglodytes) and its assessment. Jpn. J. Anim. Psychol. 2001, 51, 1–9. [CrossRef]
8. Pruetz, J.D.; McGrew, W.C. What does a chimpanzee need? Using natural behavior to guide the care and
management of captive populations. In The Care and Management of Captive Chimpanzees; Brent, L.E., Ed.;
American Society of Primatologists: San Antonio, TX, USA, 2001; pp. 17–37.
9. Gilloux, I.; Gurnell, J.; Shepherdson, D. An enrichment device for great apes. Anim. Welf. 1992, 1, 279–289.
10. Shepherdson, J.D. Tracing the path of environmental enrichment in zoos. In Second Nature: Environmental
Enrichment for Captive Animals Shepherdson; Mellen, J.D., Hutchins, M., Eds.; Smithsonian Institution Press:
Washington, DC, USA, 1998; pp. 1–12.
11. Kaplan, H.; Hill, K.; Lancaster, J.; Hurtado, A.M. A theory of human life history evolution: Diet, intelligence,
and longevity. Evol. Anthropol. 2000, 9, 156–185. [CrossRef]
12. Matsuzawa, T. Field experiments on use of stone tools by chimpanzees in the wild. In Chimpanzee Cultures;
Wrangham, R.W., McGrew, W.C., de Waal, F.B.M., Heltne, P.G., Eds.; Harvard University Press: Cambridge,
MA, USA, 1994; pp. 351–370.
13. Nishida, T.; Hiraiwa, M. Natural history of a tool-using behavior by wild chimpanzees in feeding upon
wood-boring ants. J. Hum. Evol. 1982, 11, 73–99. [CrossRef]
14. Nishida, T.; Hasegawa, T.; Hayaki, H.; Takahata, Y.; Uehara, S. Meat-sharing as a coalition strategy by an
alpha male chimpanzee. Top. Primatol. 1992, 1, 159–174.
15. Newton-Fisher, N.E. The Hunting Behavior and Carnivory of Wild Chimpanzees; Springer: Berlin/Heidelberg,
Germany, 2015; pp. 1295–1320.
16. Tama Zoological Park. Chimpanzees Teach You What’s Important as a Human; Tokuma Shoten Publishing Co.:
Tokyo, Japan, 2011. (In Japanese)
17. Nishida, T. The ant-gathering behaviour by the use of tools among wild chimpanzees of the Mahali Mountains.
J. Hum. Evol. 1973, 2, 357–370. [CrossRef]
18. Nishie, H. Natural history of Camponotus ant-fishing by the M group chimpanzees at the Mahale Mountains
National Park, Tanzania. Primates 2011, 52, 329–342. [CrossRef]
19. Kakinuma, M.; Hamano, S.; Hatakeyama, H. Chimpanzee mother-child contact at infancy and later
exploratory behavior. Bull. Nippon Vet. Zootech. Col. 2003, 52, 11–17. (In Japanese)
20. Kakinuma, M.; Hatakeyama, H.; Tsuchida, A.; Nose, I. Diversities in the development of social, physical and
cognitive abilities of captive chimpanzees (Pan troglodytes) compared. Bull. Nippon Vet. Life Sci. Univ. 2015,
64, 13–19.Animals 2020, 10, 1063 15 of 17
21. Nakamura, M. Grooming hand-clasp in Mahale M group chimpanzees: Implications for culture in social
behaviors. In Behavioural Diversity in Chimpanzees and Bonobos; Boesch, C., Hohmann, G., Marchant, L.F., Eds.;
Cambridge University Press: Cambridge, UK, 2002; pp. 71–83.
22. Nakamura, M. ‘Gatherings’ of social grooming among wild chimpanzees: Implications for evolution of
sociality. J. Hum. Evol. 2003, 44, 59–71. [CrossRef]
23. Seyfarth, R.M. A model of social grooming among adult female monkeys. J. Theor. Biol. 1977, 65, 671–698.
[CrossRef]
24. Newton-Fisher, N.E.; Lee, P.C. Grooming reciprocity in wild male chimpanzees. Anim. Behav. 2011, 81,
439–446. [CrossRef]
25. Nishida, T. The social group of wild chimpanzees in the Mahali Mountains. Primates 1968, 9, 167–224.
[CrossRef]
26. Whiten, A.; Arnold, K. Grooming interactions among the chimpanzees of the Budongo Forest, Uganda: Tests
of five explanatory models. Behaviour 2003, 140, 519–552. [CrossRef]
27. de Waal, F.B.M. Chimpanzee Politics: Power and Sex Among Apes; John Hopkins University Press: Baltimore,
MD, USA, 1989.
28. Wrangham, R.W.; Smuts, B.B. Sex differences in the behavioural ecology of chimpanzees in the Gombe
National Park, Tanzania. J. Reprod. Fert. 1980, 28, 13–31.
29. Nishida, T. Alpha status and agonistic alliance in wild chimpanzees (Pan troglodytes schweinfurthii). Primates
1983, 24, 318–336. [CrossRef]
30. Nishida, T.; Kawanaka, K. Inter-unit-group relationships among wild chimpanzees of the Mahali Mountains.
Kyoto Univ. Afr. Stud. 1972, 7, 131–169.
31. Langergraber, K.; Mitani, J.; Vigilant, L. Kinship and social bonds in female chimpanzees (Pan troglodytes).
Am. J. Primatol. 2009, 71, 840–851. [CrossRef]
32. Baker, K.C.; Smuts, B.B. Social relationships of female chimpanzees. In Chimpanzee Cultures; Wrangham, R.W.,
McGrew, W.C., de Waal, F.B.M., Heltne, P.G., Eds.; Harvard University Press: Cambridge, MA, USA, 1994;
pp. 227–241.
33. de Waal, F.B.M. The chimpanzee’s adaptive potential: A comparison of social life under captive and wild
conditions. In Chimpanzee Cultures; Wrangham, R.W., McGrew, W.C., de Waal, F.B.M., Heltne, P., Eds.;
Harvard University Press: Cambridge, MA, USA, 1994; pp. 243–260.
34. Koski, S.E.; de Vries, H.; van de Kraats, A.; Sterck, E.H. Stability and change of social relationship quality in
captive chimpanzees (Pan troglodytes). Int. J. Primatol. 2012, 33, 905–921. [CrossRef]
35. Croft, D.P.; James, R.; Krause, J. Exploring Animal Social Networks; Princeton University Press: Princeton, NJ,
USA, 2008.
36. Nakamura, M.; Hosaka, K.; Itoh, N.; Zamma, K. (Eds.) Mahale Chimpanzees: 50 years of Research; Cambridge
University Press: Cambridge, UK, 2015.
37. Martin, P.; Bateson, P. Measuring Behaviour: An Introductory Guide, 3rd ed.; Cambridge University Press:
Cambridge, UK, 2007.
38. Nishida, T.; Zamma, K.; Matsusaka, T.; Inaba, A.; McGrew, W.C. Chimpanzee Behavior in the Wild: An
Audio-Visual Encyclopedia; Springer: Tokyo, Japan, 2010.
39. Birkett, L.P.; Newton-Fisher, N.E. How abnormal is the behaviour of captive, zoo-living chimpanzees? PLoS
ONE 2011, 6, e20101. [CrossRef]
40. Jacobson, S.L.; Ross, S.R.; Bloomsmith, M.A. Characterizing abnormal behavior in a large population of
zoo-housed chimpanzees: Prevalence and potential influencing factors. PeerJ 2016, 4, e2225. [CrossRef]
41. Nakamura, M. Grooming at a gathering. In Chimpanzees in Mahale: 37 years of Panthropology; Nishida, T.,
Uehara, S., Kawanaka, K., Eds.; Kyoto University Press: Kyoto, Japan, 2002; pp. 345–367. (In Japanese)
42. McGrew, W.C.; Tutin, C.E. Evidence for a social custom in wild chimpanzees? Man 1978, 13, 234–251.
[CrossRef]
43. McGrew, W.C. Chimpanzee Material Culture: Implications for Human Evolution; Cambridge University Press:
Cambridge, UK, 1992.
44. Nakamura, M.; Nishida, T. Ontogeny of a social custom in wild chimpanzees: Age changes in grooming
hand-clasp at Mahale. Am. J. Primatol. 2013, 75, 186–196. [CrossRef]
45. Shimada, M.; Sueur, C. The importance of social play network for infant or juvenile wild chimpanzees at
Mahale Mountains National Park, Tanzania. Am. J. Primatol. 2014, 76, 1025–1036. [CrossRef]Animals 2020, 10, 1063 16 of 17
46. Farine, D.R.; Whitehead, H. Constructing, conducting and interpreting animal social network analysis. J.
Anim. Ecol. 2015, 84, 1144–1163. [CrossRef]
47. Shimizu, H. An introduction to the statistical free software HAD: Suggestions to improve teaching, learning
and practice data analysis. J. Media Inf. Commun. 2016, 1, 59–73.
48. Borgatti, S.P.; Everett, M.G.; Freeman, L.C. UCINET 6 for Windows: Software for Social Network Analysis;
Analytic Technologies: Harvard, MA, USA, 2002.
49. Morimura, N.; Ueno, Y. Influences on the feeding behavior of three mammals in the Maruyama Zoo: Bears,
elephants, and chimpanzees. J. Appl. Anim. Welf. Sci. 1999, 2, 169–186. [CrossRef] [PubMed]
50. Fulk, R.; Garland, C. (Eds.) The Care and Management of Chimpanzees (Pan troglodytes) in Captive Environments.
A husbandry Manual Developed for the Chimpanzee Species Survival Plan; North Carolina Zoological Society:
Asheboro, NC, USA, 1992.
51. Boesch, C.; Boesch-Achermann, H. The chimpanzees of the Taï Forest: Behavioural Ecology and Evolution; Oxford
University Press: New York, NY, USA, 2000.
52. Kosheleff, V.P.; Anderson, C.N. Temperature’s influence on the activity budget, terrestriality, and sun exposure
of chimpanzees in the Budongo Forest, Uganda. Am. J. Phys. Anthropol. 2009, 139, 172–181. [CrossRef]
53. Potts, K.B.; Watts, D.P.; Wrangham, R.W. Comparative feeding ecology of two communities of chimpanzees
(Pan troglodytes) in Kibale National Park, Uganda. Int. J. Primatol. 2011, 32, 669–690. [CrossRef]
54. Green, S.J.; Boruff, B.J.; Niyigaba, P.; Ndikubwimana, I.; Grueter, C.C. Chimpanzee ranging responses to fruit
availability in a high-elevation environment. Am. J. Primatol. 2020, e23119. [CrossRef] [PubMed]
55. AZA Ape TAG. Chimpanzee (Pan troglodytes) Care Manual; Association of Zoos and Aquariums: Silver Spring,
MD, USA, 2010.
56. Sakamaki, T. Social grooming among wild bonobos (Pan paniscus) at Wamba in the Luo Scientific Reserve,
DR Congo, with special reference to the formation of grooming gatherings. Primates 2013, 54, 349–359.
[CrossRef]
57. Hare, B.; Yamamoto, S. (Eds.) Bonobos: Unique in Mind, Brain, and Behavior; Oxford University Press: New
York, NY, USA, 2017.
58. Furuichi, T. Factors underlying party size differences between chimpanzees and bonobos: A review and
hypotheses for future study. Primates 2009, 50, 197–209. [CrossRef]
59. Gomes, C.M.; Mundry, R.; Boesch, C. Long-term reciprocation of grooming in wild West African chimpanzees.
Proc. R. Soc. B. 2008, 276, 699–706. [CrossRef]
60. Fedurek, P.; Dunbar, R.I. What does mutual grooming tell us about why chimpanzees groom? Ethology 2009,
115, 566–575. [CrossRef]
61. Bonnie, K.E.; de Waal, F.B. Affiliation promotes the transmission of a social custom: Handclasp grooming
among captive chimpanzees. Primates 2006, 47, 27–34. [CrossRef]
62. Whiten, A.; Goodall, J.; McGrew, W.C.; Nishida, T.; Reynolds, V.; Sugiyama, Y.; Tutin, C.E.G.; Wrangham, R.W.;
Boesch, C. Cultures in chimpanzees. Nature 1999, 399, 682–685. [CrossRef] [PubMed]
63. Whiten, A.; Goodall, J.; McGrew, W.C.; Nishida, T.; Reynolds, V.; Sugiyama, Y.; Tutin, C.E.G.; Wrangham, R.W.;
Boesch, C. Charting cultural variation in chimpanzees. Behaviour 2001, 138, 1481–1516. [CrossRef]
64. Mitani, J.C. Male chimpanzees form enduring and equitable social bonds. Anim. Behav. 2009, 77, 633–640.
[CrossRef]
65. Bloomsmith, M.A.; Baker, K.C.; Ross, S.R.; Lambeth, S.P. Early rearing conditions and captive chimpanzee
behavior: Some surprising findings. In Nursery Rearing of Nonhuman Primates in the 21st Century; Sackett, G.P.,
Ruppentahal, G.C., Elias, K., Eds.; Springer: Boston, MA, USA, 2006; pp. 289–312.
66. Watts, D.P.; Mitani, J.C. Boundary patrols and intergroup encounters in wild chimpanzees. Behaviour 2001,
138, 299–327. [CrossRef]
67. Reinhardt, V.; Roberts, A. Effective feeding enrichment for non-human primates: A brief review. Anim. Welf.
1997, 6, 265–272.
68. Morimura, N. A note on enrichment for spontaneous tool use by chimpanzees (Pan troglodytes). Appl. Anim.
Behav. Sci. 2003, 82, 241–247. [CrossRef]Animals 2020, 10, 1063 17 of 17
69. Bloomsmith, M.A.; Alford, P.L.; Maple, T.L. Successful feeding enrichment for captive chimpanzees. Am. J.
Primatol. 1988, 16, 155–164. [CrossRef]
70. De Waal, F. Mama’s Last Hug: Animal Emotions and what They Tell Us about Ourselves; WW Norton & Company:
New York, NY, USA, 2019.
© 2020 by the authors. Licensee MDPI, Basel, Switzerland. This article is an open access
article distributed under the terms and conditions of the Creative Commons Attribution
(CC BY) license (http://creativecommons.org/licenses/by/4.0/).You can also read