Suitability of Image Analysis in Evaluating Air and Water Permeability of Soil
←
→
Page content transcription
If your browser does not render page correctly, please read the page content below
agronomy
Article
Suitability of Image Analysis in Evaluating Air and Water
Permeability of Soil
Maja Bryk             and Beata Kołodziej *

                                          Institute of Soil Science and Environment Management, University of Life Sciences in Lublin, Leszczyńskiego 7,
                                          20-069 Lublin, Poland; maja.bryk@up.lublin.pl
                                          * Correspondence: beata.kolodziej@up.lublin.pl; Tel.: +48-815-248-148; Fax: +48-815-248-150

                                          Abstract: A comprehensive understanding of the water and air permeability of soil is necessary
                                          for modelling the transport properties which depend on soil structure. We aimed to evaluate the
                                          suitability of image analysis to estimate gas and liquid transport in soil using resin-impregnated soil
                                          blocks. The soil texture, TOC, density, porosity, air capacity (VV), air permeability (logAP), and the
                                          saturated hydraulic conductivity (logKS ) of a Cambisol developed from loess were measured. To
                                          characterise the pores, using the soil structure images, we determined the macroporosity (AA), index
                                          of soil pore-network growth rate, percolation number (lognPER ), length of pore path/unit area (PLA),
                                          and relative volume of pores overlapping top and/or bottom edge of the image (VTB). logKS and
                                          logAP related to morphometric parameters of soil structure derived from the image analysis. The
                                          main factor controlling the soil’s infiltration was the total volume of soil pores (VV and AA). AA,
                                          PLA, VTB, and lognPER were equally useful for characterising the soil pore system. These results
                                          will contribute to more accurate estimations of gas and liquid transport in soils and allow to obtain
                                          historical hydraulic properties and model long-term trends in the soil water regime based on the
                                          existing collections of thin sections and polished blocks.


                                   Keywords: aeration; saturated hydraulic conductivity; image analysis of soil porosity; loess

Citation: Bryk, M.; Kołodziej, B.
Suitability of Image Analysis in
Evaluating Air and Water
                                          1. Introduction
Permeability of Soil. Agronomy 2021,
11, 1883. https://doi.org/                      A comprehensive understanding of the water and air permeability of soil is necessary
10.3390/agronomy11091883                  for modelling transport properties that govern numerous environmental processes and
                                          functions, including groundwater horizontal and vertical flow, transport of dissolved nutri-
Received: 21 August 2021                  ents and contaminants, and soil aeration. This is particularly useful in water management
Accepted: 17 September 2021               for assessing the water and air demand of vegetation, preventing environmental pollution,
Published: 19 September 2021              and irrigation practice, which is in line with the United Nations Sustainable Development
                                          Goal 6 [1].
Publisher’s Note: MDPI stays neutral            Various methods have been used to obtain the water and air permeability of soil. A
with regard to jurisdictional claims in   satisfactory alternative to costly and time-consuming direct measurements is pedotransfer
published maps and institutional affil-   functions that utilise easy-obtainable basic soil parameters, such as texture, soil organic mat-
iations.                                  ter content, and bulk density [2]. However, the water and air permeability of soil depend
                                          on its structure, which is shaped not only by soil properties, such as texture, organic matter,
                                          carbonates, clay minerals, and sesquioxides but also by external conditions [3]. This means
                                          that even if a soil has the same physical and physicochemical properties, different struc-
Copyright: © 2021 by the authors.         tures are possible if external factors affect the soil or act in a different way. The resulting
Licensee MDPI, Basel, Switzerland.        arrangement of soil structural elements can be assessed by direct measurement methods,
This article is an open access article    such as imaging techniques using computed tomography or resin-impregnated soil blocks
distributed under the terms and           and thin sections. Various studies have used these soil preparations when conducting soil
conditions of the Creative Commons        structure assessments, e.g., [4–13]. Morphological and morphometric analyses of the soil
Attribution (CC BY) license (https://
                                          structure can significantly improve the understanding of the retention and transport pro-
creativecommons.org/licenses/by/
                                          cesses in soils, e.g., [14–18]. In particular, a morphometric analysis of soil structure images
4.0/).

Agronomy 2021, 11, 1883. https://doi.org/10.3390/agronomy11091883                                          https://www.mdpi.com/journal/agronomy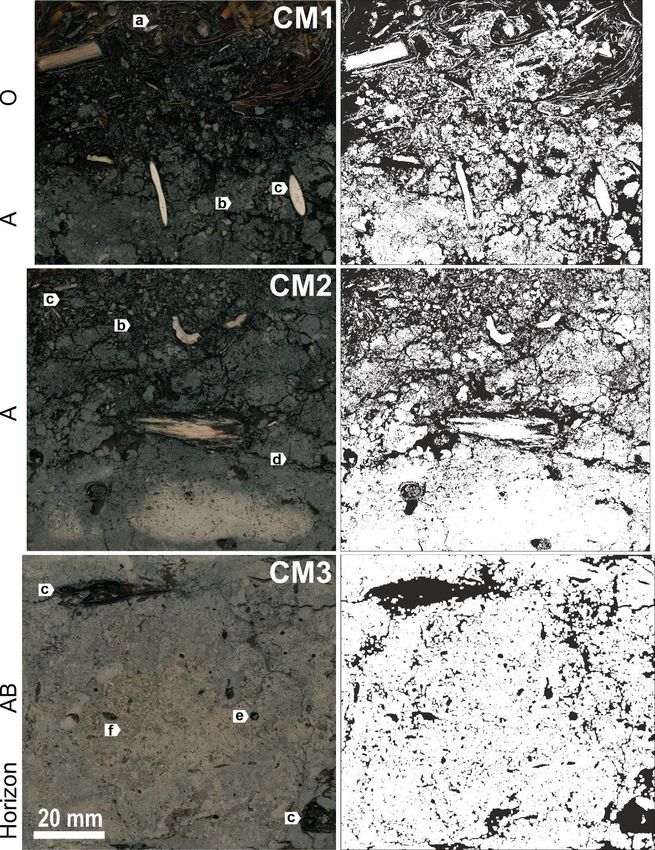
Agronomy 2021, 11, 1883                                                                                            2 of 18

                          allows for the quantification of structural parameters, and the identification of relationships
                          between structure and physical properties, such as air and water permeability, and water
                          retention. Bouma et al. [19] quantified large thin sections by examining the impact of
                          macropores on the saturated flow through clay soil. Vogel and Roth [20,21] investigated
                          the applicability of pore-size distribution and pore connectivity in reconstructed three-
                          dimensional representations of the pore space in order to predict essential characteristics
                          of soil hydraulic properties. Pagliai et al. [22,23] and Pagliai and Kutílek [24] studied the
                          correlations between saturated hydraulic conductivity (logKS ) and differently shaped pores
                          in soils under various management practices. Quinton et al. [25] investigated the effects of
                          active porosity and specific pore perimeters on the hydraulic conductivity of peat using
                          a digital image analysis of resin-impregnated samples. Bryk [26] revealed mathematical
                          relationships between air and water permeability pore and solid-phase element number,
                          and area in compaction index classes. Fernández et al. [27] measured the macropore shape
                          via image analysis of thin sections and found that hydraulic conductivity and infiltration
                          rate increased with an increasing number of elongated and irregular macropores.
                                 Although some of these studies indicated that the pore shape may affect air and water
                          permeability, we believe that pore size and connectivity are decisive for soil transport
                          properties. In our earlier study of the Chernozem [28], we developed a methodology for
                          assessing soil transport properties using correlations between the laboratory-assessed water
                          and air permeability and morphometric indices of a soil pore system obtained from large
                          resin-impregnated blocks. This study aims to re-examine this approach for a Cambisol
                          in order to further evaluate the suitability of image analysis for the estimation of gas and
                          liquid transport in soil. We hypothesise that there are: (i) relationships between water
                          and air permeability and structural parameters, and (ii) relationships between texture,
                          particle and bulk density, total porosity, air capacity, total organic carbon and structural
                          parameters. Based on this, the air and water permeability (AP and KS ), texture (cS , cSI ,
                          cC ), particle and bulk density (ρS and ρD ), total porosity (PO ), air capacity (VV), and total
                          organic carbon (TOC) of a forest Eutric Cambisol developed from loess were measured.
                          To characterise the pores, we used soil structure images to determine the macroporosity
                          (AA), index of soil pore-network growth rate (vG ), percolation number (lognPER ), length
                          of pore path/unit area (PLA), and relative volume of pores overlapping the top and/or
                          bottom edges of the image (VTB). The relationships among the morphometric, physical,
                          and chemical parameters were examined using a linear regression model.

                          2. Materials and Methods
                          2.1. Material
                               This study was conducted on an Eutric Cambisol developed from loess, which con-
                          tains a sequence of horizons O-A-AB-Bw-BC-C-Ck, located in Wola Gródecka (50◦ 290 4300 N,
                          23◦ 370 0300 E, SE Poland) in a mesophytic deciduous forest composed of oak Quercus robur
                          and Q. petraea, hornbeam Carpinus betulus, and lime Tilia cordata–plant community Tilio-
                          Carpinetum Tracz. 1962. The samples were collected in 2010 from seven soil layers repre-
                          senting distinguished genetic horizons at a depth of 0–146 cm (Table 1). We took the soil
                          samples with disturbed structure (in bags), core samples (in metal cylinders, Figure 1a),
                          and samples of preserved structure (in metal boxes, Figure 1b).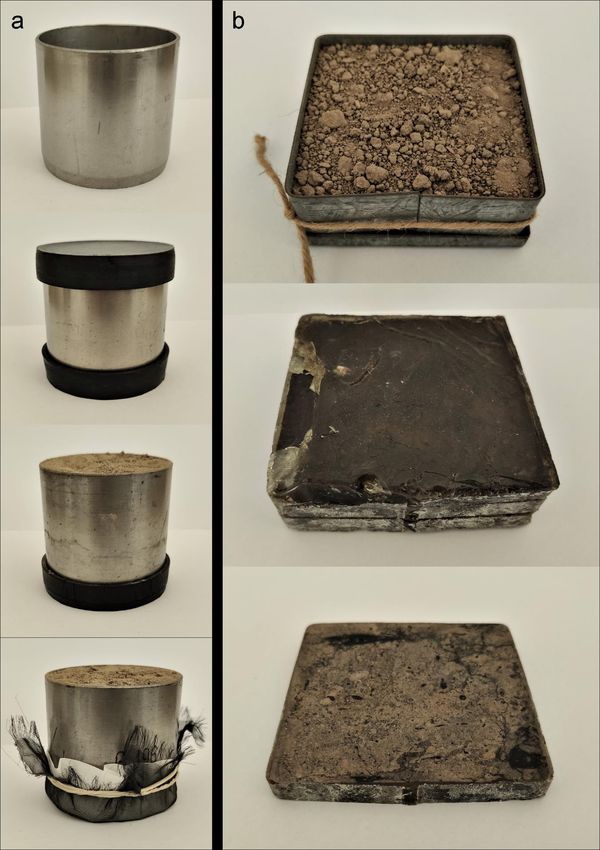
Agronomy 2021, 11, 1883                                                                                                               3 of 18

                                Table 1. Selected physical and chemical properties of the studied Cambisol.

       Layer                  CM1              CM2               CM3              CM4                 CM5        CM6           CM7
      Horizon                 O-A               A                 AB               Bw                  BC          C             Ck
  Horizon depth
                          0–5 – 5–10/15      5–10/15          10/15–30/45       30/45–67              67–85    85–120/135    >120/135
         (cm)
 Sampling depth                                                                 50–58 and         70–78 and
                              0–8              6–14              20–28                                          100–108       138–146
         (cm)                                                                     54–62             74–82
 Sand, cS (g g−1 )              –              0.210             0.180            0.180             0.170        0.180         0.130
  Silt, cSI (g g−1 )            –              0.720             0.720            0.590             0.650        0.665         0.750
 Clay, cC (g g−1 )              –              0.070             0.100            0.230             0.180        0.155         0.120
  TOC (mg g−1 )               316.8             26.3               6.3              2.9               2.9         1.6           3.5
 CaCO3 (mg g−1 )                0                0                  0                0                 0           0            110
       pHH2O                  5.68              5.72              4.77             5.51              6.07        6.52          8.17
        pHKCl                 5.37              5.21              4.06             4.16              4.71        5.03          7.95
 Bulk density, ρD
                           0.44 ± 0.10      0.90 ± 0.07       1.31 ± 0.04      1.44 ± 0.01       1.44 ± 0.01   1.38 ± 0.04   1.45 ± 0.03
     (g cm−3 )
 Particle density,
                              1.48             2.55              2.61              2.62               2.66        2.66          2.65
   ρS (g cm−3 )
  Total porosity,
                              0.703            0.647             0.498            0.450               0.459      0.481         0.453
  PO (cm3 cm−3 )
                                              Note: ρD values are mean ± standard deviation, n = 6.

                                      2.2. Laboratory Tests
                                            Samples with a disturbed structure were used to determine the soil texture (sand
                                      0.05–2 mm, cS ; silt 0.002–0.05 mm, cSI ; and clay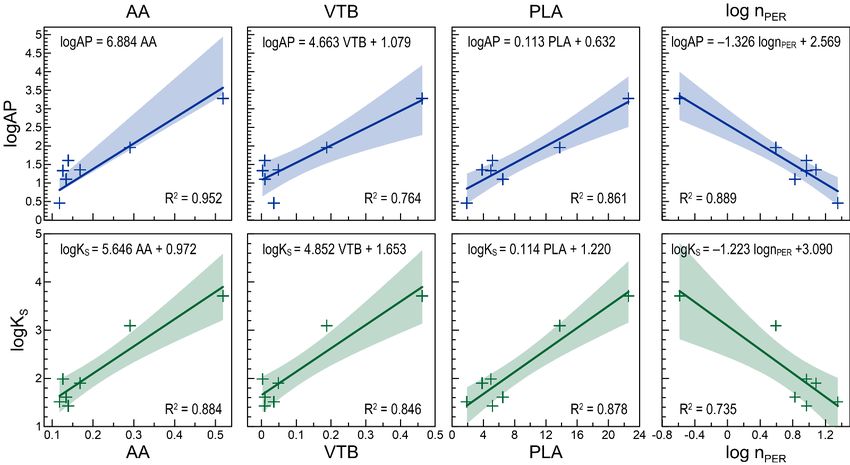
Agronomy 2021, 11, 1883                                                                                                              4 of 18
   Agronomy 2021, 11, x FOR PEER REVIEW                                                                                           3 of 18

         Figure 1. (a) Photograph of a steel cylinder measuring ca. 5 cm × 5.1 cm (diameter × height) used to determine air and
     Figure 1. (a) Photograph of a steel cylinder measuring ca. 5 cm × 5.1 cm (diameter × height) used to determine air and
         water content, air permeability, hydraulic conductivity, and soil bulk density. (b) Photograph of a metal box used to take
     water
         soilcontent,
              samples air
                      withpermeability,  hydraulicbelow–a
                             a preserved structure; conductivity, and
                                                           block of   soil
                                                                    soil   bulk density.
                                                                         measuring        (b)×Photograph
                                                                                   ca. 8 cm    9 cm × 4 cm of a metal
                                                                                                           (CM3)      box used with
                                                                                                                  impregnated  to take
     soilasamples  with   a preserved  structure; below–a block of soil measuring  ca. 8 cm  ×  9 cm ×  4 cm  (CM3) impregnated
           resin solution with two cuts visible and an exemplary slice (CM3g) measuring ca. 8 cm × 9 cm × 1 cm with polished     with
         surfaces
     a resin      readywith
              solution        two cuts visible and an exemplary slice (CM3g) measuring ca. 8 cm × 9 cm × 1 cm with polished
                         for scanning.
     surfaces ready for scanning.
Agronomy 2021, 11, 1883 5 of 18
2.3. Preliminary Image Analysis
Based on the aforementioned layers (Table 1), two samples with a preserved structure
were obtained from the vertical plane of the soil profile and placed into metal boxes
measuring 8 cm × 9 cm × 4 cm (height × width × depth, Figure 1b), with the 8 cm × 9 cm
side facing forward. Soil samples were dried at room temperature and then impregnated
with a resin solution following a previously described method [28]. After hardening, each
soil sample was cut twice to form approximately 8 cm × 9 cm × 1 cm slices,5 which
Agronomy 2021, 11, x FOR PEER REVIEW of 18 revealed
four inner surfaces that were then polished. Some sides were not suitable for image
analysis because of damaged edges. For each tested layer CM2, CM4, CM5 and CM1, CM3,
four inner
CM6, CM7,surfaces that wereeight
respectively then polished.
and seven Some sides
soil werefaces
block not suitable for image anal-8 cm × 9 cm
of approximately
ysis because of damaged edges. For each tested layer CM2, CM4,
were obtained. Then, the soil block faces were scanned using an Epson CM5 and CM1, CM3,
Perfection 1200
CM6, CM7, respectively eight and seven soil block faces of approximately 8 cm × 9 cm
Photo scanner at a resolution of 1200 dpi × 1200 dpi with 24-bit colour depth. Each
were obtained. Then, the soil block faces were scanned using an Epson Perfection 1200
image
Photo was approximately
scanner at a resolution of4000
1200pixels × 4000
dpi × 1200 pixels.
dpi with 24-bitPictures of the
colour depth. representative
Each image soil
blocks for each layer are shown in Figure 2. Based on the soil blocks and
was approximately 4000 pixels × 4000 pixels. Pictures of the representative soil blocks for their enlarged
photos, a morphological
each layer are shown in Figurestructure
2. Basedanalysis of blocks
on the soil the tested Cambisol
and their enlargedwas performed.
photos, a The
macrostructure was described
morphological structure analysis of using terminology
the tested Cambisol was provided
performed.byThe Aguilar et al. [34] and
macrostruc-
ture ńska-Jurkiewicz
Słowi was described using et terminology
al. [9]. provided by Aguilar et al. [34] and Słowińska-
Jurkiewicz et al. [9].
Figure 2. Cont.Agronomy 2021, 11, 1883 6 of 18
Agronomy 2021, 11, x FOR PEER REVIEW 6 of 18
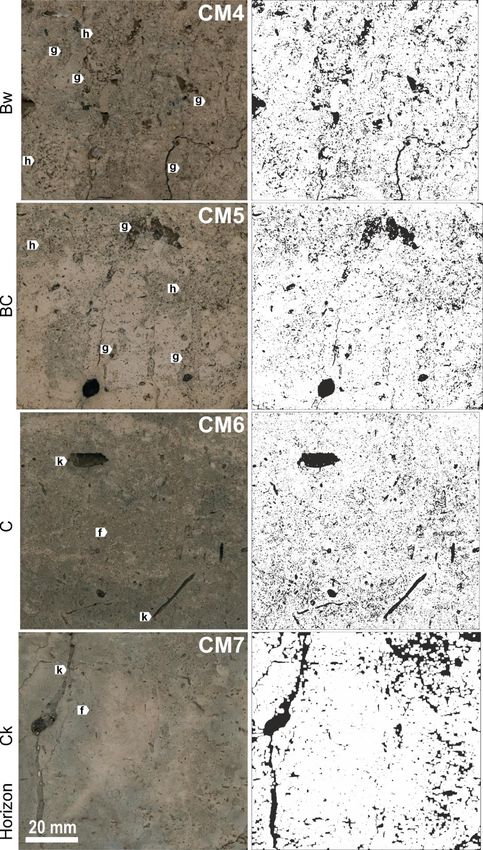
Figure 2. Representative images of the Cambisol macrostructure (left panel) and the corresponding
Figure Representative
2.images
binary images
(right panel), of the
wherein theCambisol macrostructure
pores are marked (left
with black. panel) and
Characteristic the corresponding
features of the
binary images (right panel), wherein the pores are marked with black. Characteristic
Cambisol structure: a–not fully decayed and loosely arranged plant remnants; b–crumbs in a con-features of
the Cambisol structure: a–not fully decayed and loosely arranged plant remnants; b–crumbs in
a continuous pore space; c–roots and plant remnants; d–sub-angular blocks separated by planes;
e–biogenic channels; f–vughs; g–bioturbations visible as channels filled with aggregates; h–zones of
aggregate structure; and k–zoogenic channels.Agronomy 2021, 11, 1883 7 of 18
In the next step, the blue channel was isolated from the colour images as it had the best
contrast. The obtained images were recorded in 256 grey levels, with prior improvement of
their contrast and intensity. The subsequent operations on the images were made using the
image analysis program Aphelion [35]. First, the images were given thresholds, wherein
the threshold level, which is the limit value of the grey level between the solid phase and
pores, was selected manually based on the brightness histogram and visual evaluation of
the enlarged soil block photo. In the obtained binary (black and white) images, the pores
were marked with white, while the solid phase sections were marked with black. In total,
7–8 binary images were prepared for each layer (CM1–CM7). The white objects, which
denote the pore cross-sections, were then subjected to a series of morphological operations.
First, the binary images were closed. The morphological closing operation was per-
formed on 17 levels, i.e., which involved the square structuring elements sized from 1 to
17. For each image in each layer at each of the closed 0–17 levels, the soil macroporosity
was measured as the ratio of the area occupied by the pore cross-sections over the area
of the entire image. Then, for each soil layer (CM1–CM7) at each closing level (0–17), the
mean macroporosity was calculated using seven or eight closed binary images. In this
respect, under the laws of stereology [36], the relative area of the obtained macropores
(AA) was equal to the relative volume of the macropores in the analysed soil samples.
Therefore, the AA values would be further expressed in cm3 cm−3 . The selected scanning
resolution limited the minimum diameter of the measured object to 21.2 µm. Therefore, the
AA value corresponded to the relative volume of the pores with an equivalent diameter
greater than 21.2 µm. The AA could therefore be related to the macroporosity measured at
a soil water potential of −15 kPa, which corresponds to the shares of pores with equivalent
diameters above approximately 20 µm (VV). Then, for each soil layer, the mean AA at
the 0–17 closing levels and VV were compared, wherein the closing level was selected to
pair the most similar values of macroporosities obtained via image analysis, AA, and via
laboratory measurement, VV. We obtained the following set of binary images representing
the analysed layers of the Cambisol: CM1-c0, CM2-c0, CM3-c10, CM4-c4, CM5-c4, CM6-c4,
and CM7-c17 (Figure 2), wherein the suffixes -c0, . . . , -c17 denote the level of closing.
2.4. Extended Image Analysis
For each image, the morphological operations and calculations were performed on
the pore cross-sections and then the means for each layer were calculated. First, a series of
dilations were performed by increasing the size of the square structuring element from k
= 1 to n. The dilations began from the relevant image’s initial AA and terminated when
macroporosity reached 1, in order to determine the number of dilations, n. This allowed
us to calculate the vG (cm3 cm−3 ), which reflects the spatial distribution of soil pores. The
growth-rate index was calculated as: vG = (1 − AA)/n.
Then, the number of dilation steps (nPER ) was assessed at which all the soil pores
merged into a continuous network during the execution of a series of dilations, wherein the
square structuring element was sized from k = 1 to n. This phenomenon was accompanied
by changing the Euler’s number sign (connectivity number, ε) for the binary image from
positive to negative [37–39]. The nPER parameter depends on the arrangement of pore
cross-sections. It was assumed that the nPER [40,41] corresponded to ε = 0. To calculate the
nPER , the lowest positive εk value, the highest negative εk+1 value, and the corresponding nk
and nk+1 values were determined. Subsequently, by solving the set of two linear equations
with the two unknowns a, b: nk = a·εk + b; nk+1 = a·εk+1 + b; and assuming that for ε = 0
and nPER = b, the following was calculated: nPER = nk − εk [(nk+1 − nk )/(εk+1 − εk )] = nk −
[εk /(εk+1 − εk )].
The length of the pore path/unit area (PLA, cm cm−2 ) was measured after determining
the minimal skeleton of the pore systems in the images.
The volumes of the pores intersecting the 10-pixel-wide edge of the image were also
calculated. As such pores may be construed as coming into contact with the externalAgronomy 2021, 11, 1883 8 of 18
environment, they can introduce water and air into the soil sample. The VTB (cm3 cm−3 )
was also determined.
2.5. Statistical Analyses Laboratory Tests
A one-way analysis of variance (ANOVA) was used to compare the measured param-
eters for layers CM1–CM7. Subsequently, a Tukey’s honestly significant difference test was
performed at p < 0.05. The soil parameters logKS , logAP, and VV were measured with
six replicates for each studied layer. The morphometric parameters AA, VTB, lognPER , vG ,
and PLA were assessed using the soil structure images, with seven replicates for the CM1,
CM3, CM6, and CM7 layers, and eight replicates for the CM2, CM4, and CM5 layers. A
principal component analysis (PCA) was performed to examine the relationships between
the studied parameters and layers. Linear regressions were then calculated to further
evaluate the parameter relationships obtained from image analysis, including AA, VTB,
lognPER , vG , and PLA, as well as the values of the parameters obtained from laboratory
measurements, including cS , ρD , ρS , PO , logKS , logAP, VV. The regressions were estimated
for seven pairs of variables (CM1–CM7), except for the relationships with cS , in which six
pairs of variables were tested (CM2–CM7). As there was a large range of air and water
permeability values, logarithmic data were used. The statistical analyses were executed in
the R software environment [42].
3. Results
3.1. Macrostructure
Representative images of the Cambisol macrostructure and their corresponding binary
images are shown in Figure 2 (left and right panel, respectively). In the organic horizon O
of the soil (the upper part of the CM1 layer), plant remnants (a) that were not fully decayed
and loosely arranged were visible. The dark mineral horizon A (the lower part of the CM1
layer; CM2 layer), located directly underneath the organic layer, showed an aggregate
structure with strongly-developed crumbs in the continuous pore space (b), wherein roots
and plant remnants were also discernible (c). In some zones, the soil groundmass was
separated by planes creating sub-angular blocks (d). The CM3 layer exhibited higher
compaction, with zones of non-aggregate structure with biogenic channels (e) and tiny
vughs typical of loess (Agronomy 2021, 11, 1883 9 of 18
Table 2. Water and air properties and morphometric parameters for the studied Cambisol. Results of 1-way ANOVA; for each parameter, different letters denote statistically different
values between layers at p < 0.05 according to Tukey’s honestly significant difference test.
Macroporosity Relative Volume of Pores Pore-Network
Air Hydraulic Relative Length
by Image Air Capacity, overlapping the Top and Growth-Rate, Percolation
Layer Horizon Permeability, Conductivity, of Pore Path,
Analysis, AA VV (cm3 cm–3 ) Bottom Edge of the Image, vG (×10–3 Number, nPER
logAP logKS PLA (cm cm–2 )
(cm3 cm–3 ) VTB (cm3 cm–3 ) cm3 cm–3 )
CM1 O-A 0.5183 ± 0.0379 0.332 ± 0.064 3.278 ± 0.609 3.710 ± 0.290 22.558 ± 0.600 0.4624 ± 0.0577 6.40 ± 1.36 0.26 ± 0.45
c c c c d c ab a
CM2 A 0.2905 ± 0.1038 0.224 ± 0.052 1.956 ± 1.046 3.092 ± 1.386 13.770 ± 4.383 0.1874 ± 0.1276 6.07 ± 1.93 3.93 ± 3.19
b b b bc c b a b
CM3 AB 0.1681 ± 0.0459 0.165 ± 0.016 1.354 ± 0.852 1.900 ± 0.860 3.835 ± 0.976 0.0482 ± 0.0472 8.51 ± 1.32 12.22 ± 2.67
a ab ab ab ab a ab d
CM4 Bw 0.1391 ± 0.0287 0.141 ± 0.016 1.603 ± 0.187 1.427 ± 0.854 5.168 ± 0.965 0.0093 ± 0.0101 10.91 ± 1.85 9.31 ± 1.61
a a b a b a bc cd
CM5 BC 0.1262 ± 0.0224 0.131 ± 0.008 1.329 ± 0.193 1.985 ± 1.110 4.960 ± 0.815 0.0030 ± 0.0019 9.99 ± 2.30 9.32 ± 1.63
a a ab ab b a abc cd
CM6 C 0.1341 ± 0.0216 0.135 ± 0.024 1.099 ± 0.396 1.611 ± 0.127 6.501 ± 0.853 0.0100 ± 0.0184 14.60 ± 2.55 6.72 ± 0.92
a a ab ab b a c bc
CM7 Ck 0.1179 ± 0.0288 0.117 ± 0.020 0.458 ± 0.046 1.514 ± 0.148 1.890 ± 0.257 0.0353 ± 0.0410 6.38 ± 1.18 23.25 ± 2.60
a a a a a a ab e
Note: values are mean ± standard deviation; n = 6 for VV, logAP, logKS ; n = 7 for AA, PLA, VTB, vG , nPER in CM1, CM3, CM6, CM7, and n = 8 for these parameters in CM2, CM4, CM5; AP in 10−8 m2 Pa−1 s−1 ;
KS in cm d−1 .Agronomy 2021, 11, 1883 10 of 18
The air permeability, logAP, in the Cambisol pedon was the highest in the superficial
soil layer encompassing the O–A horizons. From a statistical perspective, the logAP values
were similar in the other horizons. However, these values generally decreased with depth.
The relative volume of air-filled pores at −15 kPa, VV, decreased slowly with depth and,
Agronomy 2021, 11, x FOR PEER REVIEW 10 of 18
similar to the aforementioned parameters, the largest values were observed in the upper
horizons of O and A.
3.3. Morphometric Characteristics of Soil Pores and Their Relationship with Chemical and Physical
3.3. Properties
Soil Morphometric Characteristics of Soil Pores and Their Relationship with Chemical and
Physical Soil Properties
For the binary images (Table 2, Figure 2), the morphometric parameters were deter-
mined Fortothe binary images
characterise (Table 2,and
the volume Figure 2), the morphometric
arrangement parameters
of the soil pores. were deter-
The relationship
mined tothe
between characterise the volume
image analysis and
results andarrangement of the
the laboratory soil pores. The
measurements of relationship be-
selected chemi-
tween the image analysis results and the laboratory measurements of selected
cal and physical soil properties was verified using PCA (Figure 3) and linear regression chemical
and physical
equations soil 3).
(Table properties was verified using PCA (Figure 3) and linear regression equa-
tions (Table 3).
Figure 3. Principal component analysis (PCA) (a) loading and (b) score plot of Cambisol physicochemical (in red) and
Figure 3. Principal component analysis (PCA) (a) loading and (b) score plot of Cambisol physicochemical (in red) and
morphometric parameters (in black) and soil layers (in blue). logAP–air permeability at −15 kPa; PLA–relative length of
morphometric parameters (in black) and soil layers (in blue). logAP–air permeability at −15 kPa; PLA–relative length
pore path; TOC–total organic carbon; VV–air content at −15 kPa; AA–macroporosity by image analysis; VTB–relative vol-
of
umepore
of path;
poresTOC–total organic
overlapping carbon;
the top VV–airedge
and bottom content at −image;
of the 15 kPa;Po–total
AA–macroporosity by image analysis;
porosity; logKs–hydraulic VTB–relative
conductivity; vG–
volume
pore-network growth-rate; rhoD–bulk density; rhoS–particle density; lognPER–percolation number; and conductivity;
of pores overlapping the top and bottom edge of the image; Po–total porosity; logKs–hydraulic CM1…CM7–
vG–pore-network growth-rate;
Cambisol layers 1…7, rhoD–bulk density; rhoS–particle density; lognPER–percolation number; and CM1 . . .
respectively.
CM7–Cambisol layers 1 . . . 7, respectively.
The PCA model of the physicochemical and morphometric parameter results ex-
plained 95.65% of the data variation, wherein the first principal component (PC1) ex-
plained that 88.03% of the variance was controlled by almost all variables, and the second
component (PC2) explained 7.62% of the variance, in which the most important variable
was the vG.
The plot for the variable loadings (Figure 3a) revealed their correlation structure. In
particular, three groups of variables were distinguishable. The first group included logAP,
PLA, TOC, VV, AA, VTB, PO, and logKS, which were strongly negatively correlated with
the PC1. The second group comprised ρD, ρS, and lognPER which were strongly positively
correlated with the PC1. Both of these groups were located on opposite sides of the graph,
revealing a strong negative correlation between them. The third group comprised only vG
which was strongly positively correlated with the PC2, and weakly correlated with the
other groups. The vectors of all the variables practically reached the unit circle, indicating
their high impact on the PCs.
The score plot (Figure 3b) revealed three distinct groups of soil layers: CM1, CM2,
and CM3–CM7. Specifically, the distant location of the organic CM1 was observable as it
differed from other layers, particularly in terms of TOC and ρD. Further, the arrangement
of the points on the plot reflected the TOC and ρD values for the layers tested. In particular,
the points of the layers with high TOC or ρD values were located on the same side of theAgronomy 2021, 11, 1883 11 of 18
Table 3. Relationships among physicochemical and morphometric parameters. ρS –particle density; ρD –bulk density;
PO –total porosity; cS –sand; TOC–total organic carbon; VV–air capacity at −15 kPa; AP–air permeability at −15 kPa; KS –
hydraulic conductivity; AA–macroporosity by image analysis; PLA–relative length of pore path; nPER –percolation number;
VTB–relative volume of pores overlapping the top and bottom edge of the image.
Linear Regression Equations R2 p Linear Regression Equations R2 p
VV = −0.163 ** ρS + 0.578 *** 0.823 0.0027 lognPER = 1.376 ** ρS − 2.640 ** 0.869 0.0014
VV = −0.197 *** ρD + 0.413 *** 0.981Agronomy 2021, 11, 1883 12 of 18
lengths of the pore path, PLA, were closely associated with the VV values, as the length of
pores is strongly dependent on the relative area, as well as the volume, of the pore system.
The relative volume of the air-filled pores, VV, was strongly negatively related to
the bulk density, ρD (Table 3). An opposite relationship was observed between VV and
PO because of the strong negative correlation between ρD and PO (PO = −0.264 *** ρD
+ 0.842 ***, R2 = 0.953 at p = 0.0001). The volume of the air-filled pores increased with
increasing sand (cS ), and increasing organic matter (TOC) or decreasing particle density (ρS )
because the latter two parameters were correlated (TOC = −269.835 *** ρS + 715.650 ***, R2
= 0.998 at p < 0.0001). As VV, AA, PLA, and VTB were strongly correlated, the relationships
between VV and the physicochemical soil properties could be generally transferred to these
morphometric parameters, and the relevant correlations listed in Table 3 do not require
further discussion.
The Cambisol hydraulic conductivity, logKS , was found to depend on the total soil
pore volume, as described by PO (Table 3). However, stronger relationships were noted
Agronomy 2021, 11, x FOR PEER REVIEW
between the air and water permeabilities, logKS and logAP, and the air-filled12pores, of 18 VV.
Consequently, logKS and logAP exhibited similar correlations as VV with ρD , ρS , and TOC.
Of particular interest were the relationships between the parameters characterising
Of ability
the soil’s particularto interest were
transport the relationships
water and air (logK between
S and the parameters
logAP) and the characterising
pore-describing
the soil’s ability
parameters to transport
obtained water
from the and analysis
image air (logKS (Figure
and logAP) and the
4, Table 3).pore-describing
The logAP and pa- logKS
hadrameters obtained
comparable from the image
relationships analysis
with (Figure 4, Tableparameters
the morphometric 3). The logAPofandthelogK
soilS had
structure.
Thecomparable relationships
image analysis withthat
revealed the the
morphometric
logKS andparameters
logAP were of the soil structure.
strongly relatedThe im- PLA,
to AA,
age analysis revealed that the logKS and logAP were strongly related to AA, PLA, VTB,
VTB, and the lognPER (Figure 4). In most cases, with the exception of VTB, the observed
and the lognPER (Figure 4). In most cases, with the exception of VTB, the observed relation-
relationships were stronger for logAP than for logKS .
ships were stronger for logAP than for logKS.
FigureFigure 4. Relationships
4. Relationships between
between airair permeability(logAP,
permeability (logAP, upper
upper row)
row)and
andsaturated
saturated hydraulic conductivity
hydraulic (logK(logK
conductivity S, lower
S , lower
row) and the morphological parameters of pore structure: AA–macroporosity by image analysis; VTB–relative volume of
row) and the morphological parameters of pore structure: AA–macroporosity by image analysis; VTB–relative volume
pores overlapping the top and bottom edge of the image; PLA–relative length of pore path; and lognPER–percolation num-
of pores
ber.overlapping the represents
The shaded area top and bottom edge of the
a 95% confidence image; PLA–relative length of pore path; and lognPER –percolation
level.
number. The shaded area represents a 95% confidence level.
For the efficient transport of fluids into the soil, the continuity of the pore system is
For the efficient
important. The image transport of fluids into
analysis performed the2D
on the soil,
soilthe continuity
blocks revealedof theinpore
that 17 of system
the is
important. The image analysis performed on the 2D soil blocks revealed that in 17 of the
52 images representing soil structure (CM1-c0 × 6, CM2-c0 × 2, CM4-c4 × 4, CM5-c4 × 2,
52 CM6-c4
images ×representing
2, and CM7-c17soil ×structure
1) pores (CM1-c0
were detected
× 6, that connected
CM2-c0 the top ×
× 2, CM4-c4 and 4, bottom
CM5-c4 × 2,
edges of the image, thereby forming continuous paths for vertical air
CM6-c4 × 2, and CM7-c17 × 1) pores were detected that connected the top and bottom or water movement
in the soil. For the remaining 67% of images, the volume of such pores yielded zero, there-
fore this parameter was not applicable in further calculations. However, our previous
studies [28] confirmed that the relative volume of pores overlapping the top and/or bot-
tom edge of the image, VTB, was a good estimate of the volume of pores responsible for
the vertical transport of water and air in the soil. Nevertheless, the correlations of logAP
and logKS with VTB were, contrary to expectations, weaker than those with theAgronomy 2021, 11, 1883 13 of 18
edges of the image, thereby forming continuous paths for vertical air or water movement
in the soil. For the remaining 67% of images, the volume of such pores yielded zero,
therefore this parameter was not applicable in further calculations. However, our previous
studies [28] confirmed that the relative volume of pores overlapping the top and/or bottom
edge of the image, VTB, was a good estimate of the volume of pores responsible for the
vertical transport of water and air in the soil. Nevertheless, the correlations of logAP and
logKS with VTB were, contrary to expectations, weaker than those with the macroporosity
by image analysis, AA (Figure 4).
Another parameter that characterises the soil pore system is the vG (Table 2). The
vG index values gradually increased in the subsequent layers of the studied Cambisol,
reaching a maximum in the CM6 layer. Further, low values were recorded in the CM1,
CM2, CM3, and CM7 layers. The vG index did not exhibit statistically significant linear
relationships with logKS or logAP.
The percolation number, nPER , reflects the spatial distribution of soil pore cross-
sections and is determined by the number of dilation steps required to obtain a continuous
permeable pore system from the initial pore system shown in the binary images (right
panel of Figure 2). The larger the distance between soil pores, the greater the nPER , because
more dilations must be performed to create a continuous pore network. The nPER varied
in the profile of the studied soil, in which its lowest value was recorded in the CM1 layer
and its highest was–in the CM7 layer. Meanwhile, in the CM2–CM6 layers, the nPER values
did not exhibit a clear trend. Further, the dependence of the nPER on the soil parameters
measured in the laboratory as well as the morphometric parameters was analysed. Based
on these analyses, many strong linear dependencies were revealed between the lognPER
and other parameters. In particular, the lognPER correlated positively with ρD and ρS , and
negatively with PO , TOC, and VV (Table 3). Moreover, its relationships with PLA, AA,
and VTB were negative and weaker than those recorded among AA, PLA, and VTB, even
though the high R2 (0.935) for the lognPER –PLA correlation was noteworthy (Table 3). As
the nPER describes the arrangement of soil pore cross-sections, its relationships with water
and logAP were of special interest. The results showed that the logAP value decreased
significantly with increasing lognPER , and the relationship between lognPER and logKS was
similar, although slightly weaker (Figure 4).
4. Discussion
In this study, we aimed to assess the water and air permeability of a forest Cambisol
using 2D image analyses. For the soil structure images, we determined the morphometric
parameters that characterised the volume and arrangement of soil pores and then identified
relationships between the image analysis results and the laboratory measurements of
selected chemical and physical soil properties.
We obtained statistically significant linear relationships between the basic soil proper-
ties including: the bulk (ρD ) and particle (ρS ) density, total porosity (PO ), organic matter
(TOC), and the sand (cS ), as well as between the studied morphometric structure param-
eters including: the macroporosity by image analysis (AA), length of pore path per unit
area (PLA), the relative volume of pores overlapping the top and/or bottom edge of the
image (VTB), and the percolation number (lognPER ). These associations confirmed that
the soil structure is closely related to soil physicochemical properties. Soil bulk density
is the ratio of the total mass of solids to the total volume of the soil and thus it reflects
the state of soil compactness. The process of soil compaction first causes a decrease in the
volume of the largest pores. Correspondingly, a smaller amount of macropores >20 µm
(VV) was observed for the soil layers with higher bulk densities. The VV also increased
with increasing cS and increasing TOC or decreasing ρS , because the latter two parameters
are correlated. The VV growth could be attributed to the ability of these soil components
to reduce soil compactness, by lowering the mechanical stability of the large peds (sand)
and by increasing the aggregate stability (organic matter), which in turn promoted the
formation of pores.Agronomy 2021, 11, 1883 14 of 18
The Cambisol water permeability (logKS ) correlated positively with PO , while both
air permeability (logAP) and logKS correlated more strongly with VV. These relationships
were justified because it was expected that, in general, the largest pores would govern the
flow of air and water through the soil, thereby affecting the value of Ks and the logAP.
Fernández et al. [27] also confirmed that PO and AA were among the best indicators for
water infiltration, filtering and storage.
Texture, organic matter content, and bulk density are generally considered when
designing pedotransfer functions in order to calculate soil hydraulic conductivity. For
example, based on these basic soil parameters, the Database of Hydraulic Properties of
European Soils (HYPRES) was created [2]. Our study showed that both logKS and logAP
correlated with ρD , and that logAP also correlated with ρS and TOC, as indicated by the
linear regression equations. Nevertheless, no statistically significant relationships were
observed between logAP, logKS and texture or between logKS and TOC. Our results support
the findings of Jarvis et al. [3], who reported that the hydraulic conductivity of the topsoil is
only weakly related to texture, depending more on the bulk density. However, they stated
that hydraulic conductivity was significantly related to organic carbon content. The limited
or varying number of statistically valid relationships between soil permeability and basic
physicochemical characteristics may cause difficulties in determining the soil transport
properties via the aforementioned pedotransfer functions. Meanwhile, other factors may
determine the permeability of the soil. The KS can change rapidly in the soil profile in
the presence of large pores, inducing preferential flow [43], or impermeable layers. The
dominant factor controlling the flow processes in soil is, thus, its structure (e.g., [3]).
Consequently, it is challenging to model hydraulic conductivity with satisfactory
predictive power using only basic soil physical parameters [43,44]. For this reason, as
presented in a review by Patil and Singh [45], other soil parameters were included in
the pedotransfer functions to improve their accuracy and reliability. The authors noted
the application of data on water retention, clay mineralogy, mechanical properties (like
the coefficient of linear extensibility), calcium carbonate content, and cation exchange
capacity of clay soils. Another review on the estimation of saturated hydraulic conductivity
with pedotransfer functions [46] indicated that soil structural effects on KS were rarely
considered in the estimation of KS . As suggested by the authors, one of the reasons for this
was that soil structure characteristics were generally difficult to measure and quantify. This
issue was also earlier highlighted by Vereecken et al. [47], who suggested that hydrological
databases should be supplemented with morphometric indices that reflect the arrangement
of the soil structural components in order to enable further improvement of existing
pedotransfer functions.
In our study on the Cambisol developed from loess of silt loam texture, we identified
the correlations of logKS and logAP with the morphometric parameters of soil structure
derived from an image analysis. We found strong linear relationships of logKS and logAP
with AA, PLA, VTB, and lognPER . Further, the main factor controlling the soil’s infiltration
ability was the total volume of soil pores, as demonstrated by the laboratory measurement
(VV) and image analysis (AA) results.
The index of soil pore-network growth rate (vG ), depending on the spatial distribution
of pore cross-sections was, in general, smaller when there were larger initial pore volumes
and lower pore numbers, indicating higher pore interconnectivity in the 2D images of the
soil structure. Low vG values were recorded in the O and A horizons as well as the Ck and
AB horizons. These low values signify the continuous pore space and a relatively high pore
volume in the upper Cambisol layers, which resulted from the aggregate soil structure. In
addition, the low vG values in the subsoil layers could be associated with the applied initial
procedure of image transformation to equalise the AA and VV. In particular, the images
representing the AB and Ck horizons, subjected to a relatively large number of closings,
showed higher pore volumes and interconnectivities in the 2D image. It was stated that the
vG index did not exhibit statistically significant linear relationships with logKS or logAP.Agronomy 2021, 11, 1883 15 of 18
The percolation number (lognPER ) also reflects the arrangement of soil pore cross-
sections. Its relationships with PLA, AA, and VTB were negative and weaker than those
recorded among AA, PLA, and VTB, although there was a strong relationship between
lognPER and PLA. Further, the lognPER was negatively correlated with logAP and logKS .
The measured morphometric parameters, AA, PLA, VTB, and lognPER , correlated
strongly. As a result, they can be used interchangeably, even though each parameter
describes a slightly different attribute of the soil pore system. For the studied Cambisol,
all the proposed morphometric indices presented strong linear relationships with logKS
and logAP, with R2 ≥ 0.735 at p < 0.01, which is consistent with the results of our previ-
ous research [28]. In comparison with the previously studied Chernozem, however, we
observed a slightly different correlation between the air and water permeability and the
indices of the spatial distribution of pore cross-sections (vG , lognPER ). The robustness
of the studied relationships between the structural characteristics and the soil transport
data must therefore be further tested with a larger population of soils of various textures
and structures.
Our study revealed that the image analysis using resin-impregnated soil blocks was
useful in evaluating the air and water permeability of the soil. Thus, the methods employed
herein will contribute to more accurate estimations of gas and liquid transport in soils and
broaden the knowledge on sediment connectivity, a key issue to understand the hydrologi-
cal cycle [48,49]. Despite the increasing recognition of X-ray computed tomography in soil
structure research, resin-impregnated soil thin sections or polished blocks continue to be a
valuable method for analysing the soil pore space and aggregates via direct geometric visu-
alisation [50,51]. A review of the literature indicates that collections of resin-impregnated
soil samples have existed in research centres globally for several decades. Recent studies
show that such collections are continually being enlarged (Section 1). These durable soil
structure samples can therefore be a potential source of current as well as historical infor-
mation to evaluate site-specific soil hydraulic properties for modelling long-term trends in
the soil water regime. According to Bayabil et al. [52], the soil parameter spatial variations
have substantial implications for hydrological modelling and effectively planning land and
water management practices. Thus, the availability of soil data that adequately represent
actual field conditions is critical. We propose that the information regarding soil pore
arrangement drawn from the soil structure images, as well as the basic soil physical and
chemical parameters, can help to refine both current and past simulations of air and water
permeabilities by accounting for specific local conditions and soil management types.
5. Conclusions
Our study revealed that an image analysis of soil structure using resin-impregnated
soil blocks was useful in evaluating air and water permeability. We found that saturated
hydraulic conductivity (logKS ) and air permeability at a potential of −15 kPa (logAP)
had statistically significant relationships (R2 ≥ 0.735 at p < 0.01) with morphometric soil
structure parameters that were derived from image analysis, including macroporosity (AA),
relative length of pore path (PLA), relative volume of pores contacting with top and bottom
edge of the image (VTB), and percolation number (lognPER ). Further, the main factor
controlling the soil’s infiltration ability was the total volume of soil pores, as demonstrated
by the laboratory measurements of air-filled porosity (VV) and macroporosity by image
analysis (AA).
Due to the strong relationships between AA, PLA, VTB, and lognPER , the parameters
proved to be equally useful for characterising the soil pore system, of which the first
three indices refer to the pore volume, and the last denotes the arrangement of pore cross-
sections. These parameters can be incorporated in the pedotransfer functions, contributing
to more accurate estimations of gas and liquid transport in soils. The obtained relationships
between the structural characteristics and the soil transport data constitute a valuable basis
for further studies on a broader diversity of soil textures and structures. To build a useful
database for hydrological models, we propose performing hydraulic conductivity and airAgronomy 2021, 11, 1883 16 of 18
permeability measurements in conjunction with soil structure assessments using direct
visualisation methods. Moreover, the existing collections of thin sections and polished
blocks offer the possibility of obtaining historical transport parameters for modelling
long-term trends in the soil water regime.
Author Contributions: Conceptualization, M.B. and B.K.; Formal analysis, M.B. and B.K.; Funding
acquisition, M.B.; Investigation, M.B. and B.K.; Methodology, M.B. and B.K.; Validation, M.B. and
B.K.; Visualization, M.B. and B.K.; Writing—original draft, M.B. and B.K.; Writing—review and
editing, M.B. and B.K. All authors have read and agreed to the published version of the manuscript.
Funding: The part of this research regarding the soil structure was funded by the budget for science
in Poland in 2010–2013, grant number N N310 447938. The remaining results presented in the article
were obtained within the scope of the statutory research conducted at the University of Life Sciences
in Lublin (Institute of Soil Science, Environment Engineering and Management) and financed from
the budget of the Ministry of Science and Higher Education in Poland.
Data Availability Statement: The data presented in this study are available on request from the
corresponding author.
Conflicts of Interest: The authors declare no conflict of interest.
Abbreviations
AA, macroporosity by image analysis (cm3 cm−3 ); AP, air permeability at −15 kPa
(10−8 m2 Pa−1 s−1 ); CaCO3 , amount of carbonates (mg g−1 ); cC , clay < 0.002 mm frac-
tion content (g g−1 ); cS , sand 0.05–2 mm fraction content (g g−1 ); cSI , silt 0.002–0.05 mm
fraction content (g g−1 ); CM1 . . . CM7, Cambisol layers 1 . . . 7; KS , saturated hydraulic
conductivity (cm d−1 ); nPER , percolation number; PLA, length of pore path per unit area
(cm cm−2 ); PO , total porosity of the soil (cm3 cm−3 ); TOC, total organic carbon (mg g−1 );
vG , index of soil pore-network growth-rate (cm3 cm−3 ); VTB, relative volume of pores
overlapping the top and/or bottom edge of the image (cm3 cm−3 ); VV, relative volume
of air-filled pores at −15 kPa, share of macropores with equivalent diameters >20 µm
(cm3 cm−3 ); WV0 , maximum soil water content (cm3 cm−3 ); WV, soil water content at
−15 kPa (cm3 cm−3 ); ρD , dry soil bulk density (Mg m−3 ); ρS , soil particle density (Mg m−3 ).
References
1. Keesstra, S.; Sannigrahi, S.; López-Vicente, M.; Pulido, M.; Novara, A.; Visser, S.; Kalantari, Z. The role of soils in regulation and
provision of blue and green water. Philos. Trans. R. Soc. B-Biol. Sci. 2021, 376, 20200175. [CrossRef] [PubMed]
2. Wösten, J.H.M.; Lilly, A.; Nemes, A.; Le Bas, C. Development and use of a database of hydraulic properties of European soils.
Geoderma 1999, 90, 169–185. [CrossRef]
3. Jarvis, N.; Koestel, J.; Messing, I.; Moeys, J.; Lindahl, A. Influence of soil, land use and climatic factors on the hydraulic
conductivity of soil. Hydrol. Earth Syst. Sci. 2013, 17, 5185–5195. [CrossRef]
4. Murphy, C.P.; Banfield, C.F. Pore space variability in a subsurface horizon of two soils. J. Soil Sci. 1978, 29, 156–166. [CrossRef]
5. Koppi, A.J.; McBratney, A.B. A basis for soil mesomorphological analysis. J. Soil Sci. 1991, 42, 139–146. [CrossRef]
6. Pagliai, M.; Lamarca, M.; Lucamante, G. Micromorphometric and micromorphological investigations of a clay loam soil in
viticulture under zero and conventional tillage. J. Soil Sci. 1983, 34, 391–403. [CrossRef]
7. FitzPatrick, E.A. Micromorphology of Soils; Springer: Berlin/Heidelberg, Germany, 1984; p. 457.
8. Ringrose-Voase, A.J. Measurement of soil macropore geometry by image analysis of sections through impregnated soil. Plant Soil
1996, 183, 27–47. [CrossRef]
9. Słowińska-Jurkiewicz, A.; Bryk, M.; Kołodziej, B.; Jaroszuk-Sierocińska, M. Macrostructure of Soils in Poland; AWR Magic: Lublin,
Poland, 2012.
10. Schon, N.L.; Gray, R.A.; Mackay, A.D. Quantification of soil macro pore size and shape using resin impregnation. N. Z. J. Agric.
Res. 2012, 55, 309–315. [CrossRef]
11. Bryk, M. Macrostructure of diagnostic B horizons relative to underlying BC and C horizons in Podzols, Luvisol, Cambisol, and
Arenosol evaluated by image analysis. Geoderma 2016, 263, 86–103. [CrossRef]
12. Sauzet, O.; Cammas, C.; Gilliot, J.M.; Bajard, M.; Montagne, D. Development of a novel image analysis procedure to quantify
biological porosity and illuvial clay in large soil thin sections. Geoderma 2017, 292, 135–148. [CrossRef]Agronomy 2021, 11, 1883 17 of 18
13. Gutiérrez-Castorena, M.C.; Gutiérrez-Castorena, E.V.; González-Vargas, T.; Ortiz-Solorio, C.A.; Suástegui- Méndez, E.; Cajuste-
Bontemps, L.; Rodríguez-Mendoza, M.N. Thematic micro-maps of soil components using high-resolution spatially referenced
mosaics from whole soil thin sections and image analysis. Eur. J. Soil Sci. 2018, 69, 217–231. [CrossRef]
14. Moran, C.J.; Koppi, A.J.; Murphy, B.W.; McBratney, A.B. Comparison of the macropore structure of a sandy loam surface
soil-horizon subjected to two tillage treatments. Soil Use Manag. 1988, 4, 96–102. [CrossRef]
15. Crawford, J.W.; Matsui, N.; Young, I.M. The relation between the moisture-release curve and the structure of soil. Eur. J. Soil Sci.
1995, 46, 369–375. [CrossRef]
16. Lamandé, M.; Hallaire, V.; Curmi, P.; Pérès, G.; Cluzeau, D. Changes of pore morphology, infiltration and earthworm community
in a loamy soil under different agricultural managements. Catena 2003, 54, 637–649. [CrossRef]
17. Kodešová, R.; Vignozzi, N.; Rohošková, M.; Hájková, T.; Kočárek, M.; Pagliai, M.; Kozák, J.; Šimůnek, J. Impact of varying
soil structure on transport processes in different diagnostic horizons of three soil types. J. Contam. Hydrol. 2009, 104, 107–125.
[CrossRef]
18. Rasa, K.; Eickhorst, T.; Tippkötter, R.; Yli-Halla, M. Structure and pore system in differently managed clayey surface soil as
described by micromorphology and image analysis. Geoderma 2012, 173, 10–18. [CrossRef]
19. Bouma, J.; Jongerius, A.; Schoonderbeek, D. Calculation of saturated hydraulic conductivity of some pedal clay soils using
micromorphometric data. Soil Sci. Soc. Am. J. 1979, 43, 261–264. [CrossRef]
20. Vogel, H.J.; Roth, K. A new approach for determining effective soil hydraulic functions. Eur. J. Soil Sci. 1998, 49, 547–556.
[CrossRef]
21. Vogel, H.J.; Roth, K. Quantitative morphology and network representation of soil pore structure. Adv. Water Resour. 2001, 24,
233–242. [CrossRef]
22. Pagliai, M.; Marsili, A.; Servadio, P.; Vignozzi, N.; Pellegrini, S. Changes in some physical properties of a clay soil in Central Italy
following the passage of rubber tracked and wheeled tractors of medium power. Soil Tillage Res. 2003, 73, 119–129. [CrossRef]
23. Pagliai, M.; Vignozzi, N.; Pellegrini, S. Soil structure and the effect of management practices. Soil Tillage Res. 2004, 79, 131–143.
[CrossRef]
24. Pagliai, M.; Kutílek, M. Soil micromorphology and soil hydraulics. In New Trends in Soil Micromorphology; Kapur, S., Mermut, A.,
Stoops, G., Eds.; Springer: Berlin/Heidelberg, Germany, 2008; pp. 5–18.
25. Quinton, W.L.; Hayashi, M.; Carey, S.K. Peat hydraulic conductivity in cold regions and its relation to pore size and geometry.
Hydrol. Process. 2008, 22, 2829–2837. [CrossRef]
26. Bryk, M. Resolving compactness index of pores and solid phase elements in sandy and silt loamy soils. Geoderma 2018, 318,
109–122. [CrossRef]
27. Fernández, R.; Frasier, I.; Quiroga, A.; Noellemeyer, E. Pore morphology reveals interaction of biological and physical processes
for structure formation in soils of the semiarid Argentinean Pampa. Soil Tillage Res. 2019, 191, 256–265. [CrossRef]
28. Bryk, M.; Kołodziej, B. Assessment of water and air permeability of chernozem supported by image analysis. Soil Tillage Res.
2014, 138, 73–84. [CrossRef]
29. Soil Science Society of Poland. Particle size distribution and textural classes of soils and mineral materials—Classification of
Polish Society of Soil Sciences 2008. Rocz. Glebozn.-Soil Sci. Annu. 2009, 60, 5–16.
30. ISO 14235. Soil Quality—Determination of Organic Carbon by Sulfochromic Oxidation; International Organization for Standardization:
Vernier, Geneva, Switzerland, 1998.
31. ISO 10390. Soil Quality—Determination of pH; International Organization for Standardization: Vernier, Geneva, Switzerland, 2005.
32. ISO 10693. Soil Quality—Determination of Carbonate Content—Volumetric Method; International Organization for Standardization:
Vernier, Geneva, Switzerland, 1995.
33. ISO 11508. Soil Quality—Determination of Particle Density; International Organization for Standardization: Vernier, Geneva,
Switzerland, 2017.
34. Aguilar, J.; Dorronsoro-Fdez, C.; Fernández, J.; Dorronsoro Diaz, C.; Martin, F.; Dorronsoro, B. Interactive Multimedia Programme
for Self-Studying Soil Thin Section Description. Available online: http://edafologia.ugr.es/micgraf/indexw.htm (accessed on 8
August 2021).
35. ADCIS and AAI Inc. Aphelion Imaging Software Suite, version 4.0.8; ADCIS: Saint-Contest, France, 2010.
36. Russ, J.C.; Dehoff, R.T. Practical Stereology, 2nd ed.; Springer: Berlin/Heidelberg, Germany, 2000.
37. Vogel, H.J. Morphological determination of pore connectivity as a function of pore size using serial sections. Eur. J. Soil Sci. 1997,
48, 365–377. [CrossRef]
38. Vogel, H.J.; Weller, U.; Schlüter, S. Quantification of soil structure based on Minkowski functions. Comput. Geosci. 2010, 36,
1236–1245. [CrossRef]
39. Schlüter, S.; Weller, U.; Vogel, H.J. Soil-structure development including seasonal dynamics in a long-term fertilization experiment.
J. Plant Nutr. Soil Sci. 2011, 174, 395–403. [CrossRef]
40. Ghanbarian-Alavijeh, B.; Hunt, A.G. Unsaturated hydraulic conductivity in porous media: Percolation theory. Geoderma 2012,
187, 77–84. [CrossRef]
41. Hunt, A.; Ewing, R. Percolation Theory for Flow in Porous Media, 2nd ed.; Springer: Berlin/Heidelberg, Germany, 2009; Volume 674,
p. 337.You can also read