Risk Assessment of Underground Subway Stations to Fire Disasters Using Bayesian Network - MDPI
←
→
Page content transcription
If your browser does not render page correctly, please read the page content below
sustainability

Article
Risk Assessment of Underground Subway Stations
to Fire Disasters Using Bayesian Network
Jiansong Wu *, Zhuqiang Hu, Jinyue Chen and Zheng Li
 Department of Safety Technology and Management, China University of Mining & Technology,
 Beijing 100083, China; 1510120108@student.cumtb.edu.cn (Z.H.); 1510130123@student.cumtb.edu.cn (J.C.);
 1510130109@student.cumtb.edu.cn (Z.L.)
 * Correspondence: 201310@cumtb.edu.cn; Tel.: +86-10-6233-9029

 Received: 18 September 2018; Accepted: 16 October 2018; Published: 22 October 2018

 Abstract: Subway station fires often have serious consequences because of the high density of
 people and limited number of exits in a relatively enclosed space. In this study, a comprehensive
 model based on Bayesian network (BN) and the Delphi method is established for the rapid and
 dynamic assessment of the fire evolution process, and consequences, in underground subway stations.
 Based on the case studies of typical subway station fire accidents, 28 BN nodes are proposed to
 represent the evolution process of subway station fires, from causes to consequences. Based on expert
 knowledge and consistency processing by the Delphi method, the conditional probabilities of child
 BN nodes are determined. The BN model can quantitatively evaluate the factors influencing fire
 causes, fire proof/intervention measures, and fire consequences. The results show that the framework,
 combined with Bayesian network and the Delphi method, is a reliable tool for dynamic assessment
 of subway station fires. This study could offer insights to a more realistic analysis for emergency
 decision-making on fire disaster reduction, since the proposed approach could take into account
 the conditional dependency in the fire propagation process and incorporate fire proof/intervention
 measures, which is helpful for resilience and sustainability promotion of underground facilities.

 Keywords: urbanization and sustainability; subway station fire; dynamic risk assessment;
 Bayesian network

1. Introduction
      The urgent demands for land resources in urban development, more and more underground
spaces, such as subway stations, underground malls, parking lots, and so on, are explored and
constructed. Due to the compact structure, high population density, limited number of exits, and other
factors, serious consequences can be induced by disasters in subway stations, which have become a
great public concern. According to the statistics, fire accidents rank at the top of the list for subway
station disasters, making up nearly 30% of the total accidents that occurred in subway stations around
the world. The subway system has been playing an extremely important role in urban transportation
development these years. Therefore, it is of great importance to carry out disaster prevention and
emergency response work in subway stations, especially on the risk assessment of fire disaster in the
subway stations, which is of great significance for urbanization and sustainability.
      In the past ten years, a lot of scholars have been focusing on studying the problem of fires
in subway stations. As for the methods used to analyze subway station fires, experimental
approaches have been started earlier. According to similarity theory, the physical phenomenon
of subway station fires can be simulated in full-size or reduced-size experimental apparatuses
for subway stations. The fire characteristics, like heat release rate, temperature distribution,
smoke concentration, and radiation heat, are obtained [1–6]. For some subway station fire scenarios,

Sustainability 2018, 10, 3810; doi:10.3390/su10103810                    www.mdpi.com/journal/sustainability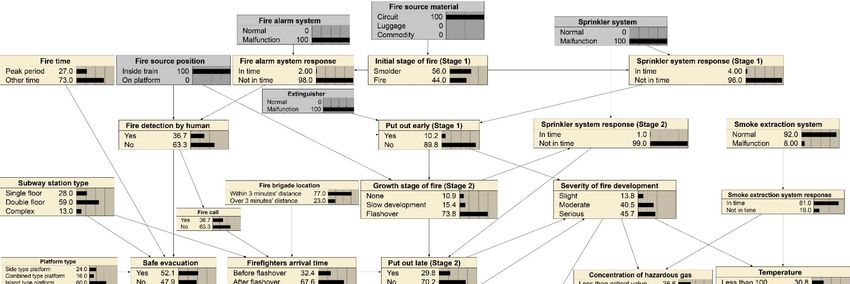
Sustainability 2018, 10, 3810                                                                           2 of 21

the experimental technique could provide some valuable data to examine the fire combustion and
spreading process. However, for fires in some complex subway station layouts, experimental analysis
is risky, time-consuming, and costly. Recently, with the development of computer science and
technology, and numerical methodologies, numerical tools have been a popular way to investigate
subway station fires. Many computational fluid dynamic (CFD) models or software, such as FLUENT,
and FDS, among others, are widely used in analyzing fire smoke evolution in subway stations and
tunnels [7–13]. CFD-based simulations can reproduce well the evolution process of subway station fires
if appropriate initial and boundary conditions are implemented. At present, the CFD-based numerical
results on subway station fire characteristics and development process are of significance for making
“Preparedness” strategies for fire disaster, e.g., safety evacuation design and fire prevention measures
in subway stations. However, for the fire emergency decision, the existing fire simulation model based
on CFD is inefficient, because of the large amount of calculations. Consequently, some researchers
recently have been working on rapid risk assessment tool for subway station fires from qualitative
and quantitative perspectives, based on probabilistic methods and stochastic approaches, like event
tree analysis, fuzzy fault tree analysis, cluster analysis, failure modes and effects analysis, optimized
neural network, analytic hierarchy process, grey-analytic hierarchy process, etc. [14–20]. Fang et al.
established a fire risk assessment system of shopping malls by cluster analysis and Analytic Hierarchy
Process (AHP), and calculated the index weight value of the evaluation system [14]. Liu et al. proposed
the fault tree model of the main risk factors of subway fires by using fuzzy fault tree analysis, and sorted
the critical probability importance of the events at the bottom of the fault tree [15]. Nezhad et al. used
Failure Mode and Effects Analysis (FMEA) model and fuzzy theory to evaluate the Zagros subway,
and obtained two important fire risks in the Zagros subway line [16]. Roshan et al. employed an event
tree analysis method to construct an event tree for each fire event, and calculated the probabilities
of multiple scenes to evaluate the fire risk of the Tehran subway station [17]. Yu et al. concluded
21 subway fire risk factors, and then established the subway fire risk assessment model through neural
network [18]. Zheng et al. carried out fire risk assessment of a highway tunnel from three levels through
a grey-analytic hierarchy process [19]. However, these traditional risk analysis methods, like fuzzy fault
tree analysis and event tree analysis, can be very large for complex systems, which brings difficulties
to qualitative and quantitative analysis. Traditional risk analysis methods, like fuzzy fault tree analysis
and event tree analysis, can be very large for complex systems, which brings difficulties to qualitative
and quantitative analysis, and can only use discrete variables for static analysis. The estimated results
of optimized neural networks cannot reflect the importance of individual risk factors with poor
generalization, and it is not applicable to multi-objective evaluation processes. The grey-analytic
hierarchy process has less quantitative data, but more qualitative components, so is not convincing.
In addition, some researchers have achieved a lot on the risk analysis of other crowded places with
potential fire risk, e.g., finding out the types of bridges most susceptible to fire by statistical analysis of
a large number of historical data [21], and proposing a way of weighted factors to quantify bridge fire
risk [22].
      BN has some attractive advantages over conventional risk assessment methods. Bayesian node
variables can be classified with multiple states, which could facilitate various kinds of influential
factors. Furthermore, BN can achieve dynamic probability updating with newly emerged evidence [23].
Therefore, Bayesian network has been widely used in process safety and natural hazard assessment.
Recently, in fire disaster analysis, like office building fire spread modeling, dwelling fire development,
and occupancy escape, safety barrier for fire, ship fire, fire protection systems, subway station
evacuation, etc. [24–29]. For subway station fires that refer to many dynamic influencing factors,
the risk assessment of fire using Bayesian network is rare.
      In order to comprehensively represent and assess the fire risk in subway stations, this study
proposes an integrated risk assessment framework for rapid and dynamic modeling of subway station
fire using a combination of Bayesian network and the Delphi method. The proposed BN-based
framework can not only represent static influential factors, like subway station type, platform type,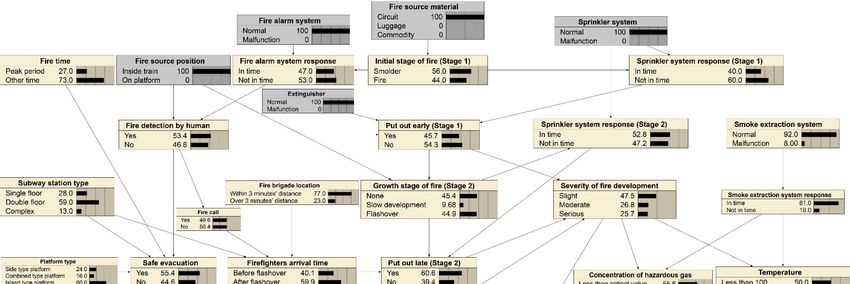
Sustainability 2018, 10, 3810 3 of 21
fire source position, fire alarm system, ventilation systems, sprinkler system, etc., but also incorporate
dynamic fire development information and mitigation measures, such as fire impacts, emergency
rescue or intervention measures in the process of fire evolution, and so on. This BN-based framework
accomplishes an effective and dynamic “Scenario Response”-based risk and possible
Sustainability 2018, 10, x FOR PEER REVIEW
“resilience”
3 of 24
assessment of subway fire evolution process, which is of great importance to the prevention, evaluation,
and controldynamic
of subway fire development information
station fires, and is and mitigation
helpful measures,
for the such and
resilience as firesustainability
impacts, emergency
promotion of
rescue or intervention measures in the process of fire evolution, and so on. This BN-based framework
underground facilities.
accomplishes an effective and dynamic “Scenario Response”-based risk and possible “resilience”
assessment of subway fire evolution process, which is of great importance to the prevention,
2. Methodology
evaluation, and control of subway station fires, and is helpful for the resilience and sustainability
promotion of underground facilities.
2.1. Bayesian Network
2. Methodology
Bayesian network (BN) is a directed acyclic graph (DNG) containing a set of nodes, arcs,
2.1. Bayesian
and conditional Network tables (CPTs) to reflect the joint probability distributions between node
probability
variables. The nodes in BN(BN)
Bayesian network can isbe divided
a directed intograph
acyclic two (DNG)
types:containing
the parenta setnode and
of nodes, theand
arcs, child node,
conditional probability tables (CPTs) to reflect the joint probability distributions
as shown in Figure 1. The nodes in BN can also be divided into three types: root node, intermediate between node
node, andvariables.
leaf node. The nodes in BN can be divided into two types: the parent node and the child node, as
The root node has no parent node. The leaf node has no child node. The other
shown in Figure 1. The nodes in BN can also be divided into three types: root node, intermediate
nodes are node,
generally
and leafcalled intermediate
node. The root node hasnodes.
no parentBN hasThe
node. been applied
leaf node has notochild
many areas,
node. like chemical
The other
accidents, nodes
farmland protection,
are generally calleddust explosion,
intermediate wildfire,
nodes. BN haswater quality,
been applied to gas
many pipeline,
areas, likemetro construction,
chemical
and projectaccidents, farmland protection,
risk management, and hasdustbeenexplosion,
proven to wildfire, water quality,
be an effective methodgas because
pipeline, ofmetro
its flexibility,
construction, and project risk management, and has been proven to be an effective method because
convenience, and high efficiency [30–39].
of its flexibility, convenience, and high efficiency [30–39].
B
A C
(parent node of C)
(parent node of B) (child node of B)
(child node of A)
Figure 1. A simple example of Bayesian network (BN).
Figure 1. A simple example of Bayesian network (BN).
One of BN’s advantages is that the joint probability distributions can be simply calculated. When
One of BN’s aadvantages
analyzing is that the
BN, if the probability of thejoint probability
variable Xi’s parent distributions
nodes is definedcan be i),simply
as Pa(X the jointcalculated.
When analyzing a BN,
probability if the probability
distributions ofX2,
P(X), X = (X1, theX3,variable Xibe
…, Xn) can ’s expressed
parent nodes
as: is defined as Pa(Xi ), the joint
probability distributions P(X), X = (X1 , X2 , X3 , . . n. , Xn ) can be expressed as:
P ( X ) = P ( X 1 , X 2 , X 3 , …, X n ) = ∏ P( X i | Pa ( X i )) ( i = 1, 2, … , n ) (1)
=1
in
P(XX= )(X=
where, P X , X2 n,)Xrepresent
1, X2,(X3,1…, X 3, . . . , X
various ∏ P( Xi | Pa(nXisi ))
n ) = BN variables, (i =of1,BN2,variables.
the number . . . , n) (1)
Another advantage of BN is that the probability i =1 can be updated dynamically when there is new
evidence available. If given a new evidence (event Y) to BN, the posterior probability of event X
where, X (X1 , Xis2 ,calculated
=(P(X|Y)) X3 , . . . , as:
Xn ) represent various BN variables, n is the number of BN variables.
Another advantage of BN is that the probability can be updated dynamically when there is new
P ( X ) P (Y | X ) P ( X ) P (Y | X )
P ( X Y a) =new evidence=(event
evidence available. If given ( i = posterior
Y) to BN, the 1, 2, … , n ) probability of event X
P (Y ) n
(2)
(P(X|Y)) is calculated as: P ( Y | X i )
i =1
where, P(Y) represents the X ) P(Y |probability
P(marginal X) P(of P(Y |Y,XP(X)
X )event ) is the prior probability of the event
X. P ( X |Y ) = = n (i = 1, 2, . . . , n) (2)
P (Y )
∑ P (Y | X i )
2.2. Delphi Method i =1
The Delphi the
where, P(Y) represents method is a kindprobability
marginal of technique with structured
of event communication.
Y, P(X) is the priorIt can enhance expert
probability of the event X.
experience through an anonymous evaluation of reincarnation by expert groups. It is widely used in
2.2. Delphiforecasting,
Method information emerging, and policy-making [40]. Firstly, a leadership team is formed to
form the questionnaire of expertise needed, and to organize the whole process. Next, the experts
completemethod
The Delphi the questionnaire
is a kindbyofanonymous evaluation
technique under the organization.
with structured Experts anonymously
communication. It can enhance
expert
share opinions and reconsider new information when answering the questionnaire again. Then,
experience through an anonymous evaluation of reincarnation by expert groups. It is widely used in
forecasting, information emerging, and policy-making [40]. Firstly, a leadership team is formed to form
the questionnaire of expertise needed, and to organize the whole process. Next, the experts complete
the questionnaire by anonymous evaluation under the organization. Experts anonymously share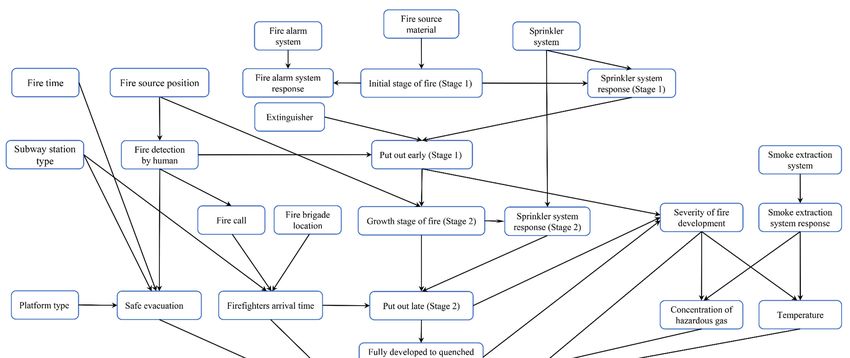
Sustainability 2018, 10, 3810 4 of 21
opinions and reconsider new information when answering the questionnaire again. Then, effective
expert experience could be obtained through a series of repetition. In addition, the coefficient of
variation and Cronbach’s coefficient alpha are added, to conduct a consistency test for the obtained
data, because the Delphi method has no evaluation criteria for the collected data. Finally, the required
empirical data can be obtained by averaging the eventual-round collected data. The coefficient of
variation V refers to the coordination degrees between experts. The Cronbach’s coefficient alpha
represents the consistency of the results [41]. Cronbach’s coefficient alpha was calculated for each node
in the BN, so as to test the data consistency. It is acceptable when α > 0.8.
σj
Vj = , (3)
xj
where σj are variances of the components and x j is the average of the components.
K
∑ σY2
K i =1
α= 1 − , (4)
K − 1 σX2
where σX2 is variances of the total scores, σY2 is variance of the components, and K is the number of
components, respectively.
The whole process of building the Bayesian network with treatments by the Delphi method is
shown in Figure 2.
Sustainability 2018, 10, x FOR PEER REVIEW 5 of 24
Setting up the leadership group
Designing the questionnaire
Draw a Directed Acyclic Graph
Yes Data training
acceptable?
No
Design the questionnaire
Select experts Delphi Method
Expert estimation
Data analysis Exchange of experts’ opinions
Cronbach’s Alpha No
α ≥ 0.8
Yes
Data collection
Output
results
Figure 2. Framework of building Bayesian network combining the Delphi method.
Figure 2. Framework of building Bayesian network combining the Delphi method.
3. Bayesian Network Building
3.1. Determining BN Nodes
In this study, the fire evolution process of subway stations is divided into three stages, based on
the case studies of many typical fire accidents in subway stations, and a further evaluation is made
on the judgment of experts. Based on the three stages, we propose 28 nodes that have dependency
Sustainability 2018, 10, 3810                                                                       5 of 21

3. Bayesian Network Building

3.1. Determining BN Nodes
     In this study, the fire evolution process of subway stations is divided into three stages, based on
the case studies of many typical fire accidents in subway stations, and a further evaluation is made
on the judgment of experts. Based on the three stages, we propose 28 nodes that have dependency
relationships for representing the subway station fires, from causes to consequences. The proposed
Bayesian nodes are divided into three types, and their state classifications are described below.

3.1.1. Root Nodes
      (1) Fire source material (state: Circuit; Luggage; Commodity)
      Different to public places on the ground, the types of combustible materials in subway station
are relatively specific, which could lead to a variety of consequences. Fires in subway stations are
mainly caused by combustible substances carried by passengers or man-made attacks. From the
previous statistics, the fire combustibles in subway stations can be divided into three major categories,
which include circuit, luggage, and commodity.
      (2) Fire alarm system (state: Normal; Malfunction)
      This node represents the presence of fire alarm systems. According to the national criteria in
China, the fire alarm system must be equipped in subway stations. The state “Normal” refers to
that the fire alarm system has been equipped and is in a normal working condition, while the state
“Malfunction” means that the fire alarm system might be a substandard product or aging, and might
not function in case of fire.
      (3) Sprinkler system (state: Normal; Malfunction)
      This root node represents the presence of an automatic response sprinkler system in subway
stations. The state “Normal” refers to that a standard sprinkler system has been installed, and it can
work well in case of fire, while the state “Malfunction” means the sprinkler system is a substandard
product, aging, or faces accidental blockages that could be useless in case of fire.
      (4) Extinguisher (state: Normal; Malfunction)
      This root node presents the performance of extinguishers in subway stations. The state “Normal”
indicates that extinguishers are in a normal working state, while the state “Malfunction” means they
might be substandard, out-of-date, used before, and may not work in case of fire.
      (5) Fire time (state: Peak period; Other time)
      Different subway stations generally have different passenger flow densities at distinct time
periods. In this study, we just classify the time into two periods: “Peak period”, i.e., at the rush hours
to or off work, and “Other time” when there are not many passengers.
      (6) Fire source position (state: Inside train; On platform)
      According to previous statistical data, the main fire locations are in the train and on the station
platform, and quite a few of the fire source positions are in the subway tunnel [42]. Herein, we do not
pay more attention to the subway tunnel and other locations, and simply classify fire source positions
according to two states: Inside train and On platform, and the probabilities are distributed to this node
according to the statistical results.
      (7) Subway station type (state: Single floor; Double floor; Complex)
      The vertical structure of subway stations is divided into three levels, according to the actual
practice in Chinese subway stations. The subway station of single layer is only one floor underground.
The underground part of the double floor subway station consists of two floors. For example, the station
hall is located on the first underground floor, while the platform, the trains, and the tunnel are located
on the second underground floor. Another kind of vertical subway structure is called complex,
whose vertical structure is more complex, which is more common in interchange stations [43].
      (8) Platform type (state: Island type platform; Side type platform; Combined type platform)
Sustainability 2018, 10, 3810                                                                           6 of 21

      There are generally three types of subway station platforms: island type, where the platform is
designed between two tracks; side type, where the platforms are located on two sides of the track;
combined type, that integrated the island type and the side type. Each kind of platform type has its
advantages. The subway station area and changes of the passenger flow are different for these three
platform types, which have a great influence on economic loss and casualties in case of subway station
fire [44].
      (9) Fire brigade location (state: Within 3 min distance; Over 3 min distance)
      This root node is set up to examine the significance of firefighters for firefighting and rescue.
The distance from the subway station to the fire brigade has a significant impact on the rescue
effectiveness organized by firefighters. Previous studies show that the best escape time is 300 s
during fire development in an underground subway station. According to experts’ experience,
the proper duration for firefighters’ arrival is three minutes. Therefore, the states of this node are set as
“Within three minutes” and “Over three minutes”. The former represents that the firefighters could
arrive at the subway station within three minutes, and the latter one represents that the firefighters
take more than three minutes to reach the subway station.
      (10) Smoke extraction system (state: Normal; Malfunction)
      Smoke is a critical factor affecting casualties in case of fire. A subway station can be regarded as
a closed or semi-closed underground space, so the ventilation system is crucial for the diffusion of
fire smoke. The states of this node are set as “Normal” and “Malfunction”, to represent if the smoke
extraction system could work well.

3.1.2. Intermediate Nodes
      (11) Fire detection by human (state: Yes; No)
      Whether the fire can be detected by field staff or passengers in time has great impact on the
probability of successful evacuation and dialing the fire alarm phone, which will significantly influence
the casualties. The states of this node are set to “Yes” and “No”. “Yes” means that field person could
detect the fire in time, and vice versa.
      (12) Safe evacuation (state: Yes; No)
      As we know, evacuation will directly affect the number of casualties. Since underground subway
stations are relatively closed spaces, safe evacuation is more difficult than other places. In the early
stage of fire development and expansion, hot and hazardous smoke flow is the primary influencing
factor to escape routes and trappers’ safe evacuation.
      (13) Fire call (state: Yes; No)
      When a fire occurs, if field staff or passengers do not discover it at the initial stage of the fire,
the fire call will be delayed, which may cause more serious fire loss.
      (14) Firefighters’ arrival time (state: Before flashover; After flashover)
      Firefighters play a major role in personnel rescue, fire control, and fire extinguishment. Therefore,
it is important to discuss firefighters’ arrival time, and the states of this node are divided into
“Before flashover” and “After flashover”. Flashover is a critical stage in fire evolution.
      (15) Fire alarm system response (state: In time; Not in time)
      A fire alarm system is a crucial factor in the detection of fire, and the response time is associated
with the time when people detect the fire. The states of this node are classified into “In time” and
“Not in time”. To specifically reflect the response of a fire alarm system, “In time” represents that the
fire alarm system responds within 30 s after it detects a fire (China, GB50166-2007).
      (16) Initial stage of fire (Stage 1) (state: Smolder; Fire)
      In the initial stage of fire, also called Stage 1 of fire development, there are two different combustion
modes: smolder and fire. If smolder occurs in the initial stage, it is very hard for the alarm system to
detect the fire, and the sprinkler system to conduct a prompt response.
      (17) Sprinkler system response (Stage 1) (state: In time; Not in time)
Sustainability 2018, 10, 3810                                                                              7 of 21

      Sprinkler systems can effectively control the spread of fire. If the sprinkler system responds in
time, especial in Stage 1 of fire development, there may be a higher probability that the fire can be
put out or well controlled. The states of this node can be set to “In time” and “Not in time”, whereby
“In time” means that the sprinkler system responds within 30 s in the initial stage of fire development.
      (18) Put out early (Stage 1) (state: Yes; No)
      This node is set to reflect extinguishment effectiveness during the fire development. At the initial
stage of fire, i.e., Stage 1 of fire development, it is possible to put out the fire by the field people.
      (19) Growth stage of fire (Stage 2) (state: None; Slow development; Flashover)
      If the fire is not put out in Stage 1, it will develop further to flashover or slow development,
which is called Stage 2 of fire development in this study. If the fire is put out in stage 1, it will not
develop into Stage 2.
      (20) Sprinkler system response (Stage 2) (state: In time; Not in time)
      According to the response effectiveness of automatic fire extinguishing system in Stage 2, this node
was divided into two states: “In time” and “Not in time”. Different from the sprinkler system response
in Stage 1, it is more difficult to extinguish the fire in Stage 2, but it is likely to mitigate the spread
of fire.
      (21) Put out late (Stage 2) (state: Yes; No)
      Depending on fire development situation in Stage 2, and the working effectiveness of automatic
fire extinguishing systems and firefighters, the fire in Stage 2 could be extinguished, or not
be extinguished.
      (22) Fully developed to quenched (Stage 3) (state: Yes; No)
      This node is to represent the final stage of a fire, i.e., Stage 3: the fully-developed fire to quenched
(going out) at last. If the fire develops to this stage, it indicates that the fire is not effectively controlled.
      (23) Severity of fire development (state: Slight; Moderate; Serious)
      The burning proportions of main fire body parts are generally divided into local burning (
Sustainability 2018, 10, 3810                                                                               8 of 21

3.1.3. Leaf Nodes
     (27) Economic loss (state: Less than 50 million; 50 to 100 million; More than 100 million)
     Economic loss is a quantitative assessment of consequences in metro station fire accidents. In this
study, it is classified into three states: “Less than 50 million”, “50 to 100 million”, and “More than
100 million” [42].
     (28) Casualties (state: Less than 3 persons; 3 to 10 persons; More than 10 persons)
     Casualties are the most commonly used evaluation index of consequence severity in subway
station fires. In this study, this node is classified into three states: “Less than 3 persons”, that the
accident resulted in deaths of less than 3 people or serious injuries of less than 10 people; “3 to
10 persons”, that the accident resulted in deaths of more than 3 to 10 persons or serious injuries of less
than 10 to 50 persons; and “More than 10 persons”, that the accident resulted in more than 30 deaths
or more than 100 serious injuries [45].
     All the BN nodes and their classifications are listed in Table 1. Based on the case analysis of
typical subway station fire disasters and further expert evaluation to determine the dependencies
between each node, the structure of Bayesian network for representing subway station fire evolution is
established as shown in Figure 3.

                                     Table 1. Classified states of BN nodes.

                     Nodes                                             State of Nodes
  Fire source material                     1   Circuit fault 2 Luggage 3 Commodity
  Fire alarm system                        1   Normal 2 Malfunction
  Sprinkler system                         1   Normal 2 Malfunction
  Extinguisher                             1   Normal 2 Malfunction
  Fire time                                1   Peak period 2 Other time
  Fire source position                     1   Inside train 2 On platform
  Subway station type                      1   Single floor 2 Double floor 3 Complex
  Platform type                            1   Side type platform 2 Combined type platform 3 Island type platform
  Fire brigade location                    1   Within 3 min distance 2 Over 3 min distance
  Smoke extraction system                  1   Normal 2 Malfunction
  Fire detection by human                  1   Yes 2 No
  Safe evacuation                          1   Yes 2 No
  Fire call                                1   Yes 2 No
  Firefighters arrival time                1   Before flashover 2 After flashover
  Fire alarm system response               1   In time 2 Not in time
  Sprinkler system response                1   In time 2 Not in time
  Initial stage of fire (Stage 1)          1   Smolder 2 Fire
  Put out early (Stage 1)                  1   Yes 2 No
  Growth stage of fire (Stage 2)           1   None 2 Slow development 3 Flashover
  Sprinkler system response (Stage 2)      1   In time 2 Not in time
  Put out late (Stage 2)                   1   Yes 2 No
  Fully developed to quenched (Stage 3)    1   Yes 2 No
  Severity of fire development             1   Slight 2 Moderate 3 Serious
  Smoke extraction system response         1   In time 2 Not in time
  Concentration of hazardous gas           1   Less than critical value 2 More than critical value
  Temperature                              1   Less than 100 ◦ C 2 More than 100 ◦ C
  Economic loss                            1   Less than 50 million 2 50 to 100 million 3 More than 100 million
  Casualties                               1   Less than 3 persons 2 3 to 10 persons 3 More than 10 persons
Sustainability2018,
Sustainability 2018,10,
10,3810
x FOR PEER REVIEW 99ofof21
21
Figure3.3.Bayesian
Figure Bayesiannetwork
networkof
ofsubway
subwaystation
stationfire
fireevolution.
evolution.Sustainability 2018, 10, 3810 10 of 21
3.2. Determining Conditional Probability Tables
To analyze the evolution of subway station fire, we need to get the dependency intensity between
some nodes in BN. The dependency intensity is reflected by a conditional probability table (CPT).
The conditional probabilities of each node with the joint distribution of its parent nodes are recorded
in CPT. Conditional probabilities can be obtained by parameter learning or expert scoring. However,
in the case of subway fires, there is little historical data for reference, so it is difficult to determine the
CPTs by parameter learning.
In the Bayesian network of this paper, unconditional probabilities (priori probabilities) of the
root nodes (nodes without parent) are mainly determined based on statistical fire data. For other
nodes, we invite five experts with rich experience in underground subway station fire to fill out CPT
questionnaires of the proposed BN. The CPT of each node is obtained according to expert experience,
with consistent processing using the Delphi method. For determining the CPTs of Bayesian nodes,
we developed software for applying the Delphi method for expert data processing and analysis
(Delphi_data analysis V1.0.0) by MATLAB. This software can read the questionnaire and verify the
consistency of the expert data, such as data table import, Cronbach’s coefficient alpha calculation, data
table output, and taking the mean value of reliable data, finally outputs CPT.
Herein, take determining the CPT of “Temperature” node as an example. The results of the
scores of five experts are listed in Table 2. In the “Expert opinion” column, the probability values
corresponding to E1-E5 are the results of five experts’ rating of “Temperature” node. When the
“Severity of fire development ” state is “Slight” and “Smoke extraction system response” is “In time”,
the probability of the expert E1 in the “TL” column (“TL” means “Temperature” is “less than 100 ◦ C”
and “TM” means “Temperature” is “more than 100 ◦ C”) is 0.74, which represents that expert E1 thinks
that if the severity of fire development is slight, and the smoke extraction system response is in time,
the probability of fire temperatures less than 100 ◦ C is 0.74.
Table 2. Experts’ conditional probability table (CPT) score of “Temperature”.
Node Expert Opinion
Severity of Fire Smoke Extraction E1 E2 E3 E4 E5 E
Development System Response TL TM TL TM TL TM TL TM TL TM TL TM
Slight In time 0.74 0.26 0.84 0.16 0.91 0.09 0.88 0.12 0.68 0.32 0.81 0.19
Slight Not in time 0.2 0.8 0.45 0.55 0.26 0.74 0.32 0.68 0.57 0.43 0.36 0.64
Moderate In time 0.3 0.7 0.19 0.81 0.11 0.89 0.06 0.94 0.09 0.91 0.15 0.85
Moderate Not in time 0.52 0.48 0.58 0.42 0.85 0.15 0.64 0.36 0.86 0.14 0.69 0.31
Serious In time 0.31 0.69 0.35 0.65 0.27 0.73 0.16 0.84 0.11 0.89 0.24 0.76
Serious Not in time 0.96 0.04 0.83 0.17 0.96 0.04 0.83 0.17 0.92 0.08 0.90 0.91
After two rounds of checking with experts through the Delphi method, the final opinion of five
experts can be obtained. Then, Cronbach’s coefficient alpha is used to verify the consistency of the data
collected from the five experts, and the calculated alpha is 0.968 based on Equation (4), which signifies
that the data has been reliable. Finally, the average results of the five experts are listed in column E.
In this paper, the probabilities of column m are the priori probabilities that are input to each node of
the Bayesian network.
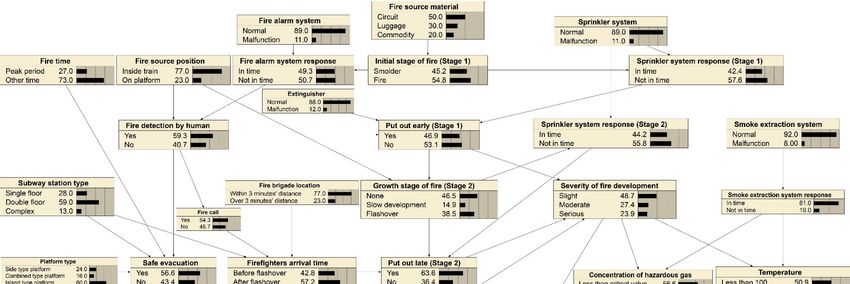
Through this method, the initial BN with CPTs can be obtained as Figure 4 shows and, next,
the proposed Bayesian network can be used to analyze the evolution of subway station fires. In this
study, the probabilistic inference was performed using Netica (Netica 4.16, Norsys Software Corp.,
Vancouver, BC, Canada), which has been widely used to deal with belief networks and influence
diagrams in BN analysis, such as predicting the probabilistic evaluation of pipelines and flood [46–48].Sustainability 2018, 10, 3810 11 of 21
Sustainability 2018, 10, x FOR PEER REVIEW 12 of 21
Figure4.4.Initial
Figure InitialBN
BNwith
withCPTs.
CPTs.Sustainability 2018, 10, 3810 12 of 21
4. Results and Discussion
4.1. Sensitivity Analysis
Sensitivity analysis refers to an uncertainty analysis technology which finds sensitive factors that
have an important impact on the subject from several influential factors, and further discusses the
influence of related factors changing on a certain or set of key indicators from quantitative analysis.
To make the calculated results more reliable when using the proposed Bayesian network, it is necessary
to identify the nodes that have a greater impact on object nodes.
In this study, we use the sensitivity analysis function of Netica software to determine the
nodes which have a greater impact on “Casualties” and “Economic loss”. In Netica, click the Node
“Casualties” and select “Network → Sensitivity to findings”, and then a detailed report will be
generated in the “Message” window. The sensitivity analysis results of “Casualties” and “Economic
loss” to other nodes are listed in Tables 3 and 4.
Table 3. Sensitivity analysis of “Casualties”.
Node Mutual Info Percent Variance of Beliefs
Casualties 1.57591 100.00 0.4402759
Safety evacuation 0.10084 6.40 0.0159131
Concentration of hazardous gas 0.07877 5.00 0.0125456
Severity of fire development 0.06511 4.13 0.0106778
Temperature 0.06021 3.82 0.0098250
Table 4. Sensitivity analysis of “Economic loss”.
Node Mutual info Percent Variance of Beliefs
Economic loss 1.57037 100.00 0.4377345
Severity of fire development 0.52865 33.70 0.1312365
Put out early (Stage 1) 0.25688 16.40 0.0366417
Growth stage of fire (Stage 2) 0.25522 16.30 0.0385723
Put out late (Stage 2) 0.23290 14.80 0.0293658
From the data in Table 3, it can be seen that the node “Casualties” is mainly affected by
“Safe evacuation” and “Concentration of hazardous gas”, which conforms to an actual situation,
since according to statistics, toxic and harmful gases are the main cause of casualties in the fire [49].
According to the data in Table 4, the node “Economic loss” is mainly impacted by “Severity of fire
development”. This is also consistent with reality. The greater the fire severity and damage to the
equipment, the larger the fire-impacted area and economic loss will be.
According to the results of sensitivity analysis, as “Safe evacuation” has the greatest impact on
“Casualties”, and the nodes that affect “Safe evacuation” are “Fire time”, “Subway station type”,
and “Platform type”, then, the influence of “Fire time”, “Subway station type”, and “Platform
type” on “Safe evacuation” should be primarily taken into account in the assessment of casualties.
In the assessment of economic losses, the main considerations should be the effects of “Fire alarm
system”, “Sprinkler system”, and “Extinguisher”, on “Severity of fire development” by transmission
of “Fire severity”.
4.2. Impact of Fire Time, Subway Station Type, and Platform Type
According to the experience of experts, fire time has a significant impact on the number of
casualties. In this part, we select two typical fire times to be executed in the Bayesian network, namely,
“Peak period” and “Other time”. In order to mainly discuss the impact of fire time on casualties,
the parent nodes “Subway station type”, “Platform type”, and “Fire brigade location” are given as
listed in Table 5.Sustainability 2018, 10, 3810 13 of 21
Sustainability 2018, 10, x FOR PEER REVIEW
In the proposed BN model, the estimated probability of casualty is shown in14Figure of 21
5.
When “Fire time” transfers from “Other time” to “Peak period”, the probability
Table 5. Initial setup of some BN nodes for assessment of “Fire time”.
that the “Casualties”
is in the state “More than 3 persons” increases from 0.602 to 0.692, and when the fire happens at
“Peak period”, the probability Setup of of
of “More than 10 persons” Bayesian Nodes goes up to 0.37. The results
“Casualties”
Bayesian Nodes
Scenario 1 Scenario 2
show that the fire protection management should be strengthened during the peak period of
Subway station type Double floor Double floor
subway operation.
Platform type Island type platform Island type platform
Fire brigade location Within 3 min distance Within 3 min distance
Table 5. Initial setup of some BN nodes for assessment of “Fire time”.
Fire time Peak period Other time
Setup of Bayesian Nodes
BayesianBN
In the proposed Nodes
model, the estimated probability of casualty is shown in Figure 5. When
Scenario 1 Scenario 2
“Fire time” transfers from “Other time” to “Peak period”, the probability that the “Casualties” is in
Subway
the state “More thanstation type increases from
3 persons” Double floor
0.602 to 0.692, and whenDouble
the firefloor
happens at “Peak
period”, the probability of “More than 10 persons” of “Casualties” goes up type
Platform type Island type platform Island platform
to 0.37. The results show
that the fireFire brigade location
protection Withinbe
management should 3 min distance during
strengthened Within
the 3peak
min distance
period of subway
Fire time Peak period Other time
operation.
0.500
xSustainability 2018, 10, 3810 14 of 21
Sustainability 2018, 10, x FOR PEER REVIEW 15 of 21
0.500
xSustainability 2018, 10, 3810 15 of 21
4.3. Impact of Fire Source Position
Take fire source materials from passengers’ luggage as an example, meanwhile, the sprinkler
system and fire extinguisher are both in “Normal” condition, and we analyze the influence of fire
source position on fire severity and economic loss. The inference results are listed in Table 8.
Table 8. Estimated probabilities for assessment of fire source position.
Estimated Probabilities
Luggage Luggage
Bayesian Nodes State of Bayesian Nodes Normal Fire Alarm System) Normal (Fire Alarm System)
Normal (Sprinkler System) Normal (Sprinkler System)
Inside Train On Platform
1 None 0.504 0.601
Growth stage of fire (Stage 2) 2 Slow development 0.088 0.279
3 Flashover 0.408 0.12
1 Slight 0.523 0.625
Severity of fire development 2 Moderate 0.246 0.246
3 Serious 0.231 0.129
1 Less than 50 million 0.393 0.432
Economic loss 2 50 to 100 million 0.31 0.383
3 More than 100 million 0.297 0.185
1 Less than 3 persons 0.369 0.442
Casualties 2 3 to 10 persons 0.338 0.308
3 More than 10 persons 0.263 0.25
The results show that, if fire position is on a platform, the possibility that the fire severity is slight
is 0.625; the sum possibility of the fire turning into moderate and serious is 0.375. If the fire source
position is inside the train, the sum possibility of the fire becoming moderate and serious increases to
0.477. In the meantime, the degree of economic loss located on the platform correspondingly increases
compared with that of inside train. It is observed that the possibility of “Growth stage of fire (Stage 2)”
is “Flashover”, and that fire occurs on the platform, is 0.12. However, the “Flashover” possibility,
when fire is located inside the train, goes up to 0.408. We can find that the change of “Growth stage of
fire (Stage 2)” state leads to greater fire severity and economic loss.
4.4. Impact of Fire Prevention and Extinguishing Facilities
According to previous statistical results, the possibility of fire source position inside the train is
0.77, of which, 50% of incidents are caused by electrical circuit faults. When “Fire source position” is
selected as “Inside train” and “Fire source material” is “Circuit fault” and, meanwhile, fire prevention
and control response changes from effective (i.e., the automatic fire extinguishing system, alarm system,
and fire extinguisher are in a “Normal” condition) to poor (i.e., the automatic fire extinguishing system,
alarm system, and fire extinguisher are all in an “Abnormal condition”), the estimated probability of
fire “Economic loss” to be “More than 100 million” turns from 0.283 to 0.439 as shown in Figures 8
and 9. Thus, ensuring the automatic alarm system and sprinkler system in normal working conditions
and keeping the effectiveness of fire extinguishers are extremely important for the control of subway
station fire.Sustainability 2018,10,
Sustainability2018, 10,3810
x FOR PEER REVIEW 16
17ofof2121
Figure8.8.Inference
Figure Inferenceresults
resultswith
withpoor
poorfire
firecontrol
controlresponse.
response.Sustainability 2018, 10, 3810 17 of 21
Sustainability 2018, 10, x FOR PEER REVIEW 18 of 21
Figure9.9.Inference
Figure Inferenceresults
resultswith
witheffective
effectivefire
firecontrol
controlresponse.
response.Sustainability 2018, 10, 3810 18 of 21
5. Conclusions
In order to comprehensively represent and assess the fire risk in subway stations, this study
proposes an integrated risk assessment framework for rapid and dynamic modeling subway station
fire combined Bayesian network and the Delphi method. The proposed BN-based framework can
represent both static and dynamic information on fire causes, fire proof/intervention, emergency
rescue, and fire consequences. The main conclusions are
(a) Subway station type and platform type significantly affect fire evolution process and final
casualties. Particularly, complex subway stations (more common in interchange station) and
combined type platform have the greatest impact on fire severity because of the complex structure
and large passenger flow.
(b) Fire in peak periods will likely result in serious casualties than the other fire times, which indicates
that the operation management of subway station in peak periods should be strictly instructed.
(c) Fire source position has a greater influence on fire development and consequences. If the fire
location is in the train, the probability of flashover would still reach 0.386, even though the
working condition of alarm system, sprinkler system, and fire extinguisher are all “Normal”.
In this case, the fire will likely result in a serious economic loss and casualties.
(d) It is quantitatively demonstrated that the normal working condition of the alarm system, sprinkler
system, and fire extinguisher play an important role in the fire control of in subway station.
(e) The proposed dynamic and integrated BN framework is demonstrated to be of great significance
to the prevention, evaluation, and control of subway station fire and, thus, helpful to perform
“Scenario Response”-based fire disaster response and reduction, which can be used as a reference
for risk assessment and emergency response of other disasters or accidents.
At present, due to the scarcity of detailed records of subway station fire cases (especially specific
fire evolution processes and fire consequences), it is difficult to comprehensively validate the proposed
BN model against past fire incidents. However, the applicability of this proposed Bayesian framework
to real life situation could be improved and optimized with many emerging underground subway
station fire cases in the future. Although the present version of the proposed Bayesian framework
may not provide very accurate results, it could present comparatively quantitative risk distribution
for reference, that could benefit the emergency response to an underground subway station fire.
In addition, a resilience assessment can be achieved dynamically in the pre-event, during-event,
and post-event phases of subway station fire with BN-based model. In this study, “resilience” was
mainly to represent and incorporate fire prevention/intervention to minimize damage and functional
interruption during an event. Resilience strength can resist extreme events in the pre-event phase,
minimize the damage and function interruption during the event, and can facilitate recovery in the
post-event phases. “Resilience assessment” to subway station fire could be extended more specifically
in the pre-and post-event phase of subway station fires in future work.
Author Contributions: For research articles with several authors, a short paragraph specifying their individual
contributions must be provided. The following statements should be used “conceptualization, J.W. and Z.H.;
methodology, J.W.; software, Z.H.; formal analysis, J.W.; investigation, Z.H. and J.C.; data curation, Z.L.;
writing—original draft preparation, J.W., Z.H., J.C. and Z.L.; writing—review and editing, J.W.; supervision, J.W.;
funding acquisition, J.W.”
Funding: This work was supported by the National Natural Science Foundation of China (Grant No. 11502283),
National Key Research and Development Program of China (Grant No. 2017YFC0805001) and the Yue Qi
Scholar/Young Scholar Program of China University of Mining & Technology, Beijing.
Acknowledgments: Great gratitude is extended to the experts for their opinion on the BN building.
Conflicts of Interest: The authors declare no conflict of interest.Sustainability 2018, 10, 3810 19 of 21
References
1. Rie, D.H.; Hwang, M.W.; Kim, S.J.; Yoon, S.W.; Ko, J.W.; Kim, H.Y. A study of optimal vent mode for the
smoke control of subway station fire. Tunn. Undergr. Space Technol. 2006, 21, 300–301. [CrossRef]
2. Shi, C.L.; Zhong, M.H.; Wang, L.Q.; He, L.; Shi, J.H.; Xu, X. Investigation of full-scale burning experiments in
metro station and tunnel (2)—Interval tunnel fires. J. Saf. Sci. Technol. 2012, 8, 28–34.
3. Shi, C.L.; Zhong, M.H.; Wang, L.Q.; Li, H.E.; Shi, J.H.; Xuan, X.U. Investigation of full-scale burning
experiments in metro station and tunnel (3)—Station tunnel fires. J. Saf. Sci. Technol. 2013, 9, 26–33.
4. Meng, N.; Hu, L.; Zhu, S.; Yang, L. Effect of smoke screen height on smoke flow temperature profile beneath
platform ceiling of subway station: An experimental investigation and scaling correlation. Tunn. Undergr.
Space Technol. 2014, 43, 204–212. [CrossRef]
5. Giachetti, B.; Couton, D.; Plourde, F. Smoke spreading analysis from an experimental subway scale model.
Fire Saf. J. 2016, 86, 75–82. [CrossRef]
6. Giachetti, B.; Couton, D.; Plourde, F. Smoke spreading analyses in a subway fire scale model. Tunn. Undergr.
Space Technol. 2017, 70, 233–239. [CrossRef]
7. Karaaslan, S.; Dinler, N.; Yucel, N. Numerical fire simulation in subway station tunnel by using different
combustion models. J. Fac. Eng. Archit. Gazi Univ. 2011, 26, 533–547.
8. Gao, R.; Li, A.; Hao, X.; Lei, W.; Zhao, Y.; Deng, B. Fire-induced smoke control via hybrid ventilation in a
huge transit terminal subway station. Energy Build. 2012, 45, 280–289. [CrossRef]
9. Liu, S. Application of CFD technology and hot smoke test in the study of metro fire. J. Railw. Eng. Soc. 2016,
33, 99–103.
10. Teodosiu, C.I.; Ilie, V.; Dumitru, R.G.; Teodosiu, R.S. Assessment of ventilation efficiency for emergency
situations in subway systems by CFD modeling. Build. Simul. 2016, 9, 319–334. [CrossRef]
11. Ding, H.C.; Qi, W.J.; Zhu, Z.W.; Yang, W.J. Research on numerical simulation of air and smoke flow regularity
in subway carriage fire. Saf. Environ. Eng. 2017, 24, 123–128.
12. Song, C.; Kwan, M.P.; Song, W.G.; Zhu, J.P. A comparison between spatial cconometric models and random
forest for modeling fire occurrence. Sustainability 2017, 9, 819. [CrossRef]
13. Zhang, N.; Lu, Z.; Zhou, D. Influence of train speed and blockage ratio on the smoke characteristics in a
subway tunnel. Tunn. Undergr. Space Technol. 2018, 74, 33–40. [CrossRef]
14. Fang, Z.; Chen, J.J.; Xie, T.; Wan, X. Research on Application of Cluster Analysis and AHP in fire risk
assessment of shopping malls. Math. Geosci. 2015, 41, 29–42.
15. Liu, Z.; Chen, M. Study on the risk assessment and control of subway fire based on Fuzzy Fault Tree Analysis
method. Sci. Technol. Manag. Res. 2015, 11, 221–224.
16. Nezhad, H.; Zivdar, H.; Amirnia, A. Assessment of fire risk in passenger trains in tunnels using the FMEA
model and Fuzzy Theory (A Case Study in the Zagros Railway). Curr. World Environ. 2015, 10, 1158–1170.
[CrossRef]
17. Roshan, S.A.; Daneshvar, S. Fire risk assessment and its economic loss estimation in Tehran subway, applying
Event Tree Analysis. Iran. J. Health 2015, 2, 229–234.
18. Yu, M.Z.; Zhang, C.F. Subway fire risk assessment based on optimized neural network. Fire Sci. Technol.
2016, 35, 847–849.
19. Zheng, B.J.; Sun, T.; Zhang, X.M.; Ren, L.B.; Lu, Y.-S. Fire risk assessment model of highway tunnel based on
Grey-Analytic Hierarchy Process. Value Eng. 2017, 6, 87–89.
20. Gravio, G.D.; Patriarca, R.; Mancini, M.; Costantino, F. Overall safety performance of air traffic management
system: Forecasting and monitoring. Saf. Sci. 2015, 72, 351–362. [CrossRef]
21. Peris-Sayol, G.; Paya-Zaforteza, I.; Balasch-Parisi, S.; Alos-Moya, J. Detailed Analysis of the Causes of Bridge
Fires and Their Associated Damage Levels. J. Perform. Constr. Facil. 2017, 31, 04016108. [CrossRef]
22. Naser, M.Z.; Kodur, V.K.R. A probabilistic assessment for classification of bridges against fire hazard.
Fire Saf. J. 2015, 76, 65–73. [CrossRef]
23. Xin, P.W.; Khan, F.; Ahmed, S. Dynamic hazard identification and scenario mapping using Bayesian network.
Process Saf. Environ. Prot. 2017, 105, 143–155. [CrossRef]
24. Cheng, H.; Hadjisophocleous, G.V. Dynamic modeling of fire spread in building. Fire Saf. J. 2011, 46, 211–224.
[CrossRef]Sustainability 2018, 10, 3810 20 of 21
25. Matellini, D.B.; Wall, A.D.; Jenkinson, I.D.; Wang, J.; Pritchard, R. Modelling dwelling fire development and
occupancy escape using Bayesian network. Reliab. Eng. Syst. Saf. 2013, 114, 75–91. [CrossRef]
26. Sarshar, P.; Granmo, O.C.; Radianti, J.; Gonzalez, J.J. A Bayesian network model for evacuation time analysis
during a ship fire. In Proceedings of the IEEE Symposium on Computational Intelligence in Dynamic and
Uncertain Environments (CIDUE), Singapore, 16–19 April 2013; pp. 100–107.
27. Landucci, G.; Argenti, F.; Tugnoli, A.; Cozzani, V. Quantitative assessment of safety barrier performance in
the prevention of domino scenarios triggered by fire. Reliab. Eng. Syst. Saf. 2015, 143, 30–43. [CrossRef]
28. Khakzad, N.; Landucci, G.; Reniers, G. Application of dynamic Bayesian network to performance assessment
of fire protection systems during domino effects. Reliab. Eng. Syst. Saf. 2017, 167, 232–247. [CrossRef]
29. Wang, J.; Yan, W.; Xu, H.; Zhi, Y.; Wang, Z.; Jiang, J. Investigation of the probability of a safe evacuation to
succeed in subway fire emergencies based on Bayesian theory. KSCE J. Civ. Eng. 2018, 22, 877–886. [CrossRef]
30. Khakzad, N. Application of dynamic Bayesian network to risk analysis of domino effects in chemical
infrastructures. Reliab. Eng. Syst. Saf. 2015, 138, 263–272. [CrossRef]
31. He, J.H.; Guan, X.D.; Yu, Y. A modeling approach for farmland protection zoning considering spatial
heterogeneity: A case study of E-Zhou City, China. Sustainability 2016, 8, 1052. [CrossRef]
32. Yuan, Z.; Khalezad, N.; Khan, F.; Amyotte, P. Domino effect analysis of dust explosions using Bayesian
networks. Process Saf. Environ. Prot. 2016, 100, 108–116. [CrossRef]
33. Lee, K.; Park, I.; Yoon, B. An approach for R&D partner selection in alliances between large companies,
and small and medium Enterprises (SMEs): Application of Bayesian Network and Patent Analysis.
Sustainability 2016, 8, 117. [CrossRef]
34. Papakosta, P.; Xanthopoulos, G.; Straub, D. Probabilistic prediction of wildfire economic losses to housing in
Cyprus using Bayesian network analysis. Int. J. Wildland Fire 2017, 26, 10–23. [CrossRef]
35. Wu, J.; Zhou, R.; Xu, S.; Wu, Z. Probabilistic analysis of natural gas pipeline network accident based on
Bayesian network. J. Loss Prev. Process Ind. 2017, 46, 126–136. [CrossRef]
36. Liyanage, C.P.; Yamada, K. Impact of population growth on the water quality of natural water bodies.
Sustainability 2017, 9, 1405. [CrossRef]
37. Wang, Z.Z.; Chen, C. Fuzzy comprehensive Bayesian network-based safety risk assessment for metro
construction projects. Tunn. Undergr. Space Technol. 2017, 70, 330–342. [CrossRef]
38. Ghasemi, F.; Hossein, M.; Sari, M.; Yousefi, V.; Falsafi, R.; Tamošaitienė, J. Project portfolio risk identification
and analysis, considering project risk interactions and using Bayesian Networks. Sustainability 2018, 10, 1609.
[CrossRef]
39. Seydehmet, J.; Lv, G.H.; Nurmemet, I.; Aishan, T.; Abliz, A.; Sawut, M.; Eziz, M. Model prediction of
secondary soil salinization in the Keriya oasis, Northwest China. Sustainability 2018, 10, 656. [CrossRef]
40. Cafiso, S.; Di Graziano, A.; Pappalardo, G. Using the Delphi method to evaluate opinions of public transport
managers on bus safety. Saf. Sci. 2013, 57, 254–263. [CrossRef]
41. Zangenehmadar, Z.; Moselhi, O. Prioritizing deterioration factors of water pipelines using Delphi method.
Measurement 2016, 90, 491–499. [CrossRef]
42. Du, B.L. Statistic analysis of the foreign underground fire accidents cases. Fire Sci. Technol. 2007, 2, 214–217.
43. Ji, J.; Zhong, W.; Zhang, Y.; Huo, R. Optimization of ventilation mode during intermediate-floor fire in a
typical multi-floor subway station. China Railw. Sci. 2010, 31, 131–136.
44. Zhong, M.H.; Engineer, S.; Engineer, S. Numerical simulation of smoke spread during subway train fire in
shallow embedded island platform. China Saf. Sci. J. 2005, 15, 10–15.
45. Report on Production Safety Accident and Regulations of Investigation and Treatment; China Legal Publishing
House: Beijing, China, 2007.
46. Francis, R.A.; Guikema, S.D.; Henneman, L. Bayesian Belief Networks for predicting drinking water
distribution system pipe breaks. Reliab. Eng. Syst. Saf. 2014, 130, 1–11. [CrossRef]
47. Kabir, G.; Tesfamariam, S.; Francisque, A.; Sadiq, R. Evaluating risk of water mains failure using a Bayesian
belief network model. Eur. J. Oper. Res. 2015, 240, 220–234. [CrossRef]Sustainability 2018, 10, 3810 21 of 21
48. Kabir, G.; Sadiq, R.; Tesfamariam, S. A fuzzy Bayesian belief network for safety assessment of oil and gas
pipelines. Struct. Infrastruct. Eng. 2016, 12, 874–889. [CrossRef]
49. Hao, A.; Zheng, S. Experimental study on the distribution of carbon monoxide concentration and temperature
rise in tunnel fires. Chin. J. Undergr. Space Eng. 2016, 12, 1185–1191.
© 2018 by the authors. Licensee MDPI, Basel, Switzerland. This article is an open access
article distributed under the terms and conditions of the Creative Commons Attribution
(CC BY) license (http://creativecommons.org/licenses/by/4.0/).You can also read