Computerized Occlusion - Using T-Scan III By Dr. J.H. Kim, DDS - T Scan
←
→
Page content transcription
If your browser does not render page correctly, please read the page content below
Computerized Occlusion
Using T-Scan® III
By Dr. J.H. Kim, DDS
Contents
Introduction .  .  .  .  .  .  .  .  .  .  .  .  .  .  .  .  .  .  .  .  .  .  .  .  .  .  .  .  .  .  .  .  .  .  .  .  .  .  .  .  .  .  .  .  .  .  .  .  .  .  .  .  .  .  .  .  .  .  .  .  .   3
Author Information.  .  .  .  .  .  .  .  .  .  .  .  .  .  .  .  .  .  .  .  .  .  .  .  .  .  .  .  .  .  .  .  .  .  .  .  .  .  .  .  .  .  .  .  .  .  .  .  .  .  .  .  .  .  .  .             4
Articles
   1. Computerized Occlusal Analysis Utilizing the T-Scan III System.  .  .  .  .  .  .  .  .  .  .  .  .  .  .  .  .  .                                                                             5
   2. Occlusal Adjustment Case Studies Utilizing the T-Scan III System .  .  .  .  .  .  .  .  .  .  .  .  .  .  .  .                                                                                15
   3. Occlusal Adjustments Utilizing Occlusal Time Principle . .  .  .  .  .  .  .  .  .  .  .  .  .  .  .  .  .  .  .  .  .  .  .                                                                   24
   4. Definition of Disclusion Time (DT) in Occlusal Adjustments .  .  .  .  .  .  .  .  .  .  .  .  .  .  .  .  .  .  .                                                                             36
User Recommendations. .  .  .  .  .  .  .  .  .  .  .  .  .  .  .  .  .  .  .  .  .  .  .  .  .  .  .  .  .  .  .  .  .  .  .  .  .  .  .  .  .  .  .  .  .  .  .  .  .  .  .  .                     45

                                                                                                                                                                                                          2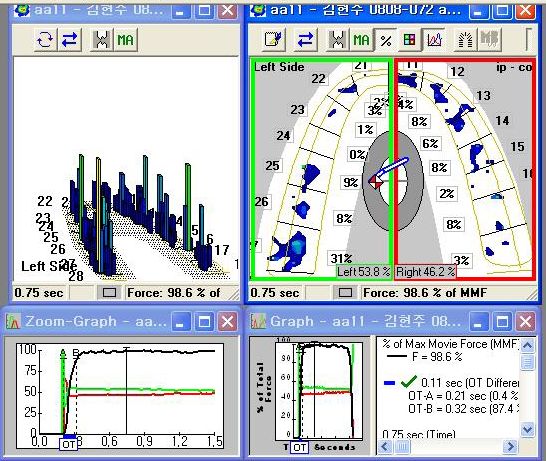
Introduction
Dentistry is a science that is largely affected by its materials and equipment. Lost and damaged teeth
require replacement or rehabilitation. Thanks to the development of differing dental materials and
precision technologies, we are now able to successfully treat clinical conditions that were previously
difficult to predictably improve. Because of the invention and development of dental implants over
the past quarter century, edentulous patients can masticate as if they had their own natural teeth
instead of wearing uncomfortable dentures. The dentist can now accurately place dental implants
into sound bony sites due to the development of 3-D computed tomography (CT). Additionally,
numerous dental laboratory restoration fabrication procedures that were previously performed
manually by dental technicians have been replaced with computer-aided design and computer-aided
manufacturing processes (CAD/CAM).

Despite the evolutions of both computer-based treatment advances, and modern age dental materials,
we have not overcome the traditional methods that are routinely used to examine the occlusion.
To date, dental medicine continues to advocate the use of Articulating Paper (primarily) as the
means to evaluate occlusal contacts prior to making occlusal adjustments. Despite that, many dental
practitioners recognize the importance of the occlusion when fabricating a dental prosthesis; dentists
continue to rely on patient “feel” statements regarding the nature of the perceived occlusal contact
comfort level, as an indicator of treatment correctness.

The T-Scan III Computerized Occlusal Analysis System (Tekscan Inc., South Boston, MA USA)
overcomes the known limitations of Articulating Paper. It quantifies and displays relative occlusal
force information, so the clinician can minimize repeated errors of incorrect occlusal contact
selection that often occur from relying solely on the combination of dental articulating paper and
patient feel. Studies repeatedly show that it can be very difficult for a clinician to predictably identify
which occlusal contact has more force than the others nearby when using articulating paper alone.
By enabling us to identify previously unobtainable occlusal force characteristics (which have never
been possible to detect with articulation paper), the T-Scan III can help ensure that high quality and
complete occlusal end-results are predictably obtained from clinical occlusal treatment.

During maxillomandibular intercuspation, time and force are the main occlusal factors the T-Scan
III can measurably isolate. It readily identifies the very first contact point that precedes numerous
other contact points that transitorily occur during maxilla-mandibular functional movements. The
T-Scan III determines the contact time-sequencing, and the percentage of relative occlusal force
between numerous occlusal contacts, and then displays them all for dynamic analysis. This enables
the clinician to better identify many interfering contacts that are not readily identified by articulation
paper markings. Due to T-Scan System improvements made over the past 25 years, we now can
successfully treat many occlusal problems and provide patients with predictable high quality occlusal
treatment end results; both of which were not previously possible.

                                                                                                              3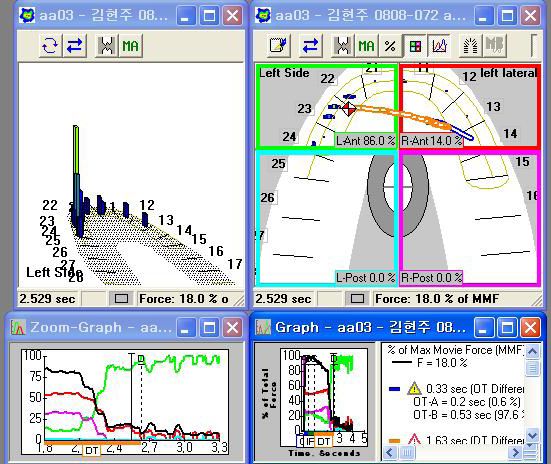
Author Information
  Dr. Jin-Hwan Kim, DDS
   Graduate School of Dentistry, Seoul National University
   Board Member of Korean Academy of Esthetic Dentistry (KAED)
   Board Member of Korean Academy of Computerized Dentistry (KACD)
   Board Member of Department of Management and Policy, Korean Dental Association
   Board Member of ICOI-Korea
   Fellow of ICOI
   Clinical Professor of Joongang University
   Clinical Professor of Hallim University
   Board Member of NMIC
   Member of NAG
   CEO of Theo Dental Inc.
   Private Practice, One Day Dental Clinic in Seoul, Korea

                                                                                    4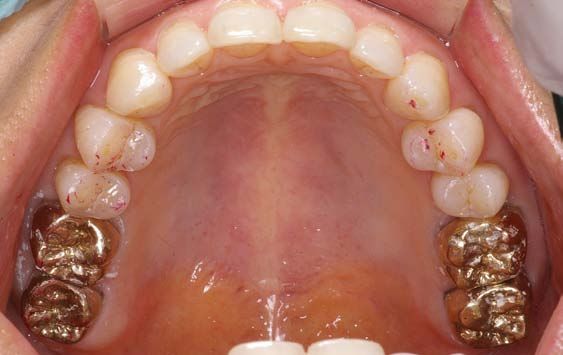
1. Computerized Occlusal Analysis Utilizing
   the T-Scan III System
                                                                           by Dr. Jin-Hwan Kim, DDS

The T-Scan III System is a dental device used to analyze relative occlusal force that is recorded
intraorally by a pressure-mapping sensor. The recorded force data is stored on a hard drive, and
can be played back incrementally for data analysis in a time-based dynamic video. The “T-Scan I”
was invented 25 years ago, and since then, the entire system has undergone hardware, sensor, and
software revisions, such that today’s “T-Scan III” system (version 7.0) is vastly improved over the
earliest “T-Scan I” system.

T-Scan III analyzes the order of the occlusal contacts while simultaneously measuring the force
percentage changes of those same contacts, from the moment the teeth first begin making occlusal
contact, all the way through to maximum intercuspation. Therefore, it can assess the initial occlusal
contact, the order that all the occlusal contacts occur in, and the amount of relative occlusal force
loading each contact. It enables us to assess the force changes, all during the process of contact
evolution. Computer-guided occlusal adjustments can then be employed to alter a poorly contacting
tooth sequence into a contact sequence where multiple equal-intensity contacts are occurring
simultaneously throughout the arches bilaterally.

                                                                                                           Article 1. Computerized Occlusal Analysis Utilizing the T-Scan III System

             The T-Scan III desktop with 4 different occlusal force and time analysis windows.

In the left top corner analysis window, the amount of relative occlusal force is displayed in
3-dimensional colored bar graphs. The color and height of each bar indicates the intensity of force
per contact. The top right corner analysis window is a 2-dimensional dental arch, in which the
occlusal contact forces are surrounded by a yellow outline that locates the contacts, while illustrating
in the same colors (as the 3-dimensional bar graph window) the differing of occlusal force levels.

                                                                                                                              5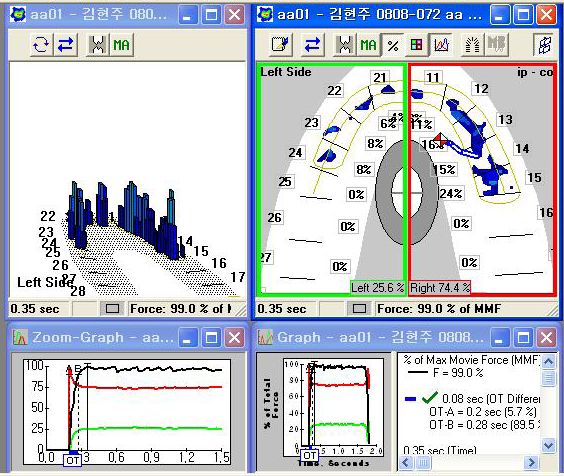
A dentist adjusts a problematic occlusal contact by finding its location in the 2-dimensional dental
arch window. In the 2-dimensional window, the right and left arch halves are outlined in green (left)
and in red (right), and their respective arch half-force percentages are calculated and displayed for
analysis at the bottom. The anterior and posterior regions can also be displayed by dividing the
2-dimensional window into 4 quadrants (pink and aqua colors are added).

The two lower windows are the “Force vs. Time” graphs. They illustrate changing occlusal force
percentages across time, in both the left arch half (green line) and the right arch half (red line). The
horizontal axis of the Force vs. Time graph indicates elapsed time, while the vertical axis indicates the
changing percentage of occlusal forces in both sides of the arch. The total force of the combined left
and right arch halves is described in the Force vs. Time Graph by the non-vertical black line.

Let us look at a clinical application of T-Scan III in a clinical case.

Articulating paper is one material that is commonly used in clinical environment. But its weak
point is that it cannot indicate the amount of the occlusal force quantitatively. We tend to assume a
vivid occlusal contact is the location where large occlusal forces are affected, but due to the Laws of
Physics, this assumption is highly erroneous:

P=F/A (pressure = force/area)

                                                                                                            Article 1. Computerized Occlusal Analysis Utilizing the T-Scan III System
What this means is that when a given amount of force is applied to an occlusal contact, the smaller
the size of the occlusal contact, the greater the resultant pressure. We have experienced this in a
clinical environment when, after removing small and delicate paper mark spots, the occlusal contacts
nearby often get bigger. Alternately, when your patient describes a high and uncomfortable contact,
it is frequently observed on a tooth where the spots of articulating paper are hardly visible.

As such, articulating paper cannot describe the amount of occlusal force present on tooth contacts.
By employing articulating paper as a force measurement device, we, as clinicians, will miss seeing
properly the occlusal force problems that affect our patients on a daily basis in our practices. (See
“A determination of the existence of a relationship between load and dental articulating paper mark
area”. Carey JP. Craig M, Kerstein RB. The Open Dentistry Journal, July 2007, for research on
applied load and mark size variances of articulating paper).

T-Scan III quantifies the amount of relative occlusal force, which enables us to predictably identify
and locate traumatic occlusal contacts.

                                                                                                                               6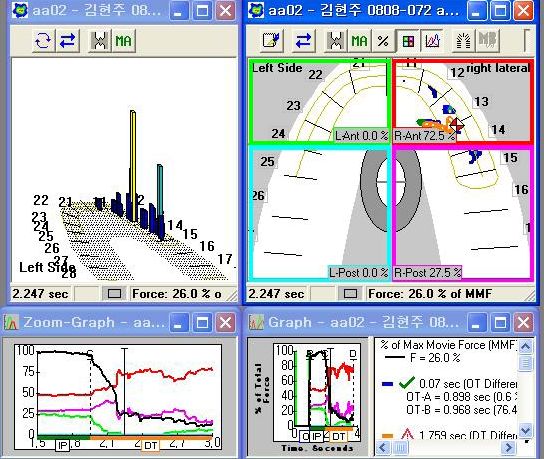
The following patient (a 52-year-old female) initially complained of having toothache, poor
masticatory force, tendency to cheek bite, and abnormal sensations present in her facial muscles. She
was having trouble coping emotionally with her daily existence because she was very uncomfortable.
These symptoms continued for about one and a half years, during which time she experienced
excessive pain in her teeth. She stated that she went to several university hospitals where no occlusal
abnormality was isolated or diagnosed.

          Panoramic x-ray during the initial visit.                      Facial view

The recognizable occlusal abnormalities were:
  a) the presence of buccal abfractions on almost every posterior tooth
  b) the canine incisal edges demonstrated wear

                                                                                                          Article 1. Computerized Occlusal Analysis Utilizing the T-Scan III System
  c) percussion testing on all teeth was normal

    Intraoral anteroposterior view         Intraoral right-sided view     Intraoral left-sided view

Attrition of tooth number 41 (Universal tooth number 25) is observed.

                                                                                                                                  7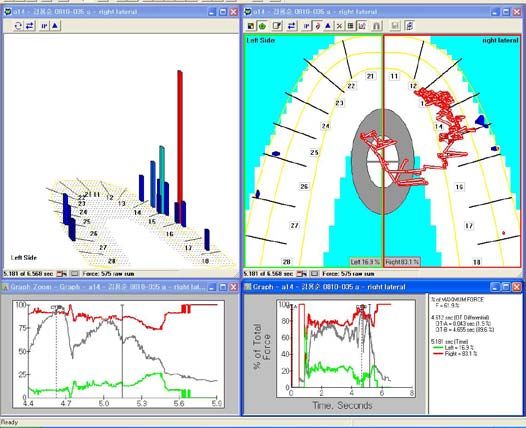
T-Scan III still image at MIP during the initial visit.

Even though the bilateral force imbalance does not appear to be large to the naked eye observing
the clinical photographs or when observing the articulating paper markings, approximately 80%
of the occlusal forces are focused the right side (red line) while the opposite left side (green line)

                                                                                                         Article 1. Computerized Occlusal Analysis Utilizing the T-Scan III System
occupies only 20% of the occlusal forces (approximately). When the patient bites firmly, severe
muscle defibrillation is also observed in the wavy form to the black total force line.

                     T-Scan III still image of left lateral excursion prior to treatment.

                                                                                                                            8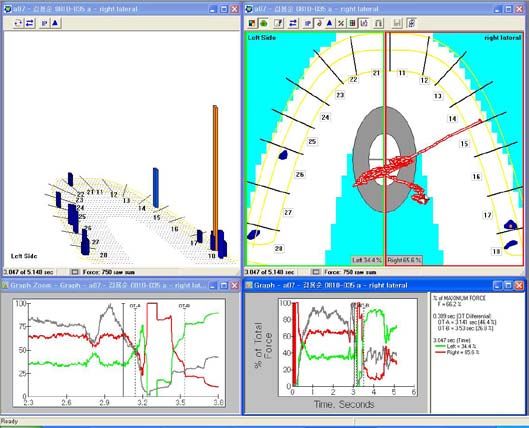
In the left lateral excursion of the mandible, the left canine, premolar, and molar teeth consist
of a group function. It is noteworthy that the right wisdom teeth receive significantly larger
forces when compared to the left wisdom teeth, resultant from an excessive interference present
on the (right) balancing side. These excursive posterior occlusal contacts cause tension within the
masetter muscles, such that the bilateral masetter muscles are fatigued when the patient makes their
mandibular movements.

                                                                                                       Article 1. Computerized Occlusal Analysis Utilizing the T-Scan III System
                 T-Scan III still image of the right lateral excursion prior to the treatment.

In the T-Scan III recording of the mandibular right lateral excursion, tooth number 18 (Universal
tooth number 1) receives a considerable load. There are also non-working interferences present on
a number of teeth on the left side. With a lack of canine guidance and the presence of posterior
group function, we can imagine that a sizeable muscular force is applied to tooth number 18 during
the excursion.

It is not easy to identify these aberrant occlusal conditions with articulating paper alone. Even if
identified with paper markings, it would be difficult to know the quantity of the force that causes
this kind of occlusal problem.

                                                                                                                          9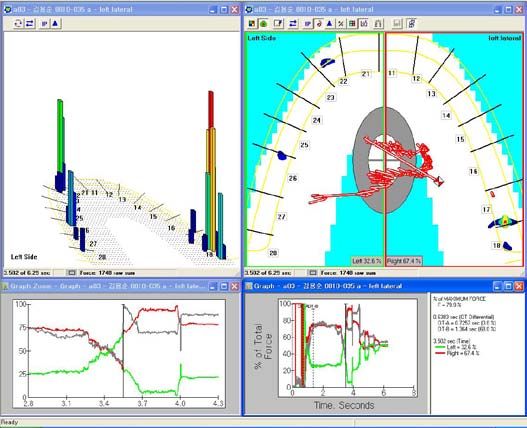
We can clearly see functional problems in the patient photographs of her lateral excursions below:

      Right lateral excursion with working group      Left lateral excursion with third molars in contact.
                    function present.

In the left lateral excursion, a wisdom tooth maintains functional contact. The T-Scan III shows the
presence of considerable load on the same wisdom tooth. From the nature of the high force, we can
determine that this wisdom tooth contact is a major interfering factor in the occlusion.

The treatment plan was to proceed with the extraction of all of the wisdom teeth. After healing,
resin restorations would be placed in the worn anterior teeth to restore the lost anterior guidance.
(Actually, the treatment was concluded with only occlusal adjustments therapy, because the patient

                                                                                                             Article 1. Computerized Occlusal Analysis Utilizing the T-Scan III System
refused the remaining proposed treatment).

           T-Scan III MIP image after extraction of wisdom tooth prior to occlusal adjustments.

                                                                                                                10
After removing the wisdom tooth, it is easy to see the improved bilateral balance and reduced muscle
defibrillation when instructing the patient to make a firm intercuspation prior to performing any
occlusal adjustments.
T-Scan III image while right lateral excursion after the removal of the wisdom tooth.
Article 1. Computerized Occlusal Analysis Utilizing the T-Scan III System
T-Scan III image while left lateral excursion after the removal of the wisdom tooth.
During the bilateral T-Scan III recordings of the right and left excursions, we can observe the forceful
contact area has been relocated forward once the wisdom tooth was extracted. This large occlusal
stress point present on the wisdom tooth during the excursion has been removed.
Starting with the above described clinical condition, our occlusal adjustment goals were to
eventually reduce the tenseness of the masetter muscles, remove muscular defibrillation, stabilize the
maxillomandibular intercuspal relationship, and improve bilateral balance.
11T-Scan III still image in MIP after computer-guided occlusal adjustments.
After a series of computer-guided occlusal adjustments, the bilateral balance is considerably improved
over the pretreatment condition. This can be observed by the posttreatment COF trajectory hugging
the 2-dimensional window midline, with its icon centered. Also improved is the volume of occlusal
Article 1. Computerized Occlusal Analysis Utilizing the T-Scan III System
contact and the force level increase that can be seen by noting the red and green column heights
present throughout the Bar Graph window.
T-Scan III still image midway thru the right lateral excursion after occlusal adjustments.
12T-Scan III still image midway thru the left lateral excursion after occlusal adjustments.
Article 1. Computerized Occlusal Analysis Utilizing the T-Scan III System
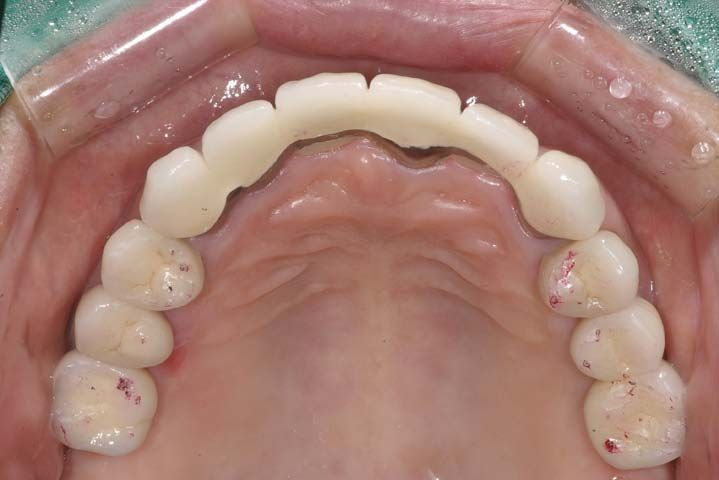
Maxillary occlusal surface with black articulating Mandibular occlusal surface with counterpart
paper markings. red articulating paper markings.
When comparing the occlusal contacts with the T-Scan III after occlusal adjustments, the column
heights in the bar graph indicate that tooth number 27 (Universal tooth number 18) has the highest
force. But the articulating paper markings are quite small there, which do not reliably show the
clinician the forceful nature of this occlusal contact. (Therefore, without the T-Scan III data, we
would not treat the most stressed and overloaded contact location).
13T-Scan III still image of recall check several weeks later.
At a recall check-up appointment several weeks later, follow-up recordings were made, which showed
a noticeable difference in the bilateral balance compared to immediately after the occlusal adjustments
were performed. Also, the defibrillation in the total force line can hardly be detected during a firm
Article 1. Computerized Occlusal Analysis Utilizing the T-Scan III System
patient intercuspation. Lastly, the mandible is well-aligned anatomically against the maxilla.
Despite the fact that tooth numbers 23 and 24 (Universal tooth numbers 11 and 12) demonstrate no
real contact, the patient’s chief complaints have been resolved, as her mastication had improved since
the treatment she underwent several weeks prior. I plan to add composite resin, or veneer prosthesis,
onto the non-contacting anterior teeth to couple all anteriors as part of the final restoration. I would
assume the patient would have come back to our clinic if she was still experiencing an occlusal
problem, but she has not returned for further treatment. I am hopeful her main complaints were
resolved as she did not seek further care.
To obtain ideal end results, the anterior teeth would require restoration. However, the occlusal
adjustment treatment was measurably finished within a safe range of desirable known occlusal
endpoints that will likely minimize any future clinical symptoms.
142. Occlusal Adjustment Case Studies
Utilizing the T-Scan III System
by Dr. Jin-Hwan Kim, DDS
In this chapter we are going to study computer-guided occlusal adjustments by utilizing T-Scan III.
Before we begin this section, let’s review some common questions dentists ask about the T-Scan III
System. These are issues that many dentists feel are problematic. Most of the questions pertain to
articulation papers and/or shim stock. They question that with the articulation papers and/or shim
stock being only 8-20 microns thick, whereas the T-Scan sensor is approximately 100 microns thick,
how does the thickness of the T-Scan III sensor affect the accuracy of the recorded occlusal forces?
The concern is that the thicker sensor (thicker than articulating paper) will affect the quality of the
gathered occlusal force and timing data.
With articulation papers, we generally do not use a “U-shaped” (horse shoe shaped) articulation
paper, unless it is to mark a Complete Denture prosthesis. Therefore, when an articulation paper
is occluded through, half the arch where the articulation paper rests has its vertical arch height
increased by the thickness of the articulating paper.
Article 2. Occlusal Adjustment Case Studies Utilizing the T-Scan III System
Conversely, when a T-Scan III sensor is placed intraorally, the “U-shape” surface contacts across the
entire arch, and with all occluding teeth. Therefore, the entire arch has its vertical height increased
uniformly; equal to the thickness of the sensor (100 microns). The uniform bilateral increase limits
the possibility of recording errors caused by sensor thickness. The only possibility of obtaining minor
recording errors might be where there are differences between the available space of the posterior
teeth (less space) versus the anterior teeth (more space). However, the recording of accidental errors
is generally minimized because the sensor is only 100 microns thick.
T-Scan III recording handle connects directly to a computer via a USB interface.
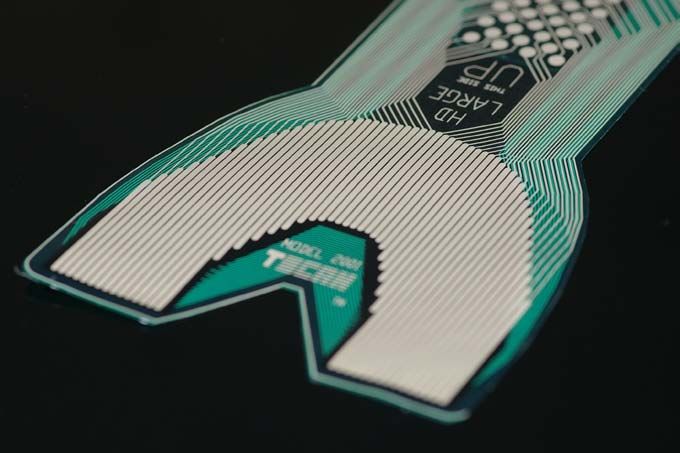
15T-Scan III sensor – 100 microns thick. When varying levels of the applied force load the sensor, differing
amounts of electricity is given off within the sensor grid. This electronic output (known as “Digital
Output” or “DO”) is then displayed for playback and analysis within the four desktop analysis windows.
Article 2. Occlusal Adjustment Case Studies Utilizing the T-Scan III System
Another question often asked by dentists is why aren’t the occlusal forces displayed in absolute force
values, and instead displayed as relative force values? The T-Scan III computes relative force values
instead of absolute values. Recording force variability can occur when measuring absolute force
values (i.e. tooth number 16 or Universal tooth number 3), because the applied force would change
between different intercuspations, as the muscular force can vary widely in differing mandibular
intercuspations. Alternately, if the same amount of muscular force is used during repeated mandibular
intercuspations, the uneven topography of the contacting occlusal surfaces can slightly alter not only
where on the contact points hit, but the applied force as well. Therefore, by measuring relative force
levels across elapsed time on the different cusps and fossa, we can readily locate the contacts that
strike too early, and locate the contacts where there is too much or too little occlusal force.
Let us look at a second case treated with the T-Scan III.
The following patient complained that she felt frequent jaw discomfort, and could not open her
mouth smoothly because her jaw would “slip”. At an oral medicine department of a university
hospital where she had received initial posterior prosthetic treatment, she was told that “nothing was
wrong” and no abnormality was detected in her TMJs.
16Pre-treatment Panoramic x-ray – Patient presented to our clinic after removing the prosthesis
in the right side due to ongoing discomfort after prosthesis installation five months prior.
Article 2. Occlusal Adjustment Case Studies Utilizing the T-Scan III System
TMJ Images – No obvious bone degeneration is observed.
My treatment plan was to restore the posterior teeth prosthetically, and then perform T-Scan III
occlusal adjustments upon the rest of the occlusion at the same appointment. The patient declined to
undergo treatment at the time of consultation, but reappeared at my clinic five months later, wearing
a newly fractured provisional prosthesis. She explained to me that she had the prosthesis fabricated
at a different dental clinic (not the clinic where the original prosthesis was made).
She then told me that her jaw discomfort had gotten worse, that she felt her teeth were too low. She
was also quite uncomfortable during eating. At the second clinic, she had the original prosthesis
removed and had tooth number 46 tooth (Universal tooth number 30) occlusally adjusted. This
resulted in a subtle loss of occlusal vertical dimension that increased her overall discomfort. She
requested that I not “grind” any natural teeth during the course of future treatment.
17Panoramic x-ray upon patient’s return 5 months later – Patient reported jaw discomfort, abnormal
mastication, and abnormal temporomandibular joint function, after bridge and crown prosthesis was
installed at second dental clinic. The prosthesis was removed, and the patient was reimbursed.
My treatment plan consisted of restoring tooth numbers 16, 17, 46 and 47 (Universal tooth numbers
2, 3, 30, and 31) with crowns, and placing a lower left fixed bridge onto tooth numbers 35-37
Article 2. Occlusal Adjustment Case Studies Utilizing the T-Scan III System
(Universal tooth numbers 18-20) to replace the missing lower left first molar. Then, I would conduct
a T-Scan III analysis that would be followed up with computer-guided occlusal adjustments to the
entire occlusal scheme. The patient was quoted a separate fee for the T-Scan III analysis and follow
up computer-guided occlusal adjustments (apart from the fees for the crown and bridgework). Prior
to my instituting any prosthetic treatment, the patient was required to undergo apical root canal
procedures for tooth number 46 (Universal tooth number 30) at a university hospital.
Pretreatment T-Scan III still image of patient’s MIP. An extreme occlusal imbalance is present.
The pretreatment T-Scan III MIP recording shows the presence of a severe force imbalance
(74% - 26%) between the right and left arch halves. Some defibrillation can be noted in the Total
Force line (wavy nature of the black line) in the Force vs. Time Graph.
18Comparison of right and left force distribution pretreatment.
We can observe the poor force distribution between left and right side (25.6% - 74.4%). Part of this
imbalance is due to the presence of one more occluding tooth in the right arch half that has no cross
arch left side counterpart tooth (number 15 or Universal number 4). Even taking tooth number 15
into account, and subtracting its force percentage (24%) from the total force percentage of the right
side, the resultant force imbalance is still significant (45.5% right - 26.4% left).
Still T-Scan III image of MIP force distribution after dividing out the right second premolar from
Article 2. Occlusal Adjustment Case Studies Utilizing the T-Scan III System
the force percentage comparison of right anterior (red box) to left anterior (green box).
Even without the right premolar tooth, there is still more force distributed within the right arch half.
This severe force disproportion has resulted in this sensitive patient feeling as if her occlusal surfaces
were “declined”.
The T-Scan III helps us to measurably adjust and create a balanced force distribution between the
left and right arch halves, and the anterior and posterior quadrants. “Force mapping” is a T-Scan III
system attribute that makes it possible for a clinician to redistribute the unbalanced occlusal force
into an occlusal condition where the occlusal forces are no longer disproportionate. This patient’s
pretreatment T-Scan III data is an occlusal condition in need of occlusal force redistribution.
19Still T-Scan III image during right lateral movement pretreatment.
Article 2. Occlusal Adjustment Case Studies Utilizing the T-Scan III System
Still T-Scan III image during left lateral movement pretreatment.
T-Scan III recordings were used to force-map the provisional restorations after they were installed,
so as to determine the overall right to left force balance, and to observe any specific tooth that is
receiving force excess.
20Still T-Scan III MIP image after placement of provisional restorations
followed by computer-guided occlusal adjustments.
After placement of all the provisional restorations bilaterally and computer-guided occlusal
adjustments, the right to left force distribution is nearly evenly distributed at 53.8% left vs. 46.2%
right. Observing the force distribution percentages of individual teeth, the left second molar tooth is
Article 2. Occlusal Adjustment Case Studies Utilizing the T-Scan III System
receiving 31% of the entire left side force, indicating the need for further adjustment there; to lessen
its total applied load.
Enlarged T-Scan III image – The left second molar tooth is receiving 31% of the left side total force.
The percentage force difference between the right second molar tooth and left second molar tooth
is 28%. This represents a huge difference in comparative applied load. This load difference between
these two cross-arch teeth is severe enough that we need to adjust it. This is especially true in sensitive
patients who can be affected physically by occlusal imbalances of this nature. It is important that we
do not miss this point.
21T-Scan III still image of Force-mapping after another occlusal adjustment was performed
upon the previous force distribution of the provisional restorations.
By adjusting the overloaded left second molar tooth number 27 (Universal tooth number 15),
the force is reduced on that second left molar tooth while the right third molar tooth number 18
(Universal tooth number 1) takes on more occlusal force. The entire force distribution of 46.9%
Article 2. Occlusal Adjustment Case Studies Utilizing the T-Scan III System
(left) and 53.1% (right) represents reasonable occlusal balance.
After the patient has worn the provisional occlusion without discomfort for a few months time, the
permanent restorations can be installed with a T-Scan III analysis at time of placement. The entire
restorative treatment was then completed with a final series of computer-guided occlusal adjustments.
T-Scan III still image of MIP after final prosthesis insertion.
The initial final restoration force-mapping shows the overall occlusal force balance is 40% left -
60% right, which is not ideal. When comparing the right and left individual tooth force percentages,
there is near-even cross arch tooth force percentages, with no specific tooth receiving excessive force.
22The patient’s main complaints are almost completely resolved. She stated the pretreatment feelings
of her jaw being “declined“, the discomfort in the temporomandibular joints, and the pain she
experienced during mastication, have all disappeared. In this specific case, it was not easy to establish
a highly balanced occlusal end-result, because the patient would not allow me to perform any occlusal
adjustments to her natural teeth. She was a very sensitive patient that, posttreatment, continued to
experience unexplainable discomfort near the right molar teeth.
Photograph of occlusal contact after the Frontal view
insertion of the final prosthesis.
Article 2. Occlusal Adjustment Case Studies Utilizing the T-Scan III System
As can be seen in the facial photograph, she is a very sensitive and emotionally affected patient.
It was difficult for me to photograph the final occlusal contact points because of a lack of
patient cooperation.
By using the T-Scan III Force-mapping capability, we were able to reliably identify the overall arch
force imbalance, which we cannot do with articulation paper because articulating paper is incapable
of reliably measuring relative occlusal forces. By restoring the occlusion with crowns and bridges,
and refining the newly restored occlusion with Force-mapping data, were able to resolve most of this
difficult patient’s long-standing occlusal complaints, and uncomfortable symptoms.
233. Occlusal Adjustments Utilizing Occlusal
Time Principle
by Dr. Jin-Hwan Kim, DDS
Let’s look at the occlusal time (hereinafter OT), which is a very important concept in utilizing
T-Scan III. We will review the occlusal adjustment sequence and OT with case studies.
Prior to studying OT, we should observe and understand the Center of Force icon and Trajectory line
(hereinafter COF). The COF is the force summation of all the occlusal contact points at any given
moment in a T-Scan III recording. When a contact occurs with an occlusal force increase, the force
summation location of all contacts is described by the COF location and Trajectory line. The COF
is the location of the force summation of all the occluding contact surfaces that changes throughout
the entire closure contact sequence.
Article 3. Occlusal Adjustments Utilizing Occlusal Time Principle
COF is the diamond shaped white and red icon. The blue line reflects the history
of the changes the COF makes thru the entire closure sequence.
The length of the OT Trajectory indicates the duration of elapsed time from 1st tooth contact to
the time-moment that static intercuspation is initially reached and maintained. It shows how fast
and simultaneously teeth contact. The shorter the OT, the less time required to contact all teeth.
Dr. Robert Kerstein recommends to keep OT less than 0.2 seconds.1
1. Kerstein, R.B., Grundset, K., Obtaining Bilateral Simultaneous Occlusal Contacts With Computer Analyzed
and Guided Occlusal Adjustments. Quintessence Int. 2001;32:7-18
24In the Force vs. Time Graph below, the OT indicates the time from point A to point B (noted in
with purple circles). In this patient, the OT is not long. By looking at the graph data box outlined in
purple, the OT is only 0.126 seconds. By observing the force ratio at point B, the maximum movie
force line indicates that, at B, the patient has generated 78% of their maximum force.
The figure below shows the force pattern at point A.
Article 3. Occlusal Adjustments Utilizing Occlusal Time Principle
The initial contact occurs in tooth number 22 and 12 (Universal tooth numbers 10 and 7).
25The figure below shows the force pattern at point B.
The duration of elapsed time from the point A to point B is called the OT. For this patient, OT is
0.126 seconds. After point B, the COF maintains its same position (in the 2-dimensional window)
from this moment until the maximum movie force is reached. As far as this patient, there is no
problem with OT duration, but the force balance between right and left is quite uneven.
Panoramic radiograph before and after the treatment. Article 3. Occlusal Adjustments Utilizing Occlusal Time Principle
The patient received a number of posterior implants with anterior maxillary crowns from 1st molar
right to 2nd molar left. The mandible was restored only in the posterior. During a recall check
after placement of the entire restoration, the patient felt discomfort in her right side that was more
noticeable to her when compared to her left side.
26Photograph of occlusal contacts in MIP prior to T-Scan III analysis
(right teeth on right; left teeth on left).
Article 3. Occlusal Adjustments Utilizing Occlusal Time Principle
Still cut image of T-Scan III in MIP of the photographed occlusal points.
When comparing T-Scan III data with the paper markings in the photograph, we can see the
accidental force determination errors caused by observing paper mark shapes. The maxillary left
articulation paper marks appear to indicate that the left posterior teeth are receiving more force than
the right side. But in reality when forces are measured with the T-Scan III, we find that the posterior
right teeth are receiving more force (63.5% right - 36.5% left).
In T-Scan III, tooth number 16 (Universal tooth number 3) receives more force compared to the rest of
teeth, we should correct the mesial lingual region of the this tooth (it receives 27% of the entire occlusal
force distribution).
27Occlusal adjustment needed in the mesial lingual area of tooth number 16 tooth (Universal
tooth number 3). This is the highest force contact as seen with T-Scan III.
Article 3. Occlusal Adjustments Utilizing Occlusal Time Principle
Photographed Occlusal contacts in MIP after the first occlusal adjustment.
28T-Scan III still image after the first occlusal adjustments.
After the 1st correction, tooth number 16 has an improved force percentage (now only 13%). There
is improved right to left occlusal balance. We could suspend occlusal treatment at this point because
of the marked improvements, but if more micro occlusal refinement occlusal adjustment are desired,
we can increase the recording Sensitivity, to make the sensor slightly more active, so as to locate any
early or overloaded occlusal contacts.
Article 3. Occlusal Adjustments Utilizing Occlusal Time Principle
Image with one step elevated in sensitivity during T-Scan III recording.
This is a T-Scan III still image of the same patient seen above (without any changes made to the
occlusion where the force is evenly distributed in both the right and left sides), that has been recorded
at the next highest Sensitivity Level (increased by 1 level).
29Compared to the condition prior to the sensitivity changes, the T-Scan data shows more relative
force on tooth number 16, with increased loading on tooth numbers 13 and 14 (Universal tooth
numbers 3, 4, and 6).
Article 3. Occlusal Adjustments Utilizing Occlusal Time Principle
One more step elevated sensitivity in T-Scan III program.
This is a T-Scan III still image with 1 level increased recording sensitivity. The distribution of force
has moved back to the right. The distal of tooth number 13 is receiving a large amount of force now,
that was not present after an occlusive adjustment recorded at the slightly lower Sensitivity.
30One more step elevated sensitivity in T-Scan III program.
Article 3. Occlusal Adjustments Utilizing Occlusal Time Principle
From elevating one more step in the sensitivity of T-Scan III without any changes made to the oral
environment, we can more clearly observe the focused force near tooth number 13. After the first
occlusal adjustments, by simply increasing the sensitivity, we can identify the necessity for further
occlusal adjustment on tooth number 13 (Universal tooth number 6).
31Still image in MIP after the further occlusal adjustments.
Article 3. Occlusal Adjustments Utilizing Occlusal Time Principle
Comparison with the MIP after further elevating the sensitivity.
32Photographs of the occlusal points in the oral cavity after the 1st occlusion adjustment.
The small occlusal paper markings present on the distal aspect of tooth number 13 (Universal tooth
number 6). This is the area requiring occlusal adjustment.
Article 3. Occlusal Adjustments Utilizing Occlusal Time Principle
Photographs of the occlusal points in MIP after adjusting #13 tooth.
After additional occlusal adjustment of tooth number 13 (Universal tooth number 6), we can see
more occlusion contacts appearing on all the posterior right teeth.
33T-Scan still image in MIP after adjusting occlusion of #13 tooth.
After occlusal adjustment of tooth number 13, we can see near-perfect force distribution bilaterally.
Each tooth demonstrates equal force distribution to its counterpart tooth bilaterally (i.e. number
14 = 17%; number 24 = 19%; number 15 = 13%; number 25 = 13%). The right and lef t sides
equals a 50:50 ratio in overall force distribution.
Article 3. Occlusal Adjustments Utilizing Occlusal Time Principle
MIP in one step elevated in T-Scan III sensitivity after occlusal adjustments of #13 tooth.
From looking at the graph, the Total Force black line is stable, and maintained without any
defibrillation. The OT is complete in a short time (.059 sec) and COF is centered, and maintains its
position without any movement after point B.
34With this patient, I located the exact location of the forceful problematic tooth contacts, and then
conducted the needed occlusal adjustments by utilizing T-Scan III. I was able to conduct the most
ideal occlusal adjustments in a short amount of chair time, because the T-Scan III insures I make
very targeted and accurate occlusal corrections. As a matter of fact, in this case, the time spent in the
actual occlusal adjustment was minimal. The thing that prolonged treatment was the time required
to make the photographs.
From the first T-Scan III recording and downloading at 09:47 hrs,
the treatment was completed at 10:27 hrs.
Though it took a total of 40 minutes, (including shooting the photographs, and the time required
Article 3. Occlusal Adjustments Utilizing Occlusal Time Principle
to download the occlusal data of 13 MIP recordings), the actual treatment time was less than 20
minutes. It is a case study that illustrates a near-perfect occlusal adjustment was completed in less
than 20 minutes.
354. Definition of Disclusion Time (DT) in
Occlusal Adjustments
by Dr. Jin-Hwan Kim, DDS
We have studied the Occlusion Time, which is one of the important concepts in utilizing T-Scan III.
Now let’s look at Disclusion Time (hereinafter DT) which is as important as OT, if not,
more important.
Disclusion is to separate contacting molar teeth during the three mandibular movements:
1. Right excursion
2. Left excursion
3. Protrusive excursion
Disclusion Time is the duration of time required to reach solely the canine or anterior teeth after
leaving from MIP (maximum intercuspal position) during a mandibular excursion. Prolonged
contact durations of opposing teeth in the molar region increases masticatory muscle activity. Various
clinical problems can result from this increased muscular activity, present within the masetter and
temporalis muscles.
Dr. Robert Kerstein established the concept of DT throughout numerous clinical case studies
and academic research published over the past 21 years. The longer the DT lasts, the longer the
Article 4. Definition of Disclusion Time (DT) in Occlusal Adjustments
masetter muscles are firing excessively (this can be observed with Electromyography). By adjusting
the DT to be less than 0.4 seconds2 per excursion, we can prevent the increased muscular excessive
force from excessively loading posterior teeth, their supporting periodontal tissues, and the
temporomandibular joints.
The method to calculate DT with the T-Scan III is to determine the point when a lateral movement
begins from MIP (known as the “C” - point in the T-Scan III Force vs. Time Graph), and then
determine the location where there is no longer any contact distal to the canine teeth (known as the
“D”- point). The time difference between the C and D points is the DT duration.
2. Kerstein, R.B., Wright, N., An Electromyographic and Computer Analysis of Patients Suffering from Chronic
Myofascial Pain Dysfunction Syndrome; Pre and Post - Treatment with Immediate Complete Anterior Guidance
Development. Journal of Prosthetic Dentistry 1991; 66(5):677 - 686.
36The following T-Scan III example shows the DT of a patient’s left excursion:
C-point in T-Scan III Force vs. Time Graph; denoted by the red circle. Indicates the
commencement of an excursion from MIP.
Article 4. Definition of Disclusion Time (DT) in Occlusal Adjustments
D-point in T-Scan III Force vs. Time Graph; denoted by the red circle. Indicates the
posterior teeth have been discluded completely by the canine and/or the anterior teeth.
37The enlarged T-Scan III two-dimensional window shows 0% force in both the right and left
posterior quadrants at the D-point (outlined by the red circle).
Within the data box of the Force vs. Time Graph (inside the red rectangle), the DT = 1.108
seconds, which means that 1.108 seconds elapses from the time that the mandible starts moving
left until the posterior regions bilaterally completely disclude. This patient’s DT is too long
Article 4. Definition of Disclusion Time (DT) in Occlusal Adjustments
(>.4 seconds), indicating the need for removal of the prolonged occlusal contacts that likely will cause
muscular disturbances.
As we saw earlier, we can calculate how quickly the disclusion occurs by calculating the time from
point C to point D. As was mentioned earlier, the longer the DT lasts, the more it will affect the
temporomandibular joints, tooth friction, and muscle function. Based on Dr. Kerstein’s research,
< 0.4 seconds is the recommended DT guideline.
Let’s see how a short maintained DT influences long term occlusal health with a case study.
This patient is a Chinese student studying overseas, who presents with poor oral hygiene that is
accompanied by severe pervasive dental caries and significant dental abrasion. A full mouth
reconstruction was conducted and accompanied by conservative treatment, prosthetic treatment
and an implant operation while maintaining the existent prosthesis as much as was possible.
38Panoramic and cephalometric radiographs before treatment.
Article 4. Definition of Disclusion Time (DT) in Occlusal Adjustments
Retracted facial view, occlusal views, and lower facial view prior to treatment.
The patient presented with excessive tooth attrition, and caries throughout the mouth. The
patient reported brushing his teeth once a day, but often did not brush at all. I utilized the vertical
dimension based upon the previously restored teeth, then repaired the maxillary teeth with crowns,
the mandibular teeth with composite resin restorations, and one implant.
39Panoramic and cephalometric radiographs after treatment.
Article 4. Definition of Disclusion Time (DT) in Occlusal Adjustments
Retracted facial view, occlusal views, and lower facial view after treatment.
The patient was satisfied with the clinical results. The most important part of the restoration was to
perform an adequate occlusal adjustment, and then educate the patient on the subject of proper oral
hygiene technique.
As described earlier, a DT of approximately 0.4 seconds was created for this patient, and the
treatment was designed so that the molar disclusion could be rapid in the posterior quadrants during
lateral movements.
40T-Scan III still image of MIP after prosthetic treatment.
Posttreatment, there is a balanced right to left occlusal force (the green and red lines overlap each
other in the center of the Force vs. Time graph below).
Article 4. Definition of Disclusion Time (DT) in Occlusal Adjustments
T-Scan III still image midway thru the left excursion after prosthetic treatment.
The disclusion in the posterior region approximates to 0.4 seconds DT midway thru the left excursion.
41T-Scan III still image during right excursion after prosthetic treatment.
Posttreatment the left posterior teeth are in contact early in the right excursion, although the DT is
not too long.
Article 4. Definition of Disclusion Time (DT) in Occlusal Adjustments
Photograph of right lateral movement after prosthesis and occlusal adjustments.
By observing the case with the T-Scan III after two years and six months since insertion, we can
see similar balanced force distribution from “after case insertion” has been maintained and no
defibrillation was observed during firm intercuspation.
42T-Scan III still image of MIP two and a half years later.
Article 4. Definition of Disclusion Time (DT) in Occlusal Adjustments
T-Scan III still image during the left excursion two and a half years later.
The DT is 0.146 seconds long as the green and red lines diverge rapidly from each other during the
left excursion in a very short time frame (between C and D in the Force vs. Time Graph).
43T-Scan III still image during the right excursion two and a half years later.
The posterior disclusion in the right excursion was only 0.234 seconds in duration. As shown in
the Force vs. Time Graph, the green and red lines diverge rapidly from each other during the right
excursion as well (between C and D), indicating disclusion occurs in a very short time frame.
Article 4. Definition of Disclusion Time (DT) in Occlusal Adjustments
Follow up photograph after two years and six months.
Clinical observation of the gingiva near the anterior crowns after two and a half years shows no
inflammation or redness present. This healthy gingiva is resultant from both the improved oral hygiene
and the removal of harmful occlusal forces that were present on the anterior teeth pretreatment.
Therefore, we can prevent damage from harmful force caused by the increased activation of the
masetter muscles, by controlling the DT duration at less than 0.4 seconds. Both in the short and
long term, shortening the DT toUser Recommendations
“An occusal adjustment is a “brainteaser” in dental treatment; especially if there is a restorative
component in combination with an implant, because it is difficult for the patient to be able to sense
their occlusion. We can readily use the time measurement advantages of T-Scan in this clinical
situation. I consider the T-Scan to be a very useful tool to detect early contacts or create the bilateral
balances of occlusal force.”
Prof. Nam-Sik Oh, Dept. of Prosthetics, Inha University Dental Hospital
“T-Scan is a very effective occlusion evaluation system that enables us to conveniently check the
occlusal balance in cases of full mouth rehabilitation, and in a wide range of the occlusive treatments.”
Prof. Sung-Bok Lee, Dept. of Prosthetics, Dental Hospital, Kyunghee East-West Neo
Medical Center
“T-Scan is an easy tool that makes it possible to treat unsolvable occlusive tasks we face in the clinical
environment. It is the only device that enables us to estimate the force differences between an
implanted tooth and the natural tooth in occlusion. T-Scan is the source of the power in my clinic.”
Dr. Moon-Hwan Chung, DDS, Private Practitioner (Dallas Dental Clinic)
“Why use a T-Scan? That is what I heard often from patients: ‘I was comfortable after an adjustment
with articulation paper, but now I am even more comfortable.’ T-Scan identifies the exact locations
that articulation paper cannot find. By adjusting these locations, almost every patient is satisfied.
Besides, thanks to the precise information gathered by T-Scan, I am able to provide an improved
occlusion service; especially for patients who received an implant prosthesis, without any prior
experience with this occlusal measuring device. I have used this device since 1992 and I confidently
recommend it to any clinician.”
Prof. Sung-Woo Hong, head of Dental Hospital, Gachon University Gil Hospital
45Tekscan, Inc.
307 West First Street
South Boston, MA 02127 USA
617.464.4500 / 800.248.3669
marketing@tekscan.com
www.tekscan.com/dentalYou can also read