Non compulsory measures sufficiently reduced human mobility in Tokyo during the COVID 19 epidemic - Nature
←
→
Page content transcription
If your browser does not render page correctly, please read the page content below
www.nature.com/scientificreports
OPEN Non‑compulsory measures
sufficiently reduced
human mobility in Tokyo
during the COVID‑19 epidemic
Takahiro Yabe 1, Kota Tsubouchi2, Naoya Fujiwara 3,4,5
, Takayuki Wada6,
Yoshihide Sekimoto4 & Satish V. Ukkusuri 1*
While large scale mobility data has become a popular tool to monitor the mobility patterns during the
COVID-19 pandemic, the impacts of non-compulsory measures in Tokyo, Japan on human mobility
patterns has been under-studied. Here, we analyze the temporal changes in human mobility behavior,
social contact rates, and their correlations with the transmissibility of COVID-19, using mobility data
collected from more than 200K anonymized mobile phone users in Tokyo. The analysis concludes
that by April 15th (1 week into state of emergency), human mobility behavior decreased by around
50%, resulting in a 70% reduction of social contacts in Tokyo, showing the strong relationships with
non-compulsory measures. Furthermore, the reduction in data-driven human mobility metrics showed
correlation with the decrease in estimated effective reproduction number of COVID-19 in Tokyo. Such
empirical insights could inform policy makers on deciding sufficient levels of mobility reduction to
contain the disease.
The COVID-19 pandemic has posed unprecedented challenges for cities around the g lobe1. Countries have
tackled this challenge with a variety of non-pharmaceutical interventions (NPIs), ranging from complete regional
lockdowns, closures of non-essential businesses, to testing and tracing2. In order to monitor, analyze and evaluate
the impacts of such interventions, large scale mobile phone data has been identified as an effective data source3.
Previous studies on human mobility analysis have shown that such large-scale mobility data collected from
mobile devices (e.g. GPS, call detail records) may be used to assist the modeling of epidemic s pread4–7. During
the current COVID-19 crisis, researchers from academia, industry, and government agencies have started to
utilize large-scale mobility datasets to estimate the effectiveness of control measures in various countries includ-
ing China, Germany, France, Italy, Spain, Sweden, United Kingdom and the United States8–18.
Several studies have been conducted to analyze the mobility patterns in Japan during the state of emergency
due to COVID-1919. Moreover, private companies such as Agoop20 and NTT Docomo21 have visualized changes
in population distributions during the spread of COVID-19 using mobile phone data. However, we lack studies
that attempt to analyze the mobility behavioral changes in Japan and to further understand its correlation with
the spread of COVID-19. Japan, in particular, has experienced a low number of cases and deaths due to COVID-
19 in comparison to other countries in Europe and America, despite the social and physical proximity to China
and intervention policies that are not as aggressive as some of the other countries22,23. NPIs implemented by the
Japanese government include non-mandatory closures and remote-working of non-essential business employ-
ees (February 26th), closures of public elementary, junior high and high schools (March 2nd), and incremental
inbound entry restrictions, starting with personnel who have visited Hubei Province, China (February 3rd), until
restricting inbound visitors from 73 countries (April 3rd). In the case of Japan, the current justice system does
not allow the government to lay out a mandatory lockdown. Such differences in policies and COVID-19 spread
dynamics make Japan an interesting case study for international comparative analysis. The objective of this paper
is to provide empirical analysis on the effects of such non-compulsory NPIs on changes in (1) individual human
mobility behavior and (2) amount of social contacts, and to (3) analyze the correlations between such mobility
1
Lyles School of Civil Engineering, Purdue University, West Lafayette, IN, USA. 2Yahoo Japan Corporation, Tokyo,
Japan. 3Graduate School of Information Sciences, Tohoku University, Sendai, Japan. 4Institute of Industrial Science,
The University of Tokyo, Tokyo, Japan. 5Center for Spatial Information Science, The University of Tokyo, Kashiwa,
Japan. 6Graduate School of Human Life Science, Osaka City University, Osaka, Japan. *email: sukkusur@
purdue.edu
Scientific Reports | (2020) 10:18053 | https://doi.org/10.1038/s41598-020-75033-5 1
Vol.:(0123456789)
www.nature.com/scientificreports/
Figure 1. Macroscopic mobility dynamics. (A–C) show the population distributions on three different dates at
same times (12 p.m.), each on the same day of week (Mondays). Substantial decrease in the population density
at stations and cities along the Yamanote-line (ring railway) can be observed. (D) shows the timeline of the
COVID-19 response and occurrence of new cases in Tokyo. Green bars show the number of cases for each
day, blue annotations show inbound travel restrictions, and red annotations list related events and the policy
interventions by the Japanese Government.
changes and transmissibility of COVID-19. In this study, large-scale mobility data collected from more than 200K
mobile phones across a four month period in Tokyo are used to answer the aforementioned research questions.
Results
Macroscopic mobility dynamics and timeline. Panels A–C in Fig. 1 show the daytime population dis-
tributions on three different dates at same times (12 p.m.), each on the same day of week (Mondays) in Tokyo,
Japan. Mobile phone data were interpolated to produce movement trajectories, and the locations of the users
on each day were spatially aggregated into 100 m grid cells. The population density was corrected by dividing
the observed population in each grid cell by the total number of observed users on each day, as the number of
active users had daily fluctuations. As shown in previous studies24, we observe high population density along the
railway lines and hub stations during the daytime. Comparing the three panels, we observe substantial decrease
in population density at stations and cities along the Yamanote-line (ring railway), such as Shibuya, Shinjuku,
Akihabara, and Tokyo Stations. By April 14th, which was 1 week after the declaration of state of emergency, these
hub stations had a 76–87% decrease in visits compared to the baseline, which was computed by taking the aver-
age population density of weekdays at the same times before the crisis (January 2020).
Figure 1D shows the timeline of the COVID-19 response and occurrence of cases in Tokyo Metropolis.
Green bars show the number of cases for each day, blue annotations show inbound travel restrictions, and red
annotations list the policy interventions by the Japanese Government. The number of cases for each day were
obtained from the Tokyo Metropolitan Government website25. Major non-pharmaceutical measures taken by
the government include issuing non compulsory requests for remote working to private companies on February
26th, and closing public schools (elementary, junior high, and high schools) from March 2nd until the end of the
semester, which is usually the end of March26. The 2020 Olympic Games were postponed for a year on March
24th, and the State of Emergency (SoE) was declared on April 7th. Entry restrictions for inbound travellers were
gradually reinforced, with the first restriction on February 3rd from Hubei Province, China. The restrictions
were expanded to all foreign nationals who visited China or South Korea during the past 14 days on March 5th,
and to 73 countries including the United States on April 3rd.
Changes in human mobility behavior. Here, we evaluate how individual users’ mobility behavior has
changed before and after the state of emergency in Tokyo, Japan. Figure 2 shows the transitions of various met-
rics of individual mobility patterns. Panels A and B in Fig. 2 show the mean and median values of the radius of
gyration (RG) and total travel distance (TTD), which characterize the magnitude and extent of individual mobil-
ity behavior27 (see “Materials and methods”). We observe two steps of decrease in both metrics, the first starting
around the end of February and stabilizing until late March, and the second which is a more rapid decrease until
April 15th. Both the mean and median values of RG and TTD have been reduced by 50% of the typical values
Scientific Reports | (2020) 10:18053 | https://doi.org/10.1038/s41598-020-75033-5 2
Vol:.(1234567890)
www.nature.com/scientificreports/
Figure 2. Changes in individual mobility patterns. Temporal transition of mean and median radius of gyration
(A), total travel distance per day (B) and their complementary cumulative distribution functions (C), (D),
respectively. Panel (E) shows the rate of staying κ meters within estimated home locations. Red vertical lines in
panels (A, B, E) show the timings of NPIs (remote work request, public school closure, and state of emergency,
respectively).
by the end of the observation period on April 15th. Panels C and D in Fig. 2 show the complementary cumula-
tive probability distribution plots for both mobility metrics across three different dates, January 20th (before the
pandemic), March 30th (before the state of emergency), and April 14th (after the state of emergency), which are
all Mondays. The RG values observe a dip at around 20 km, which corresponds to the diameter of the Tokyo Met-
ropolitan area (scale shown in Fig. 1A–C). This implies that while the majority of the individuals move within
the metropolitan area, some individuals travel to different regions outside Tokyo. In both mobility metrics, we
observe substantial tempering of the tail probability as time passes. This indicates a decrease in relatively long
distance travelers (> 20 km for RG and > 100 km in TTD), reflecting the decrease and closures of airlines and
inter-urban railways that travel outside the metropolitan Tokyo area. Figure 2E shows the rates of users staying
κ meters within their estimated home locations. This figure suggests that the rate of people staying close to their
estimated home locations increased since mid-March and doubled by April 15th regardless of the threshold
value κ, reflecting the increase in people working from home and spending time within their neighborhoods.
Social contact analysis. Figure 3 shows the results of the social contact analysis in Tokyo over the obser-
vation period (see “Materials and methods”). The panel figures show the temporal transitions in the relative
average social contact index. The contact index is calculated by tracking the number of individual users that
each user is observed to be co-located in a given temporal window, using the interpolated trajectory data. We
have used 100 m as the spatial threshold parameter for detecting potential co-location events in this analysis.
The social contact indexes were normalized by the mean peak contact index values observed prior to the pan-
demic (January 2020). Thus, in Fig. 3, contact index value of 1 indicates the average amount of observed contacts
during peak hours on a typical weekday prior to the pandemic. The temporal periodicity in Fig. 3 A shows the
daily and weekly patterns, including the highest point showing the morning rush hour peak, the following peak
showing the returning home rush hour, and substantially small amount of contacts (around 0.2) on weekends
and holidays, including the New Year breaks. Panels B and C in Fig. 3 show the total daily contact index and the
daily peak contact index values, respectively. By comparing the average social contacts across the time horizon,
we can observe in Fig. 3 A that the average amount of social contact for each user starts to decrease as COVID-
19 became a threat globally in mid February down to 90% of the typical value. The value decreases more rapidly
towards the end of February with the government request for remote working, down to 65% of the typical values.
The contact index stays at 65% of typical values until the end of March, and as the number of cases in Tokyo
starts to increase (Fig. 1), the contact index further starts to decrease and reaches 30% of typical values by April
15th, almost reaching the government’s goal of reducing social contacts by 80% of the typical values28. However,
regarding the daily peak contacts (morning rush hour peaks on weekdays and lunchtime peaks on weekends and
Scientific Reports | (2020) 10:18053 | https://doi.org/10.1038/s41598-020-75033-5 3
Vol.:(0123456789)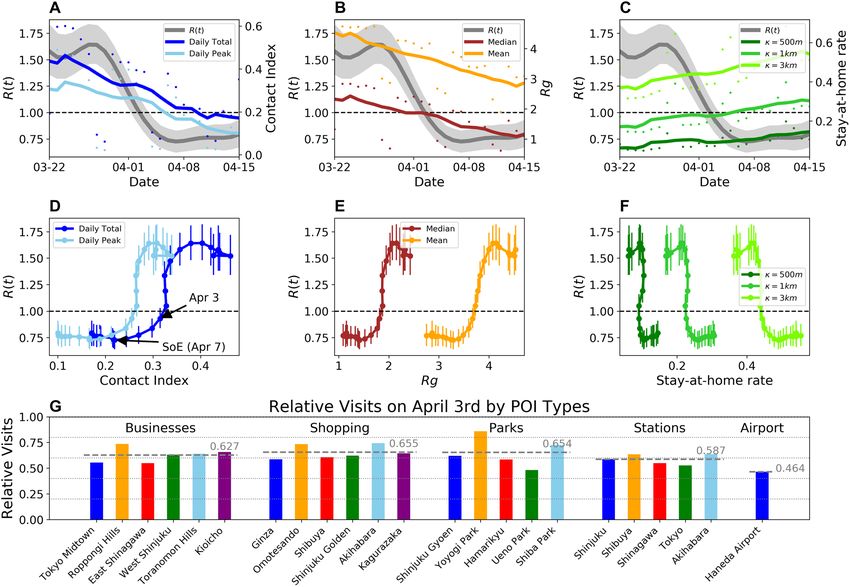
www.nature.com/scientificreports/
Figure 3. Social contact analysis. (A) shows the amount of contacts an individual potentially encounters
outside home for each time period. (B,C) show the individuals’ mean total daily contacts and the mean daily
peak contacts, respectively. (D) Daily total contacts in the 23 central districts (wards) in Tokyo Metropolitan
Area. (E) Correlation between non-normalized social contacts before and after the COVID-19 spread. (F)
Correlation between average taxable income per household and daily contact index on April 15th.
holidays), Panel C shows that peak time social contacts have decreased successfully to around 20% of the typical
values by April 15th.
Moreover, the inequality in mobility changes across different spatial regions within Metropolitan Tokyo were
tested, since it has been suggested that inequality in society could aggravate the spread of COVID-1929. Panel
D of Fig. 3 shows the transition of daily total contacts for users with home locations in the 23 wards in central
Tokyo. Although the social contact index of the regions follow similar general patterns, some heterogeneity
in the contact decrease can be observed. Panel E shows strong correlation (Pearson’s correlation coefficient
R = 0.875∗∗∗) between the non-normalized amount of contacts on January 15th (before the pandemic) and
April 15th, which is after the pandemic. Most of the 23 regions were successful in reducing the social contact
index by 80% (shown by gray dashed line), except for wards including Nerima Ward. Panel F further shows the
log–log plot between the relative contact index on April 15th and average taxable income per household for each
ward in Tokyo. The average taxable income per household was calculated using data provided by the Official
Statistics of Japan through the Portal Site30. We observe strong negative correlation ( R = −0.696∗∗∗) between
taxable income per household and contact index, indicating that households in higher income regions were able
to reduce the amount of social contacts and risk of COVID-19 transmission more than households in lower
income regions. This highlights an inequality across households in terms of the voluntary mobility restrictions.
Higher income households are more likely able to reduce their social contacts by reducing mobility, however
lower income households may not have this flexibility. This inequality has substantial implications in terms of
disease spread and will require a holistic policy planning.
Correlation of mobility indexes with effective reproduction number R(t). To understand the
implications of mobility behavior change and decrease in social contacts on the transmissibility of COVID-19 in
Tokyo, we compare the quantified mobility behavior changes with the estimated effective reproduction number
R(t) of Tokyo. The R(t) values were estimated using the weekly averaged number of confirmed COVID-19 cases
in Tokyo, reported by the metropolitan government (see “Materials and methods”). Figure 4 shows the weekly
moving averaged values of (A) social contact index, (B) radius of gyration, and (C) stay-at-home rates plotted
along with the dynamic R(t) values. The gray shaded areas show the 95% confidence interval for the estimated
R(t). Panels D–F in Fig. 4 show the temporal evolution of the mobility metrics and R(t), where each dot cor-
responds to daily values. The vertical error bars show the 95% confidence interval of the estimated R(t) values.
A non-linear relationship between the mobility metrics and transmissibility are observed, where the R(t) values
substantially decrease around a threshold value of 0.33 in the contact index. We observe that R(t) < 1 is achieved
Scientific Reports | (2020) 10:18053 | https://doi.org/10.1038/s41598-020-75033-5 4
Vol:.(1234567890)www.nature.com/scientificreports/
Figure 4. Correlation between mobility behavior changes and effective reproduction number R(t). (A–C)
shows the human mobility metrics along with the R(t) values in Japan estimated by the health ministry panel
on coronavirus infection cluster under the Japanese Government. (D–F) shows the relationships between
the mobility metrics and R(t). All panels show that R(t) falls under 1.0 with reduction in mobility and social
contacts, and that such reduction may have been excessive in containing the spread of COVID-19. (G) Relative
amount of visits to various point of interests on April 3rd, when sufficient reduction in transmissibility was
achieved in Tokyo.
with reduction in social contacts down to 0.33 on April 3rd. Further reduction in mobility and social contacts are
observed after the declaration of the SoE on April 7th, but R(t) had reached a bottom before the declaration. This
suggests that restrictions on mobility certainly allow the reduction of number of transmissions up to a point, but
further severe restrictions could have less effects on transmissibility reduction. A more targeted and nuanced
approach may be needed to determine where and when mobility restrictions should be imposed.
To provide some examples of such nuanced and directly observable metrics of mobility reductions, Panel G
shows the relative amount of visits to various types of points of interest (POIs) on April 3rd, which was when
sufficient decrease in mobility was observed. We can observe that for all listed types of POIs (Table S2) includ-
ing business districts (e.g. Tokyo Midtown, Roppongi Hills), shopping areas (e.g. Ginza, Omotesando), and
major stations (e.g. Shinjuku, Shibuya), visits were reduced by around 35–40% on average compared to January
weekdays (before the pandemic). Haneda Airport (major airport in Tokyo area) on the other hand, had larger
decrease in visits (55%) due to travel restrictions which were imposed in early February and March (Figure S7) .
Discussion
Large-scale mobility data collected from mobile phones provide us with an opportunity to monitor and under-
stand the impacts of NPIs during the COVID-19 pandemic with an unprecedented spatio-temporal granularity
and scale. In this study, we utilized such data to quantify the changes in human mobility behavior and social
contacts during the COVID-19 spread in Tokyo, Japan, which provides a unique case study where government
policies were limited to non-compulsory measures. The analysis concludes that by April 15th (1 week from
declaring state of emergency), human mobility behavior have decreased by around 50% both in terms of radius of
gyration and total travel distance per user, and also that social contact index in Tokyo had been reduced by more
than 70% both in terms of daily total contacts and daily peak time contacts following non-compulsory measures
including remote working requests to businesses and closures of public schools. The analysis results also showed
that mobility reduction had already taken place before late March (around 40% decrease of social contacts), when
the number of imported cases of COVID-19 started to increase. This indicates that even before the actual spread
Scientific Reports | (2020) 10:18053 | https://doi.org/10.1038/s41598-020-75033-5 5
Vol.:(0123456789)www.nature.com/scientificreports/
of COVID-19 in Tokyo, and even under only non-compulsory measures, a substantial amount of cooperation
was provided by the citizens to contain the spread of COVID-19. By comparing the mobility analysis results with
the effective reproduction number R(t) estimated from the daily confirmed number of cases in Tokyo, we were
further able to show correlation between the mobility reduction and decrease in transmissibility of COVID-19.
During late March, R(t) rose above 1 and the number of cases increased, however, mobility reduced following
the nation-wide state of emergency, and the R(t) dropped below 1 by the beginning of April. In fact, it was found
that reduction of mobility and social contacts beyond certain thresholds (e.g. social contact index of 0.33) had
little incremental effects on the decrease in R(t). Looking forward into lifting the state of emergency declaration,
these results could inform decision making on how much human mobility and social contact reduction is needed
to keep the effective reproduction number of COVID-19 below 1. Figure 4G provides more directly observable
measures of mobility reduction at various points of interest which can be used to interpret the sufficient amount
of social contact reduction to contain COVID-19.
The presented empirical results should be considered in the light of some limitations. First, the presented
analysis was limited to understanding the correlations between mobility and contact reduction and transmis-
sibility. However, microscopic human behavior, such as sanitizing hands more often or higher rates of wearing
face masks, could have affected the reduction in transmissibility. Because of such factors other than human
mobility, the relationships between mobility reductions and transmissibility could change after lifting the state
of emergency. Due to the lack of data on R(t) under no interventions, it is not certain whether the R(t) values
reach a similar value of that in European countries and the US. Additional household surveys and interviews
need to be conducted to quantify the effects of such behavioral changes. Second, GPS location data collected
from mobile phones are prone to spatial errors up to 100 m. This spatial error could have biased the results of
the mobility metrics. However, sensitivity analysis suggests that the conclusions are not affected by the spatial
thresholds selected in this study (Figures S3, S4). In addition to the 2% sample rate, the granularity of the data was
not adequate to compute the actual contacts between individuals (i.e. 2 m distance for all individuals). Moreover,
it is known that mobile phone data contain biases in age and income g roups31,32. It is important to analyze the
mobility of the more vulnerable and elderly population due to the high mortality rate of COVID-19. Although
similar conclusions were reached when different spatial thresholds were used via sensitivity analysis, additional
validation using small scale but precise data could further clarify the approximate social contact measure com-
puted in this study using mobile phone data. Third, in Tokyo, data on the daily number of new onset cases were
not available. Thus, we estimated the onset timings from the daily number of confirmed cases, by shifting the
data back 7 days, following reports from Huang et al.33. Starnini et al.34 has shown that the estimation accuracy
of R(t) could suffer by using the daily number of confirmed cases. However, this effect is more substantial in the
early dynamics of the epidemic, and less towards later periods where our analysis is focused on.
Future research steps include extending the analysis to other cities in Japan such as Sapporo and Osaka, where
different patterns of COVID-19 spread have been observed (Figure S1). Cross-comparative analysis including
multiple regions could yield novel and more generalizable insights on the relationships between mobility pat-
tern changes and COVID-19 transmissibility. In addition to the spatial dimension, extending the time period
of analysis after April 15th and analyzing the dynamics after the lifting of the interventions could strengthen
our understanding between social contact decrease and transmissibility reduction. Although this study used
aggregated measures to quantify the behavioral changes (e.g. average social contacts), more microscopic analysis
of mobility changes could be conducted with additional data.
Materials and methods
Mobile phone location data. Location data of smartphones were collected by Yahoo Japan Corporation
through the disaster alert app in order to send relevant notifications and information to the users. The users in
this study have accepted to provide their location information. The data are anonymized so that individuals can-
not be specified, and personal information such as gender, age and occupation are unknown. Each GPS record
consists of a user’s unique ID (random character string), timestamp, longitude, and latitude. The data acquisition
frequency of GPS locations changes according to the movement speed of the user to minimize the burden on
the user’s smartphone battery. If it is determined that the user is staying in a certain place for a long time, data is
acquired at a relatively low frequency, and if it is determined that the user is moving, the data is acquired more
frequently. The data has a sample rate of approximately 2% of the population, and past studies suggest that this
sample rate is enough to understand the macroscopic urban dynamics, even during an e mergency35. We selected
a panel of users who were active each day in Tokyo metropolitan area before, during and after the COVID-19
pandemic. This leads to a sample of about 200k users, with approximately 50 data points per user each day
(Figure S2). Home locations of each individual was detected by applying mean-shift clustering to the nighttime
staypoints (observed between 8 p.m. and 6 a.m.), weighted by the duration of stays in each location36.
Socio‑economic data. Socio-economic data of 23 wards in Tokyo Metropolis were obtained from the Por-
tal Site of Official Statistics of Japan30. The number of households and total taxable income collected from the
residents were available through the Portal Site. The taxable income per household values used in the analysis in
Fig. 3F were calculated by dividing the total taxable income by the number of households in each region (ward)
(Figure S5, Table S1).
Effective reproduction number R(t). The effective reproduction number R(t) is commonly used to
quantify transmissibility of an infectious disease, which is defined as the average number of secondary cases
generated by a single infectious case37. Effects of NPIs such as social distancing can be measured by the effective
reproduction number. In order to estimate R(t) of COVID-19 in Tokyo, we employed time series data of daily
Scientific Reports | (2020) 10:18053 | https://doi.org/10.1038/s41598-020-75033-5 6
Vol:.(1234567890)www.nature.com/scientificreports/
confirmed COVID-19 cases in Tokyo reported by Tokyo metropolitan government25. Since the data of the onset
cases are unavailable, we used the confirmed date for the estimation. The original daily data were smoothed by
taking the centered 7-day moving average. Estimation of R(t) is conducted based on the code implemented by
Jung et al., which is available on the Github repository38. The code estimates R(t) using the following steps. Since
our data on the number of infected cases is based on the laboratory confirmation, there is a time lag associated
with the date of infection. The date of the onset of symptoms is estimated by shifting the confirmed daily number
of new cases backwards in time for 7 days to account for the diagnosis delay, based on the report by Huang et al.33
that the median number of days from onset to first hospital admission was 7.0 days. Furthermore, to estimate the
daily number of infections, the daily number of onset cases was back-projected using a lognormal density func-
tion with mean of 5.6 days and standard deviation of 2.8 days39. R(t) was estimated via the renewal e quation40,
which uses the time series of the number of new infected cases in Tokyo on day t, C(t). The expected number of
infected cases E[C(t)] are modeled as:
t−1
F(T − t)
E[C(t)] = R(t) C(t − τ )g(τ ) , (1)
F(T − t + τ )
τ =1
where E[x] denotes the expectation of random variable x, and T is the latest day of observation. The Weibull
distribution with shape factor 2.305 and the scale factor 5.452 was assumed to be the probability density function
of the generation interval g(τ )41. Moreover, the cumulative Weibull distribution F(t) with shape factor 1.741 and
scale factor 8.573, based on the maximum likelihood estimation using data on the reporting date and the date of
illness onset collected by the Ministry of Health, Labor and Welfare of Japan38, was introduced to account for the
right-truncated reporting delay from illness onset to laboratory confirmation. It was assumed that C(t) follows a
Poisson distribution, and R(t) was estimated by maximizing the following likelihood function:
T
exp{−E[C(t)]}E[C(t)]C(t)
L(R(t); C(t)) = . (2)
C(t)!
t=1
The 95% confidence interval of each estimate was also derived using the likelihood function.
Individual mobility indexes. Several indexes have been used in previous studies to characterize indi-
vidual human mobility patterns27,32. In this study, we use three key indexes: Radius of Gyration ( Rg ), total travel
distance (TTD), and stay-at-home rates parameterized by a spatial threshold κ (SAHκ ). Given a sequence of GPS
observation points Pi = {pi1 , pi2 , . . . , piN } in a single day of an individual user i, the radius of gyration is calculated
using the following equation.
1
N
Rg =
(pin − p̄i )2 , (3)
N
n=1
where p̄i denotes the center of mass of the GPS observation points of user i. The total travel distance of an indi-
vidual user is the sum of Euclidean distances between all subsequent pairs of GPS observation points on a given
day. The stay-at-home rate, parameterized by a spatial threshold κ , is the rate of individual users who had stayed
the entire day within a distance κ from the estimated home location.
Quantifying social contact index from trajectory data. To overcome data sparsity, spatio-temporal
interpolation of the GPS location observations were performed. Because the GPS data are collected less fre-
quently when movement is detected, we assume that the individual users are static while there are no obser-
vations. Using the interpolated individual trajectory data produced from mobile phones, the social contact
indexes were computed. The social contact indexes shown in Fig. 3 were computed for 30 min intervals. First,
for each time interval [t, t + dt), where dt = 30 min, users who were not within 100 m from their estimated
home locations were detected as “staying out”. We denote this set of individual users as N out t . For user i staying
t ), we compute the number of other “staying out” users who are within 100 m from user i, and use
out (i ∈ N out
that count ci,t as a proxy for social contacts. The social contact index is calculated as the total social contacts for
all users staying out, divided by the total number of users including those staying at their homes. Thus, mean
social contact value is computed as Ct = i∈N out t
ci,t /N, where N is the total number of users observed on that
day. The social contact index is the relative value of mean social contacts with respect to typical mobility pat-
terns, observed before the COVID-19 pandemic. The typical mean social contact value is computed by taking
the average of daily peak social contact values observed on weekdays in January 2020. Thus, the social contact
index (SCI) of 1 corresponds to the same amount of social contacts as the daily peak times on weekdays before
the COVID-19 pandemic.
Received: 9 July 2020; Accepted: 6 October 2020
Scientific Reports | (2020) 10:18053 | https://doi.org/10.1038/s41598-020-75033-5 7
Vol.:(0123456789)www.nature.com/scientificreports/
References
1. Anderson, R. M., Heesterbeek, H., Klinkenberg, D. & Hollingsworth, T. D. How will country-based mitigation measures influence
the course of the COVID-19 epidemic? Lancet 395, 931–934 (2020).
2. Flaxman, S. et al. Estimating the number of infections and the impact of non-pharmaceutical interventions on COVID-19 in
European countries: Technical description update. arXiv preprint arXiv:2004.11342 (2020).
3. Oliver, N. et al. Mobile phone data for informing public health actions across the COVID-19 pandemic life cycle. Sci. Adv. 6(23),
eabc0764 (2020).
4. Bengtsson, L. et al. Using mobile phone data to predict the spatial spread of cholera. Sci. Rep. 5, 8923 (2015).
5. Finger, F. et al. Mobile phone data highlights the role of mass gatherings in the spreading of cholera outbreaks. Proc. Natl. Acad.
Sci. 113, 6421–6426 (2016).
6. Tizzoni, M. et al. On the use of human mobility proxies for modeling epidemics. PLoS Computat. Biol. 10(7), e1003716 (2014).
7. Wesolowski, A. et al. Quantifying the impact of human mobility on malaria. Science 338, 267–270 (2012).
8. Klein, B. et al. Assessing changes in commuting and individual mobility in major metropolitan areas in the united states during
the COVID-19 outbreak. Northeastern University, Network Science Institute. https://www.networkscienceinstitute.org/publicatio
ns/assess ing-change s-in-commut ing-and-indivi dual- mobili ty-in-major- metrop olita n-areas- in-the-united -states -during -the-covid
-19-outbreak. (Accessed 26 June 2020).
9. Kraemer, M. U. et al. The effect of human mobility and control measures on the COVID-19 epidemic in China. Science 368, 493–497
(2020).
10. Lai, S. et al. Effect of non-pharmaceutical interventions for containing the COVID-19 outbreak in China. medRxiv. https://doi.
org/10.1101/2020.03.03.20029843 (2020).
11. Pepe, E. et al. Covid-19 outbreak response: A first assessment of mobility changes in Italy following national lockdown. medRxiv.
https://doi.org/10.1101/2020.03.22.20039933 (2020).
12. Bonato, P. et al. Mobile phone data analytics against the COVID-19 epidemics in italy: Flow diversity and local job markets during
the national lockdown. arXiv preprint arXiv:2004.11278 (2020).
13. Wellenius, G. A. et al. Impacts of state-level policies on social distancing in the United States using aggregated mobility data during
the COVID-19 pandemic. arXiv preprint arXiv:2004.10172 (2020).
14. Gao, S., Rao, J., Kang, Y., Liang, Y. & Kruse, J. Mapping county-level mobility pattern changes in the united states in response to
COVID-19. Available SSRN 3570145, (2020).
15. Dahlberg, M. et al. Effects of the COVID-19 pandemic on population mobility under mild policies: Causal evidence from Sweden.
arXiv preprint arXiv :2004.09087 (2020).
16. Santana, C. et al. Analysis of human mobility in the UK during the COVID-19 pandemic. https://covid19-uk-mobility.github.io/.
(Accessed 26 June 2020) (2020) (published April 8, 2020).
17. Cintia, P. et al. The relationship between human mobility and viral transmissibility during the COVID-19 epidemics in Italy. arXiv
preprint arXiv :2006.03141 (2020).
18. Schlosser, F., Maier, B. F., Hinrichs, D., Zachariae, A. & Brockmann, D. COVID-19 lockdown induces structural changes in mobility
networks—Implication for mitigating disease dynamics. arXiv preprint arXiv:2007.01583 (2020).
19. Mizuno, T. & Ohnishi, T. Controling the spread of COVID-19 using human mobility big data. https://www.canon-igs.org/colum
n/macroeconomics/20200414_6352.html. (Accessed 15 May 2020) (2020) (published April 14, 2020, in Japanese).
20. Agoop Corporation. Analysis of changes in human mobility due to spread of novel coronavirus. https://corporate-web.agoop.net/
pdf/covid-19/agoop_analysis_coronavirus.pdf. (Accessed 26 June 2020) (2020).
21. NTT Docomo, Inc. Mobile spatial statistics population map. https://mobakumap.jp/. (Accessed 26 June 2020) (2020).
22. Dong, E., Du, H. & Gardner, L. An interactive web-based dashboard to track COVID-19 in real time. Lancet Infect. Diseases (2020).
23. Idogawa, M., Tange, S., Nakase, H. & Tokino, T. Interactive web-based graphs of novel coronavirus COVID-19 cases and deaths
per population by country. Clin. Infect. Diseases. https://doi.org/10.1093/cid/ciaa500 (2020).
24. Kashiyama, T., Pang, Y. & Sekimoto, Y. Open pflow: Creation and evaluation of an open dataset for typical people mass movement
in urban areas. Transp. Res. Part C Emerg. Technol. 85, 249–267 (2017).
25. Tokyo Metropolitan Government. COVID-19 information website. https: //github .com/tokyo- metrop olita n-gov/covid1 9. (Accessed
26 June 2020) (2020).
26. Ministry of Health, Labour and Welfare, Japan. About coronavirus disease 2019 (COVID-19). https://www.mhlw.go.jp/stf/seisa
kunitsuite/bunya/newpage_00032.html. (Accessed 26 June 2020) (2020).
27. Gonzalez, M. C., Hidalgo, C. A. & Barabasi, A.-L. Understanding individual human mobility patterns. Nature 453, 779–782 (2008).
28. The Japan Times. Japan’s coronavirus total surpasses 10,000 as Tokyo adds 181 cases. https: //www.japant imes. co.jp/
news/2020/04/18/nation gzY1s . (Accessed 15 May 2020) (2020) (published April 18, 2020).
al/covid- 19-infect ions- 10000/ #.Xr37bG
29. Ahmed, F., Ahmed, N., Pissarides, C. & Stiglitz, J. Why inequality could spread COVID-19. Lancet Public Health 5, e240 (2020).
30. Statistics Bureau of Japan. Portal site of official statistics of Japan. https://www.e-stat.go.jp/en/regional-statistics/ssdsview/munic
ipality. (Accessed 26 June 2020) (2020).
31. Frias-Martinez, V. & Virseda, J. On the relationship between socio-economic factors and cell phone usage. Proceedings of the Fifth
International Conference on Information and Communication Technologies and Development 76–84 (2012).
32. Blondel, V. D., Decuyper, A. & Krings, G. A survey of results on mobile phone datasets analysis. EPJ Data Sci. 4, 10 (2015).
33. Huang, C. et al. Clinical features of patients infected with 2019 novel coronavirus in Wuhan, China. Lancet 395, 497–506 (2020).
34. Starnini, M., Aleta, A., Tizzoni, M. & Moreno, Y. Impact of the accuracy of case-based surveillance data on the estimation of time-
varying reproduction numbers. medRxiv. https://doi.org/10.1101/2020.06.26.20140871 (2020).
35. Yabe, T., Tsubouchi, K., Fujiwara, N., Sekimoto, Y. & Ukkusuri, S. V. Understanding post-disaster population recovery patterns. J.
Royal Soc. Interface 17, 20190532 (2020).
36. Ashbrook, D. & Starner, T. Using GPS to learn significant locations and predict movement across multiple users. Personal Ubiquitous
Comput. 7, 275–286 (2003).
37. Held, L., Hens, N., O’Neill, P. D. & Wallinga, J. Handbook of Infectious Disease Data Analysis. (Chapman and Hall/CRC, Boca
Raton, 2019).
38. Jung, S.-M. J., Akhmetzhanov, A. R., Mizumoto, K. & Nishiura, H. Real-time estimation of the effective reproduction number of
COVID-19 in Japan. https://github.com/contactmodel/COVID19-Japan-Reff. (Accessed 15 May 2020) (2020).
39. Linton, N. M. et al. Incubation period and other epidemiological characteristics of 2019 novel coronavirus infections with right
truncation: A statistical analysis of publicly available case data. J. Clin. Med. 9, 538 (2020).
40. Diekmann, O., Heesterbeek, H. & Britton, T. Mathematical Tools for Understanding Infectious Disease Dynamics Vol. 7 (Princeton
University Press, Princeton, 2012).
41. Nishiura, H., Linton, N. M. & Akhmetzhanov, A. R. Serial interval of novel coronavirus (covid-19) infections. Int. J. Infect. Diseases
93, 284–286 (2020).
Acknowledgements
T.Y. and S.V.U. were partly funded by NSF Grant No. 1638311 CRISP Type 2/Collaborative Research: Critical
Transitions in the Resilience and Recovery of Interdependent Social and Physical Networks. N.F. was supported
Scientific Reports | (2020) 10:18053 | https://doi.org/10.1038/s41598-020-75033-5 8
Vol:.(1234567890)www.nature.com/scientificreports/
by JSPS KAKENHI Grant Number JP18K11462. T.W. was supported by the Osaka City University Strategic
Research Grant 2020 for basic researches Kakenhi 20H03932.
Author contributions
All authors designed research; T.Y., K.T., N.F., and S.V.U. performed analysis; T.Y., K.T., and N.F. analyzed data;
All authors wrote the paper.
Competing interests
The authors declare no competing interests.
Additional information
Supplementary information is available for this paper at https://doi.org/10.1038/s41598-020-75033-5.
Correspondence and requests for materials should be addressed to S.V.U.
Reprints and permissions information is available at www.nature.com/reprints.
Publisher’s note Springer Nature remains neutral with regard to jurisdictional claims in published maps and
institutional affiliations.
Open Access This article is licensed under a Creative Commons Attribution 4.0 International
License, which permits use, sharing, adaptation, distribution and reproduction in any medium or
format, as long as you give appropriate credit to the original author(s) and the source, provide a link to the
Creative Commons licence, and indicate if changes were made. The images or other third party material in this
article are included in the article’s Creative Commons licence, unless indicated otherwise in a credit line to the
material. If material is not included in the article’s Creative Commons licence and your intended use is not
permitted by statutory regulation or exceeds the permitted use, you will need to obtain permission directly from
the copyright holder. To view a copy of this licence, visit http://creativecommons.org/licenses/by/4.0/.
© The Author(s) 2020
Scientific Reports | (2020) 10:18053 | https://doi.org/10.1038/s41598-020-75033-5 9
Vol.:(0123456789)You can also read