COVID-19's Employment Disruptions to Asian Americans - donald mar and paul ong july 20, 2020
←
→
Page content transcription
If your browser does not render page correctly, please read the page content below
COVID-19’s
Employment
Disruptions to
Asian Americans
donald mar and paul ong
july 20, 2020
Ong & Associates • UCLA Center for Neighbhorhood Knowledge • UCLA Asian American Studies Center

2Image Credit: Sid Wichienkuer
I INTRODUCTION							4

       II OVERVIEW OF JOB LOSSES AND				           8
             UNEMPLOYMENT DUE TO COVID-19

       III ASIAN AMERICAN ECONOMIC DISPARITIES		   13
              IN THE COVID-19 DOWNTURN

       IV SUMMARY 								23

       V POLICY RECOMMENDATIONS				                24

       VI APPENDIX: DATA SOURCES					              26

       VII ENDNOTES								29

COVID-19’s
Employment
Disruptions to
Asian Americans
TABLE OF CONTENTS
I. introduction

                                                                                                  The COVID-19 crisis has upended everybody’s daily life—transforming the
                                                                                                  ways we socialize, consume, work, and engage in politics. The United States is
                                                                                                  experiencing a once-in-a-century disruption to its people and economy caused
                                                                                                  by the spread of COVID-19, creating upheavals not witnessed since the 1918
Ong & Associates • UCLA Center for Neighbhorhood Knowledge • UCLA Asian American Studies Center

                                                                                                  flu (H1N1 virus) pandemic. As of June 8, 2020, the nation reported 1,938,823
                                                                                                  confirmed cases and 110,375 deaths.1 Along with the direct health costs of
                                                                                                  illness and deaths, the indirect impacts on the economy are tremendous.
                                                                                                  To “flatten the curve” and prevent the number of new cases from overwhelming
                                                                                                  the healthcare system, public officials have taken dramatic action to limit
                                                                                                  person-to-person interactions by restricting group gatherings, encouraging
                                                                                                  social distancing and ordering people to shelter-in-place.2 These disruptions
                                                                                                  are creating enormous financial hardships to workers, families, businesses
                                                                                                  and communities. The magnitude of the economic impacts is evident in the
                                                                                                  dramatic increase in unemployment. Between mid-February and mid-April, the
                                                                                                  nation lost about 25 million jobs.3 The unemployment rate rose to 14.7% in
                                                                                                  April 2020 with 23.1 million unemployed workers.

                                                                                                  Along with the rest of America, Asian Americans are highly impacted by
                                                                                                  this economic recession. However, the virus’s Asian origin may affect Asian
                                                                                                  Americans to a greater degree as racial and xenophobic tensions mount.
                                                                                                  President Trump has often times been assailed and supported for his reference
                                                                                                  to COVID-19 as the “Chinese virus” or the “kung flu.”4 A recent Pew survey
                                                                                                  reports that “Black and Asian Americans are also more likely than their white
                                                                                                  and Hispanic counterparts to say they have been subject to slurs or jokes
                                                                                                  because of their race or ethnicity, but Asian adults are the most likely to say
                                                                                                  this has happened to them since the beginning of the coronavirus outbreak.
                                                                                                  About 3 in 10 Asian adults (31%) say they have been subject to slurs or jokes
                                                                                                  because of their race or ethnicity since the outbreak began, compared with
                                                                                                  21% of Black adults, 15% of Hispanic adults and 8% of white adults.”5 The New

                                          4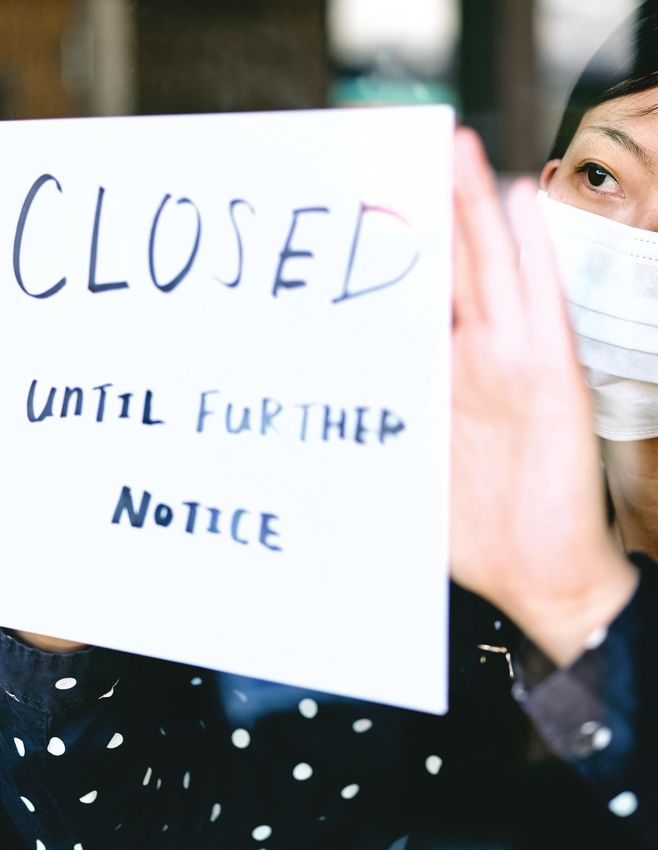
Center for Public Integrity/Ipsos Poll finds similar patterns, including that 3 in 5
Asian Americans have witnessed someone blaming Asians for the epidemic.6
The Asian Pacific Policy and Planning Council, Chinese for Affirmative Action
and San Francisco State University recorded over 800 COVID-19 related hate
incidents against Asian Americans in California from March to June 2020.7
Recorded incidents include harassment, assault, and potential civil rights
violations including discrimination in the workplace.
Ong & Associates • UCLA Center for Neighbhorhood Knowledge • UCLA Asian American Studies Center
The increase in discrimination against Asian Americans has manifested
financially and commercially as customers, employers, and co-workers base
their economic behavior on discrimination. Anecdotal evidence demonstrate
that Asian American businesses, particularly those in ethnic enclaves, have
experienced the labor-market impact of COVID-19 earlier and more deeply
because of the racialized blaming. Even before the shelter-in-place orders,
customers were showing reluctance to patronize Asian American businesses.
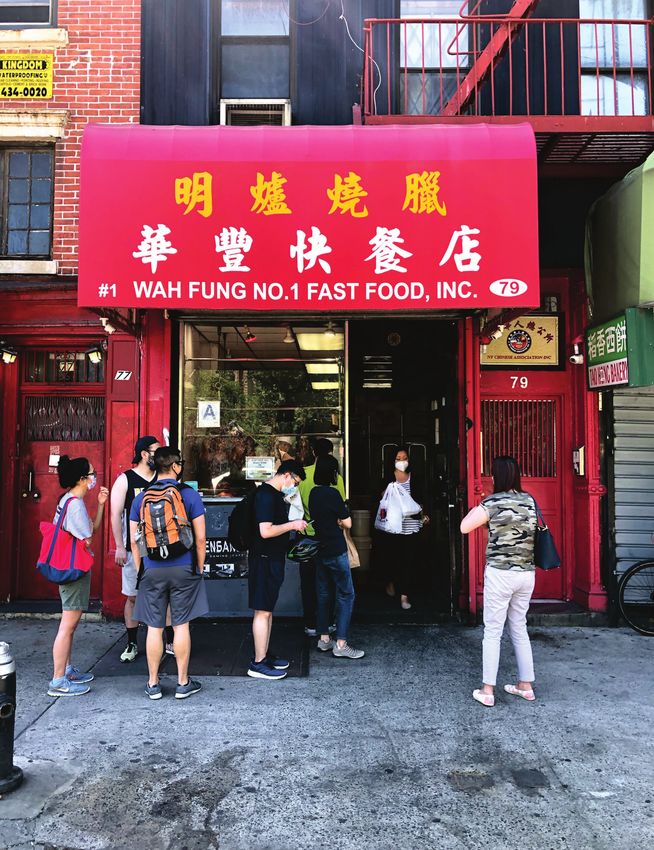
One of the most reported impacts is the dramatic decline for New York City’s
Chinatown. Starting in late January (around the Lunar New Year, traditionally
an extremely busy period for commerce), sales declined by more than three-
quarters.8 The devastating economic impact goes beyond New York City. San
Francisco also experienced this, prompting local elected officials and even
U.S. House Speaker Nancy Pelosi to label the reaction and fear as unwarranted
in late February 2020.9 In Los Angeles, the impact was not just limited to
Chinatown, but also affected other Asian enclaves, such as Koreatown.10 What
is not known, however, is how much these sector and geographic specific
impacts have affected the overall labor-market status and performance of Asian
Americans as a whole. Quantitatively, how significantly have Asian American
employment and joblessness changed during the pandemic? Who has been
the most affected? What are the drivers behind these changes?
5
To fill the empirical void and better understand the nature, pattern and
                                                                                                  magnitude of the COVID-19 disruption to Asian Americans in the labor market,
                                                                                                  we focus on the impacts during March and May 2020 using the most readily
                                                                                                  available data. The brief is divided into four parts: 1) overview of job losses and
                                                                                                  unemployment due to COVID-19 for the U.S.; 2) analysis of Asian American
                                                                                                  disparities; 3) summary and conclusions; and 4) description of data sources.

                                                                                                  Unfortunately, there is no single data source that can provide precise details
Ong & Associates • UCLA Center for Neighbhorhood Knowledge • UCLA Asian American Studies Center

                                                                                                  on the nature, pattern and magnitude of the COVID-19 disruptions Asian
                                                                                                  Americans in the labor market. Our approach is to triangulate with multiple
                                                                                                  data sources. This brief uses five data sources: the Current Population Survey
                                                                                                  (CPS), Current Employment Statistics (CES) survey, Unemployment Insurance (UI)
                                                                                                  claims (derived from U.S. Department of Labor and Employment and Training
                                                                                                  Administration [DOLETA] and supplemented by UI data from the California
                                                                                                  Policy Lab) and the 2018 American Community Survey (ACS) Public Use Micro
                                                                                                  Sample (PUMS). Each data source is briefly described in the appendix.

                                          6
Some key findings include:
• The unemployment rate has so far peaked at almost 15% across the U.S..
Although the official unemployment rates for Asians and whites are nearly
the same for April 2020 – 14.5% and 14.2% respectively, our estimated
joblessness rate for Asians is 21% versus 19% for whites in April.
• Although the official May 2020 unemployment rates saw a dip
in unemployment for the nation as a whole, the Asian American
unemployment rate increased to 15% and estimated joblessness rate
remained at 21%.
• Asian Americans comprise a larger number of workers making initial
Ong & Associates • UCLA Center for Neighbhorhood Knowledge • UCLA Asian American Studies Center
Unemployment Insurance claims. In California, Asian American’s are 16%
of the labor force in February 2020 but filed 19% of initial UI claims over
the two and a half months of the shutdown. In New York state, Asian
Americans are 9% of the state labor force, but filed 14% initial UI claims by
mid-April.
• Many Asian Americans are employed in industries hard hit by COVID-19.
Almost 1 in 4 employed Asian Americans are employed in the Hospitality
and Leisure, Retail, and Other Services Industries. The unemployment rate
for Asian Americans in two of the industries, Hospitality and Leisure and
Other services was 40%.
• COVID-19 impacted Asian Americans differently across states. Preliminary
estimates show Asian unemployment in Hawaii to be near 25%.
• Our estimate for small business closures due to COVID-19 is 233,000,
measured by estimating the decline in Asians self-employment from
879,000 in February 2020 to 587,000 in April 2020. The drop amounts to
a 28% of a decline in the two-month period. By comparison, non-Hispanic
white small businesses declined by 1.79 million businesses and 17% over
the same period.
7II. overview
of job losses
and unemployment
due to covid-19
The timing of the spread of COVID-19 can be seen in Figure 1.11 The number
of confirmed deaths passed the one-hundred mark by mid-March. To
“flatten the curve” and prevent the number of new cases from overwhelming
the healthcare system, health experts have strongly advocated for limiting
person-to-person interactions by restricting group gatherings, encouraging
Ong & Associates • UCLA Center for Neighbhorhood Knowledge • UCLA Asian American Studies Center
social distancing and ordering people to shelter-in-place.12 Elected and
public officials have taken dramatic action to implement the advice, some
faster than others. On March 4, 2020, California Governor Gavin Newsom
declared a state of emergency because of the COVID-19 threat. On March
19, 2020, he issued “Executive Order N33-20,” ordering “all individuals
living in the State of California to stay home or at their place of residence
except as needed to maintain continuity of operations of the federal critical
infrastructure sectors.” The state of New York issued a similar decree the
following day. Similar mandates have been enacted by states, cities and
counties by April 2020.
Figure 1. U.S. COVID-19 Total Cases and Deaths: February 1 – June 6, 2020
2,000,000 100,000
1,800,000 90,000
1,600,000 80,000
1,400,000 70,000
1,200,000 60,000
1,000,000 50,000
800,000 40,000
600,000 30,000
400,000 20,000
200,000 10,000
0 0
2/1/2020 3/1/2020 4/1/2020 5/1/2020 6/1/2020
Total Cases COVID-19 Deaths
Source: CDC, Coronavirus 2019, Cases, Data and Surveillance
https://www.cdc.gov/coronavirus/2019-ncov/cases-updates/previouscases.html
8Many businesses were required to stop operating or found it unprofitable
to stay open. Shelter-in-place orders divided the labor market into three
segments: (1) essential workers, (2) non-essential workers able to work
remotely, (3) and non-essential workers unable to work remotely. Essential
workers include those who are “needed to maintain continuity of operations
of essential critical infrastructure sectors and additional sectors as the State
Public Health Officer may designate as critical to protect health and well-
being of all Californians.”13 Most of the employees in this segment have
Ong & Associates • UCLA Center for Neighbhorhood Knowledge • UCLA Asian American Studies Center
continued to work, although often having to take health risks by continuing
to interact with customers, patients and the public. Among non-essential
workers, many were able to work remotely from home. This is particularly
true for white-collar employees and professionals. The group hit the hardest
economically were non-essential workers who could not work remotely or
worked for a firm that shut down.
The loss of jobs and resulting unemployment are evident in the
available data. Jobs data are based on the Bureau of Labor Statistics
CES establishment data. Between February 2020 and April 2020, total
employment fell by 21.7 million workers, which is lower than the CPS
estimate of 25.3 million decline in the number of people working based
on surveys of individuals in the labor market. Some of the difference is
likely due to the inclusion of the self-employment and the informal sector
employment in the CPS. The unemployment counts are based on the CPS,
with unemployment increasing by about 17.3 million between February
and April. The difference between job losses and change in the number of
unemployed could be due in part to the increase of dislocated workers not
actively seeking a job because of the lack of openings during the public-
health crisis or those who dropped out of the labor market because of
health-related issues. From February to April, the official unemployment rate
rose from 3.5% to 14.7%.
To account for the difference between the number of jobs lost and increase
in the number of unemployed, we use the concept of joblessness, which
includes both those reported as unemployed (those actively looking for a
9job and willing to accept an offer) and what is known as discouraged workers.
A discouraged worker is defined as a person who wants employment but is
not is not actively engage in job search due to factors such as a shortage of
employment opportunities, discriminatory barriers, or a lack of prerequisite
skills. In other words, they are discouraged by external factors. Regardless of
the reason, discouraged workers do not fulfill the CPS criteria to be classified
as being unemployed, thus they do not show up in the official unemployed
Ong & Associates • UCLA Center for Neighbhorhood Knowledge • UCLA Asian American Studies Center
statistics. This exclusion is particularly problematic during the COVID-19 crisis,
which has radically and profoundly altered the meaning of unemployment for
individuals as well as unemployment statistics. 14 It is understandably rational
for discouraged workers to not actively seek employment because of a
dramatic decrease in demand for labor and the prohibitive transaction cost of
job search during shelter-in-place mandates.
For our purpose, we define the COVID-19 discouraged workers as those who
were in the labor market prior to the health crisis but withdrew during the crisis.
(This allows us to not include pre-existing discouraged workers and to focus on
the effects of the coronavirus shut down.) This definition is operationalized as
the decline in the labor force from February to April 2020. Using this definition,
the cumulative discouraged workers from February to April is 8.06 million.
(We use February as the baseline because the March 2020 CPS appears to
capture some of the early COVID-19 effects. The February to March figure is
1.63 million, or about a fifth of the cumulative number of unemployed and
discouraged workers.)
Figure 2 reports the official CPS unemployment rates for the U.S. (blue bars)
along with our estimated joblessness rates (brown bars). As context, the
CPS unemployment count is 23.08 million people for April, an increase of
17.29 million persons since February. The total estimated joblessness count
(unemployed plus discouraged) for the same period is 31.14 million. Including
COVID-19 discouraged workers would add 5.2 percentage points to the
nation’s official CPS unemployment rate (14.7%) for April, resulting in a jobless
rate of nearly 1 in 5 workers (19.9%).
10Figure 2. U.S. Unemployment and Jobless Rates, 2020
25
20
15
Ong & Associates • UCLA Center for Neighbhorhood Knowledge • UCLA Asian American Studies Center
10
5
0
Jan UR Feb UR Mar UR Mar Jobless Apr UR Apr Jobless
Jan UR Feb UR Mar UR Mar Jobless Apr UR Apr Jobless
Source: Unemployment Rates from BLS. Estimates for Jobless Rates by authors using BLS Data
An important distinction among the COVID-19 jobless individuals is whether
they receive unemployment benefits from the state. The Unemployment
Insurance program provides an economic safety net.15 The UI program is
funded by a premium (or tax) paid by employers, with a higher rate for
firms that tend to have frequent layoffs. Before the COVID-19 crisis, state
UI programs provided no more than 26 weeks of payments, which typically
replaced less than half of earnings.16 Placing limits on UI benefits is a way to
minimize perverse incentives to remain unemployed. The main goal is to move
individuals back to work as quickly as possible. Benefits are not automatic for
all unemployed.17 UI payments are based on prior earnings, so those who had
earned more receive more.
11COVID-19’s impact on the nation’s UI program is evident in Figure 3. The
number of initial claims was over 24 times as high for the week of March 28
compared to just two weeks earlier (6867K and 282K respectively). While
initial claims steadily declined over the next few weeks, the levels have
remained several times as high as the levels before the COVID-19 crisis. As
Figure 3 shows, the growth in continued claims lagged behind the surge of
initial claims, due to the difficulties of processing, approving and rejecting the
avalanche of applicants. The number of continued claims peaked at
24.9 million for the week May 9, which included back payments.
Ong & Associates • UCLA Center for Neighbhorhood Knowledge • UCLA Asian American Studies Center
Figure 3. U.S. Weekly Unemployment Insurance Claims, January 4 - May 16, 2020
8,000,000 30,000,000
7,000,000
25,000,000
6,000,000
20,000,000
5,000,000
4,000,000 15,000,000
3,000,000
10,000,000
2,000,000
5,000,000
1,000,000
0 0
1/4/2020 2/4/2020 3/4/2020 4/4/2020 5/4/2020
Initial Claims Continuing Claims
Source: https://oui.doleta.gov/unemploy/claims.asp. Data accessed June 13, 2020
Despite the surge in UI application and enrollment, there are individuals
who are not enrolled in the program because they quit their job, do not
meet the required minimum earnings, have exhausted benefits, or were
self-employed. Some do not know that they can apply. A recent national
study found that nearly three quarters of the unemployed did not apply for
UI benefits, with the majority of non-applicants believing that they were not
eligible for UI benefits.18
12III. asian american
Economic Disparities in
the covid-19 downturn
UNEMPLOYMENT RATES, JOBLESSNESS RATES, AND UI COVERAGE
Having examined the larger economic effects of COVID-19 on the national
economy, we now analyze the COVID-19 economic effects on Asian
Americans. Figure 4 shows the unemployment rates and estimated jobless
rates for the first 5 months of 2020 for Asians and whites. As before, the
Ong & Associates • UCLA Center for Neighbhorhood Knowledge • UCLA Asian American Studies Center
estimated jobless rates are calculated by adding the unemployment rate and
the percentage change in the labor force from February 2020.
Prior to COVID-19, Asian American unemployment rates were comparable
to white unemployment rates for the months of January and February at 3%.
As the effects of the virus progressed, both the Asian unemployment and
jobless rates increased faster than the comparable white rates. The May 2020
unemployment rates and estimated jobless rates for Asians were 15% and 21%
compared to 12% and 16% for whites.
Figure 4. Asian and White Unemployment and Estimated Jobless Rates, 2020
25
20
15
10
5
0
Jan-20 Feb-20 Mar-20 Apr-20 May-20
Asian UR White UR Estimated Asian Jobless Estimated White Jobless
Source: Unemployment Rates from BLS. Estimates for Jobless Rates by authors using BLS Data
13Further evidence of the greater unemployment impact of COVID-19 on Asian
Americans is shown by the Unemployment Insurance claims data. Although
we do not have access to national data for Asian American UI claims data, we
do have data for California and New York. Figure 5a shows the progression of
California UI initial claims from mid-March virus thru the end of May 2020. For
comparison, Asian American’s were 16% of the labor force in February 2020.
However, Asian Americans share of UI initial claims were even greater, averaging
19% over the two and a half months of the shutdow in California. Figure 5b
Ong & Associates • UCLA Center for Neighbhorhood Knowledge • UCLA Asian American Studies Center
shows similar results for New York state. Asian Americans make up about 9%
of the New York state labor force. The Asian American percentage of UI claims
started below that percentage at the beginning of shelter-in-place, but rose
rapidly to over 14% by mid-April. Asian American UI claims in New York did level
off to about 9% by the beginning of June 2020.
Figure 5a. Asian American Share of California Initial UI Claims
25%
20%
15%
10%
5%
0%
Share of Feb LF Mar 15-Apr 3 Apr 5-25 Apr26-May30 Since Mar 15
Source: Estimates by authors data from DOLETA and California Policy Lab
14Figure 5b. Asian American Share of New York State Initial UI Claims and All Claims
New York State Initial UI Claims
450,000 16%
400,000 14%
350,000
12%
300,000
10%
250,000
8%
200,000
Ong & Associates • UCLA Center for Neighbhorhood Knowledge • UCLA Asian American Studies Center
6%
150,000
4%
100,000
50,000 2%
- 0%
Mar Mar Mar April April April April May May May May May June
14th 21st 28th 4th 11th 18th 25th 2nd 9th 16th 23rd 30th 3rd
UI Initial Claims Asian American Percent
Source: Estimates by authors data from DOLETA and CITE NY Department of Labor
Unemployment severely impacted the more disadvantaged Asian Americans.
Figure 6 shows the percentages of UI initial claims for Asian American by
education levels versus UI claims for the rest of the California labor force
from mid-March through May. For example, 10% of the Asian American
labor force with college degrees filed UI claims for the 2 and a half months.
The comparable percentage for the rest of the California labor force
was approximately the same at 9%. However, Asian Americans with less
education did much worse. 83% of the Asian American labor force with a
high school education of less filed for UI claims compared to 37% of the rest
of the California labor force with the same level of education. The disparity
in claims filing is also seen for Asian Americans with some college education
with 35% of Asian American claiming unemployment versus 22% for the rest
of the California labor force.
15Figure 6. Asian American Initial UI Claims as a Percentage of the
Labor Force by Education Level
90%
80%
70%
60%
50%
40%
Ong & Associates • UCLA Center for Neighbhorhood Knowledge • UCLA Asian American Studies Center
30%
20%
10%
0%
High School or less Some College or AA Bachelor or Higher
Asian American Not Asian Am
Source: Estimates by authors data from DOLETA and California Policy Lab
It is likely that undocumented workers comprise a disproportionate share of
the jobless individuals outside the UI system. Previous research finds that low-
wage immigrants are disproportionately among those who do not qualify.19
Most undocumented immigrants are currently prohibited from collecting UI,
even though their employers may have contributed payments to UI funds. One
possible exception includes Deferred Action for Childhood Arrivals (DACA)
individuals, provided they have valid work authorization, and several states
(including California) have stated unemployed DACA can apply for UI.20
16INDUSTRIAL SECTORAL DIFFERENCES
Part of the reason why Asian Americans have been disproportionately affected
by the shelter-in-place job losses has been due to the industries that employ
Asian Americans. The hospitality and leisure industrial sector is especially
hard hit. Employment in the hospitality and leisure industry fell by 49% from
February 2020 to April 2020 compared to an employment drop of 14% for
all industries.21 In addition, the retail and other services industries were also
greatly affected. Other services include repair shops and personal services
such hair cutting and laundry service. Employment in retail industries fell by
Ong & Associates • UCLA Center for Neighbhorhood Knowledge • UCLA Asian American Studies Center
15% and 23% for other services from February to April.
Almost 1 in 4 employed Asian American is employed in these 3 industries.
The percentage of Asian American employment in Hospitality and Leisure in
February was 9.2% compared to 7.8% of non-Hispanic whites; in the Other
Services industry, the respective percentages are 5.7% and 4.8%; in the Retail
industry 9.5% and 10.2% (See Figure 7).
Figure 7. Percentages of NH Asians and NH Whites Employed in
COVID-19 Impacted Industries, February 2020
12
10
8
6
4
2
0
Hosp. & Leisure Retail Other Services
% of NH Asian Emp. 2/20 % of NH White Emp. 2/20
Source: Estimates by Authors using CPS data
17Figure 8 shows the large increases in unemployment across these industries for
Asian Americans compared to non-Hispanic whites. April unemployment rates
for Asian were 39% in the Hospitality and Leisure industry; 18% in the Retail
industry, and 40% in the Other Services industry. For all three industries, the
Asian American unemployment rates exceeded that of non-Hispanic whites.
Figure 8. Unemployment Rates of NH Asians and NH Whites in COVID-19 Impacted
Ong & Associates • UCLA Center for Neighbhorhood Knowledge • UCLA Asian American Studies Center
Industries, February 2020 and April 2020
45
40
35
30
25
20
15
10
5
0
Hosp. & Leisure Retail Other Services
UR of NH Asians 2/20 UR of NH Whites 2/20
UR of NH Asians 4/20 UR of NH Whites 4/20
Source: Estimates by Authors using CPS data
18REGIONAL DIFFERENCES
The Asian population is also concentrated in specific regions of the United
States. Given the differences in regional economies, the impact of the
coronavirus is likely to have differential impacts on Asian Americans. Figure 9
shows the non-Hispanic Asian and non-Hispanic white unemployment rates for
the 4 states with the highest Asian population and Hawaii. We include Hawaii
due to its heavy reliance on the tourist industry and high percentage of Asians
as part of the entire state’s population.
Ong & Associates • UCLA Center for Neighbhorhood Knowledge • UCLA Asian American Studies Center
Figure 9. Unemployment Rates for Asians and non-Hispanic Whites,
Selected States: February and April 2020
25
20
15
10
5
0
California New York New Jersey Texas Hawaii
NH Whites Feb 20 NH Asians Feb 20 NH Whites Apr 20 NH Asians Apr 20
Source: Estimates by Authors using CPS data
The impact of COVID-19 clearly varies across the states. The Asian
unemployment rate is close to 25% in Hawaii and 17% in New York. In
Texas, the April 2020 Asian unemployment rate is much higher than that of
whites. However, given the relatively small sample sizes for individual states –
particularly Hawaii – these differences should be seen as preliminary.
19SELF-EMPLOYMENT AND SMALL BUSINESSES
Small business enterprises have traditionally been a large part of the Asian
economic landscape. An ongoing concern is the fate of small businesses as
their smaller size, lower capitalization, and industrial sector makes them highly
susceptible to closure during an economic downturn.
The CPS PUMS includes survey questions on the self-employed status for
Ong & Associates • UCLA Center for Neighbhorhood Knowledge • UCLA Asian American Studies Center
individuals. We emulate a recent paper by economist Robert Fairlie22 using the
CPS class of worker survey variable. This variable identifies individuals who are
primarily self-employed at both an incorporated and un-incorporated business.
Assuming that most of these individuals are running small businesses, the
number of individuals self-employed provides an estimate of small business
closures as a result of COVID-19.
We estimate the number of small businesses using two methods. The first
method includes all individuals whose primary economic activity was self-
employment, but also includes individuals who were not at work during
the reference week. The second method does not include individuals who
were not engaged in that activity during the reference week. As the shelter-
in-place requirements would close down many small businesses such as
restaurants and non-essential retailers, the latter method provides a likely
upper bound of closures. The second method yields estimates that are very
similar to Fairle’s estimates.
20Figure 10. 2020 Asian and Non-Hispanic White Estimated Percent Change in
Number of Small Businesses from February 2020
Mar-20 Apr-20
15%
10%
5%
0%
-5%
-10%
Ong & Associates • UCLA Center for Neighbhorhood Knowledge • UCLA Asian American Studies Center
-15%
-20%
-25%
-30%
-35%
NH Whites including Not at Work NH Whites without Not at Work
NH Asian including Not at Work NH Asian without Not at Work
Source: Estimates by Authors using CPS data
Figure 10 shows the estimated percentage change in small business numbers
for the months of March and April compared to February 2020. In February,
the number of non-Hispanic white owners of small businesses including
owners not at work was 11.18 million. Using the second method, the non-
white small business estimate drops to 10.55 million. The respective numbers
for Asians are 880,000 and 820,000. By April, white small businesses fell to
10.60 million when owners not at work are included and 8.76 million when
owners not at work are excluded. For Asians, the respective numbers are
879,000 and 587,000. As COVID-19 clearly led to at least temporary closures,
the second method is likely an upper bound estimate of the temporary and
possibly permanent business closures. For Asians, this meant a drop in
233,000 businesses from February to April representing 28% of a decline in
the two-month period. Non-Hispanic white small businesses declined by 1.79
million businesses and 17% over the same period. Again, given the relatively
small sample sizes for self-employed workers, these estimates should be seen
as preliminary.
21Image Credit: Barbra Ramos 22
IV. SUMMARY
                                     SUmmary

The impact of COVID-19 on the U.S. economy has been and continues to be
horrendous. Official unemployment rates for the nation as a whole reached
near 15% for the month of April. Moreover, recovery is likely to take time due
to the uncertainties created by the virus as well as due to the mitigation policies
that will continue to be in effect.

The virus has a disparate economic impact on Asian Americans. One, there

                                                                                      Ong & Associates • UCLA Center for Neighbhorhood Knowledge • UCLA Asian American Studies Center
appears to be an increasing difference in Asian and white unemployment
rates and joblessness rates. Leading up to the shelter-in-place orders,
Asian and white unemployment rates were very similar. The April 2020
unemployment and estimated joblessness rates for Asians are higher than
the rates for whites. Unemployment greatly affected disadvantaged Asians
as shown by the UI claims data for high school and lower levels of education.
Indeed, lower income Asians in the hard-hit Hospitality and Leisure and Other
Service industries were especially affected with 40% unemployment rates
in both industries, compared to 36% and 19% respectively for non-Hispanic
whites unemployment rates in these industries. Asian small businesses were
dramatically affected. Asian self-employment dropped by 233,000 from
February to April representing 28% of a decline in the two-month period. In
the same period, Non-Hispanic white small businesses declined by 1.79 million
businesses and 17%.

Part of the disparity of the economic effects of COVID-19 may be explained
by the regional locations and industrial sectors of employment of Asian
Americans. Asian Americans are heavily concentrated in a small number
of states and employed in industries most affected by the shelter-in-place
mandates. An important question for future research is if these disparities
continue as the economy re-opens. In addition, with the apparent increase in
anti-Asian sentiment in the U.S., the economic manifestation of this sentiment
may have added to these disparities. As the economy continues to undergo
disruptions due to virus, the total economic impacts on Asian Americans
remains to be seen.

                                                                                       23
V. POLICY
RECOMMENDATIONS
The following policy recommendations aim to support Asian Americans
economically during this pandemic. In particular, the marginalized, low-
income, service sector segments of the Asian American populations who face
increasing difficulty in the slowly recovering economy will need support during
the current health and economic crisis. Policies include:
1. Enact federal policy to extend Unemployment Insurance (UI) benefits and
small business assistance loan programs such as the Paycheck Protection
Ong & Associates • UCLA Center for Neighbhorhood Knowledge • UCLA Asian American Studies Center
Program (PPP) and Economic Injury Dislocation Loans Programs.
2. Enact additional state policies that provide state UI benefits to marginalized
populations least likely to receive UI benefits from the CARES Act.
3. Enact additional state policies to assist small businesses such as small
business Resiliency Funds that have been established by local governments.
4. Ensure that marginalized populations are aware of, and take advantage of
resources in the governmental as well as private and philanthropic sectors
to help people to weather the financial hardships of the COVID-19 storm.
5. Enact federal and state polices, and fund programs, to equip economically
displaced persons with job skills that are marketable during and after
the COVID-19 crisis. We need to invest in all workers to ensure a robust
recovery.
Further, we need to continue to refine our analysis and monitor developments
over time. This includes, for example, deriving new estimates from the
Current Population Survey micro sample and additional data from Current
Employement Statistics and UI, particularly, if we have access to the more
confidential information. Nonetheless, this brief does provide some useful
insights despite data and methodological limitations.
______
Donald Mar is professor emeritus of economics at San Francisco State University,
and Paul Ong is research professor at UCLA Luskin School of Public Affairs.
24Ong & Associates • UCLA Center for Neighbhorhood Knowledge • UCLA Asian American Studies Center
25
Image Credit: Sid WichienkuerVI. Appendix
data sources
sourceS
The descriptions below are based on text taken directly from the websites and
documents for each of the data source.
The Current Population Survey is sponsored jointly by the U.S. Census Bureau
and the U.S. Bureau of Labor Statistics (BLS) and is the primary source of labor
force statistics for the population of the United States. It is the primary source
for U.S. labor force statistics. The survey includes a representative sample
Ong & Associates • UCLA Center for Neighbhorhood Knowledge • UCLA Asian American Studies Center
of about 60,000 homes and focuses on those individuals who are 15 years
and older to make an inferential assumption about the U.S. population as a
whole. The survey asks about the employment status of each member of the
household 15 years of age or older as of the calendar week containing the
12th day of the month.
In the Current Population Survey, people are classified as unemployed if they
meet all of the following criteria:
• Not employed during the survey reference week.
• Available for work during the survey reference week, except for
temporary illness.
• Made at least one specific, active effort to find a job during the 4-week
period ending with the survey reference week (see active job search
methods) OR they were temporarily laid off and expecting to be
recalled to their job.
• People waiting to start a new job must have actively looked for a
job within the last 4 weeks in order to be classified as unemployed.
Otherwise, they are classified as not in the labor force.
This brief includes both pre-tabulated data (information already generated
by the BLS) as well as information derived from the CPS public use microdata
(“Basic Monthly CPS) files, specifically for the months of February and April
2020. The latter allows for special tabulations of information not published or
readily available on the BLS’s website. For this brief, we used the microdata files
to generate statewide information on unemployment rates broken down by
race and ethnicity and information on whether those surveyed “want-to-work”
26 (“Do you currently want a job, either full or part time?”).The Current Employment Statistics program is a monthly survey conducted
by the Bureau of Labor Statistics. Data produced from the CES survey
include nonfarm employment series for all employees, production and
nonsupervisory employees, and women employees, as well as average
hourly earnings, average weekly hours, and average weekly overtime hours
(in manufacturing industries) for both all employees and production and
nonsupervisory employees. Payroll employment data are published for
both private and government sectors. These data are available for nonfarm
industries. The survey reference period is the pay period including the 12th
of the month. This can vary according to an establishment’s length of pay
period, a factor considered when compiling the data. The CES program is a
federal-state cooperative program and is based on approximately 145,000
businesses and government agencies representing approximately 697,000
worksites throughout the United States. CES data are classified and reported
Ong & Associates • UCLA Center for Neighbhorhood Knowledge • UCLA Asian American Studies Center
by industries using to the 2017 North American Industry Classification System
(NAICS).
The 2018 American Community Survey Public-Use Micro Sample Data (ACS
PUMS) The ACS is a continuous survey conducted by the U.S. Census Bureau to
collect housing, demographic, social and economic information. On an annual
basis, the sample represents about 2.0-2.5% of households and individuals,
and the PUMS contains a subset of about 1% of households and individuals.
We use information from the civilian workforce 16 years of age and older in our
analyses. This includes those employed at work or with a job but not at work,
and unemployed adults. We also include their race and ethnicity, employment
industry to identify workers in industries impacted by COVID-19 (retailing,
hospitality and personal services) as well as information to estimate entry and
re-entry rates, and identify low-income earners.
The U.S. Department of Labor’s Employment and Training Administration
(DOLETA) provides weekly unemployment insurance claims data for each state.
The unemployment insurance weekly claims data are used in current economic
analysis of unemployment trends in the nation, and in each state. UI claims data
are also used by the private sector to assess the state of the labor market and
economy. The weekly release of data allows for frequent updates on the levels
of unemployment. UI claims can be broken down into two categories:
• Initial claims are an employment report that measures the number
of new jobless claims filed by individuals seeking to receive
unemployment benefits.
• Continuing claims, also referred to as insured unemployment,
measures workers who have already filed an initial claim, and who have
27experienced a week of unemployment and then filed a continued claim
to claim benefits for that week of unemployment. Continued weeks
claimed measure the number of persons claiming unemployment
benefits.
The California Policy Lab (CPL) creates data-driven insights for the public
good by facilitating close working partnerships between policymakers and
researchers at UCLA and UC Berkeley to help evaluate and improve public
programs through empirical research and technical assistance. Through
a partnership with the Labor Market Information Division of the California
Employment Development Department, CPL is analyzing daily initial UI
Ong & Associates • UCLA Center for Neighbhorhood Knowledge • UCLA Asian American Studies Center
claims to provide an in depth and near real-time look at how the COVID-19
crisis is impacting various industries, regions, counties, and types of workers
throughout California. CPL analyses are updated on a biweekly basis and
data are made available to the public. We use the CPL’s reported data on UI
coverage by race and ethnicity to supplement UI data derived from the U.S.
Department of Labor’s Employment and Training Administration.
The New York State Department of Labor’s Division Research and Statistics
currently publishes a weekly report on initial unemployment claims by state
geographic location, industry, gender, age, and race. We access the reports
for the time period from the Dept. of Labor website for the weeks beginning
in March to the first week of June. For example, the week ending May 9 is
accessed at https://www.labor.ny.gov/stats/PDFs/Research-Notes-Initial-
Claims-WE-5092020.pdf.
28VII. Endnotes
ENDNOTES
1 Centers for Disease Control and Prevention, “Coronavirus Disease 2019
(COVID-19), Cases in the US,” https://www.cdc.gov/coronavirus/2019-ncov/cases-
updates/cases-in-us.html. Accessed June 8, 2020.
2 Governor Gavin Newsom, State of California, “Executive Order N-33-20,” March
19, 2020; Mayor Eric Garcetti, Los Angeles City, “Public Order Under City of Los
Angeles Emergency Authority,” March 19, 2020.
3 U.S. Bureau of Labor Statistics, “Labor Force Statistics from the Current Population
Survey,” https://www.bls.gov/cps/. Accessed June 8, 2020.
4 David Nakamura, “With ‘kung flu,’ Trump sparks backlash against racist
Ong & Associates • UCLA Center for Neighbhorhood Knowledge • UCLA Asian American Studies Center
language,” Washington Post, https://www.washingtonpost.com/politics/with-
kung-flu-trump-sparks-backlash-over-racist-language--and-a-rallying-cry-for-
supporters/2020/06/24/485d151e-b620-11ea-aca5-ebb63d27e1ff_story.html.
Accessed July 3, 2020.
5 Pew Research Center, “Many Black and Asian Americans Say They Have
Experienced Discrimination Amid the COVID-19 Outbreak,” https://www.
pewsocialtrends.org/2020/07/01/many-black-and-asian-americans-say-they-have-
experienced-discrimination-amid-the-covid-19-outbreak/. Accessed July 3, 2020.
6 IPSOS, “New Center for Public Integrity/Ipsos Poll finds most Americans say the
Coronavirus Pandemic is a Natural Disaster,” April 28, 2020, https://www.ipsos.
com/en-us/news-polls/center-for-public-integrity-poll-2020.
Accessed July 11, 2020.
7 Asian Pacific Policy and Planning Council and Chinese for Affirmative Action,
“Over 800 COVID-19-Related Hate Incidents Against Asian Americans Take Place in
California in Three Months,“ http://www.asianpacificpolicyandplanningcouncil.org/
wp-content/uploads/CA_Report_6_30_20.pdf. Accessed July 3, 2020.
8 Nina Roberts, “As COVID-19 spreads, Manhattan’s Chinatown contemplates a bleak
future,” Marketplace, March 16, 2020, https://www.marketplace.org/2020/03/16/
as-covid-19-spreads-manhattans-chinatown-contemplates-a-bleak-future/.
Accessed May 26, 2020.
9 Julie Chang, “San Francisco Chinatown Affected by Coronavirus Fears,
Despite No Confirmed Cases,” NPR, February 26, 2020, https://www.npr.
org/2020/02/26/809741251/san-francisco-chinatown-affected-by-coronavirus-
fears-despite-no-confirmed-cases. Accessed May 26, 2020.
10 Liz Ohanesian, “In Chinatown, Coronavirus News Has Hurt Small Businesses for
Weeks,” LA Magazine, March 19, 2020, https://www.lamag.com/citythinkblog/
chinatown-coronavirus/. Accessed May 26, 2020.
11 Data from Centers for Disease Control and Prevention, “Coronavirus Disease
2019 (COVID-19), Previous U.S. COVID-19 Case Data,” https://www.cdc.gov/
coronavirus/2019-ncov/cases-updates/previouscases.html. Accessed June 8, 2020.
12 See for example, Gary Becker, The Economics of Discrimination, 1971, University of
Chicago Press.
13 California State, “Essential Workforce,” April 28, 2020, https://covid19.ca.gov/img/
EssentialCriticalInfrastructureWorkers.pdf. Accessed May 24, 2020.
2914 U.S. Bureau of Labor Statistics, “Frequently asked questions: The impact of the
coronavirus (COVID-19) pandemic on The Employment Situation for April 2020,” May
8, 2020. https://www.bls.gov/cps/employment-situation-covid19-faq-april-2020.pdf.
Accessed May 24, 2020.
15 It was initially established by Wisconsin in 1932 to provide temporary relief for those
laid off during the Great Depression, subsequently spread to other states and adopted
by the federal government. Daniel N. Price, “Unemployment insurance, then and now,
1935-85,” Social Security Bulletin, vol 48, no 10, 1985, p. 22.
16 Replacement Rates Report, https://oui.doleta.gov/unemploy/ui_replacement_rates.asp
17 According to California’s Employment Development Department (EDD), an individual
must fulfill the following requirements: be totally or partially unemployed, be laid off
through no fault of their own, be physically able and available for work, be actively
seeking work, and be willing to immediately accept an offer. California Employment
Development Department, “FAQs – Eligibility,” https://www.edd.ca.gov/unemployment/
eligibility.htm and https://www.edd.ca.gov/Unemployment/FAQ_-_Eligibility.htm.
Ong & Associates • UCLA Center for Neighbhorhood Knowledge • UCLA Asian American Studies Center
18 Bureau of Labor Statistics, U.S. Department of Labor, The Economics Daily, “Most
unemployed people in 2018 did not apply for unemployment insurance benefits,”
https://www.bls.gov/opub/ted/2019/most-unemployedpeople-in-2018-did-not-apply-
for-unemployment-insurance-benefits.htm. Accessed April 02, 2020.
19 Rebecca Smith, Immigrant Workers’ Eligibility for Unemployment Insurance, March 31,
2020, https://www.nelp.org/publication/immigrant-workers-eligibility-unemployment-
insurance/; California Budget Project, “Making the Unemployment Insurance System
Work for California’s Low Wage Workers,” 2001.
20 According to one source, California, Colorado, Illinois, Michigan, Texas, and New York.
https://www.informedimmigrant.com/guides/daca-coronavirus/#.
21 Calculated from the BLS Employment and Industry data,https://www.bls.gov/charts/
employment-situation/employment-levels-by-industry.htm. Accessed June 11, 2020.
22 Robert Fairlie, “The Impact of COVID-19 on Small Business Owners: Evidence of Early-
Stage Losses from the April 2020 Current Population Survey,” NBER Working Paper 20-
022, May 2020.
Report design by Barbra Ramos/UCLA Asian American Studies Center
30http://knowledge.luskin.ucla.edu
@knowledgeluskin
UCLACenterforNeighborhoodKnowledge
http://aasc.ucla.edu
@uclaaasc
UCLAAASC
Image Credit: Barbra RamosYou can also read