Taubman Centers, Inc - Investor Presentation September 2018
←
→
Page content transcription
If your browser does not render page correctly, please read the page content below
Taubman Centers, Inc.
Investor Presentation

September 2018
Taubman Centers, Inc.
(NYSE: TCO)
A real estate company founded in 1950,
with 68 years in operation
First publicly traded UPREIT – IPO 1992
Total market capitalization over
$10 billion
Joined the S&P 400 MidCap Index in
January 2011
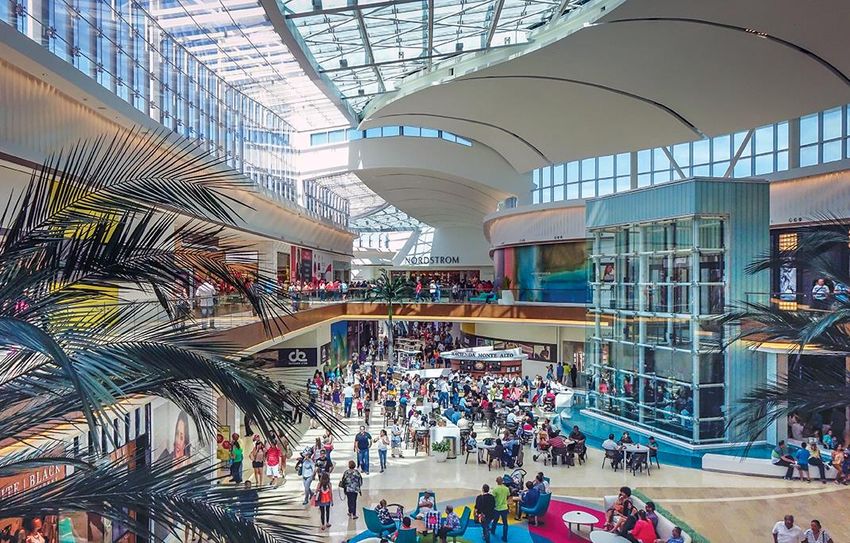
We own, operate and develop the best
retail assets
Our portfolio of malls is the most
productive in the U.S. publicly held mall
sector
Currently own and/or operate 26 retail
assets, with 1 project under
development
2
Fair Oaks, Va.                   The Mall at Millenia, Fla.           The Mall at Short Hills, N.J.       Country Club Plaza, Mo.

     Beverly Center, Calif.        Cherry Creek Shopping Center, Colo.         City Creek Center, Utah                Dolphin Mall, Fla.

We Own, Operate and Develop the Best Retail Assets

The Gardens on El Paseo, Calif.     Great Lakes Crossing Outlets, Mich.      Starfield Hanam, South Korea     The Mall of San Juan, Puerto Rico

    International Plaza, Fla.     The Mall at University Town Center, Fla.      Waterside Shops, Fla.                Westfarms, Conn.
We Have the Industry's Premier Portfolio

With Five Key Success Factors that Drive Productivity

   We Strategically Enhance Our Portfolio through:
U.S. Development, Taubman Asia, Redevelopment,
           Acquisitions & Dispositions

    While Emphasizing a Strong Balance Sheet

     To Create Significant Shareholder Value

                                                        4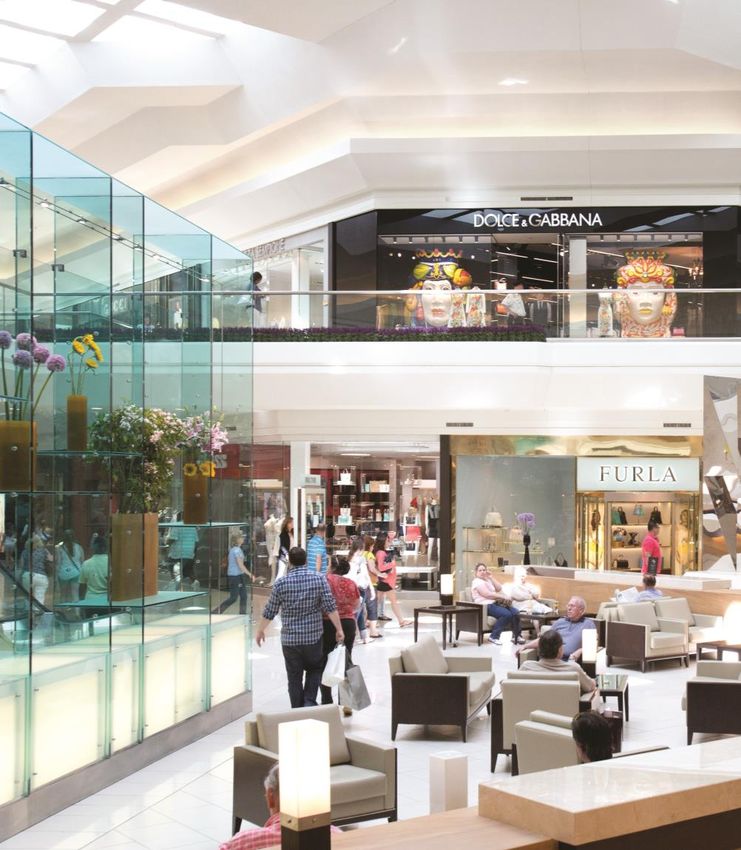
Industry’s Premier Portfolio
We Operate the Best Collection of Retail Assets

                               South                                                                                                                                23
                               Korea                                                                                                         10
 China                18                                                                                                                                          17
           4                                                                                                                            20
    3                     27                                                                                                                                    16
                                             19                          5
                                                                                        2                                                                 8
         Macau
                        Asia                                                                                      6
           24
                   Properties
                                                      1     9                                                                          11

                               12                                                                                                                       26

        Owned Properties
                                                                                                                                                  13 14
1   Beverly Center                     10 Great Lakes Crossing Outlets   18 Starfield Hanam
    Los Angeles, Calif.                   Auburn Hills, Mich.               Hanam, South Korea                                                     21    7
2   Cherry Creek Shopping Center       11 The Mall at Green Hills        19 Sunvalley Shopping Center                                                22
    Denver, Colo.                         Nashville, Tenn.                  Concord, Calif.
                                                                                                                                                        25
3   CityOn.Xi’an                       12 International Market Place     20 Twelve Oaks Mall
                                                                                                                                                                           15
    Xi’an, China                          Waikiki, Honolulu, Hawaii         Novi, Mich.                  Managed/Leased Centers –
4   CityOn.Zhengzhou                   13 International Plaza            21 The Mall at University       No Ownership                              Development Properties
    Zhengzhou, China                      Tampa, Fla.                       Town Center
5   City Creek Center                  14 The Mall at Millenia              Sarasota, Fla.                                                    27    Starfield Anseong
                                                                                                     24 The Boulevard at Studio City
    Salt Lake City, Utah                  Orlando, Fla.                  22 Waterside Shops             Macau, China                                Anseong, South Korea
6   Country Club Plaza                 15 The Mall of San Juan              Naples, Fla.
                                                                                                     25 Miami Worldcenter
    Kansas City, Mo.                      San Juan, Puerto Rico          23 Westfarms                   Miami, Fla.
7   Dolphin Mall                       16 The Mall at Short Hills           West Hartford, Conn.
                                                                                                     26 The Shops at Belmond
    Miami, Fla.                           Short Hills, N.J.                                             Charleston Place
8   Fair Oaks                          17 Stamford Town Center                                          Charleston, S.C.
    Fairfax, Va.                          Stamford, Conn.
9   The Gardens on El Paseo
    Palm Desert, Calif.                                                                                                                                                         5
Industry’s Premier Portfolio

  The Best Assets Have Significantly Greater Value
                                                                US Mall Distribution by Quality
                                                                                           169
                                                                          140
                                                          111                                              117                               119               116
                                          94                                                                                 99
                         58                                                                                                                                                  44
         37

        A++              A+                A               A-              B+                B               B-              C+                C                 C-           D

                    Taubman’s portfolio of 20 assets(1) average between A+ and A quality.
                                                    Roughly 78% of mall asset value is held in ‘A’ malls

                  23%                                    20%                                  21%                             14%                   10%               7% 3%3%

                                                                       Percent of Industry Value

      A++ quality malls, which
                                                                    A                            B quality malls, which represent 39%
                                                                                                 of all malls, account for 20% of value                       B               CD
   represent 3.4% of all malls,                                                                                             C quality malls, which represent 30% of
   account for 23% of all value                                                                                                   all malls, account for 3% of value
                                                                          D quality malls, which represent 4% of malls, account for less than 0.1% of value

Source: Green Street Advisors. (2018) Annual Grade Review. Grades are based on merchandise mix, productivity, location, condition/appeal and other factors.
Note: (1) Excludes Taubman Asia assets, as the Green Street only includes U.S. assets in their database.
                                                                                                                                                                                         6
Industry’s Premier Portfolio

The Best Assets Are the Most Productive

                      Highest Portfolio Sales                                                              Highest Average Rent
                        Per Square Foot(1)(3)                                                               Per Square Foot(2)(3)
                                   (June 30, 2018)                                                                    (June 30, 2018)

   TCO                                                                $845
                                                                                     TCO                                                                     $61.91

  MAC                                                      $692
                                                                                     MAC                                                                 $58.84
   SPG                                                  $646

    PEI                                       $485                                   SPG                                                             $53.84

   SKT                                 $391
                                                                                      CBL                                      $32.64
  WPG                                 $377

                                                                                     WPG                                  $27.49
   CBL                                $376

          $0         $200          $400         $600           $800       $1,000            $0       $10       $20       $30       $40       $50       $60       $70
 Source: Company Filings and Supplementals, Company Quarterly Earnings Conference Calls, Taubman Analysis.
 Note: (1) Typically excludes all non-comparable centers, anchors, temporary tenants and 10,000+ sf tenants.
       (2) PEI and SKT are excluded as they do not report Avg. Rent Per Square Foot on a comparable basis.
       (3) TCO amounts represent U.S. comparable centers only.
 Ticker Identification: TCO – Taubman Centers, Inc., MAC – The Macerich Company, SPG – Simon Property Group, Inc., PEI – Pennsylvania Real Estate Investment Trust, SKT –
 Tanger Factory Outlet Centers, Inc., CBL – CBL & Associates Properties, Inc., WPG –Washington Prime Group, Inc.

                                                                                                                                                                            7
We Have the Industry's Premier Portfolio

With Five Key Success Factors that Drive Productivity

   We Strategically Enhance Our Portfolio through:
U.S. Development, Taubman Asia, Redevelopment,
           Acquisitions & Dispositions

    While Emphasizing a Strong Balance Sheet

     To Create Significant Shareholder Value

                                                        8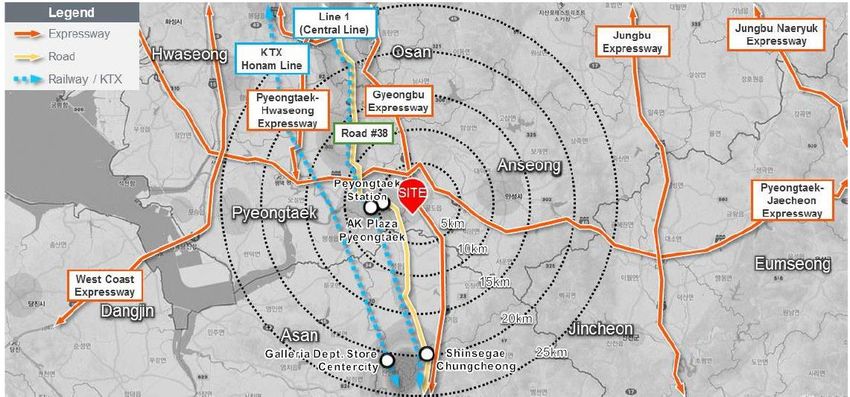
Productivity

Five Key Success Factors
              The best retail assets have five key success factors that drive
                 productivity, ultimately resulting in NOI and FFO growth.

                               Omnichannel Complementary
                                                                        Premier In-Line
  Best Demographics                                                     Tenants
      Best Locations                                                    High Quality
                                                                        Anchors &
                                                                        Department Stores

                                     Best Retail
                                      Assets

                                 Sales Productivity &
                                    Rent Growth

                       NOI                                FFO
                       Growth                             Growth

                                                                                                     9
Productivity

We Have the Best Locations

                         Highest Concentration of Asset Value in
                                  Top U.S. 50 Markets
      100%

       90%

       80%

       70%

       60%

       50%
                      89%
       40%                               82%                 80%
       30%                                                                      63%                 60%
                                                                                                              47%
       20%

       10%                                                                                                          25%

        0%
                     TCO                 MAC                SPG                 GGP                 PEI       WPG   CBL

      Source: Green Street Advisors. U.S. Mall Outlook 2018, Mall REIT Asset Value Concentration by Market.

   Leading retailers and emerging concepts choose to showcase their
         brand in the best markets and highest quality assets

                                                                                                                                   10
Productivity
With Industry-Leading Demographics
U.S. Mall REIT Demographics – 15 Mile Radius
Median Household Income Average Household Income
TCO $79,583 TCO 102,637
SPG $72,720 SPG 93,663
PEI $72,633 PEI 92,299
MAC $71,732 MAC 91,941
GGP $67,571 GGP 86,725
WPG $60,100 WPG 76,992
CBL $58,452 CBL 74,991
$0 $20,000 $40,000 $60,000 $80,000 $100,000 $0 $20,000 $40,000 $60,000 $80,000 $100,000$120,000
Population % of Household Earnings > $100K
MAC 2,365,786 TCO 34.6%
TCO 1,670,468 SPG 32.1%
PEI 1,451,252 PEI 32.0%
SPG 1,415,527 MAC 31.2%
GGP 1,271,894 GGP 29.7%
WPG 761,512
WPG 25.2%
CBL 495,314
CBL 25.1%
0 500,000 1,000,000 1,500,000 2,000,000 2,500,000
15.0% 20.0% 25.0% 30.0% 35.0% 40.0%
Source: Evercore ISI Research Reports dated March 13, 2018. © Copyright 2018. Evercore Group L.L.C. All rights reserved.
11Productivity
Complementing Our Retailer’s Omnichannel Strategy
Successful retailers
understand that a
combination of both
physical and digital
channels best meets their
customer needs
Retailer’s Physical locations are an
Physical omnichannel
locations eCommerce important distribution
strategy channel that reduce order
Retailer’s fulfillment and customer
Omnichannel acquisition costs, while
Strategy improving website traffic
eCommerce and brand recognition
Taubman’s “A” quality
portfolio complements
retailer's omnichannel
Internet only retailers are moving into physical stores in high- strategy by positioning
quality malls as the omnichannel strategy grows in the their brand among high-
modern retail landscape end, productive retailers
in the best markets
12Productivity
Attracting the Premier Brands
Brands that have chosen a Taubman “Online” retailers that
Center as their first U.S. Mall location are now tenants in Taubman Centers
13Productivity
Superior Collection of Brands - Attracting Both
Customers & Retailers to our Centers
Beverly Center
Cherry Creek Shopping Center
City Creek Center
Country Club Plaza
Dolphin Mall
Fair Oaks
The Gardens on El Paseo
Great Lakes Crossing Outlets
The Mall at Green Hills
International Market Place
International Plaza
The Mall at Millenia
The Mall of San Juan
The Mall at Short Hills
Stamford Town Center
Sunvalley
Twelve Oaks Mall
The Mall at University Town Center
Waterside Shops
Westfarms
Note: Excludes Taubman Asia 14Productivity
Evolution of Taubman’s Retailer Mix
◼ New high-productivity retailers have naturally taken greater space throughout our portfolio, while formerly
prominent tenants have decreased their footprint over the last 10 years
◼ The evolution of Taubman’s tenant mix has contributed to our sales growth over the last decade
◼ The below table highlights a sample of significant changes within our tenant base over the last 10 years
Change in GLA (Sqft.) Change in GLA (Sqft.)
Tenant Tenant
2017 vs. 2007 2017 vs. 2007
-165,000 +298,000
-131,000 +134,000
-86,000 +57,000
-63,000 +56,000
-48,000 +34,000
Tenant Sales per Square Foot
(2007 through 2017)
Tenant Sales per Square
800 3.9%
CAGR
700
Foot ($)
600
500
400
2007 2008 2009 2010 2011 2012 2013 2014 2015 2016 2017
15Productivity
Strong Tenant Demand for Space
Occupancy and Leased Space Percentage
96.7%
95.8% 96.0% 96.1% 95.6%
94.8%
95.9% Expect About
94.1% 94.2% 93.9%
95.0% 95% comparable
center occupancy
90.0%
at year-end 2018
85.0%
Ending Occupancy
80.0% Percentage – All Centers
Leased Percentage –
75.0%
All Centers
2013 2014 2015 2016 2017
New Concepts Recently Added to TCO’s Portfolio
Emerging Brands Food
16Productivity
Best-in-Class Anchor Quality
Greatest Exposure to High Quality Specialty Department Stores
TCO CBL MAC PEI SPG WPG
Anchors are a critical
15 30 35 16 107 26
factor in assessing mall
9 1 12 1 28 0 quality
5 1 1 0 6 1 Strong anchors attract
4 0 2 0 12 0 both retailers and
3 0 2 1 10 0 customers
3 0 3 1 9 0 Taubman’s portfolio is
well-positioned;
Total Fashion Dept. 39 32 55 19 172 27
Total Traditional
containing the largest
Dept. Stores 49 197 125 47 358 155 concentration of high
79.6% 16.2% 44.0% 40.4% 48.0% 17.4% quality anchors
Least Exposure to “Troubled” Department Stores
TCO CBL MAC PEI SPG WPG
3 40 21 8 59 42
4 49 28 16 66 39
Total Troubled Dept. Source: BofA Merrill Lynch Global Research, “2Q18
Stores 7 89 49 24 125 81 Quarterly: Retail REITs remain cautious despite
beats; risks to ‘19 #’s in our view”, August 20, 2018.
Total Traditional
Dept. Stores
49 197 125 47 358 155 Note: Analysis excludes SKT, as they operate
premium outlet centers. Analysis includes Macy’s
14.3% 45.2% 39.2% 51.1% 34.9% 52.3% Men’s Store and Macy’s Furniture Gallery.
17Productivity
Taubman’s Assets Deliver Superior Performance
Adjusted Adjusted
Funds from Operations
Funds from
Total Portfolio NOI(1) Per Diluted (1)
Operations PerShare
Diluted Share(1)
$800 $777
$4.00 30
$704 $3.65 $3.67 $3.70
Number of owned centers (as of December 31)
$685 $3.58
$700 $661 $661 $3.42(2)
$3.50 $3.34
$622(2) $2.84 25
$590 $585 $588 $591 $3.08 $3.06 $2.86
$600
$3.00
$500 20
$2.50
$400
$2.00 15
$300
$1.50
10
$200 $1.00
5
$100 $0.50
$0 $0.00 0
Note: (1) See appendix regarding reconciliations to the most comparable GAAP measures.
(2) Excludes the portfolio of seven centers sold to Starwood Capital Group in October 2014.
Source: Company Filings and Supplementals, Taubman SEC Filings, Taubman analysis
18We Have the Industry's Premier Portfolio
With Five Key Success Factors that Drive Productivity
We Strategically Enhance Our Portfolio through:
U.S. Development, Taubman Asia, Redevelopment,
Acquisitions & Dispositions
While Emphasizing a Strong Balance Sheet
To Create Significant Shareholder Value
19Growth – Development
& Taubman Asia
Development - Value Creation Opportunity
◼ About $1.2 billion (at share) has been invested on the below ground up developments which have opened within the last
2 ½ years. We expect these assets to generate significant NOI and NAV growth as they stabilize.
◼ These four assets generated approximately $35 million of NOI (at share) in 2017.
◼ In aggregate, we expect these four assets to generate $70 million to $75 million of NOI (at share) for the full year 2020.
Opened: March 2017
Opened: April 2016 Opened: August 2016
Opened: September 2016 Opened: March 2017
20Growth – Taubman Asia
Starfield Anseong
Anseong - Gyeonggi Province, Greater Seoul, South Korea
Building upon the success of
Starfield Hanam, Taubman is
again partnering with Shinsegae
Group – one of South Korea’s
largest retailers – to create the
first super-regional shopping
center in the rapidly growing area ANSEONG
of the southern Gyeonggi
Province
21Growth – Taubman Asia
Starfield Anseong – Overview
Anseong - Gyeonggi Province, Greater Seoul, South Korea
The project is located near four Opening: Late 2020
growing cities (Pyeongtaek, Anseong,
Ownership: Expect to own 24.5% (currently funding 49%)
Asan, Jincheon) in greater Seoul.
Size: 1,100,000 sqft.
The site includes a well-developed
Partner / Anchor: Shinsegae Group
highway infrastructure near the
Gyeongbu Expressway (links Seoul to Projected Stabilized Return: 6.25% - 6.75%
Busan) as well as the Pyeongtaek- Est. Project Cost: $570M - $600M
Jecheon Expressway connecting to
Major Tenants: Shinsegae Factory Store, E-Mart Trader’s, PK Market,
Eastern Korea, creating a regional draw
ElectroMart, Eatopia, Sport’s Monster, Aquafield, Toy Kingdom and an
to the center. upscale cinema
22
Site of Starfield AnseongGrowth – Taubman Asia
Starfield Anseong – Opportunity
Anseong - Gyeonggi Province, Greater Seoul, South Korea
Favorable supply and demand
dynamics create an opportunity for Lack of Retail Supply
development
Shopping Center and Mixed Use Shopping Mall &
◼ South Korea has much less retail
real estate per capita than the United Department Store Premium Outlet Supply
States GLA / Capita
◼ The primary trade area of the site SF/People
does not contain a modern
shopping center, with current retail 30
facilities almost exclusively limited
hypermarkets and two older
department stores 25 24
◼ Further, significant development plans
in the surrounding area are expected
20
to generate immense population
and employment growth
◼ The combined population of 15
Anseong and Pyeongtaek was
653,000 in 2016 and is expected to
reach 867,000 in 2020 10
◼ By 2030, this population is expected
to grow to 1 million people 6
5
◼ Samsung opened the world’s largest
semi-conductor plant ~6 miles from
the site, eventually creating about
0
110,000 jobs Korea US
◼ The relocation of a U.S. Army base is Source: ICSC (2015)
planned nearby, bringing an estimated
population increase of 80,000 to
100,000 people
23Growth – Redevelopment
Redevelopments – Current
Beverly Center – Los Angeles, CA
◼ Transformative opportunity for comprehensive renovation,
touching every aspect, of a key strategic asset in the
Taubman portfolio
◼ Complete re-imagination of the interiors, exteriors and
parking deck with a design by world renowned architect,
Massimiliano Fuksas
◼ Featuring a significant expansion of food offerings, including
street-level restaurants and a multi-concept gourmet food
hall on level 8
◼ Resulting in LA’s most exciting enclosed, urban shopping
and dining experience and following the renovation, we
expect it will become one of the top ten assets in the country
◼ Projected Returns(1):
3.0% to 4.0% at stabilization in 2020
open
10-year Unlevered IRR in excess of 10.0%, Beverly Center
terminal year 2025 presentation
◼ Targeted Completion Date: Holiday 2018
◼ Cost: $500 million(2)
The Mall at Green Hills – Nashville, TN
◼ Adding 170,000 sq ft of mall tenant area, including a new
Dillard’s store, to be completed in 2019
◼ Projected Return at Stabilization: 6.5% to 7.5%
◼ Cost: $200 million
Note: (1) Projected returns are calculated using the cash flow differential between two
scenarios; a full renovation (described above) and a non-renovation scenario; detail
provided in Appendix on slide 38.
(2) Approximately 20 percent of the cost relates to deferred and prospective
customary capital upgrades and improvements. 24Growth – Acquisitions
Selective Acquisition – Country Club Plaza
ACQUISITION STRATEGY
Highest Quality Acquired a 50% interest in the center in March 2016 for $330
million
Dominant Asset Marquee retail and office property in Kansas City, MO
Below-market rents present growth opportunity
Great Market
Significant expansion and redevelopment opportunity
Growth Opportunity Strategic partnership with The Macerich Company
Leveraging tenant relationships to increase sales to the top one-
Strategic to Existing Portfolio third of our portfolio
• Adds unique retailers to our portfolio
• Strategic Partnership Region’s premier tenant line-up with over 25 restaurants
In February 2018, Nordstrom announced plans to relocate their
store in Kansas City Market to the Plaza
25Dispositions
Strategic Dispositions
DISPOSITION STRATEGY
◼ Our strategy is to recycle capital for growth, minimizing Seven Asset Portfolio Sale
our need to raise equity
◼ Our growth has been self-funded
Following the Starwood transaction (right), we owned
18 centers, 1 less than when we went public in 1992
On a net basis, we had issued only $50(1) million of
common equity since the IPO
Nonetheless, our market capitalization has increased
approximately five times since the IPO, about 25 years
ago Price: $1.403 billion
(1) Excludes equity compensation issuances
Cap Rate: 6.6%
Date: Oct. 16, 2014
History of Recycling Capital for Growth
(Market Capitalization since 1992 IPO) Result:
1. Improved portfolio metrics,
12,000
demographics and operating statistics
Dollars in $MM
10,000 Total Market
8,000 Capitalization 2. Balance sheet strengthened
6,000 3. Liquidity to fund development and
4,000 Equity Market redevelopment pipelines, underscoring
2,000 Capitalization our strategy
0
1992 1997 2002 2007 2012 2017
26We Have the Industry's Premier Portfolio
With Five Key Success Factors that Drive Productivity
We Strategically Enhance Our Portfolio through:
U.S. Development, Taubman Asia, Redevelopment,
Acquisitions & Dispositions
While Emphasizing a Strong Balance Sheet
To Create Significant Shareholder Value
27Conservative Balance Sheet
Taubman’s Balance Sheet Philosophy
$ $ $
Use construction financing
where available and place Closely manage liquidity to
nonrecourse permanent ensure significant availability Recycle capital through non-
financing on new assets on our line of credit for use if core asset sales and excess
upon stabilization opportunities arise refinancing proceeds
$ $
$ $ $
Opportunistically access
public and private capital
Carefully manage debt Minimize exposure to markets when pricing is
maturities interest rate fluctuations advantageous
28Conservative Balance Sheet
Strong Balance Sheet with Flexibility
Balance Sheet Composition
(as of 06/30/2018)
Recent Transactions
9% Refinanced Fair Oaks Mall in the
Common Stock and Operating Washington D.C. area
9% Partnership Equity ($5.1B)
◼ The new 5-year, $260M non-recourse
Preferred Stock ($0.4B) loan has a fixed interest rate of 5.32%,
49% with a 30-year amortization period
Fixed Rate Debt ($3.2B)
Floating Rate Debt
◼ Proceeds were used pay off the
Swapped to Fixed Rate previous $259M loan
($0.9B)
30% ◼ This transaction closed in April 2018
Floating Rate Debt ($0.9B)
3%
Refinanced International Market
Coverage Ratios Place in Hawaii
(as of 06/30/2018) ◼ The $250M loan has a floating rate of
5.0 LIBOR +215 bps, with an initial 3-year
4.0
term and two 1-year extension options
Interest Only ◼ This transaction closed in August 2018
3.0
Fixed Charges
2.0
1.0
0.0
2013 2014 2015 2016 2017 2018 YTD
Source: Company Quarterly Supplementals, Taubman analysis
29Conservative Balance Sheet
Low-Cost and Long-Term Financing
We have extremely attractive, stable, high-quality assets that allow for financing at the best
rates with extended maturities
Efficient debt pricing Cost of capital advantage
Low-Cost and Long-Term Debt in context of U.S. Mall REIT Sector
(as of 06/30/2018)
5.0%
CBL
Weighted Average
4.5% WPG
Interest Rate
PEI
4.0%
MAC TCO
3.5% SPG
3.0%
4.5 5.0 5.5 6.0 6.5 7.0
Weighted Average Debt Maturity
Debt Maturities by Year
(as of 06/30/2018, in millions at our share)1
$3,000 $2,790
$2,500
Dollars in $MM
$2,000
$1,500 $1,272
$1,000
$573
$500 $254
$12 $50
$0
2018 2019 2020 2021 2022 Thereafter
Note:
(1) Maturities assume that all extension options have been exercised and no pay downs are required upon extension.
Source: Company Quarterly Supplementals, Taubman analysis
30We Have the Industry's Premier Portfolio
With Five Key Success Factors that Drive Productivity
We Strategically Enhance Our Portfolio through:
U.S. Development, Taubman Asia, Redevelopment,
Acquisitions & Dispositions
While Emphasizing a Strong Balance Sheet
To Create Significant Shareholder Value
31Significant Shareholder Value
Significant NOI Growth Combined with a
Deleveraging Plan Create an Investment Opportunity
NOI Growth Outlook Superior NOI Growth by
2020(1)
◼We expect to add approximately
$150M of additional NOI in 2020
above 2016 (at our share)
2020
Development Projects(2) to add
approximately $70M to $75M of
NOI
Core Center Growth is expected
to add about $50M of NOI
Redevelopment Projects (3) are
expected to add about $20M to
$30M of NOI
Notes: (1) Assumptions current as of February 9, 2018, the
date of Taubman’s Q4 2017 Earnings Conference Call.
2016 (2) Development projects for the purpose of this analysis
include International Market Place, CityOn.Xi’an, CityOn.
Zhengzhou and Starfield Hanam.
(3) Redevelopment. projects for the purpose of this
analysis include Beverly Center, The Mall at Green Hills,
the former Saks Fifth Avenue location at The Mall at
Short Hills, as well as the former Sport’s Authority
locations at Cherry Creek Shopping Center, Dolphin Mall
and Great Lakes Crossing Outlets.
32Significant Shareholder Value
History of Strong Shareholder Returns
300
Shareholder Returns(1) Dividend Payout Per Share(2)
Cumulative Total Return Since Dec. 31, 2006
S&P 400 Midcap
$2.50
250 Index $2.38
S&P 500 Index $2.26
$2.16
Taubman $2.00
200 $1.85
MSCI US REIT $1.76
Index $1.66 $1.66 $1.68
FTSE NAREIT
150 Equity REIT Index
100
50
0
2007 2008 2009 2010 2011 2012 2013 2014 2015 2016 2017 2008 2009 2010 2011 2012 2013 2014 2015 2016 2017
Over the 10-year period ended December 31, 2017, Taubman The company has never reduced its dividend since
Centers’ compounded annual total shareholder return was 7.4%. the IPO in 1992.
Taubman Centers’ 10-year performance is comparable to the In 2009, Taubman Centers was the only mall REIT
MSCI REIT Index (7.4%) and exceeds FTSE NAREIT Equity Retail among our peers(3) not to reduce its dividend – we
(5.0%) index. also maintained an all-cash dividend throughout the
year.
Note: (1) This graph sets forth the cumulative total returns on a $100 investment in of our Common Stock, the MSCI US REIT Index, the FTSE NAREIT Equity Retail Index, the S&P 500 Index and
the S&P 400 MidCap Index for the period December 31, 2007 through December 31, 2017 (assuming in all cases, the reinvestment of dividends).
(2) 2010 excludes special dividend of $0.1834 per share paid in December 2010. 2014 excludes special dividend of $4.75 per share paid in December 2014.
(3) Peer group includes CBL, MAC, PEI, GGP, and SPG.
Source: Company SEC Filings, Taubman analysis
33Significant Shareholder Value
Best Performing REITs Over the Last 20 Years
Top 10 REITs
20 Year Total Return
(as of December 31, 2017)
Compounded
Ticker Total Return
Annual Return
Equity Lifestyle Properties ELS 1,951% 16.3%
Essex Property Trust ESS 1,498% 14.9%
Realty Income Corporation O 1,436% 14.6%
EPR Properties EPR 1,415% 14.6%
Public Storage PSA 1,341% 14.3%
Taubman Centers TCO 1,277% 14.0%
Universal Health UHT 1,253% 13.9%
Simon Property Group SPG 1,234% 13.8%
Federal Realty Trust FRT 1,197% 13.7%
Monmouth Real Estate
MNR 1,128% 13.4%
Investment Corporation
Source: KeyBanc Capital Markets, “The Leaderboard” as of December 31, 2017, Taubman analysis 34Significant Shareholder Value
Our Points of Difference
As of year-end 2017, we had grown
Market Capitalization since 1992 IPO
our total market capitalization from
Total Market
Capitalization
$2.2 billion at our IPO to $10.7
12,000
billion, while owning relatively the
10,000 same number of assets and issuing
8,000 Equity Market only $50 million of common equity
Capitalization
6,000 on a net basis
4,000 Our equity market cap of $1.3 billion
2,000 at IPO in 1992 has grown to $5.6
billion as of year-end 2017,
0
1992 1997 2002 2007 2012 2017 representing an increase of 4.3x
Our portfolio is large enough to
Intensively Managed Portfolio provide important economies of
Number of centers owned at IPO (1992) 19
scale and solidify our relationships
Centers developed 20 with the world’s best retailers
Centers acquired 11
Yet not so large that we cannot
Centers sold/exchanged (27)
maximize the potential of every
Number of centers owned today 23
property
Number of centers leased/managed today 3
Total 26 Since 2008 we have developed,
renovated, or expanded over 80% of
our assets
35We Have the Industry's Premier Portfolio
With Five Key Success Factors Drive Productivity
We Strategically Enhance Our Portfolio through:
U.S. Development, Taubman Asia, Redevelopment,
Acquisitions & Dispositions
While Emphasizing a Strong Balance Sheet
To Create Significant Shareholder Value
36Appendix
Redevelopments – Beverly Center –
Financial Review
Net Operating Income (NOI) Comparison - ProForma
Full Renovation
Net Operating Income (NOI)
Scenario
2015 NOI
Base Case,
Return of 3 to 4 percent at
stabilization in 2020
Non-Renovation
Scenario
2015 2016 2017 2018 2019 2020 2021 2022 2023 2024 2025
Unlevered IRR (10-year): In
excess of 10 percent
Assumptions
◼ Stabilized returns (see above)
Projected returns are calculated using the cash flow differential between two scenarios; a full renovation and a non-renovation scenario.
◼ Internal Rate of Return (see above)
10-year, unlevered IRR in 2015 based on an exit cap rate that is 100-150 basis points better under the full renovation scenario compared to the
non-renovation scenario.
◼ Other
Net Asset Value: Renovation will create $50 to $100 million of incremental net asset value in 2025.
Sales: Projection assumes Beverly Center only recaptures its lost market share and then increases at a market growth rate (upside possible). 38Appendix
Our Portfolio
Beverly Center Los Angeles, Calif. Click for
Center
Anchors: Bloomingdale’s, Macy’s GLA: 793,000 sq. ft. Fact Sheet
Ownership: 100%
Cherry Creek Shopping Center Denver, Colo. Click for
Center
Anchors: Macy’s, Neiman Marcus, Nordstrom GLA: 1,025,000 sq. ft. Fact Sheet
Ownership: 50%
CityOn.Xi’an Xi’an, China Click for
Center
Anchors: Wangfujing Department Store GLA: 996,000 sq. ft. Fact Sheet
Ownership: 50%
CityOn.Zhengzhou Zhengzhou, China Click for
Center
Anchors: G-Super, Wangfujing Department Store GLA: 917,000 sq. ft. Fact Sheet
Ownership: 49%
City Creek Center Salt Lake City, Utah Click for
Center
Anchors: Macy’s, Nordstrom GLA: 622,000 sq. ft. Fact Sheet
Ownership: 100%
39Appendix
Our Portfolio
Country Club Plaza Kansas City, Mo.
Click for
Mixed-Use Retail and Office GLA Retail: 781,000 sq. ft. Center
GLA Office: 220,000 sq. ft. Fact Sheet
Ownership: 50%
Dolphin Mall Miami, Fla.
Click for
Anchors: Neiman Marcus-Last Call, Saks Off 5th, Bass Pro Shops GLA: 1,429,000 sq. ft. Center
Outdoor World, Dave & Buster’s, Burlington, Marshall’s, Cobb Ownership: 100% Fact Sheet
Theatres, Bloomingdale’s Outlet, Polo Ralph Lauren Factory Store
Fair Oaks Fairfax, Va. Click for
Center
Anchors: Macy’s (two locations), JCPenney, Lord & Taylor, Sears GLA: 1,559,000 sq. ft. Fact Sheet
Ownership: 50%
The Gardens on El Paseo Palm Desert, Calif. Click for
Center
Anchors: Saks Fifth Avenue GLA: 236,000 sq. ft. Fact Sheet
Ownership: 100%
Great Lakes Crossing Outlets Auburn Hills, Mich.
Click for
Anchors: Bass Pro Shops Outdoor World, AMC Theatres, Saks Off GLA: 1,355,000 sq. ft. Center
5th, Lord & Taylor Outlet, Burlington Coat Factory, Round 1 Bowling Ownership: 100% Fact Sheet
and Amusement, Legoland, Sea Life
40Appendix
Our Portfolio
The Mall at Green Hills Nashville, Tenn. Click for
Center
Anchors: Nordstrom, Macy’s, Dillard’s GLA: 851,000 sq. ft. Fact Sheet
Ownership: 100%
International Market Place Waikiki, Honolulu, Hawaii Click for
Center
Anchors: Saks Fifth Avenue GLA: 343,000 sq. ft. Fact Sheet
Ownership: 93.5%
International Plaza Tampa, Fla. Click for
Center
Anchors: Neiman Marcus, Nordstrom, Dillard’s, Life Time Athletic GLA: 1,253,000 sq. ft. Fact Sheet
Ownership: 50%
The Mall at Millenia Orlando, Fla. Click for
Center
Anchors: Neiman Marcus, Bloomingdale’s, Macy’s GLA: 1,122,000 sq. ft. Fact Sheet
Ownership: 50%
The Mall of San Juan San Juan, Puerto Rico Click for
Center
Anchors: Saks Fifth Avenue, Nordstrom GLA: 626,000 sq. ft. Fact Sheet
Ownership: 95%
41Appendix
Our Portfolio
The Mall at Short Hills Short Hills, N.J. Click for
Center
Anchors: Neiman Marcus, Nordstrom, Bloomingdale’s, Macy’s GLA: 1,453,000 sq. ft. Fact Sheet
Ownership: 100%
Stamford Town Center Stamford, Conn. Click for
Center
Anchors: Macy’s, Saks Off 5th GLA: 761,000 sq. ft. Fact Sheet
Ownership: 50%
Starfield Hanam Hanam, South Korea Click for
Center
Anchors: Shinsegae Department Store, PK Market, Traders GLA: 1,701,000 sq. ft. Fact Sheet
Ownership: 34.3%
Sunvalley Concord, Calif. Click for
Center
Anchors: JCPenney, Macy’s (two locations), Sears GLA: 1,320,000 sq. ft. Fact Sheet
Ownership: 50%
Twelve Oaks Mall Novi, Mich. Click for
Center
Anchors: Nordstrom, Macy’s, Lord & Taylor, JCPenney, Sears GLA: 1,518,000 sq. ft. Fact Sheet
Ownership: 100%
42Appendix
Our Portfolio
The Mall at University Town Center Sarasota, Fla. Click for
Center
Anchors: Saks Fifth Avenue, Dillard’s, Macy’s GLA: 861,000 sq. ft. Fact Sheet
Ownership: 50%
Waterside Shops Naples, Fla. Click for
Center
Anchors: Saks Fifth Avenue, Nordstrom GLA: 341,000 sq. ft. Fact Sheet
Ownership: 50%
Westfarms West Hartford, Conn. Click for
Center
Anchors: Nordstrom, Macy’s (two locations), Lord & GLA: 1,271,000 sq. ft. Fact Sheet
Taylor, JCPenney Ownership: 79%
Development Property
Starfield Anseong Anseong, South Korea
Anchors: Shinsegae Factory Store, E-Mart Trader’s, PK Market, GLA: 1,100,000 sq. ft.
ElectroMart, Eatopia, Sport’s Monster, Aquafield, Toy Kingdom and Ownership: Expected 24.5%,
an upscale cinema Currently 49%
43Appendix
Trading Information
The Company's common stock and two issuances of preferred stock are traded on the New York Stock Exchange.
Symbol
Common Stock TCO
Series J Cumulative Redeemable Preferred Stock TCO PR J
Series K Cumulative Redeemable Preferred Stock TCO PR K
Market Quotation per Common Share
Common Stock Dividends
Quarters-Ended High Low Declared and Paid
March 31, 2018 66.39 54.97 0.655
June 30, 2018 60.81 51.87 0.655
March 31, 2017 76.17 64.08 0.625
June 30, 2017 66.64 57.77 0.625
September 30, 2017 61.90 49.14 0.625
December 31, 2017 65.71 46.30 0.625
44Appendix
Analyst Coverage
Company Analyst Email Address
Bank of America Securities-Merrill Lynch Craig Schmidt craig.schmidt@baml.com
BMO Capital Markets Jeremy Metz jeremy.metz@bmo.com
BTIG James Sullivan jsullivan@btig.com
Citigroup Global Markets, Inc. Christy McElroy christy.mcelroy@citi.com
Evercore ISI Steve Sakwa ssakwa@isigrp.com
Goldman Sachs & Co. Caitlin Burrows caitlin.burrows@gs.com
Green Street Advisors, Inc. Daniel Busch dbusch@greenstreetadvisors.com
Jefferies, LLC Omotayo Okusanya tokusanya@jefferies.com
J.P. Morgan Securities Michael Mueller michael.w.mueller@jpmorgan.com
Keybanc Capital Markets, Inc. Todd Thomas tthomas@key.com
Mizuho Securities USA Inc. Haendel St. Juste haendel.st.juste@us.mizuho-sc.com
Morgan Stanley Richard Hill Richard.Hill1@morganstanley.com
Raymond James Collin Mings collin.mings@raymondjames.com
Sandler O'Neill & Partners, L.P. Alexander Goldfarb agoldfarb@sandleroneill.com
Taubman Centers, Inc. is followed by the analysts listed above. The Company believes the list to be complete, but can provide no assurances.
Please note that any opinions, estimates, or forecasts regarding the Company's performance made by these analysts are independent of the Company and do not represent
opinions, forecasts, or predictions of its management. The Company does not, by its reference above or distribution, imply its endorsement of or concurrence with such
information, conclusions, or recommendations.
45Appendix
2018 Guidance
Summary of Key Guidance Measures
2017 Actual 2018 Guidance(1),(4)
Earnings Per Share $0.91 $1.11 - $1.26
Adjusted FFO per share $3.70 $3.74 - $3.84
NOI Growth – Comparable Centers, at 100% 1.7%(2) 3% - 4%
0.7%(3)
Ending occupancy, including temporary tenants (comp centers) 95.7% Around 95.0%
Domestic and non-U.S. general and administrative expense, $10 million (avg.) $9 -$10 million
quarterly run rate
Lease cancellation income, our share $12.1 million About $16 million
Interest Expense, 100% (Combined) $238.9 million $265 - $268 million
Interest Expense, at our share (Combined) $163.9 million $189 - $192 million
(1) Guidance is current as of July 30, 2018, see Taubman Centers, Inc. Issues Solid Second Quarter Results.
(2) Represents NOI growth including lease cancellation income for the comparable centers that were owned and open, excluding centers impacted by significant
redevelopment activity, during the entire two year period ending December 31, 2017. In addition, The Mall of San Juan has been excluded from “comparable center”
statistics as a result of Hurricane Maria and the expectation that the center’s performance will be impacted for the foreseeable future.
(3) Represents NOI growth excluding lease cancellation income for the comparable centers that were owned and open, excluding centers impacted by significant
redevelopment activity, during the entire two year period ending December 31, 2017. In addition, The Mall of San Juan has been excluded from “comparable center”
statistics as a result of Hurricane Maria and the expectation that the center’s performance will be impacted for the foreseeable future.
(4) See slides 47, 48 and 49 regarding reconciliations to the most comparable GAAP measures.
46Appendix
Reconciliation of Net Income Attributable to Common
Shareowners to Funds from Operations1
Year Ended Range for Year Ended
December 31, 2017 December 31, 2018(2)
Adjusted Funds from Operations per common share 3.70 3.74 3.84
Crystals lump sum payment for termination of leasing
agreement
Restructuring charge (0.16)
Costs associated with shareowner activism(3) (0.17) (0.10) (0.10)
Gain on SPG common stock conversion, net of tax 0.13
Fluctuation in fair value of SPG common shares
(0.00) (0.01) (0.01)
investment(3)
Funds from Operations per common share 3.51 3.63 3.73
Gain on disposition, net of tax 0.02
Depreciation – TRG (2.50) (2.37) (2.33)
Distributions to participating securities of TRG (0.01) (0.03) (0.03)
Depreciation of TCO's additional basis in TRG (0.11) (0.11) (0.11)
Net income attributable to common shareowners,
per common share (EPS) 0.91 1.11 1.26
(1) All dollar amounts per common share on a diluted basis; amounts may not add due to rounding.
(2) Guidance is current as of July 30, 2018, see “Taubman Centers, Inc. Issues Solid Second Quarter Results.”
(3) Amount represents actual amounts recognized through the second quarter of 2018. Amount does not include future assumptions of amounts to be
incurred during 2018. In connection with the adoption of Accounting Standards Update No. 2016-01 on January 1, 2018, the Company now measures
its investment in SPG common shares at fair value with changes in value recorded through net income.
47Appendix
Reconciliation of Net Income to Net Operating Income(1)
(1) The Company uses Net Operating Income (NOI) as an alternative measure to evaluate the operating performance of centers, both on individual and stabilized portfolio bases. The Company defines NOI as property-level
operating revenues (includes rental income excluding straightline adjustments of minimum rent) less maintenance, taxes, utilities, promotion, ground rent (including straightline adjustments), and other property operating
expenses. Since NOI excludes general and administrative expenses, pre-development charges, interest income and expense, depreciation and amortization, impairment charges, restructuring charges, and gains from land and
property dispositions, it provides a performance measure that, when compared period over period, reflects the revenues and expenses most directly associated with owning and operating rental properties, as well as the impact
on their operations from trends in tenant sales, occupancy and rental rates, and operating costs.
48Appendix
Reconciliation of Net Income to FFO and
Adjusted FFO per Share(1)
(1) Refer to the Form 10-K for a definition of
FFO and the company’s uses of these
measures. The company presents adjusted
versions of FFO when used by management
to evaluate operating performance when
certain significant items have impacted results
that affect comparability with prior or future
periods due to the nature or amounts of these
items. The company believes the disclosure of
the adjusted items is similarly useful to
investors and others to understand
management’s view on comparability of such
(1) Refer to the Form 10-K for a definition of FFO and the company’s uses of these
measures between periods.
measures. The company presents adjusted versions of FFO when used by
management to evaluate operating performance when certain significant items have
impacted results that affect comparability with prior or future periods due to the nature
or amounts of these items. The company believes the disclosure of the adjusted items
is similarly useful to investors and others to understand management’s view on
comparability of such measures between periods.
49Appendix
Forward-Looking Language and Non-GAAP Measures
For ease of use, references in this document to “Taubman Centers,” “company,” “Taubman” or an operating platform mean Taubman Centers,
Inc. and/or one or more of a number of separate, affiliated entities. Business is actually conducted by an affiliated entity rather than Taubman
Centers, Inc. itself or the named operating platform.
This document may contain forward-looking statements within the meaning of Section 27A of the Securities Act of 1933, as amended, and
Section 21E of the Securities Exchange Act of 1934, as amended. These statements reflect management's current views with respect to future
events and financial performance. Forward-looking statements can be identified by words such as “will”, “may”, “could”, “expect”, “anticipate”,
“believes”, “intends”, “should”, “plans”, “estimates”, “approximate”, “guidance” and similar expressions in this press release that predict or indicate
future events and trends and that do not report historical matters. The forward-looking statements included in this release are made as of the date
hereof or the date otherwise specified herein. Except as required by law, the company assumes no obligation to update these forward-looking
statements, even if new information becomes available in the future. Actual results may differ materially from those expected because of various
risks, uncertainties and other factors.
Such factors include, but are not limited to: changes in market rental rates; unscheduled closings or bankruptcies of tenants; relationships with
anchor tenants; trends in the retail industry; challenges with department stores; changes in consumer shopping behavior; the liquidity of real
estate investments; the company’s ability to comply with debt covenants; the availability and terms of financings; changes in market rates of
interest and foreign exchange rates for foreign currencies; changes in value of investments in foreign entities; the ability to hedge interest rate
and currency risk; risks related to acquiring, developing, expanding, leasing and managing properties; competitors gaining economies of scale
through M&A and consolidation activity; changes in value of investments in foreign entities; risks related to joint venture properties; insurance
costs and coverage; security breaches that could impact the company’s information technology, infrastructure or personal data; costs associated
with response to technology breaches; the loss of key management personnel; shareholder activism costs and related diversion of management
time; labor discord, war, terrorism; maintaining the company’s status as a real estate investment trust; changes in the laws of states, localities,
and foreign jurisdictions that may increase taxes on the company’s operations; changes in global, national, regional and/or local economic and
geopolitical climates; changes in and/or difficulties in operating in foreign political environments; difficulties in operating with foreign vendors and
joint venture and business partners; and difficulties of complying with a wide variety of foreign laws including laws affecting funding and use of
cash, corporate governance, property ownership restrictions, development activities, operations, anti-corruption, taxes, and litigation; changes in
and/or requirements of complying with applicable laws and regulations in the U.S. that affect foreign operations, including the U.S. Foreign
Corrupt Practices Act; differing lending practices, including lower loan-to-value ratios and increased difficulty in obtaining construction loans or
timing thereof; lower initial investment returns than those generally experienced in the U.S.; and differences in cultures including adapting
practices and strategies that have been successful in the U.S. mall business to retail needs and expectations in new markets. You should review
the company's filings with the Securities and Exchange Commission, including “Risk Factors” in its most recent Annual Report on Form 10-K and
subsequent quarterly reports, for a discussion of such risks and uncertainties.
50You can also read