Canaccord Genuity Group Inc - Investor Presentation FEBRUARY 2021
←
→
Page content transcription
If your browser does not render page correctly, please read the page content below

Canaccord Genuity Group Inc.
Investor Presentation
FEBRUARY 2021

Forward looking statements and non-IFRS measures
This document may contain ‘‘forward-looking statements’’ (as defined under applicable securities laws). These statements relate to future events or future performance and reflect management’s expectations, beliefs, plans,
estimates, intentions and similar statements concerning anticipated future events, results, circumstances, performance or expectations that are not historical facts, including business and economic conditions and
Canaccord Genuity Group’s growth, results of operations, performance and business prospects and opportunities. Such forward-looking statements reflect management’s current beliefs and are based on information
currently available to management. In some cases, forward-looking statements can be identified by terminology such as ‘‘may’’, ‘‘will’’, ‘‘should’’, ‘‘expect’’, ‘‘plan’’, ‘‘anticipate’’, ‘‘believe’’, ‘‘estimate’’, ‘‘predict’’, ‘‘potential’’,
‘‘continue’’, ‘‘target’’, ‘‘intend’’, ‘‘could’’ or the negative of these terms or other comparable terminology. Disclosure identified as an ‘‘Outlook’’ contains forward looking information. By their very nature, forward-looking
statements involve inherent risks and uncertainties, both general and specific, and a number of factors could cause actual events or results to differ materially from the results discussed in the forward-looking statements. In
evaluating these statements, readers should specifically consider various factors that may cause actual results to differ materially from any forward-looking statement. These factors include, but are not limited to, market and
general economic conditions, the nature of the financial services industry and the risks and uncertainties discussed from time to time in the Company’s interim condensed and annual consolidated financial statements and its
annual report and Annual Information Form (AIF) filed on www.sedar.com as well as the factors discussed in the sections entitled ‘‘Risk Management’’ in the Company’s MD&A and ‘‘Risk Factors’’ in the AIF, which include
market, liquidity, credit, operational, legal, cyber and regulatory risks. Material factors or assumptions that were used by the Company to develop the forward-looking information contained in this document include, but are
not limited to, those set out in the Fiscal 2021 Outlook section in the annual MD&A and those discussed from time to time in the Company’s interim condensed and annual consolidated financial statements and its annual
report and AIF filed on www.sedar.com. The preceding list is not exhaustive of all possible risk factors that may influence actual results. Readers are also cautioned that the preceding list of material factors or assumptions is
not exhaustive.

Although the forward-looking information contained in this document is based upon what management believes are reasonable assumptions, there can be no assurance that actual results will be consistent with these
forward-looking statements. The forward-looking statements contained in this document are made as of the date of this document and should not be relied upon as representing the Company’s views as of any date
subsequent to the date of this document. Certain statements included in this document may be considered ‘‘financial outlook’’ for purposes of applicable Canadian securities laws, and such financial outlook may not be
appropriate for purposes other than this document. Except as may be required by applicable law, the Company does not undertake, and specifically disclaims, any obligation to update or revise any forward-looking
information, whether as a result of new information, further developments or otherwise.

Certain non-IFRS measures are utilized by the Company as measures of financial performance. Non-IFRS measures do not have any standardized meaning prescribed by IFRS and are therefore unlikely to be comparable to
similar measures presented by other companies. Non-IFRS measures presented include assets under administration, assets under management, book value per diluted common share, return on common equity and figures
that exclude significant items. The Company’s capital is represented by common and preferred shareholders’ equity and, therefore, management uses return on common equity (ROE) as a performance measure. Also used
by the Company as a performance measure is book value per diluted common share, which is calculated as total common shareholders’ equity adjusted for assumed proceeds from the exercise of options and warrants,
settlement of a promissory note issued as purchase consideration at the Company’s option and conversion of convertible debentures divided by the number of diluted common shares that would then be outstanding
including estimated amounts in respect of share issuance commitments including options, warrants, convertible debentures and a promissory note, as applicable, and adjusted for shares purchased under the normal course
issuer bid and not yet cancelled, and estimated forfeitures in respect of unvested share awards under share-based payment plans.

Assets under administration (AUA) and assets under management (AUM) are non-IFRS measures of client assets that are common to the wealth management business. AUA − Canada, AUM − Australia and AUM − UK &
Europe are the market value of client assets managed and administered by the Company from which the Company earns commissions and fees. This measure includes funds held in client accounts as well as the aggregate
market value of long and short security positions. AUM − Canada includes all assets managed on a discretionary basis under programs that are generally described as or known as the Complete Canaccord Investment
Counselling Program and the Complete Canaccord Private Investment Management Program. Services provided include the selection of investments and the provision of investment advice. The Company’s method of
calculating AUA − Canada, AUM − Canada, AUM − Australia and AUM − UK & Europe may differ from the methods used by other companies and therefore may not be comparable to other companies. Management uses these
measures to assess operational performance of the Canaccord Genuity Wealth Management business segment. AUM − Canada is also administered by the Company and is included in AUA − Canada.

Financial statement items that exclude significant items are non-IFRS measures. Refer to Non-IFRS measures in the MD&A and the reconciliation of net income as determined under IFRS to adjusted net income, which
excludes significant items, as described. Significant items for these purposes include restructuring costs, amortization of intangible assets acquired in connection with a business combination, impairment of goodwill and
other assets, acquisition-related expense items, which include costs recognized in relation to both prospective and completed acquisitions, gains or losses related to business disposals including recognition of realized
translation gains on the disposal of foreign operations, certain accounting charges related to the change in the Company’s long-term incentive plan (“LTIP” or the “Plan”) as recorded with effect on March 31, 2018, certain
incentive-based payments related to the acquisition of Hargreave Hale, loss related to the extinguishment of convertible debentures for accounting purposes, as well as certain expense items, typically included in
development costs, which are considered by management to reflect a singular charge of a non-operating nature. See the Selected Financial Information Excluding Significant Items table in the Company’s interim and annual
financial reports. Management believes that these non-IFRS measures allow for a better evaluation of the operating performance of the Company’s business and facilitate meaningful comparison of results in the current
period to those in prior periods and future periods. Figures that exclude significant items provide useful information by excluding certain items that may not be indicative of the Company’s core operating results. A limitation of
utilizing these figures that exclude significant items is that the IFRS accounting effects of these items do in fact reflect the underlying financial results of the Company’s business; thus, these effects should not be ignored in
evaluating and analyzing the Company’s financial results. Therefore, management believes that the Company’s IFRS measures of financial performance and the respective non-IFRS measures should be considered together.

For earnings per share, net income and other financial measures determined under IFRS, please refer to the Company’s financial statements, news releases, MD&A and other financial disclosures in the Investor Relations
section of the company website at www.cgf.com/investor-relations or at www.sedar.com.

The “Company” as referred to herein means Canaccord Genuity Group Inc. and its subsidiaries.

                                                                                                                                                                                                                                        Page 2
/ Driven to deliver superior client outcomes

     / Driven to strengthen employee engagement

   / Driven to become more profitable

/ Driven to increase shareholder value

                                                  Page 3
Covid-19 Response
Acted swiftly to protect our employees, clients and communities

                Preparedness                                       Early Response                                           Outlook

Business model is centred on stability              Rapidly transitioned >90% of employees to           Committed to our longer-term strategic priorities
• Limits reliance on any single industry or         secure, remote access environment                   • Grow wealth management and increase
   geography                                                                                              revenue from fee-based services
• Stable earnings foundation with increasing pre-                                                       • Increase contributions from higher margin
   tax net income contributions from global         All aspects of business fully operational with no     capital markets activities
   wealth management businesses                     technology interruptions                            • Strive to protect margins across market
                                                                                                          cycles
Modern infrastructure, trading and technology
platforms                                           Dedicated Covid-19 response teams in every          Cost discipline remains in focus
• Fully scalable and cloud based                    business and geography                              • Deferring certain discretionary expenses
• Flexibility to support increased volumes and                                                          • Reduced travel and promotion expenses offset
    regulatory changes                                                                                     higher trading costs
                                                    Implemented protective health and safety
Disciplined risk management framework               measures at all office locations                    Well positioned to capture market share in difficult
• Globally coordinated business continuity plan                                                         environment
   designed for seamless connectivity and                                                               • Agile and able to move swiftly into new areas of
   compliance                                       Transparent and frequent town halls and                opportunity
• Regular testing of firmwide protocols, capacity   communications with employees                       • Scale and financial position protect capacity to
   and capabilities                                                                                        provide continuous service and support

Prudent capital management                          Enhanced digital capabilities to optimize remote    Unwavering focus on employee health and safety
• Strong balance sheet provides flexibility to      collaboration and workflow                          • Partnered with leading health and safety
   operate effectively in all market environments                                                         experts to provide a safe environment for
                                                    Client-centric solutions for due diligence, data      employees who choose to work from CG
Culture of partnership and accountability           rooms                                                 offices
• Management and employees are in complete
   alignment with shareholders

                                                                                                                                                        Page 4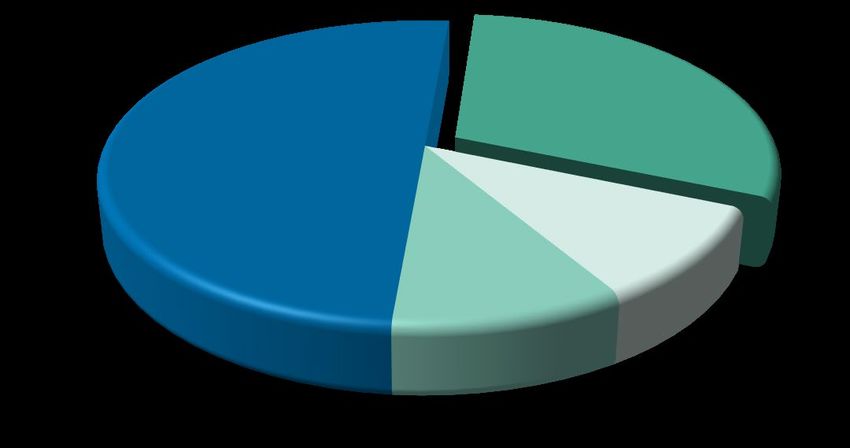
Covid-19 Business Impact
Identifying the clients who need us most and aggressively adding value for them
Remarkably strong new issue environment Trading and Specialty desks outperformed
• Innovative solutions to help small- and mid- • Record volumes with no technology
cap companies access public markets interruptions
• Balance sheet support to prepare for future • Supporting liquidity and managing risk for
challenges and opportunities clients in capital markets and wealth
management
Mining sector leadership Strengthened client engagement
• Capital raising and M&A • 35 virtual conferences 4,000+ attendees
• Global coordination between North • 800+ Corporate Access events 8,000+ client
America, Australia and UK meetings
• 12,000+ 1:1 meetings with corporates & CG
experts
M&A environment improving markedly Interest rate compression impacts Wealth
• Volatility impacted timing of completions in Management profitability and margins
calendar 2020 • Prolonged environment of low to negative
• Executed on a strong pipeline in fiscal interest rates impacts profitability
Q3/21 to record quarterly Advisory revenue associated with our margin lending and
of $72 million deposit activities
Our response in a crisis shapes our relationships for the future
Page 5
Financial Highlights
  Broad capabilities drive revenue and earnings stability through market cycles

                                                                                                                   Pre-tax Net                      Diluted
                                               Revenue
                                                                                                                    Income1,2                        EPS1

Q3 Fiscal 2021                               $533.1 M                                                            $110.6 M                          $0.62
  3 months ended
                                              +73.1% y/y                                                         +256.6% y/y                      +169.6% y/y
   December 31                                                                                                                                                  Earnings
                                                                                                                                                                growth is
                                                                                                                                                                outpacing
                                                                                                                                                                revenue
                                                                                                                                                                growth
YTD Fiscal 2021                                $1.3bn                                                            $202.9 M                          $1.16
   9 months ended
                                              +43.9% y/y                                                          +106.8% y/y                     +81.3% y/y
    December 31

 Fiscal 2020
  12 months ended                              $1.2 bn                                                           $123.1 M                          $0.81
      March 31

           1.   Excludes significant items (Non-IFRS and non-GAAP) . Refer to non-IFRS measures in the MD&A and on page 2 of this presentation.                  Page 6
           2.   Net income before non-controlling interests and preferred share dividends
Overview of Canaccord Genuity Group Inc.
    A leading independent financial services firm with a global presence

WEALTH MANAGEMENT                                                                                           CAPITAL MARKETS
                                                                        HOW WE
Comprehensive wealth management                                      DIFFERENTIATE                          Provides leading investment banking,
solutions to help individual investors,                                                                     equity research and sales and trading
private clients and charities achieve their                    Solid partnership culture committed to       services to corporations and institutions
financial goals                                                  delivering best-in-class ideas and
                                                                                                            ⁄   Canada
                                                              solutions for companies and investors in
/   Canada                                                                                                  ⁄   US
                                                                       the global mid-market
/   UK                                                                                                      ⁄   Australia & Asia
/   Jersey, Guernsey, Isle of Man                              Global platform provides opportunities       ⁄   UK and France
/   Australia                                                 to benefit from activity in all geographies   ⁄   Dubai
                                                                                                            ⁄   Latin America & Caribbean
                                                                 Successfully recruiting top industry
•   C$85.21 billion in client assets                              talent into strategic focus areas         Fiscal 2021 9M YTD
•   455 investment professionals                  globally1                                                     •    475 transactions / gross proceeds of
                                                                 Strong collaboration between our                    $54.6 billion2
•   2019 acquisition of Patersons Securities                     businesses is driving incremental          Fiscal 2020
    added 100+ advisers and expands                                   revenue opportunities                     •    373 transactions / gross proceeds of
    national footprint in Australia                                                                                  $51.7 billion 2
                                                                                                            Talent
•   Fully independent platform                                                                                  •    190+ investment bankers
                                                                                                                •    130+ research analysts
                                                                                                                •    200+ sales and trading
                                                                                                                •    M&A expertise free from conflict

                1. At December 31, 2020
                                                                                                                                                        Page 7
                2. Equity offerings over C$1.5 million
Positioned for long-term success
Building upon our strategy of long-term value creation
Diversify Restructure & Refocus Balance business mix Sustainable, profitable growth
2010 to 2014 2015 - 2016 2017 - 2018 2019 and beyond
• Expand global footprint • Align global business leaders • Significantly grow global wealth Redeploy capital across fewer
management businesses
• Broaden sector coverage • Exit underperforming
businesses • Increase contributions from Stabilize earnings growth across
• Limit exposure to any single recurring, fee-based revenue market cycles
geography or business line • Reduce fixed costs
• Invest in growing higher-margin Build upon areas of strength
• Focus core capabilities in areas businesses
that drive margin Drive wealth management
• Strengthen our competitive profitability and growth
advantage
Increase shareholder returns
Page 8
/ Creating shareholder value across our business
    Balanced business mix contiributed to a solid quarterly performance

Revenue - C$ millions                                                                                      Net Income1,2 - C$ millions
Fiscal years ended March 31                                                                                Fiscal years ended March 31
Q3 and nine months ended December 31                                                                       Q3 and nine months ended December 31

                                                                             $533                                                                                            $79

                                                                                                                                                                                             9M YTD
                                                                                           9M YTD                                                                                            $148.8 M
                                        $1,191            $1,224             $390         $1,301 bn
                       $1,023                                                                                                                    $107    $106                $37
       $880                                                                                                                         $82
                                                                                                                   $49
                                                                             $378                                                                                            $33

       2017             2018             2019              2020            9M 2021
                                                                                                                  2017             2018          2019    2020             9M 2021

Diluted EPS – adjusted1, C$                                                                                 Total client assets – C$, billions
Fiscal years ended March 31                                                                                 Fiscal years ended March 31
Q3 and nine months ended December 31                                                                        Q3 and nine months ended December 31

                                                                                                                                                                                $85.2
                                                                                                                                                                            $73.4
                                                                                                                                                           $72.8
                                                                                                                                                                         $68.9          Client assets
                                                                                                                                                                 $60.7                  increased
                                                                            $0.62                                                                                                       17% y/y at
                                                                                                                                                                                        December
                                                                                          9M YTD                                                                                        31, 2020
                                                                                           $1.16
                                         $0.80             $0.81            $0.28
                        $0.59
      $0.32                                                                 $0.25

       2017             2018             2019              2020            9M 2021                                 2017              2018         2019    2020                2021

        1.    Excludes significant items (Non-IFRS and non-GAAP) . Refer to non-IFRS measures in the MD&A and on page 2 of this presentation.                                                     Page 9
        2.    Net income before non-controlling interests and preferred share dividends
/ Strategic vision
 Build a dominant independent Wealth Management and Capital Markets business

                           •   Add scale through acquisitions and recruiting
                           •   Drive significant margin improvement and increase profitability
                           •   Continue to enhance the brand
                           •   Grow recurring revenues from fee-based services

                           •   Increase specialization in existing areas of strength
                           •   Diversify revenue streams to improve stability throughout cycles
                           •   Increase what we can do for our targeted client base
                           •   Use strength in North America to extend, align and defend our dominant position
                               across geographies

                           •   Improve capital efficiency
                           •   Foster disruptive technologies and products
                           •   Increase shareholder returns

                                                                                                                 Page 10
/ CG Wealth Management - Global
Fully independent investment planning and wealth management services and solutions
UK & Europe: London, Jersey,
Guernsey, Isle of Man, Blackpool,
Overview Lancaster, Llandudno, Norwich,
Nottingham, Southampton,
• Increased client assets to $85 billion from $33 billion in fiscal 2016 Worcester, York
• Proven organic growth and acquirer of complementary businesses
Australia: Melbourne, Perth,
• Successfully recruiting established investment professionals with Sydney, East Perth, Busselton,
Canada: Vancouver, Toronto,
lasting client relationships in all regions Calgary, Montreal, Edmonton,
Albany, Adelaide, Gold Coast,
Sunshine Coast
Halifax, Kelowna, Waterloo,
• Expanding footprint in UK, Canada and Australia Winnipeg
• Focused on organic growth and margin-improvement
Income before income taxes – adjusted1,2
Revenue1 C$ millions, fiscal years ended March 31
C$ millions, fiscal years ended March 31
$511
$462 $464 $90.3
$90 $80.2
$370 $75.4
$400
$267 $57.5
$60
$200 $29.5
$30
$0
$0
2017 2018 2019 2020 9M 2021 2017 2018 2019 2020 9M 2021
UK & Europe Canada Australia UK & Europe Canada Australia
1. Beginning in Q3/20, amounts include Australia wealth management Page 11
2. Excludes significant items (Non-IFRS and non-GAAP) . Refer to non-IFRS measures in the MD&A and on page 2 of this presentationCG Wealth Management: Client assets performing well
Recurring fee-based revenue provides stability through market cycles
CG Wealth Management - UK & Europe CG Wealth Management - North America
Q4/19 Q1/20 Q2/20 Q3/20 Q4/20 Q1/21 Q2/21 Q3/21 Q4/19 Q1/20 Q2/20 Q3/20 Q4/20 Q1/21 Q2/21 Q3/21
FTSE 100 AUM S&P/TSX Composite AUA
31- 31- 30- 30- 31- Y/Y Q/Q 31- 31- 30- 30- 31- Y/Y Q/Q
Dec - Mar- Jun- Sept- Dec- change change Dec- Mar- Jun- Sept- Dec- change change
2019 2020 2020 2020 2020 2019 2020 2020 2020 2020
UKWM £28.1 £22.7 £25.9 £26.4 £29.7 +5.7% +12.5% CGWM $21.0 $18.4 $22.2 $24.6 $29.3 +39.5% +18.8%
Client Client
Assets Assets
(£ billions) (C$ billions)
FTSE 100 7,542 5,672 6,170 5,866 6,461 -14.3% +10.1% S&P/TSX 17,063 13,379 15,515 16.121 14,433 +2.17% +8.1%
Composite
Page 12/ Global Wealth Management: Goals We have surpassed our
Mission 2022 objectives
At Dec 31, 2018 At December 31, 2020
$60 bn $80 bn
Client $85 bn
Assets1 Client Assets
Recruiting
End of fiscal quarter Acquisitions & Tuck-ins
Increase inflows and share of wallet
$254 M $600 M
$464 M
Revenue1 Revenue1
9M fiscal YTD Increase proportion fee-based contributions
Capture market share by adding value for clients
16% 20%
Pre-tax
profit
22% Pre-tax profit
margin1,2 margin1,2
Harness operational synergies
End of fiscal quarter Increase proprietary product offering
Exploit industry-wide compensation trends
Protect margins through market downturn
1. Beginning in Q3/20, amounts include Australia wealth management Page 13
2. Excludes significant items (Non-IFRS and non-GAAP) . Refer to non-IFRS measures in the MD&A and on page 2 of this presentation./ Wealth Management – UK & Europe
A Top-10 wealth manager in an industry where scale matters Client Assets
C$ and GBP£, billions
Focused on mass-affluent investors and intermediaries $51.8
Capable of delivering steady net income growth and stable profit margins $44.9 $46.4 $45.2 $45.6
$48.1
$45.4
$44.2 $44.2 $43.6
throughout market cycles $41.2 $39.9
Fee-based revenue ~74%; stronger contributions from recurring revenue
Expect increased economies of scale and operational leverage as synergies £26.9 £26.9 £27.4 £27.1 £28.1
£25.9 £26.4
£29.7
£24.8 £25.4
contribute to performance £23.8 £22.7
Excellent model for the growth we aim to achieve in other geographies
Greater scale is creating opportunities to add additional growth through
recruiting and small asset-based acquisitions
Silver Award for CSR/Charity Initiative of the Year from the Citywealth Brand
Management and Reputation Awards 2020
£570m (C$970M) investment1 from HPS Investment Partners establishes
premium valuation for this business and provides financial partner to support
further growth ambitions
Revenue Income (loss) before income taxes – Adjusted2
C$ millions C$ millions
$71.9 $71.3 $70.1
$66.4 $68.4 $68.0
$64.9 $65.8 $63.9 $64.3
$61.8 $63.5 $16.0 $16.0
$15.1
$14.0 $14.3 $14.1
$13.6
$13.0 $13.0
$11.4
$10.6
$9.8
1. Announced February 3, 2020. transaction expected to close in Q1 2022 and is subject to regulatory approval and other customary closing conditions. Approximate Canadian Dollar equivalent Page 14
based on current exchange rate.
2. Excludes significant items (Non-IFRS and non-GAAP) . Refer to non-IFRS measures in the MD&A and on page 2 of this presentation.
*Note: Quarterly periods indicated are for fiscal years ended March 31/ Significant transaction in UK Wealth Management Business
$210 M net proceeds to be used by the Company for corporate purposes to optimize shareholder value
Transaction details $1.7 bn
CF Total Enterprise Value
Convertible $130
• HPS Investment Partners, LLC to invest £122.5 million (C$217M)1,2 in Debentures4
Convertible Preferred Shares to be issued by Canaccord Genuity Preferred $205
Shares
Wealth Group (Jersey) Limited, which holds all of the Company’s Implied 100% Equity Value of
Wealth Management operations in the UK and Crown Dependencies CGWM UK of C$[994]m (£570m)
(“CGWM UK”)
Canaccord
• Convertible Preferred Shares carry a 7.5% cumulative annual dividend, Market
Genuity Group
Inc.
payable to HPS by CGWM UK over 5 years Capitalization4 $1,313
$776
CGWM
• On as as-converted basis the Convertible Preferred Shares represent UK
a 21.93% equity interest in CGWM UK
HPS
Investment
$217
Advantages for UK & Europe Wealth Management Advantages for CF Shareholders
• Investment does not change the existing management or operations • Investment directly into subsidiary is non-dilutive to CF shareholders
of our UK Wealth business
• Provides options and flexibility to deploy proceeds in ways that
• Provides an opportunity to build upon exceptional growth to date, and increase the long-term value of our business, and continue to optimize
increase the scale of this business over time value for shareholders
• Partnership with an investor whose primary focus is to invest in • Limiting the transaction to a 22% stake ensures that CGWM UK will
opportunities that provide creative capital solutions and generate remain a significant and stable contributor to firmwide earnings
attractive risk-adjusted returns
• HPS expects to continue to be a strategic and financial partner to the
business on future acquisitions and growth opportunities.
1. Approximate CAD equivalent based on exchange rate at time of announcement on February 3, 2020 Page 15
2. Transaction expected to close Q1 Fiscal 2022. Subject to regulatory approvals and other customary closing conditions.
3. Cumulative dividends are payable by CGWM UK on the Convertible Preferred Shares at the greater of an annual 7.5% coupon and the proportionate share that such shares would receive, on an as converted basis, in
respect of dividends paid to the Company by CGWM UK.
4. Based on closing price on February 3, 2020/ Wealth Management: UK & Europe
Successful track record of integrating new businesses
• Announced Q4 F2019; Closed May, 2019
• Wealth management, financial planning and select private client
investment management services
• Client portfolios valued at approximately £1 billion
• January 2019
• Expands Midlands presence and financial planning segment
• £170 million in client assets
• September 2017
Private Client • Transformational acquisition: CGWM (UK) becomes a Top 10 wealth
manager by assets in the UK
• Expands national UK footprint
• £3.8billion in private client assets at time of transaction
• More than 14,000 private clients, intermediaries, corporations and charities
• March 2017
• Acquired 100+ client portfolios from Isle of Man business
• Discretionary investment management and execution-only
• March 2017
• Acquired investment dealing and custody business
Asset Management •
•
September 2017
Over £4.0 billion in fund management assets at time of transaction
• Margin improvement through additional scale, synergies and product mix
Organic •
•
Adding talent to enhance key service offerings to growing client base
Modern, scalable platform supports continued growth
Page 16/ Wealth Management: Canada
A leading independent Canadian wealth management business
Client Assets
C$ billions
• Focused on mass affluent clients seeking wealth creation and wealth management
$29.3
• Scale, capabilities and economics provide competitive advantages in attracting
established IA teams $24.6
$22.2
• Recruited IA teams representing $13.5 billion in new client assets since calendar 2016 $19.7
$20.7 $21.2 $20.4 $21.0
$18.9 $18.3 $18.4
• Steadily increasing fee-based assets; Focused on opportunities to increase share of $15.6
wallet
• Strong collaboration with capital markets; differentiated by global thought leadership
and opportunities
• Important distribution channel for capital markets new issues
• State-of-the-art unified managed account (UMA) platform, powered by Envestnet
• Selected as platform provider for Morgan Stanley’s entry to Canadian Wealth
Management
Income before income taxes- adjusted1 Revenue
C$ millions C$ millions
$92.7
$20.1
$67.3
$57.8 $56.7 $57.0
$51.5 $52.2 $54.2 $53.6
$46.8 $49.0
$11.7 $46.0
$8.5 $8.9 $9.3
$7.7 $7.6
$6.6
$5.2 $5.2
$4.1
$2.7
1. Excludes significant items (Non-IFRS and non-GAAP) . Refer to non-IFRS measures in the MD&A and on page 2 of this presentation. Page 17
Note: Quarterly periods indicated are for fiscal years ended March 31/ Wealth Management: Canada
Recruiting environment increasingly favourable as banks increase limitations on IAs
Significant opportunity to grow market share of full-service
retail brokerage assets / Canada’s retail brokerage industry represents $4.4 tn1 in client
(C$, billions)
assets, with the full-service segment representing $1.3 tn1
/ As banks commoditize wealth services, we anticipate a shift of client
$974 assets toward non-bank advice-based platforms
$280
/ CG Wealth Management is advantageously positioned to capture a
meaningful share of this asset transfer and will continue adding
established IA teams as they seek new platforms to accommodate
the diverse needs of their clients
Canadian Banks Canadian Independents & Insurers
Average client assets per IA Team Illustrative revenue distribution on new client assets
As at March 31 each year CAGR Net
16.7%
contribution
30%
$13.5 bn
in client assets
added from
$203.3
recruiting
$133.4 $126.3 initiatives
$109.6
$93.8 from 2016 to
date Annual
amortization
2017 2018 2019 2020 9M 2021 of new hire
Advisor costs 10%
compensation Operating
2017 2018 2019 2020 9M 2021 costs 10%
50%
1. Source: Investor Economics, June 2018 Page 18/ Wealth Management: Australia
Increasing the scale of our wealth management business and Client Assets
C$ billions
expanding CG’s national footprint in Australia
$4.2
• Total client assets in comprehensive investment management platform $3.7
increased 13% y/y $4.2 billion at December 31, 2020
$3.4
$3.1
$2.4
• Completed acquisition of Patersons Securities Limited on October 21,
2019; Expands national footprint, which benefits both Capital Markets
$0.8 $0.8 $0.8 $0.9 $0.9
and Wealth Management businesses $0.8 $0.8
• Increasingly positive contributor of pre-tax net income since we
welcomed the Patersons team in 2019
• Adds powerful network for new issue distribution
• Opportunity to convert additional $15.2 billion held on Patersons’ trading Revenue1
platform to higher revenue-generating assets C$ millions
$17.6
• 100+ advisers in 9 locations across Australia
$14.3
$12.9 $13.0
• Excellent collaboration with our capital markets group as we increase $11.1
financing activities for small-cap companies in this region
• Focusing on growing client assets organically and pursuing targeted $1.3 $1.2 $1.2 $1.0 $1.0 $1.2
$0.8
recruiting opportunities
1. Australia wealth management revenue previously recorded as part of Canaccord Genuity Capital Markets Australia, commencing in Q3/20 it is disclosed as a separate operating Page 19
segment.
Note: Quarterly periods indicated are for fiscal years ended March 31/ Global Capital Markets: Goals
Moving toward delivering stability and sustainable profitability through market cycles
Income (loss) before income taxes - Adjusted1
C$ millions, fiscal quarters
$92.5
$42.9
$36.0 $34.4
$31.7
$24.9 $20.4
$13.2 $8.8 $16.0 $14.5
$10.7
Q4/18 Q1/19 Q2/19 Q3/19 Q4/19 Q1/20 Q2/20 Q3/20 Q4/20 Q1/21 Q2/21 Q3/21
North America International
• Leaders in facilitating a robust market for small- and mid-size
companies in emerging growth and value sectors • Australia: Become leading independent; emulate Canadian model
• Deeper focus in established mid-market areas of strength • UK & Europe: Eliminate earnings volatility
• Canada: Dominant independent on every measure • Asia & Middle East: Partnerships and expertise provide enhanced
• US: Increased contributions from higher-margin M&A services and cross-border capabilities in mid-market focus sectors
added depth in focus sectors
1. Excludes significant items (Non-IFRS and non-GAAP) . Refer to non-IFRS measures in the MD&A and on page 2 of this presentation. Page 20/ Canaccord Genuity in Canada
Dominant independent investment bank on every measure
Unparalleled origination and placement
A top-ranked Canadian equity underwriter1 and the only non-bulge firm in capability
the top 10
Calendar 2019 and 2020 ranked 1st for volume of transactions Canadian Equity Transactions1
Ranked 1st for IPOs2 Calendar 2019 and 2020 Calendar 2020: January 1 to December 31, 2020
Leading independent investment dealer for IPOs over 5+ fiscal years; Total
#
Top independent trader3, Acquisition of Jitneytrade (2018) proceeds
increased margin of leadership and adds futures & options capability 1 Canaccord Genuity Corp. 109 $2,850
Highly rated independent equity research, covering more stocks
2 BMO Capital Markets 52 $3,762
than other independents
Positioned for mining sector leadership, added complementary Latin 3 Cormark Securities 41 $778
America & Caribbean expertise in June 2020
4 Eight Capital 36 $427
Established success in alternative financing vehicles, such as SPACs,
which provide an attractive alternative for private companies looking to 5 Haywood Securities 33 $196
access public growth markets
6 Stifel Financial 32 $984
7 Scotiabank 27 $2,365
1st 1st 1st 7
8
Pacific International
Mackie Research
27
24
$229
$186
Canadian IPO Canadian equity deal Independent Canadian
proceeds volume Equity Trader 9 TD Securities 22 $2,536
C2019 and C2020 C2019 and C2020 2015 to 2020
1. Source: Bloomberg, transactions over $1.5 million, excludes converts, prefs, full credit league table.
Page 21
2. Source: Bloomberg
3. Block trades, April 2015 to December 2020/ Canaccord Genuity in the U.S.
A significant and growing contributor to our global success
Trading, Advisory, ECM and Corporate Access capabilities are
integral to CG’s global capital markets platform Strategic combination creates a top-tier
mid-market M&A franchise
• Aligned business focused in key sectors: Technology, Healthcare and
Industrials
• Strong track record of ECM activity in Healthcare and Technology sectors is U.S. Mid-market2 TMT M&A
driving complementary growth in Advisory segment Calendar 2020: January 1 to December 31, 2020
• Strong growth in Advisory revenue contributing to net income and profit # of
margin growth Transactions
• Outpacing the broader market in commission share gains for the first half of 1 Canaccord Genuity 39
calendar 2020; Gaining share in equities and growing revenue from specialist
2 Raymond James Financial 38
desks including international equities;
• Expanded coverage of Private Equity and Family Office advisory relationships 3 William Blair & Company 23
• Comprehensive equity research coverage of~300 stocks in focus sectors 4 Houlihan Lokey 19
5 Evercore Group 17
6 The Goldman Sachs Group 16
Strategic rationale for fiscal 2019 acquisition of Petsky Prunier
7 Robert W. Baird & Co 14
• Leverages fixed costs over a larger revenue base 8 Piper Sandler 10
• Increases contributions from higher margin M&A advisory segment;
typically counter-cyclical to new issue contributions 9 Moelis & Company 9
• Adds depth in core sectors of strength 9 Stifel Financial 9
• Creates a franchise with consistently higher profitability 9 DC Advisory 9
• Fee pool for U.S. mid-market Advisory in the Technology and
10 Cowen & Company 8
Healthcare sectors has grown steadily to US$1.6 bn1
10 Deutsche Bank 8
1. Numbers for CG Petsky Prunier represent total transactions in Technology, Media & Telecommunications as tracked by PitchBook completed for Petsky Prunier LLC which was acquired by
Canaccord Genuity Group Inc., in February 2019 Page 22
2. The table includes US-based M&A/Control Transactions, All Buyout Types, and Growth/Expansion transactions less than $500 million in the Technology, Media & Telecommunications
industries as classified by PitchBook./ Canaccord Genuity – Rest of the World
Global capabilities provide a significant competitive advantage in mid-market focus sectors
Strong emphasis on
Lean and focused Increasing global product Focused on increasing
cross-selling
platform placement M&A in our key markets
Increased trading flow
Specialization in core Expanding alternative Independent advice that is
across geographies;
verticals distribution avenues free from bias or conflict
improving regional
cross-desk flows
AUSTRALIA UK, EUROPE & DUBAI
Powerful mid-market competitor in the region Reduced exposure to regional volatility and improving alignment
• A leading investment bank in the region for small cap equities with global capabilities
• Quarterly revenue exceeded fiscal 2020 full-year revenue for 3 • Ranked #1 by Dealogic for AIM transaction volume in calendar
consecutive fiscal quarters in fiscal 2021 2019 and 20201
• 24 Corporate Broking client wins in 2020
• Diversified business covering core CG sectors with mining sector
leadership • Leveraging global resources and expertise to deliver differentiated
offering for clients
• Increased investment to 80% improves alignment with global
platform • Strong M&A Advisory expertise
• Well positioned for consolidation: operational and technology • Strengthened senior Corporate Broking, Sales, Research and
platform facilitating growth and cost efficiencies Advisory capabilities; Increasing client wins
• Fiscal 2020 acquisition of Patersons Securities Ltd adds powerful • Seamless transition to MiFID II; focused in key areas where we can
network for new issue distribution differentiate
• Expansion of wealth management business increases national • Operating at break-even level following restructuring initiatives
footprint
1. Source: Dealogic, secondary offerings > 3m in 2019 & 2020, excluding Healthcare sector Page 23/ Remain Agile
Independence allows us to adjust our business mix and stay competitive as client demands change
Capital markets revenue by region Capital markets revenue by activity
Q3 2021 Q3 2021 FOCUSED WHERE WE CAN BE
Commissions MOST RELEVANT TO OUR CLIENTS
Trading
and fees AND PROVIDE SUPERIOR REVENUE
United States Canada 15%
35% 15% OPPORTUNITIES
46%
Interest &
Agility allows us to harness leadership in
Other
emerging and high-growth sectors while
1% maintaining strong capability in historic
areas of strength
Investment
UK, Europe Advisory Banking
Australia and Dubai 20% 49% Disciplined sector focus allows us to
13% 6% provide globally integrated services in key
growth sectors of the global economy
Maintained significant investment in
Investment Banking and Advisory revenue by sector Agile business mix provides diverse revenue streams natural resource sector coverage
Q3 2021 throughout market cycles
Long term client partnerships fostered
Technology 33% through a track record of successful
Life Sciences1 28% outcomes for growth companies
F2017 Y/Y increase in F21 YTD
Metals & Mining 13% 88% Trading revenue
Transportation & Industrials 9% Advisory Debt Finance & Restructuring capabilities
provide strategic advice without conflict –
Diversified 4% never balance sheet driven
Energy 4%
Consumer & Retail 3% Globally aligned Sales, Trading and Equity
Y/Y increase in F21 YTD Research dedicated to coverage of small
3%
Sustainability
303% Investment Banking and mid-cap growth opportunities
Other 2% revenue
Financials 1%
Real Estate 1%
1. Includes revenue from cannabis-related issuers Page 24/ Stability
Creating a lower risk business model with growing contributions from wealth management
Revenue by business segment EPS contribution by business segment - Adjusted1,2
9M Fiscal 2021 YTD 9M Fiscal 2021 YTD
/ Stable wealth 60%
36%
management
foundation enhances
64% earnings stability 40%
throughout market
cycles
Wealth Management Capital Markets Wealth Management Capital Markets
Net income (loss) before income taxes - Adjusted1
C$ millions, fiscal years ended March 31
$226.4
$86.6 $80.4
$62.5 $80.2
$44.3 $46.4 $120.5
$16.4
$75.4 $59.8
$29.5 $57.5
$14.5 ($10.2)
$0.5
2014 2015 2016 2017 2018 2019 2020 2021 Annualized
CG Capital Markets CG Wealth Management
1. Excludes significant items (Non-IFRS and non-GAAP). Refer to non-IFRS measures in the MD&A and on page 2 of this presentation Page 25
2. Based on management estimates including certain assumptions made in respect of allocations of taxes, non-direct costs and certain expenses./ (TSX:CF): An Excellent Investment Proposition
Committed to driving value for clients, employees and shareholders
Shares are attractively valued
Driving earnings power by transforming business mix and growing global wealth management
Creating a more predictable business with consistency of earnings
Strong balance sheet supports our capacity to invest in future growth
Management and employees are in complete alignment with shareholders
Enhanced dividends and share repurchases
Page 26/ Analyst Coverage
Echelon Wealth
Cormark Securities TD Securities Inc.
Jeff Fenwick Graham Ryding Partners
Rob Goff
Canaccord Genuity Group Inc. is followed by the analysts listed above. Please note that any opinions, estimates or forecasts
regarding Canaccord Genuity's performance made by these analysts are theirs alone and do not represent opinions, forecasts or
predictions of the Company or its management. Canaccord Genuity does not by its reference above or distribution imply its
endorsement of or concurrence with such information, conclusions or recommendations.
Page 27Financial highlights
Q3 Fiscal 2021
Page 28/ Fiscal third quarter 2021 results
Improved business mix contributing to earnings stability and growth
• Q3/21 record revenue of $533.1 million, up 73.1% year-over- • 32% of Q3/21 fiscal year-to-date adjusted earnings per share1
year contributed by global wealth management business
• Record quarterly Investment Banking revenue of $213.4 • Purchased 217,000 common shares for cancellation under the
million, an increase of 314.0% year-over-year on continued normal course issuer bid during the nine months ended
strength in mid-market life sciences, technology and mining December 31, 2020
sectors
• Third quarter dividend of $0.065 per common share; increased
• Excluding significant items1, Q3/21 pre-tax net income by 30% compared to Q2/20
increased by 256.6% year-over-year to $110.6 million
Y/Y
C$ millions (except per share data) Q3/21 Q3/20 Y/Y Change 9M 2021 9M 2020
Change
Revenue $533,077 $308,014 73.1% $1,301,162 $904,219 43.9%
1
Pre-tax net income $110,574 $31,010 256.6% $202,851 $98,112 106.8%
Preferred dividend $2,351 $2,351 0.0% $7,053 $7,053 0.0%
Net income available to common shareholders1 $75,160 $27,619 172.1% $137,207 $77,349 77.4%
Earnings per diluted common share1 $0.62 $0.23 169.6% $1.16 $0.64 81.3%
Compensation ratio 61.7% 60.6% 1.1 p.p. 64.0% 59.6% 4.4 p.p.
1
Non-compensation ratio 17.6% 29.3% (11.7)p.p. 20.4% 29.5% (9.1)p.p.
Pre-tax profit margin1 20.7% 10.1% 10.6 p.p. 15.6% 10.9% 4.7 p.p.
1
Effective tax rate 28.6% 1.8% 26.8 p.p. 26.7% 13.5% 13.2 p.p.
1. Excludes significant items (Non-IFRS and non-GAAP). Refer to non-IFRS measures in the MD&A and on page 2 of this presentation Page 29/ Global Capital Markets
Revenue by Activity Pre-tax net income1 and profit margin1
C$ millions, fiscal quarters
$100 30%
$350 $90
$80 25%
$300
$70
Pre-tax profit margin
20%
Pre-tax net income
$250
$60
C$ millions
$200 $50 15%
$150 $40
$30 10%
$100
$20 5%
$50
$10
$0 $0 0%
Commissions & Fees Investment Banking Advisory Trading Interest & Other Pre-tax net income Pre-tax profit margin
Sequential Y/Y Y/Y
Q3/21 Q2/21 Change Q3/20 Change 9M 2021 9M 2020 Change
Commissions & Fees $51,400 $49,118 4.6% $36,394 41.2% $149,915 $106,858 40.3%
Investment banking $171,869 $108,985 57.7% $42,619 303.3% $378,362 $154,898 144.3%
Advisory $70,731 $36,662 92.9% $60,578 16.8% $127,973 $156,059 -18.0%
Trading $50,843 $42,430 19.8% $27,104 87.6% $158,194 $73,447 115.4%
Interest $1,340 $1,766 -24.1% $6,563 -79.6% $4,674 $17,988 -74.0%
Other $2,692 $2,588 4.0% $916 193.9% $6,159 $3,640 69.2%
Total $ 3 4 8 ,8 7 5 $241,549 44.4% $174,174 100.3% $ 8 2 5 ,2 7 7 $512,890 60.9%
Compensation ratio 56.7% 59.0% (2.3) p.p. 59.4% (2.7) p.p. 58.8% 57.6% 1.2 p.p.
Non-comp ratio1 15.7% 21.3% (5.6) p.p. 29.1% (13.4) p.p. 19.0% 31.1% (12.1) p.p.
Pre-tax profit margin1 26.5% 17.8% 8.7 p.p. 9.2% 17.3 p.p. 20.6% 8.8% 11.8 p.p.
1. Excludes significant items (Non-IFRS and non-GAAP). Refer to non-IFRS measures in the MD&A and on page 2 of this presentation Page 30/ Global Wealth Management
Revenue by region1 Pre-tax net income2 and profit margin2
C$ millions
$40 25%
$180 $35
20%
$30
$150
Pre-tax profit margin
Pre-tax net income
$25 15%
C$ millions
$120
$20
$90 $15 10%
$60 $10
5%
$30 $5
$0 0%
$0
UK & Europe Canada Australia Pre-tax net income Pre-tax profit margin
Sequential Y/Y Y/Y
Q3/21 Q2/21 Change Q3/20 Change 9M 2021 9M 2020 Change
Revenue - Canada $92,741 $67,347 37.7% $46,019 101.5% $217,041 $152,833 42.0%
Revenue - UK & Europe $70,120 $64,308 9.0% $71,300 -1.7% $202,379 $209,599 -3.4%
Revenue - Australia $17,636 $14,322 23.1% $11,065 59.4% $44,992 $11,065 306.6%
Total $180,497 $145,977 23.6% $128,384 40.6% $464,412 $373,497 24.3%
Client Assets - Canada (C$ millions) $29,270 $24,648 18.8% $20,989 39.5% $29,270 $20,989 39.5%
Client Assets - UK & Europe (C$ millions) $51,762 $45,380 14.1% $48,110 7.6% $51,762 $48,110 7.6%
Client Assets - Australia (C$ millions) $4,174 $3,366 24.0% $3,691 13.1% $4,174 $3,691 13.1%
Compensation ratio 58.3% 58.2% 0.1 p.p. 56.0% 2.3 p.p. 58.4% 56.0% 2.4 p.p.
1
Non-comp. ratio 17.7% 20.5% (2.8) p.p. 27.5% (9.8) p.p. 19.4% 24.2% (4.8) p.p.
1
Pre-tax profit margin 21.7% 18.4% 3.3 p.p. 14.5% 7.2 p.p. 19.5% 17.0% 2.5 p.p.
1. Beginning in Q3 fiscal 2020, amounts include Australia wealth management Page 31
2. Excludes significant items (Non-IFRS and non-GAAP). Refer to non-IFRS measures in the MD&A and on page 2 of this presentation/ Expenses
Disciplined expense management as business activity increases
Compensation ratio1 Non-compensation ratio1
66.9%
64.2%
60.7% 61.5% 62.2% 61.7% 30.7% 31.2%
59.7% 59.1% 59.9% 60.6% 29.9%
58.7% 58.3% 9M fiscal 2021 28.6% 29.3%
27.6% 28.3%
compensation 27.1%
ratio reflects an 25.1%
increase in the fair 22.0% 22.8%
value of PSUs2
granted in prior 17.6%
periods.
Q/Q Y/Y
Q3 2020 Q4 2020 Q1 2021 Q2 2021 Q3 2021 F2019 F2020
Change Change
Compensation
$186.6 $199.0 $252.8 $250.8 $328.6 31.0% $716.6 $738.3 3.0%
expense
Non- compensation
$90.4 $95.7 $83.2 $89.0 $93.9 5.5% $338.4 $362.5 7.1%
expense1
Income (loss) before
$31.0 $24.9 $41.8 $50.5 $110.6 119.0% $135.6 $123.1 -9.2%
income taxes1
1. Excludes significant items (Non-IFRS and non-GAAP). Refer to non-IFRS measures in the MD&A and on page 2 of this presentation
2. The fair value of the PSUs is based upon progress against certain pre-determined three-year performance metrics, including share price relative to the market, as measured at the time of vesting. The PSUs are awarded
Page 32
annually and vest after three years and are paid in cash at the time of vesting in an amount calculated with reference to the share price at the time of vesting and, accordingly, the value will vary with share price as well as
progress against other performance metrics. Changes to the fair value of the PSUs as measured in future periods may increase or decrease from the fair value as recorded at September 30, 2020 and such changes will be
recorded through compensation expense. The number of PSUs that ultimately vest is adjusted for dividends paid during the vesting period and is a multiple of the number of PSUs that were originally granted. The multiple
will be in a range of 0x to 2x based upon performance against certain pre-determined metrics as measured at the time of vesting./ Solid Capital Position
Well capitalized for continued investment in key priorities
• Able to support increasing business activities and invest in opportunities to capture additional market share
• Strong, liquid balance sheet protects ability to compete efficiently
• Prepared for evolving regulatory environment and changing economic landscape during and post Covid-19
• Returned approximately $80.0 million of capital to CF common shareholders during fiscal 2020: Closed $40 million substantial issuer bid in
August, 2019. Purchased for cancellation 6.3% of the issued and outstanding common shares on a non-diluted basis as at July 3, 2019
• Purchased 217,100 common shares for cancellation under the normal course issuer bid during the nine months ended December 31,
2020
• 9M fiscal 2021 YTD quarterly common share dividend increased by 17% year-over-year to $0.175
Q2/21 Q3/21
C$ millions (except for per share amounts and numb er of shares) (As at September 30, 2020) (As at December 31, 2020) % Change
Working Capital1 $559.6 $584.3 4.4%
2
Working Capital per Common Share $5.19 $5.41 4.2%
Shareholders' Equity $935.7 $967.8 3.4%
Preferred Shares $205.6 $205.6 nil.
Common Shares - Issued & Outstanding 107,783,782 107,996,382 0.2%
1. The Company’s working capital, including cash and cash equivalents, is fully deployed by the Company in its operation to support regulatory capital levels required to maintain current Page 33
levels of activity. For more information, refer to the section titled Liquidity & Capital resources in the MD&A
2. Based on diluted shares outstandingYou can also read